PEARSON’S COMMITMENT TO DIVERSITY, EQUITY, AND INCLUSION
Pearson is dedicated to creating bias-free content that reflects the diversity of all learners. We embrace the many dimensions of diversity, including but not limited to race, ethnicity, gender, socioeconomic status, ability, age, sexual orientation, and religious or political beliefs.
Education is a powerful force for equity and change in our world. It has the potential to deliver opportunities that improve lives and enable economic mobility. As we work with authors to create content for every product and service, we acknowledge our responsibility to demonstrate inclusivity and incorporate diverse scholarship so that everyone can achieve their potential through learning. As the world’s leading learning company, we have a duty to help drive change and live up to our purpose to help more people create a better life for themselves and to create a better world.
Our ambition is to purposefully contribute to a world where:
• Everyone has an equitable and lifelong opportunity to succeed through learning.
• Our educational products and services are inclusive and represent the rich diversity of learners.
• Our educational content accurately reflects the histories and experiences of the learners we serve.
• Our educational content prompts deeper discussions with students and motivates them to expand their own learning (and worldview).
We are also committed to providing products that are fully accessible to all learners. As per Pearson’s guidelines for accessible educational Web media, we test and retest the capabilities of our products against the highest standards for every release, following the WCAG guidelines in developing new products for copyright year 2022 and beyond. You can learn more about Pearson’s commitment to accessibility at https://www.pearson.com/us/ accessibility.html.
While we work hard to present unbiased, fully accessible content, we want to hear from you about any concerns or needs with this Pearson product so that we can investigate and address them.
• Please contact us with concerns about any potential bias at https://www.pearson.com/ report-bias.html.
• For accessibility-related issues, such as using assistive technology with Pearson products, alternative text requests, or accessibility documentation, email the Pearson Disability Support team at disability.support@pearson.com.
This page is intentionally left blank
Preface 13
Data File Index 23
CHAPTER 1 Describing Data: Graphical 25
CHAPTER 2 Describing Data: Numerical 63
CHAPTER 3 Probability 97
CHAPTER 4 Discrete Random Variables and Probability Distributions 150
CHAPTER 5 Continuous Random Variables and Probability Distributions 201
CHAPTER 6 Sampling and Sampling Distributions 248
CHAPTER 7 Estimation: Single Population 288
CHAPTER 8 Estimation: Additional Topics 332
CHAPTER 9 Hypothesis Testing: Single Population 350
CHAPTER 10 Hypothesis Testing: Additional Topics 389
CHAPTER 11 Simple Regression 421
CHAPTER 12 Multiple Regression 477
CHAPTER 13 Additional Topics in Regression Analysis 555
CHAPTER 14 Analysis of Categorical Data 606
CHAPTER 15 Analysis of Variance 649
CHAPTER 16 Time-Series Analysis and Forecasting 688
CHAPTER 17 Additional Topics in Sampling 720 Appendix Tables 742 Index 787
This page is intentionally left blank
Preface 13
Data File Index 23
CHAPTER 1 Describing Data: Graphical 25
1.1 Decision Making in an Uncertain Environment 26
Random and Systematic Sampling 26
Sampling and Nonsampling Errors 28
1.2 Classification of Variables 29
Categorical and Numerical Variables 29
Measurement Levels 30
1.3 Graphs to Describe Categorical Variables 32
Tables and Charts 32
Cross Tables 33
Pie Charts 35
Pareto Diagrams 36
1.4 Graphs to Describe Time-Series Data 39
1.5 Graphs to Describe Numerical Variables 44
Frequency Distributions 44
Histograms and Ogives 48
Shape of a Distribution 48
Stem-and-Leaf Displays 50
Scatter Plots 51
1.6 Data Presentation Errors 55
Misleading Histograms 55 Misleading Time-Series Plots 57
CHAPTER 2 Describing Data: Numerical 63
2.1 Measures of Central Tendency and Location 63
Mean, Median, and Mode 64
Shape of a Distribution 66
Geometric Mean 67
Percentiles and Quartiles 68
2.2 Measures of Variability 72
Range and Interquartile Range 73
Box-and-Whisker Plots 73
Variance and Standard Deviation 75
Coefficient of Variation 79
Chebyshev’s Theorem and the Empirical Rule 79
z-Score 81
2.3 Weighted Mean and Measures of Grouped Data 84
2.4 Measures of Relationships Between Variables 88
Case Study: Mortgage Portfolio 95
CHAPTER 3 Probability 97
3.1 Random Experiment, Outcomes, and Events 98
3.2 Probability and Its Postulates 105 Classical Probability 105 Permutations and Combinations 106 Relative Frequency 110 Subjective Probability 111
3.3 Probability Rules 115 Conditional Probability 117 Statistical Independence 120
3.4 Bivariate Probabilities 126 Odds 130
Overinvolvement Ratios 130
3.5 Bayes’ Theorem 136
Subjective Probabilities in Management Decision Making 142
CHAPTER 4 Discrete Random Variables and Probability Distributions 150
4.1 Random Variables 151
4.2 Probability Distributions for Discrete Random Variables 152
4.3 Properties of Discrete Random Variables 156
Expected Value of a Discrete Random Variable 156
Variance of a Discrete Random Variable 157
Mean and Variance of Linear Functions of a Random Variable 159
4.4 Binomial Distribution 163
Developing the Binomial Distribution 164
4.5 Poisson Distribution 171
Poisson Approximation to the Binomial Distribution 175
Comparison of the Poisson and Binomial Distributions 176
4.6 Hypergeometric Distribution 177
4.7 Jointly Distributed Discrete Random Variables 180
Conditional Mean and Variance 184
Computer Applications 184
Linear Functions of Random Variables 184 Covariance 185
Correlation 186
Portfolio Analysis 190
CHAPTER 5 Continuous Random Variables and Probability Distributions 201
5.1 Continuous Random Variables 202 The Uniform Distribution 205
5.2 Expectations for Continuous Random Variables 207
5.3 The Normal Distribution 210 Normal Probability Plots 219
5.4 Normal Distribution Approximation for Binomial Distribution 223 Proportion Random Variable 227
5.5 The Exponential Distribution 229
5.6 Jointly Distributed Continuous Random Variables 232
Linear Combinations of Random Variables 236
Financial Investment Portfolios 236 Cautions Concerning Finance Models 240
CHAPTER 6 Sampling and Sampling Distributions 248
6.1 Sampling from a Population 249 Development of a Sampling Distribution 250
6.2 Sampling Distributions of Sample Means 253
Central Limit Theorem 258
Monte Carlo Simulations: Central Limit Theorem 258
Acceptance Intervals 264
6.3 Sampling Distributions of Sample Proportions 269
6.4 Sampling Distributions of Sample Variances 274
CHAPTER 7 Estimation: Single Population 288
7.1 Properties of Point Estimators 289 Unbiased 290 Most Efficient 291
7.2 Confidence Interval Estimation for the Mean of a Normal Distribution: Population Variance Known 295 Intervals Based on the Normal Distribution 296 Reducing Margin of Error 299
7.3 Confidence Interval Estimation for the Mean of a Normal Distribution: Population Variance Unknown 301 Student’s t Distribution 301 Intervals Based on the Student’s t Distribution 303
7.4 Confidence Interval Estimation for Population Proportion (Large Samples) 307
7.5 Confidence Interval Estimation for the Variance of a Normal Distribution 310
7.6 Confidence Interval Estimation: Finite Populations 313
Population Mean and Population Total 313
Population Proportion 316
7.7 Sample-Size Determination: Large Populations 319 Mean of a Normally Distributed Population, Known Population Variance 319
Population Proportion 321
7.8 Sample-Size Determination: Finite Populations 323
Sample Sizes for Simple Random Sampling: Estimation of the Population Mean or Total 324
Sample Sizes for Simple Random Sampling: Estimation of Population Proportion 325
CHAPTER 8 Estimation: Additional Topics 332
8.1 Confidence Interval Estimation of the Difference Between Two Normal Population Means: Dependent Samples 333
8.2 Confidence Interval Estimation of the Difference Between Two Normal Population Means: Independent Samples 337
Two Means, Independent Samples, and Known Population Variances 337 Two Means, Independent Samples, and Unknown Population Variances Assumed to Be Equal 339
Two Means, Independent Samples, and Unknown Population Variances Not Assumed to Be Equal 341
8.3 Confidence Interval Estimation of the Difference Between Two Population Proportions (Large Samples) 344
CHAPTER 9 Hypothesis Testing: Single Population 350
9.1 Concepts of Hypothesis Testing 351
9.2 Tests of the Mean of a Normal Distribution: Population Variance Known 356 p-Value 358 Two-Sided Alternative Hypothesis 364
9.3 Tests of the Mean of a Normal Distribution: Population Variance Unknown 366
9.4 Tests of the Population Proportion (Large Samples) 370
9.5 Assessing the Power of a Test 372 Tests of the Mean of a Normal Distribution: Population Variance Known 373 Power of Population Proportion Tests (Large Samples) 375
9.6 Tests of the Variance of a Normal Distribution 379
CHAPTER 10 Hypothesis Testing: Additional Topics 389
10.1 Tests of the Difference Between Two Normal Population Means: Dependent Samples 391 Two Means, Matched Pairs 391
10.2 Tests of the Difference Between Two Normal Population Means: Independent Samples 395
Two Means, Independent Samples, Known Population Variances 395 Two Means, Independent Samples, Unknown Population Variances Assumed to Be Equal 397 Two Means, Independent Samples, Unknown Population Variances Not Assumed to Be Equal 400
10.3 Tests of the Difference Between Two Population Proportions (Large Samples) 403
10.4 Tests of the Equality of the Variances Between Two Normally Distributed Populations 407
10.5 Some Comments on Hypothesis Testing 410
CHAPTER 11 Simple Regression 421
11.1 Overview of Linear Models 422
11.2 Linear Regression Model 425
11.3 Least Squares Coefficient Estimators 431 Computer Computation of Regression Coefficients 433
11.4 The Explanatory Power of a Linear Regression Equation 435 Coefficient of Determination, R2 437
11.5 Statistical Inference: Hypothesis Tests and Confidence Intervals 442 Hypothesis Test for Population Slope Coefficient Using the F Distribution 447
11.6 Prediction 450
11.7 Correlation Analysis 456
Hypothesis Test for Correlation 456
11.8 Beta Measure of Financial Risk 460
11.9 Graphical Analysis 462
CHAPTER 12 Multiple Regression 477
12.1 The Multiple Regression Model 478
Model Specification 478
Model Objectives 480 Model Development 481 Three-Dimensional Graphing 484
12.2 Estimation of Coefficients 485 Least Squares Procedure 486
12.3 Explanatory Power of a Multiple Regression Equation 492
12.4 Confidence Intervals and Hypothesis Tests for Individual Regression Coefficients 497
Confidence Intervals 499 Tests of Hypotheses 501
12.5 Tests on Regression Coefficients 509 Tests on All Coefficients 509 Test on a Subset of Regression Coefficients 510
Comparison of F and t Tests 512
12.6 Prediction 515
12.7 Transformations for Nonlinear Regression Models 518
Quadratic Transformations 519
Logarithmic Transformations 521
12.8 Dummy Variables for Regression Models 526
Differences in Slope 529
12.9 Multiple Regression Analysis Application Procedure 533
Model Specification 533
Multiple Regression 535
Effect of Dropping a Statistically
Significant Variable 536 Analysis of Residuals 538
CHAPTER 13 Additional Topics in Regression Analysis 555
13.1
Model-Building Methodology 556
Model Specification 556
Coefficient Estimation 557
Model Verification 558
Model Interpretation and Inference 558
13.2 Dummy Variables and Experimental Design 558
Experimental Design Models 562
Public Sector Applications 567
13.3 Lagged Values of the Dependent Variable as Regressors 571
13.4 Specification Bias 575
13.5 Multicollinearity 578
13.6 Heteroscedasticity 581
13.7 Autocorrelated Errors 586
Estimation of Regressions with Autocorrelated Errors 590
Autocorrelated Errors in Models with Lagged Dependent Variables 594
CHAPTER 14 Analysis of Categorical Data 606
14.1 Goodness-of-Fit Tests: Specified Probabilities 607
14.2 Goodness-of-Fit Tests: Population Parameters Unknown 613
A Test for the Poisson Distribution 613
A Test for the Normal Distribution 615
14.3 Contingency Tables 618
14.4 Nonparametric Tests for Paired or Matched Samples 623
Sign Test for Paired or Matched Samples 623
Wilcoxon Signed Rank Test for Paired or Matched Samples 626
Normal Approximation to the Sign Test 627
Normal Approximation to the Wilcoxon
Signed Rank Test 628
Sign Test for a Single Population
Median 630
14.5 Nonparametric Tests for Independent Random Samples 632
Mann-Whitney U Test 632
Wilcoxon Rank Sum Test 635
14.6 Spearman Rank Correlation 638
14.7 A Nonparametric Test for Randomness 640
Runs Test: Small Sample Size 640 Runs Test: Large Sample Size 642
CHAPTER 15 Analysis of Variance 649
15.1 Comparison of Several Population Means 649
15.2 One-Way Analysis of Variance 651 Multiple Comparisons Between Subgroup Means 658
Population Model for One-Way Analysis of Variance 659
15.3 The Kruskal-Wallis Test 662
15.4 Two-Way Analysis of Variance: One Observation per Cell, Randomized Blocks 665
15.5 Two-Way Analysis of Variance: More Than One Observation per Cell 674
CHAPTER 16 Time-Series Analysis and Forecasting 688
16.1 Components of a Time Series 689
16.2 Moving Averages 693
Extraction of the Seasonal Component Through Moving Averages 696
16.3 Exponential Smoothing 701 The Holt-Winters Exponential Smoothing Forecasting Model 704
Forecasting Seasonal Time Series 708
16.4 Autoregressive Models 712
16.5 Autoregressive Integrated Moving Average Models 717
CHAPTER 17 Additional Topics in Sampling 720
17.1 Stratified Sampling 720 Analysis of Results from Stratified Random Sampling 722
Allocation of Sample Effort Among Strata 727
Determining Sample Sizes for Stratified Random Sampling with Specified Degree of Precision 729
17.2 Other Sampling Methods 733
Cluster Sampling 733 Two-Phase Sampling 736
Nonprobabilistic Sampling Methods 738
APPENDIX TABLES 742
INDEX 787
Business statistics has continued to evolve as a discipline and has become an increasingly important part of business education programs. It is crucial how business statistics gets taught and what gets taught. Statistics for Business and Economics, tenth edition , has been written to meet the need for an introductory text that provides a strong introduction to business statistics, develops understanding of concepts, and emphasizes problem solving using realistic examples that use real data sets and computer based analysis. These examples highlight business and economics examples for the following:
• MBA or undergraduate business programs that teach business statistics
• Graduate and undergraduate economics programs
• Executive MBA programs
• Graduate courses for business statistics
Designed to build a strong foundation in applied statistical procedures, Statistics for Business and Economics enables individuals to perform solid statistical analysis in many business and economic situations. We have emphasized an understanding of the assumptions that are necessary for professional analysis. In particular we have greatly expanded the number of applications that utilize data from applied policy and research settings. These data and problem scenarios have been obtained from business analysts, major research organizations, and selected extractions from publicly available data sources. With data analysis software like Microsoft Excel, JMP, and Minitab, that illustrate how software can assist decision making process, it is now easy to compute, from the data, the output needed for many statistical procedures. It is tempting to merely apply simple “rules” using these outputs—an approach used in many textbooks. Our approach is to provide instruction through a combination of examples and exercises, supported by relevant software that show how understanding of methods and their assumptions lead to useful understanding of business and economic problems.
KEY FEATURES
The tenth edition of this book has been revised and updated to provide students with improved problem contexts for learning how statistical methods can improve their analysis and understanding of business and economics.
The objective of this revision is to provide a strong core textbook with new features and modifications that will provide an improved learning environment for students entering a rapidly changing technical work environment. This revision recognizes the globalization of statistical study and in particular the global market for this book.
1. Improvement in clarity and relevance of discussions of the core topics included in the book.
2. Addition of large databases developed by global public research agencies, businesses, and databases from the authors’ own works.
3. An extensive number of new end-of-section or end-of-chapter problems.
4. Addition of a number of case studies, with both large and small sample sizes. Students are provided the opportunity to extend their statistical understanding to the context of research and analysis conducted by professionals. These studies include data files obtained from on-going research studies, which reduce for the student, the
extensive work load of data collection and refinement, thus providing an emphasis on question formulation, analysis, and reporting of results.
5. Careful revision of text and symbolic language to ensure consistent terms and definitions and to remove errors that accumulated from previous revisions and production problems.
6. Major revision of the discussion of Time Series both in terms of describing historical patterns and in the focus on identifying the underlying structure and introductory forecasting methods.
7. Integration of the text material, data sets, and exercises into new online applications including MyLab Statistics
8. Expansion of descriptive statistics to include percentiles, z-scores, and alternative formulae to compute the sample variance and sample standard deviation
9. Addition of a significant number of new examples based on real world data
10. Greater emphasis on the assumptions being made when conducting various statistical procedures
11. Reorganization of sampling concepts
12. More detailed business-oriented examples and exercises incorporated in the analysis of statistics
13. Improved chapter introductions that include business examples discussed in the chapter.
14. Good range of difficulty in the section ending exercises that permit the professor to tailor the difficulty level to his or her course.
15. Improved suitability for both introductory and advanced statistics courses for undergraduate and graduate students.
16. Decision Theory, which is covered in other business classes such as operations management or strategic management, has been moved to an online location for access by those who are interested (www.pearsonglobaleditions.com).
This edition devotes considerable effort to providing an understanding of statistical methods and their applications. We have avoided merely providing rules and canned computer routines for analyzing and solving statistical problems. This edition contains a complete discussion of methods and assumptions, including computational details expressed in clear and complete formulas. Through examples and extended chapter applications, we provide guidelines for interpreting results and explain how to determine if additional analysis is required. The development of the many procedures included under statistical inference and regression analysis are built on a strong development of probability and random variables, which are a foundation for the applications presented in this book. The foundation also includes a clear and complete discussion of descriptive statistics and graphical approaches. These provide important tools for exploring and describing data that represent a process being studied.
Probability and random variables are presented with a number of important applications, which are invaluable in management decision making. These include conditional probability and Bayesian applications that clarify decisions and show counterintuitive results in a number of decision situations. Linear combinations of random variables are developed in detail, with a number of applications of importance, including portfolio applications in finance.
The authors strongly believe that students learn best when they work with challenging and relevant applications that apply the concepts presented by dedicated teachers and the textbook. Thus the textbook has always included a number of data sets obtained from various applications in the public and private sectors. In the eighth edition we have added a number of large data sets obtained from major research projects and other sources. These data sets are used in chapter examples, exercises, and case studies located at the end of analysis chapters. A number of exercises consider individual analyses that are typically part of larger research projects. With this structure, students can deal with important detailed questions and can also work with case studies that require them to identify the detailed questions that are logically part of a larger research project. These large data sets can also be used by the teacher to develop additional research and case study projects that
are custom designed for local course environments. The opportunity to custom design new research questions for students is a unique part of this textbook.
A number of major data sets containing Taiwan’s real estate measures, automobile fuel consumption, health data, the World Happiness Report (which captures the effects of COVID-19 on people’s lives and evaluates how world governments dealt with the pandemic), New York’s air quality index, and more are described in detail at the end of the chapters where they are used in exercises and case studies. A complete list of the data files and where they are used is located at the end of this preface. Data files are also shown by chapter at the end of each chapter.
The book provides a complete and in-depth presentation of major applied topics. An initial read of the discussion and application examples enables a student to begin working on simple exercises, followed by challenging exercises that provide the opportunity to learn by doing relevant analysis applications. Chapters also include summary sections, which clearly present the key components of application tools. Many analysts and teachers have used this book as a reference for reviewing specific applications. Once you have used this book to help learn statistical applications, you will also find it to be a useful resource as you use statistical analysis procedures in your future career.
A number of special applications of major procedures are included in various sections. Clearly there are more than can be used in a single course. But careful selection of topics from the various chapters enables the teacher to design a course that provides for the specific needs of students in the local academic program. Special examples that can be left out or included provide a breadth of opportunities. The initial probability chapter, Chapter 3, provides topics such as decision trees, overinvolvement ratios, and expanded coverage of Bayesian applications, any of which might provide important material for local courses. Confidence interval and hypothesis tests include procedures for variances and for categorical and ordinal data. Random-variable chapters include linear combination of correlated random variables with applications to financial portfolios. Regression applications include estimation of beta ratios in finance, dummy variables in experimental design, nonlinear regression, and many more.
As indicated here, the book has the capability of being used in a variety of courses that provide applications for a variety of academic programs. The other benefit to the student is that this textbook can be an ideal resource for the student’s future professional career. The design of the book makes it possible for a student to come back to topics after several years and quickly renew his or her understanding. With all the additional special topics, that may not have been included in a first course, the book is a reference for learning important new applications. And the presentation of those new applications follows a presentation style and uses understandings that are familiar. This reduces the time required to master new application topics.
APPLYING CONCEPTS
We understand how important it is for students to know statistical concepts and apply those to different situations they face everyday or will face as managers of the future. Almost all sections include examples that illustrate the application of the concepts or methods of that section to a real-world context (even though the company or organization may be hypothetical). Problems are structured to present the perspective of a decision maker and the analysis provided is to help understand the use of statistics in a practical way.
PROMOTING PROBLEM ANALYSIS
This book includes section Exercises and chapter Exercises and Applications. The section exercises for each chapter begin with straightforward exercises targeted at the topics in each section. These are designed to check understanding of specific topics. Because they appear after each section, it is easy to turn back to the chapter to clarify a concept or review a method. The Chapter Exercises and Applications are designed to lead to conclusions
about the real world and are more application-based. They usually combine concepts and methods from different sections.
ACKNOWLEDGMENTS
We appreciate the following colleagues who provided feedback about the book to guide our thoughts on this revision: Valerie R. Bencivenga, University of Texas at Austin; Burak Dolar, Augustana College; Zhimin Huang, Adelphi University; Stephen Lich-Tyler, University of North Carolina; Tung Liu, Ball State University; Leonard Presby, William Paterson University; Subarna K. Samanta, The College of New Jersey; Shane Sanders, Nicholls State University; Harold Schneider, Rider University; Sean Simpson, Westchester Community College.
The authors thank Dr. Andrea Carlson, Economic Research Service (ERS), U. S. Department of Agriculture, for her assistance in providing several major data files and for guidance in developing appropriate research questions for exercises and case studies. We also thank Paula Dutko and Empharim Leibtag for providing an example of complex statistical analysis in the public sector. We also recognize the excellent work by Annie Puciloski in finding our errors and improving the professional quality of this book.
We extend appreciation to two Stetson alumni, Richard Butcher (RELEVANT Magazine) and Lisbeth Mendez (mortgage company), for providing real data from their companies that we used for new examples, exercises, and case studies.
In addition, we express special thanks for continuing support from our families. Bill Carlson especially acknowledges his best friend and wife, Charlotte, their adult children, Andrea and Doug, and grandchildren, Ezra, Savannah, Helena, Anna, Eva Rose, and Emily. Betty Thorne extends special thanks to her best friend and husband, Jim, and to their family Jennie, Ann, Renee, Jon, Chris, Jon, Hannah, Leah, Christina, Jim, Wendy, Marius, Mihaela, Cezara, Anda, and Mara Iulia. In addition, Betty acknowledges (in memory) the support of her parents, Westley and Jennie Moore.
The authors acknowledge the strong foundation and tradition created by the original author, Paul Newbold. Paul understood the importance of rigorous statistical analysis and its foundations. He realized that there are some complex ideas that need to be developed, and he worked to provide clear explanations of difficult ideas. In addition, he realized that these ideas become useful only when used in realistic problem-solving situations. Thus, many examples and many applied student exercises were included in the early editions. We have worked to continue and expand this tradition in preparing a book that meets the needs of future business leaders in the information age.
GLOBAL EDITION ACKNOWLEDGEMENTS
We would like to thank the people who have contributed towards developing this book for the global markets and who have put in effort to update this global edition for students across the world.
Roland Baczur, PhD student at the University of Pécs
Alicia Tan Yiing Fei, Taylor’s University
Višnja Juric, Zagreb School of Economics and Management
Daniel Kehl, University of Pecs
Patricia Ramos, Nova School of Business and Economics
D.T. Tempelaar, Maastricht University
Dr. P.C. van Santen, University of Groningen
We would also like to thank the individuals who reviewed the text and whose feedback has made this a better book.
Dogan Serel, Bilkent University
Manfred Soeffky, Berlin School of Economics and Law
Yuan Wang, Sheffield Hallam University
Ioannis Karavias, University of Birmingham
Baczur Roland, University of Pécs
Resources for Success
Instructor Supplements
Online Test Bank (download only): The test-item files contain true/false, multiple-choice, and short-answer questions based on concepts and ideas developed in each chapter of the text. Available to qualified instructors through Pearson’s online catalog at www.pearsonglobaleditions.com or within MyLab Statistics.
Instructor’s Solutions Manual (download only): Contains worked-out solutions for end-of-section and end-of-chapter exercises and applications. The Instructor’s Solutions Manual is available to qualified instructors through Pearson’s online catalog at www .pearsonglobaleditions.com or within MyLab Statistics.
TestGen® Computerized Test Bank (www.pearsoned .com/testgen): Enables instructors to build, edit, print, and administer tests using a computerized bank of questions developed to cover all the objectives of the text. TestGen is algorithmically based, allowing instructors to create multiple but equivalent versions of the same question or test with the click of a button. Instructors can also modify test bank questions or add new questions. The software and test bank are available for download from Pearson’s online catalog at www.pearsonglobaleditions.com
PowerPoint Lecture Slides: Free to qualified adopters, this set of chapter-by-chapter PowerPoint slides provides an instructor with individual lecture outlines to accompany the text. The slides include key figures and tables from the text, which can easily be modified, and help bring the statistical concepts alive in the classroom. These files are available to qualified instructors through Pearson’s online catalog at www.pearsonglobaleditions.com or within MyLab Statistics.
Learning Catalytics™: A web-based engagement and assessment tool. As a “bring-your-own-device” direct response system, Learning Catalytics offers a diverse library of dynamic question types that allow students to interact with and think critically about statistical concepts. As a real-time resource, instructors can take advantage of critical teaching moments both in the classroom and through assignable and gradable homework.
Student’s Solutions Manual, provides detailed, worked-out solutions to odd-numbered exercises. This item is available within MyLab Statistics and can be shared by the instructor only.
Student Resources
Online Resources: These resources include data files, which are available through Pearson’s online catalog at www.pearsonglobaleditions.com
Technology Resources
MyLab Statistics Online Course (access code required) MyLab™ Statistics is the teaching and learning platform that empowers you to reach every student. By combining trusted author content with digital tools and a flexible platform, MyLab Statistics personalizes the learning experience and improves results for each student. With MyLab Statistics and StatCrunch®, an integrated web-based statistical software program, students learn the skills they need to interact with data in the real world. Learn more about MyLab Statistics at pearson.com/mylab/statistics
Used by nearly one million students a year, MyLab Statistics is the world’s leading online program for teaching and learning statistics. MyLab Statistics delivers assessment, tutorials, and multimedia resources that provide engaging and personalized experiences for each student, so learning can happen in any environment. Each course is developed to accompany Pearson’s best-selling content, authored by thought leaders across the statistics curriculum, and can be easily customized to fit any course format.
Methods for teaching statistics are continuously evolving to provide today’s students with the skills they need to interact with data in the real world. In addition, statistics students are coming to the classroom with a wide range of backgrounds and learner styles. The flexibility to build a course that fits instructors’ individual course formats and every student’s needs—with a variety of content options and multimedia resources all
pearson.com/mylab/statistics
in one place—has made MyLab Statistics the market-leading solution for teaching and learning statistics since its inception.
Thanks to feedback from instructors and students from more than 10,000 institutions, MyLab Statistics continues to transform—delivering new content, innovative learning resources, and platform updates to support students and instructors, today and in the future.
Deliver Trusted Content
You deserve teaching materials that meet your own high standards for your course. That’s why Pearson partners with highly respected authors to develop interactive content and course-specific resources that you can trust—and that keep your students engaged.
Tutorial Exercises with Multimedia Learning Aids:
The homework and practice exercises in MyLab Statistics align with the exercises in the textbook, and they regenerate algorithmically to give students unlimited opportunity for practice and mastery. Exercises offer immediate helpful feedback, guided solutions, sample problems, animations, videos, and eText clips for extra help at point-of-use.
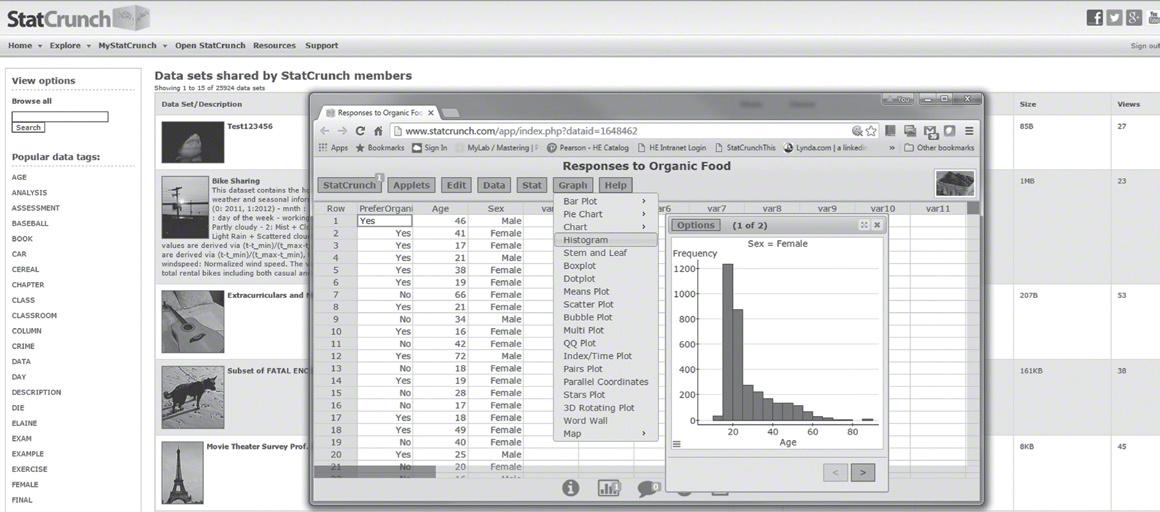
StatCrunch: MyLab Statistics integrates the web-based statistical software, StatCrunch, within the online assessment platform so that students can easily analyze datasets from exercises and the text. In addition, MyLab Statistics includes access to www.StatCrunch.com, a website where users can access tens of thousands of shared datasets, conduct online surveys, perform complex analyses using the powerful statistical software, and generate compelling reports.
Business Insight Videos: Engaging videos show managers at top companies using statistics in their everyday work. Assignable questions encourage debate and discussion.
StatTalk Videos: Fun-loving statistician Andrew Vickers takes to the streets of Brooklyn, New York, to demonstrate important statistical concepts through interesting stories and real-life events. This series of videos includes available assessment questions and an instructor’s guide.
Empower Each Learner
Each student learns at a different pace. Personalized learning pinpoints the precise areas where each student needs practice, giving all students the support they need—when and where they need it—to be successful.
■ Study Plan: Acts as a tutor, providing personalized recommendations for each of your students based on his or her ability to master the learning objectives in your course. This allows students to focus their study time by pinpointing the precise areas they need to review, and allowing them to use customized practice and learning aids—such as videos, eText, tutorials, and more—to get them back on track. Using the report available in the Gradebook, you can tailor course lectures to prioritize the content where students need the most support, offering you better insight into classroom and individual performance.
■ With the Companion Study Plan Assignments you can now assign the Study Plan as a prerequisite to a test or quiz, guiding students through the concepts they need to master.
■ Getting Ready for Statistics: A library of questions now appears within each MyLab Statistics course to offer the developmental math topics students need for the course. These can be assigned as a prerequisite to other assignments, if desired.
Conceptual Question Library: In addition to algorithmically regenerated questions that are aligned with your textbook, there is a library of 1,000 Conceptual Questions available in the assessment manager that require students to apply their statistical understanding.
Teach the Course Your Way
Your course is unique. So whether you’d like to build your own assignments, teach multiple sections, or set
pearson.com/mylab/statistics
prerequisites, MyLab gives you the flexibility to easily create your course to fit your needs.
■ Learning Catalytics: Generate class discussion, guide your lecture, and promote peer-to-peer learning with real-time analytics. MyLab Statistics now provides Learning Catalytics™—an interactive student response tool that uses students’ smartphones, tablets, or laptops to engage them in more sophisticated tasks and thinking.
■ LMS Integration: You can now link Blackboard Learn™, Brightspace® by D2L®, Canvas™, or Moodle® to the MyLabs. Access assignments, rosters, and resources, and synchronize grades with your LMS gradebook. For students, single sign-on provides access to all the personalized learning resources that make studying more efficient and effective.
Improve Student Results
When you teach with MyLab, student performance improves. That’s why instructors have chosen MyLab for over 15 years, touching the lives of more than 50 million students.
StatCrunch
Integrated directly into MyLab Statistics, StatCrunch® is powerful web-based statistical software that allows users to perform complex analyses, share datasets, and generate compelling reports of their data.
The vibrant online community offers tens of thousands of shared datasets for students to analyze.
■ Collect. Users can upload their own data to StatCrunch or search a large library of publicly shared datasets, spanning almost any topic of interest. Datasets from the text and from online homework exercises can also be accessed and analyzed in StatCrunch. An online survey tool allows users to quickly collect data via web-based surveys.
■ Crunch. A full range of numerical and graphical methods allows users to analyze and gain insights from any dataset. Interactive graphics help users understand statistical concepts, and are available for export to enrich reports with visual representations of data.
■ Communicate. Reporting options help users create a wide variety of visually appealing representations of their data.
StatCrunch is also available by itself to qualified adopters. It can be accessed on your laptop, smartphone, or tablet when you visit the StatCrunch website from your device’s browser. For more information, visit the StatCrunch website at www.StatCrunch.com or contact your Pearson representative.
TestGen
TestGen® (www.pearsoned.com/testgen) enables instructors to build, edit, print, and administer tests using a computerized bank of questions developed to cover all the objectives of the text. TestGen is algorithmically based, allowing instructors to create multiple but equivalent versions of the same question or test with the click of a button. Instructors can also modify test bank questions or add new questions. The software and test bank are available for download from Pearson’s Instructor Resource Center at www.pearsonglobaleditions.com.
PowerPoint Lecture Slides
PowerPoint® Lecture Slides provide an outline to use in a lecture setting, presenting definitions, key concepts, and figures from the text. These slides are available within MyLab Statistics and in the Instructor Resource Center at www .pearsonglobaleditions.com
pearson.com/mylab/statistics
Foster student engagement and peer-to-peer learning
Generate class discussion, guide your lecture, and promote peer-to-peer learning with real-time analytics.
MyLab™ Math and MyLab Statistics now provide Learning Catalytics™—an interactive student response tool that uses students’ smartphones, tablets, or laptops to engage them in more sophisticated tasks and thinking.
Instructors, you can:
■ Pose a variety of open-ended questions that help your students develop critical thinking skills.
MyLab
■ Monitor responses to find out where students are struggling.
■ Use real-time data to adjust your instructional strategy and try other ways of engaging your students during class.
■ Manage student interactions by automatically grouping students for discussion, teamwork, and peer-to-peer learning.
Achievement Test Scores—Exercise 10.5
Advertising Retail—Example 13.6
Amsterdam Rents—Exercises 11.24, 11.30, 11.38, 11.46
Baby Walking—Exercises 8.14, 8.32, 14.17
Bank Assets—Exercises 16.36, 16.38
Beef Veal—Exercises 13.63–13.65
Benefits Research—Example 12.60
Births Australia—Exercise 13.17
Bottles—Exercise 6.82
Brent Oil Price— Exercise 14.49
Britain Sick Leave—Exercise 13.56
Browser Wars—Exercises 1.19, 1.25
Citydatr —Examples 12.7, 12.9, 14.14, Exercises 1.46, 11.84, 12.31, 12.100, 12.103, 13.22, 13.60
Completion Times—Example 1.9, Exercise 13.6
Croatian Coffee—Exercise 2.25
Currency Exchange Rates—Example 1.6, Exercise 1.24
Diversity—Exercise 1.22
Dow Jones—Exercises 11.23, 11.29, 11.37
Earnings per Share—Exercise 1.29
Electric Cars— Exercises 1.37, 2.22, 7.6, 7.103, 13.29
Euribor 12 Months—Exercise 14.48
Exchange Rate—Exercise 1.49
Fertility—Exercises 11.82, 11.83
Fuel Prices—Exercise 14.51
Gender Pay Gap— Exercise 1.71
German Import—Exercise 12.61
German Income—Exercise 13.53
GDP Growth—Exercise 16.11
Gold Price—Exercises 1.27, 16.5, 16.12
Government Net Lending Euro Area—Exercises 16.4, 16.23
Government Revenue Poland—Exercise 16.9
Government Spending France—Exercises 16.3, 16.22
Grade Point Averages—Examples 1.10, 2.3, Exercise 1.73
Granola—Exercise 6.84
Happiness Report Data —Exercises 9.66, 9.67, 9.73, 10.33, 10.34, 10.42, 10.43, 10.46, 11.92–11.96, 12.101, 12.102, 12.105
HealthTech—Exercise 2.45
HEI Cost Data Variable Subset—Examples 1.1, 1.2, 2.7, 7.5, Exercises 11.97–11.101, Chapter 13 Case Study, Case Studies 12.114–12.117
High Yield Index—Exercises 16.2, 16.7, 16.14
Hotel—Exercise 1.68
Hourly Earnings—Exercise 16.19
House Selling Price—Exercise 10.4, Case Study 12.110
House Starts—Exercise 16.1
Housing Starts—Exercises 1.28, 16.6, 16.13
ICU—Exercises 9.72, 9.74–9.78
Indonesia Revenue—Exercise 13.52
Inflation Euro Area—Exercises 13.16, 13.38
Insurance—Example 1.4
Japan Imports—Exercise 13.54
Library Survey—Exercise 1.7
M&A Survey—Exercise 1.17
Macro2009—Examples 1.5, 1.7
Macro2010—Example 13.8
Mendez Mortgage —Chapter 2 Case Study, Exercises 7.5, 7.35, 7.36
Metals—Exercise 13.59
Money UK—Exercises 13.31, 13.35
Mortgage Banks—Exercise 10.48
Motors—Exercises 12.13, 12.14, 12.48, 13.21
OECD Employment Gap Data—Exercises 16.18, 16.20, 16.40, 16.41
OECD Lab Force Australia—Exercises 13.61, 13.62
OECD Lab Force Italy—Exercises 13.57, 13.58
OECD Pay Gap Data—Exercises 16.42, 16.43
OECD Satisfaction—Exercise 11.86
Oulu Grades—Exercise 2.41
Pension Funds—Exercise 13.15
Performance—Exercise 12.82
PISA Sample —Exercises 1.8, 1.18, 7.23, 10.51–10.58, 12.92
Private Colleges—Exercises 11.87–11.91
Product Sales—Exercises 16.37, 16.39
Profit Margins—Exercise 16.21
Real GDP Germany—Exercise 1.50
RELEVANT Magazine—Examples 1.8, 2.19
Renewable Energy —Exercises 11.36, 11.52, 11.53, 11.85, 12.81, 12.104, 13.28
Retail Sales—Examples 11.2, 11.3, Exercises 13.13, 13.26
Returns—Exercise 1.38
Salary Study—Exercise 12.107
Sales and Distance—Exercise 1.66
Salorg—Exercise 12.72
Shiller House Price Cost—Example 16.2, Exercise 12.109
Shopping Times—Example 2.6, Exercise 1.72
Staten—Exercise 12.106
Stordata—Exercise 1.45
Storet—Exercise 10.47
Student GPA—Exercises 2.48, 11.81, 12.99, 12.108
Student Performance—Exercise 12.71
Study—Exercises 7.86
Study Data—Exercise 2.10
Sugar—Exercise 7.24
Sugar Coated Wheat—Exercise 6.83
Sun—Exercise 1.39
Supermarket—Exercise 11.11
Taiwan Real Estate—Exercises 8.34, 8.35, 9.68
Tennis—Exercises 1.15, 1.70
Tesla Stock Prices—Exercise 14.50
Thailand Consumption—Exercises 13.18, 13.36
TOC—Exercise 7.45
Trading Stocks—Exercise 11.51
Windows Wars—Example 1.3
World Bank Commodity Prices—Exercises 11.64–11.67