STANDARD PENETRATION TESTS AND SOIL LIQUEFACTION POTENTIAL EVALUATION
FuMro TATSUOKA*, Tosmo IwASAKI**, KEN-rem ToKmA***, SusuMu YAsunA****, MAKOTO HrRosE*****, TsuNEO IMAI****** and MAsASHI KoN-No*******
ABSTRACT
Several methods to evaluate cyclic undrained strengths of sandy soils from standard penetration resistances (N-values) are reviewed and compared. It is shown that some empirical equations which do not take account of the effects of grain size on N-values can be rather conservative for fine or silty sands. When the effects of grain size on N-values are adequately taken into account, strengths estimated from N-values are very close to the measured strengths of undisturbed samples. A simplified procedures for evaluating liquefaction potential of an element is proposed. An index showing integrated liquefaction potential of a deposit is also proposed and examined by a liquefaction case study.
Key words: dynamic, earthquake resistant, grain size, laboratory test, liquefaction, penetration test, repeated load, sampling, sandy soil, sounding JGC: D6/C3/C6
INTRODUCTION
Several practical methods to evaluate soil liquefaction potential of level grounds have been developed. Considering that standard penetration tests have been widely conducted for designing most of civil engineering structures, methods of soil liquefaction potential evaluation which are based on blow counts by standard penetration tests (N-values) are still useful tools for practical engineers. In any analytical method of liquefaction potential evaluation, in situ cyclic .undrained strength or liquefaction strength should be firstly evaluated. Presently available method to evaluate in situ cyclic undrained strength based on N-values may be classified into the following three main categories (see Fig. 1):
( 1) Method A, m which relative density is used as an essential parameter and
* Associate Professor, Institute of Industrial Science, University of Tokyo, 22-1, Roppongi 7, Minato-ku, Tokyo.
** Head, Ground Vibration Section, Public Works Research Institute, Ministry of Construction, Asahi 1, Toyosato-machi, Tsukuba-gun, Ibaragi.
*** Research Engineer, do.
**** Research Engineer, Kisojiban Consultants, Co., Ltd., 2-14-1, Ishikawa-cho, Ohta-ku, Tokyo.
***** Research Engineer, Soil Laboratory, Toa Harbor Works Co., Ltd., Yokohama-shi, Kanagawa.
****** Chief, Earthquake Engineering Division, Urawa Research Institute, OYO Co., Ltd., Urawashi, Saitama.
******* Research Engineer, do.
Written discussions on this paper should be submitted before October 1, 1981.
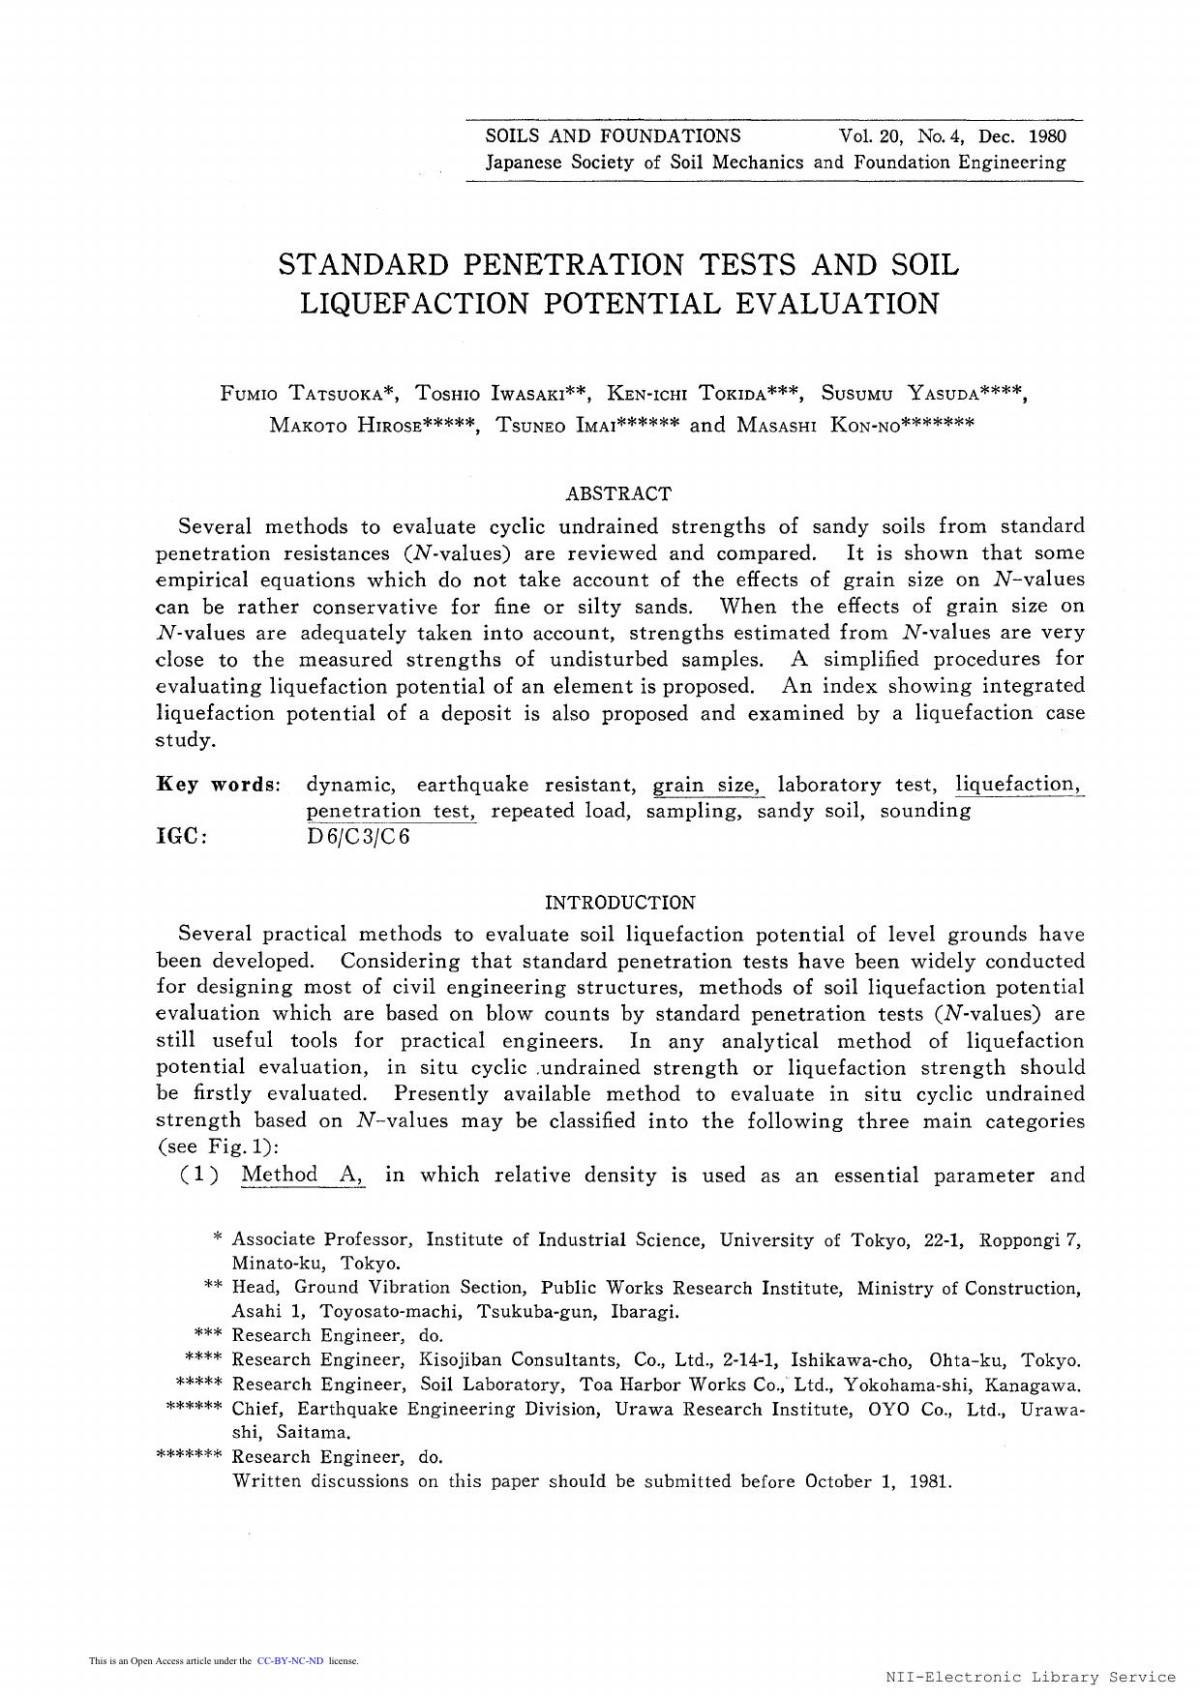
Fig. 1. Three major categories for evaluating cyclic undrained strength from N-values
firstly evaluated from N-values and other parameters. Then, triaxial strength (or if possible, simple shear strength) is determined from relative density. In situ strength is obtained by correcting triaxial strength. Seed and Idriss (1971) firstly proposed this method.
( 2) Method B, which is based on the empirical relationship between cyclic undrained triaxial strength of undisturbed specimens and N-values (Ishihara and Ogawa, 1978; Tatsuoka et al., 1978).
( 3) Method C, which is based on the empirical correlation between stress ratio causing liquefaction in the field and N-values (Castro, 1975; Seed, 1979).
The authors have found by applying these methods to actual liquefaction potential evaluation problems for young alluvial deposits and uncompacted hydraulic fills that the effects of grain size on N-values are significant. They have also found that when these effects are ignored any of above three methods can be misleading, especially for fine sand deposits.
In this paper, the outlines of above three methods are firstly presented and then these methods are used to evaluate cyclic undrained strengths of sand deposits at two sites, both being uncompacted hydraulic fills underlain by young alluvial deposits. In the last part, the previous liquefaction experiences in Japan are analyzed by these methods, and a new parameter indicating liquefaction potential of a deposit is proposed.
THREE METHODS EXAMINED
Different methods will be compared in respect of the cyclic undrained triaxial strength defined as
2 d/ Nc=20
which is the stress ratio (adp/2 ac') at the number of loading cycles Ne of 20 where liquefaction takes place, where <Jdp is the single amplitude of deviator stress and ac' is the effective confining stress.
Method A It is suggested in the simplified procedure by Seed and Idriss (1971) that the value of Ri at a certain value of relative density Dr up to around 80% can be evaluated as
Rz = (Ri)50 x Dr/50 ( 2) in which (Rz) 50 is the value of Ri at Dr=50%.
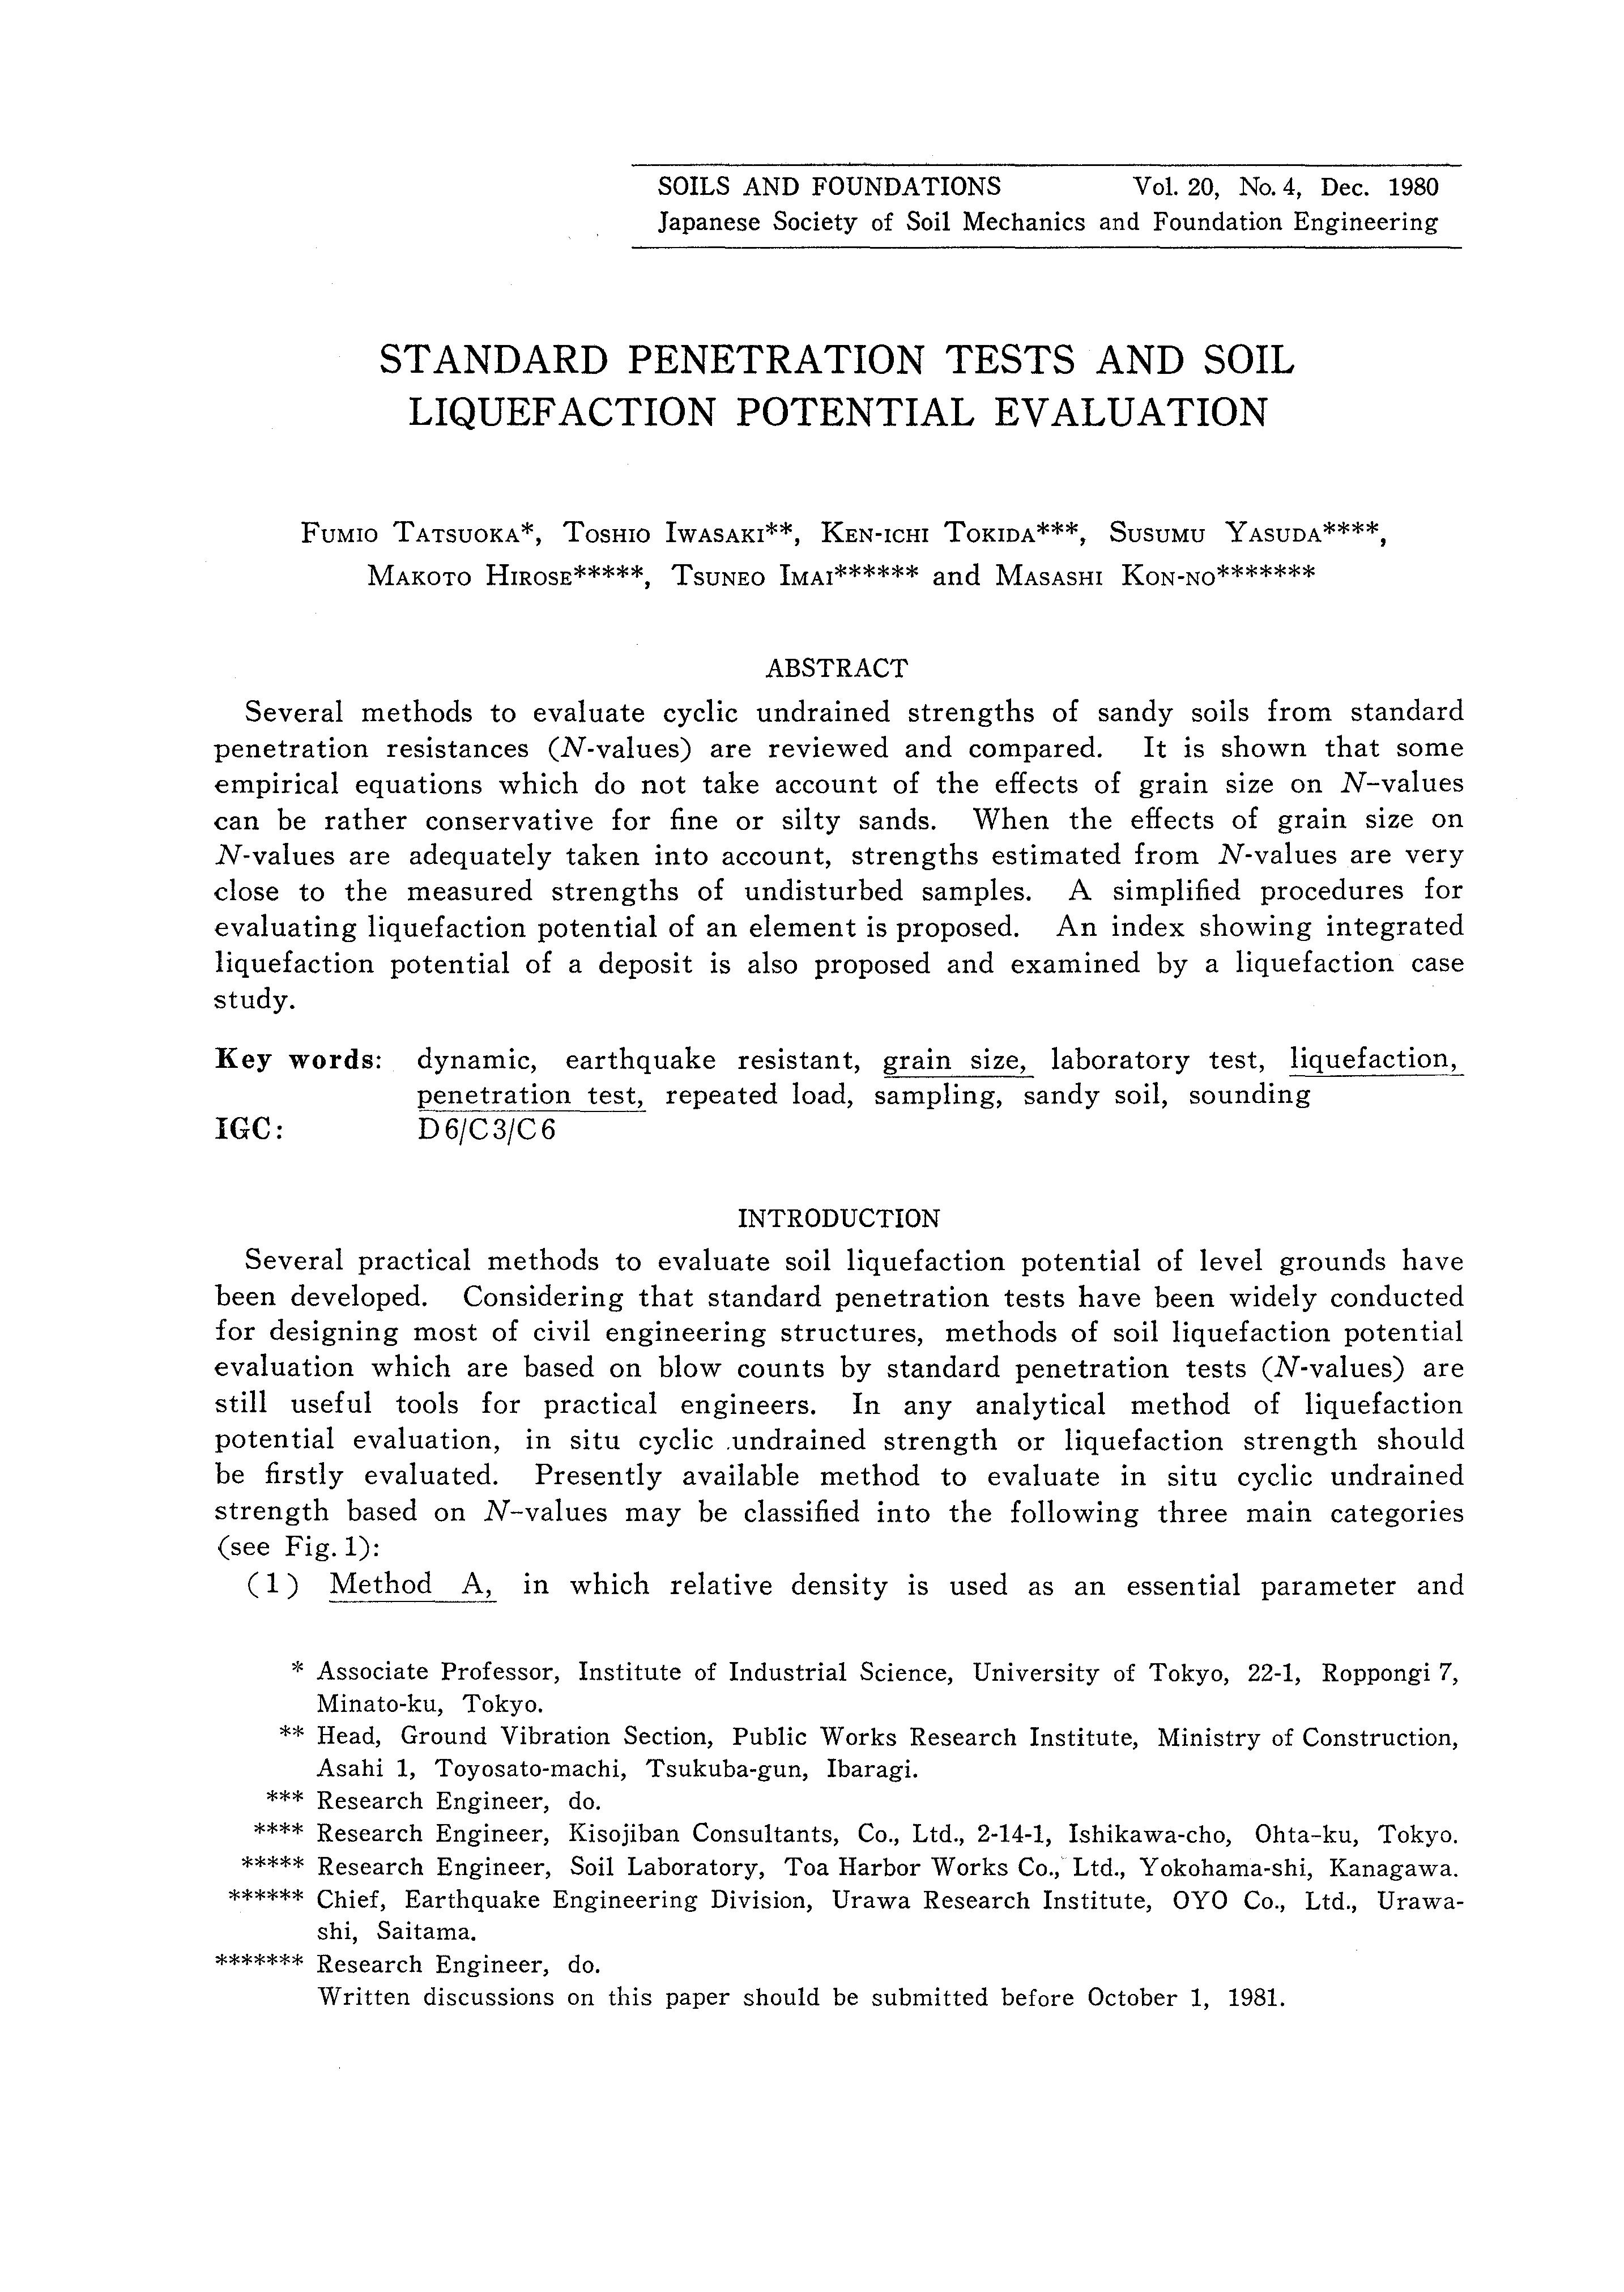
The value of (Rz) 50 as a function of mean grain size (D50) suggested by Seed and Idriss (1971) is shown in Fig. 2. Note that the value of (Rz) 50 shown in Fig. 2 are for Ne= 20 which were obtained by interpolating their original data. Recently, Martin et al. (1978) have shown that the variation of Rz with grain size is mainly due to membrane penetration effect. As shown in Fig. 2, the suggested strength by Martin et al. (1978) is almost independent of D 50 • Therefore, it seems reasonable to estimate (Rz) 50 from the strength curves shown in Fig. 2 as
By Seed and Idriss (1971)
0.2-
0·8.'-o-2
T ATSUOKA ET AL.
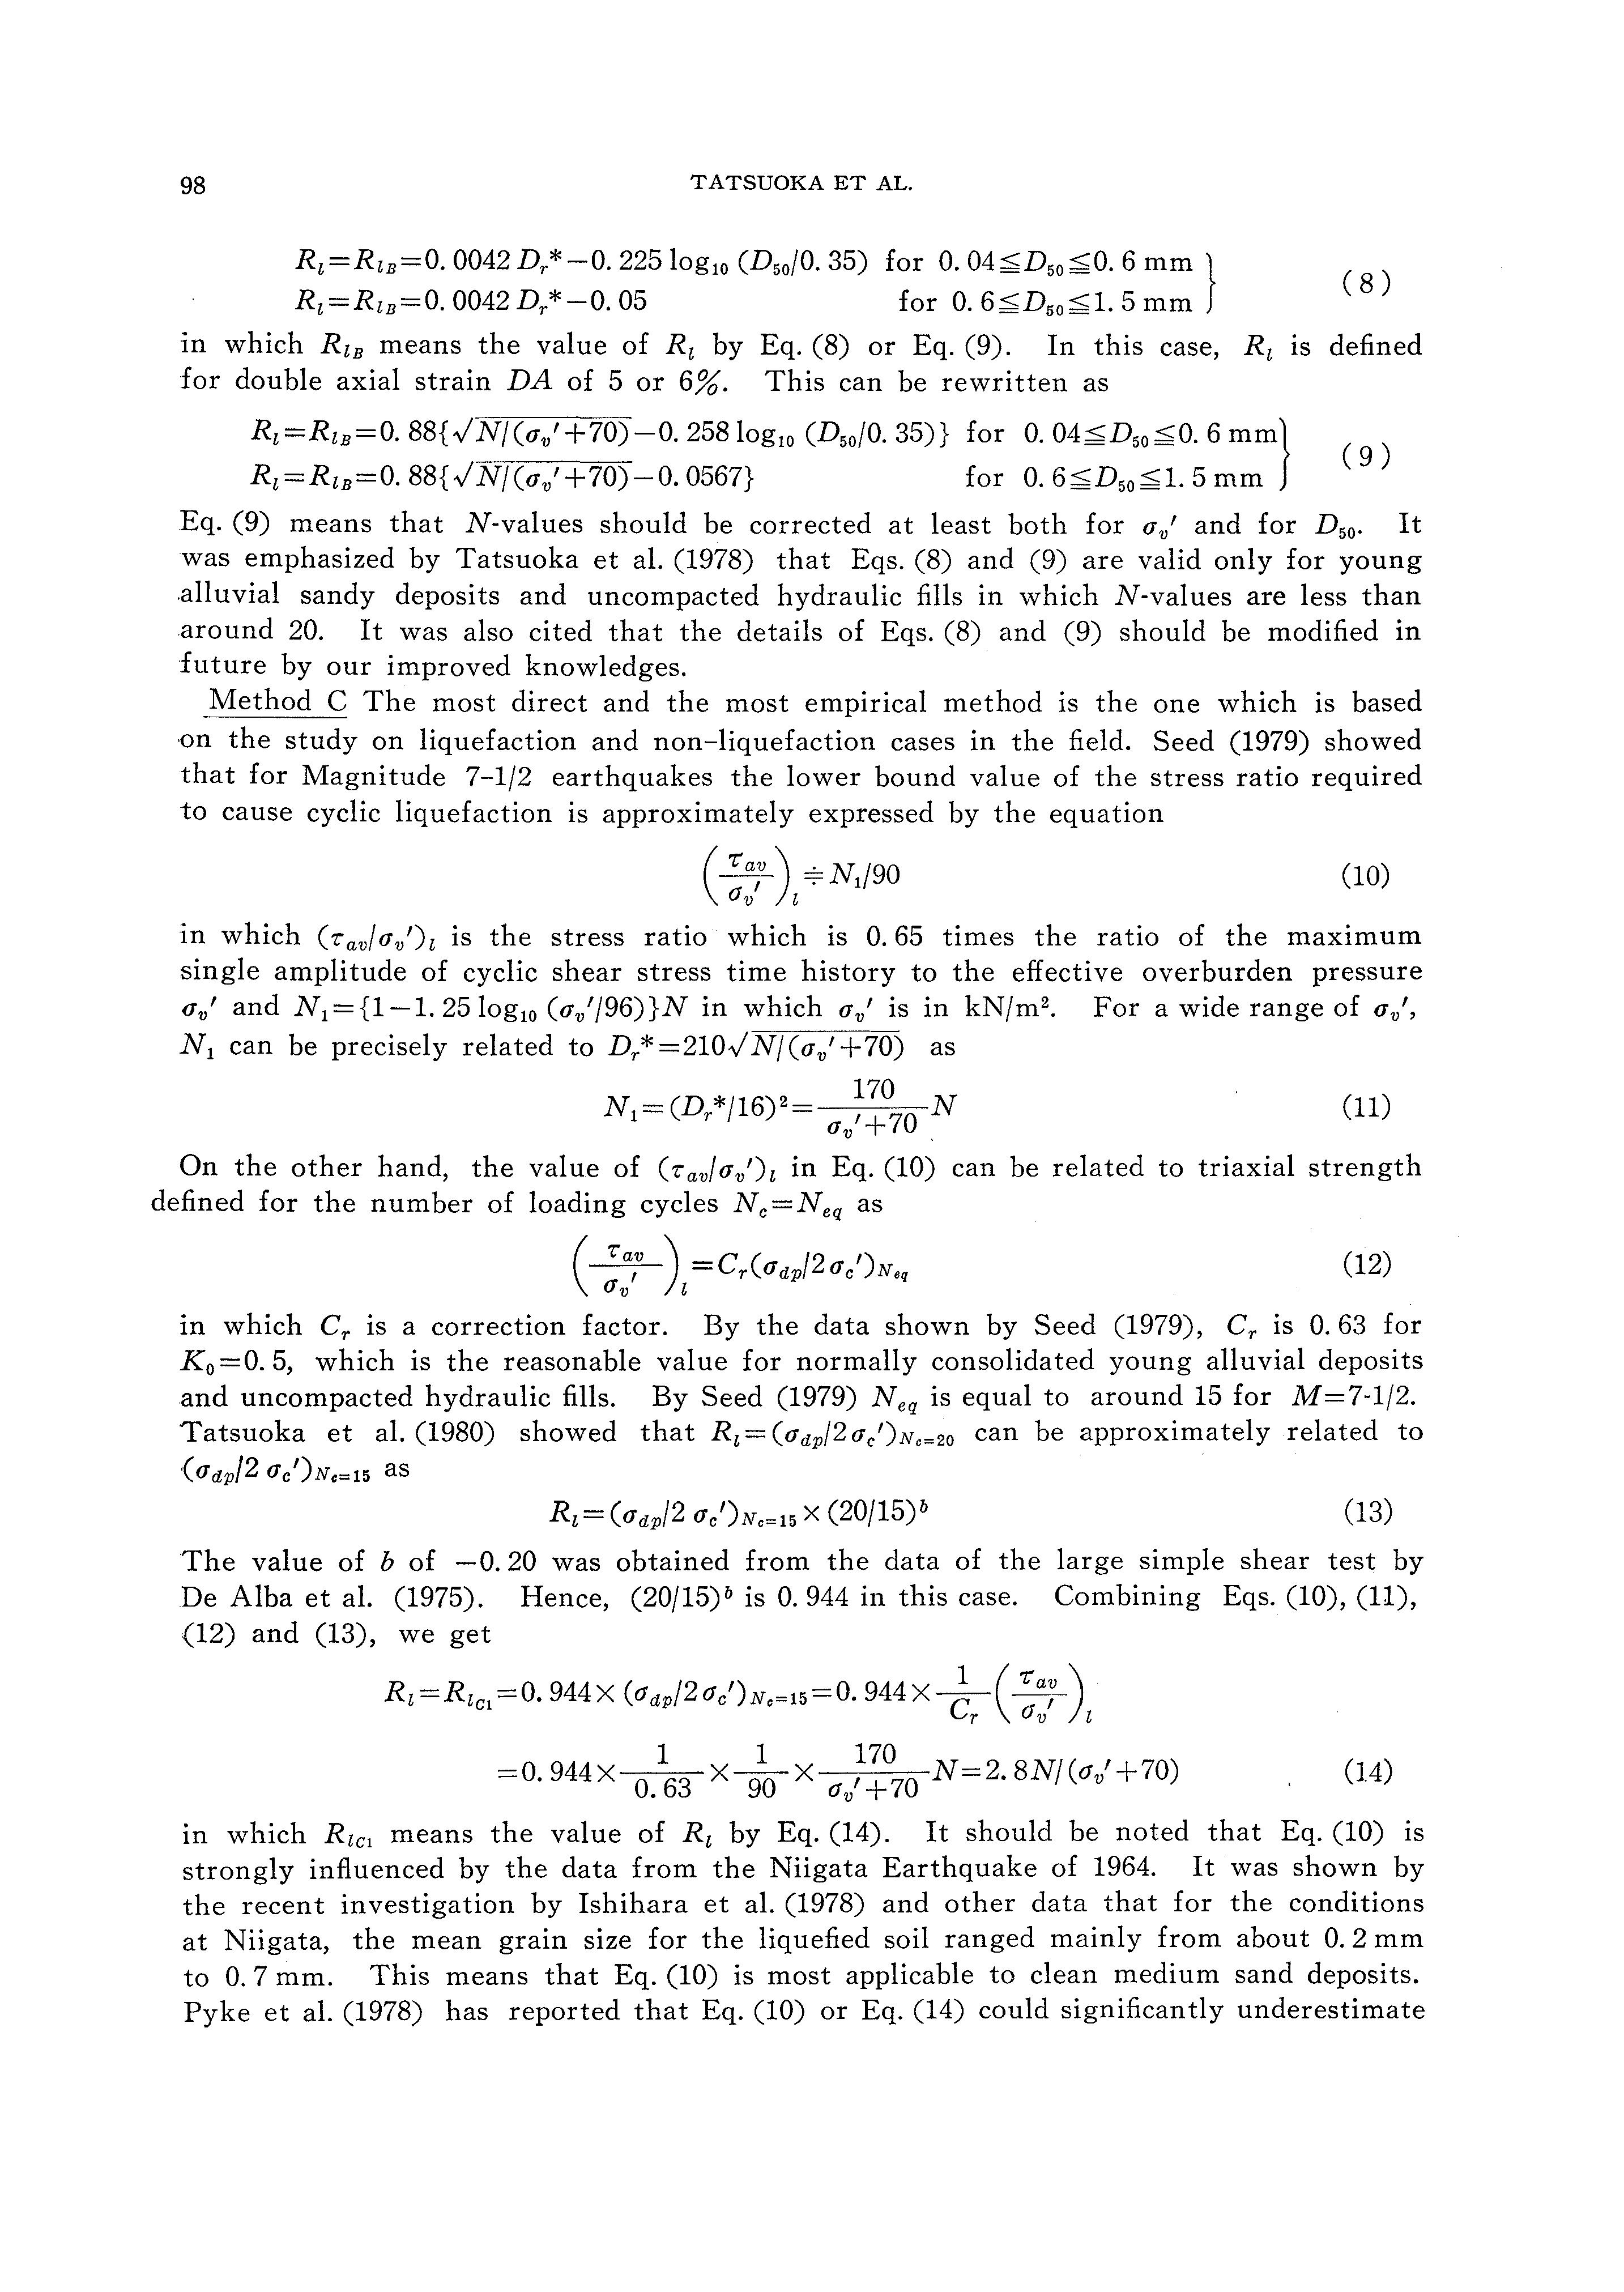
Ri:Rin:O. 0042 Dr:-0. 225 logi 0 (D50/0. 35) for 0. 6 mm} ( 8 )
Ri-Rin-0. 0042 Dr -0. 05 for 0. 5 mm
in which Rin means the value of Ri by Eq. (8) or Eq. (9). In this case, Rz is defined for double axial strain DA of 5 or 6%. This can be rewritten as
Ri=Rin=O. 88{ JN/(av'+70)-0. 258 logi 0 (D50 /0. 35)} for 0. 6 mm}
Ri=Rin=0.88{JN/(av'+70)-0.0567} for ( 9 )
Eq. (9) means that N-values should be corrected at least both for av' and for D 50 • It was emphasized by Tatsuoka et al. (1978) that Eqs. (8) and (9) are valid only for young .alluvial sandy deposits and uncompacted hydraulic fills in which N-values are less than around 20. It was also cited that the details of Eqs. (8) and (9) should be modified in future by our improved knowledges.
Method C The most direct and the most empirical method is the one which is based ·on the study on liquefaction and non-liquefaction cases in the field. Seed (1979) showed that for Magnitude 7-1/2 earthquakes the lower bound value of the stress ratio required to cause cyclic liquefaction is approximately expressed by the equation ( Ta;) (10)
l
in which Crav!av')i is the stress ratio which is 0. 65 times the ratio of the maximum single amplitude of cyclic shear stress time history to the effective overburden pressure <Jv' and Ni= {l-1. 25 logi 0 (av'/96) }N in which av' is in kN/m 2 • For a wide range of av', Ni can be precisely related to Dr*=210JN/Cav'+70) as
Ni=CDr*/16) 2 a): 0 70 N (11)
On the other hand, the value of Crav!av')i in Eq. (10) can be related to triaxial strength defined for the number of loading cycles Nc=Neq as
=Cr(adp/2ac')N.q (12) av l
in which Cr is a correction factor. By the data shown by Seed (1979), Cr is 0. 63 for K 0 =0. 5, which is the reasonable value for normally consolidated young alluvial deposits and uncompacted hydraulic fills. By Seed (1979) Neq is equal to around 15 for M=7-1/2. Tatsuoka et al. (1980) showed that Ri = (adp/2 a/)Nc= 20 can be approximately related to (adp/2 ac')Nc=l5 as (13)
The value of b of -0. 20 was obtained from the data of the large simple shear test by De Alba et al. (1975). Hence, (20/15)b is 0. 944 in this case. Combining Eqs. (10), (11), (12) and (13), we get
Ri =Rici =0. 944 X (aap/2 a/)N.=15 =0. 944 X Cl ( -r a1f-) r Ov l 1 1 170 - ' =0.944X 0. 63 x 90 x av'+ 70 N-2.8N/(av +70) (14)
m which Rici means the value of Ri by Eq. (14). It should be noted that Eq. (10) is strongly influenced by the data from the Niigata Earthquake of 1964. It was shown by the recent investigation by Ishihara et al. (1978) and other data that for the conditions at Niigata, the mean grain size for the liquefied soil ranged mainly from about 0. 2 mm to 0. 7 mm. This means that Eq. (10) is most applicable to clean medium sand deposits. Pyke et al. (1978) has reported that Eq. (10) or Eq. (14) could significantly underestimate
the cyclic undrained strength of fine sand or silty sand deposits. They showed that there was no liquefaction in a hydraulic fill during the Long Beach Earthquake of 1933 (M=6. 3). The estimated field strength value of ('C'av!av')i from the accelerograph record and some analyses was 0. 2 or more. The estimated averaged value of Ni was 10. Following Seed (1979), when the effects of magnitude are taken into account, Eq. (10) becomes
(15)
By making N 1 equal to 10 in Eq. (15), we get a strength ('C'avfav')i of around 0.128. This value is significantly lower than the value of 0. 2 or more. The reported value ·of D 50 of the fill was mainly between 0. 15,...,_,0. 016 mm, which means that the hydraulic fill consisted of mainly :fine sand or silty sand. From the facts described above, Pyke et al. (1978) concluded that use of Eq. (10) or (15) may be rather conservative for more silty materials.
A MODIFICATION OF EMPIRICAL METHOD C
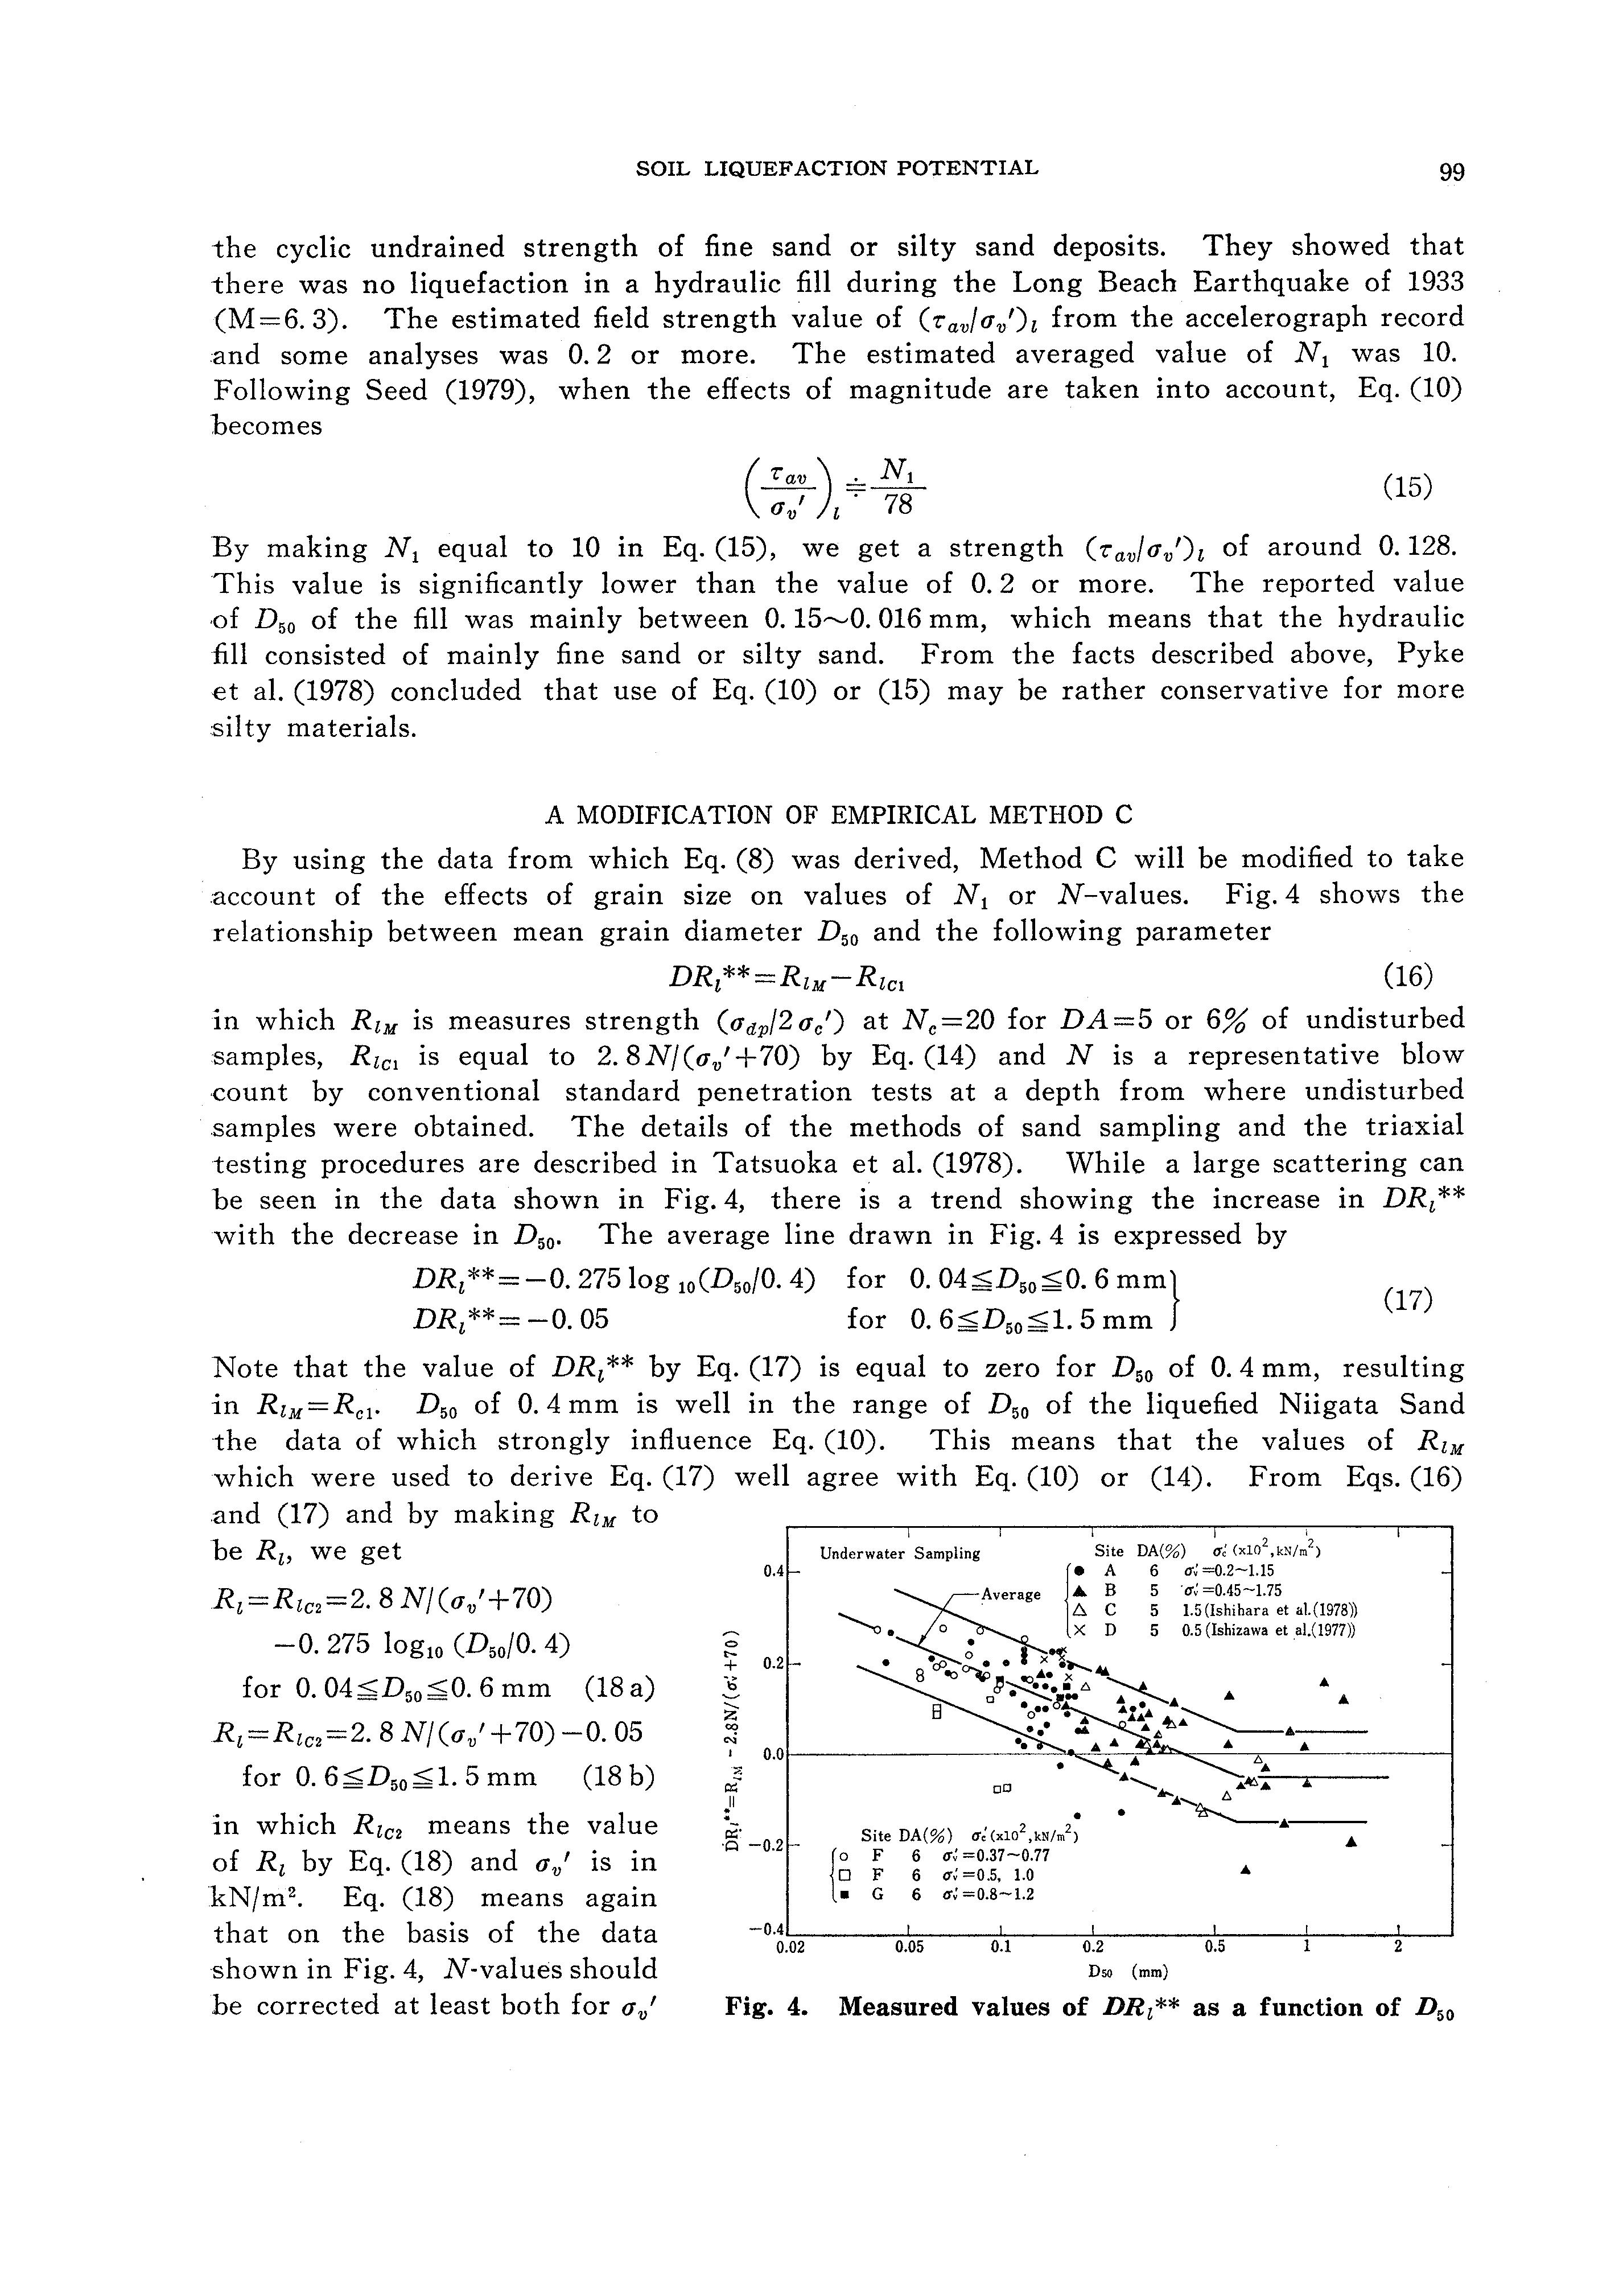
By using the data from which Eq. (8) was derived, Method C will be modified to take account of the effects of grain size on values of Ni or N-values. Fig. 4 shows the relationship between mean grain diameter D 50 and the following parameter
DRi**=RzM-Rzc 1 (16) in which RzM is measures strength (a dp/2 a c') at Ne= 20 for DA= 5 or 6% of undisturbed samples, Rzc 1 is equal to 2. 8N/(av'+70) by Eq. (14) and N is a representative blow count by conventional standard penetration tests at a depth from where undisturbed samples were obtained. The details of the methods of sand sampling and the triaxial testing procedures are described in Tatsuoka et al. (1978). While a large scattering can be seen in the data shown in Fig. 4, there is a trend showing the increase in DRi ** with the decrease in D 50 • The average line drawn in Fig. 4 is expressed by DRi**=-0. 275 log io(D50/0. 4) for 0. 04;£D50 ;£0. 6 mm}
DRi**= -0. 05 for 0. 6;£D50 ;£1. 5 mm (l 7)
Note that the value of DRi** by Eq. (17) is equal to zero for D 50 of 0. 4 mm, resulting in RzM=Rci· D 50 of 0. 4 mm is well in the range of D 50 of the liquefied Niigata Sand the data of which strongly influence Eq. (10). This means that the values of RzM which were used to derive Eq. (17) well agree with Eq. (10) or (14). From Eqs. (16) and (17) and by making RzM to be Rz, we get
Rz=Rzc 2 =2. 8 N/(av'+70)
-0. 275 logi 0 (D50/0. 4) for 0. 04;£D50 ;£0. 6 mm (18 a)
Ri=Rzc 2 =2. 8 N/(av' +70)-0. 05 for 0. 6;£D50 ;£1. 5 mm (18 b)
in which Rzc 2 means the value of Ri by Eq. (18) and av' is m kN/m 2 • Eq. (18) means again that on the basis of the data shown in Fig. 4, N-values should he corrected at least both for av'
Fig. 4. Measured values of DRz** as a function of D 50
Sampling
and for D 50 • By using Eq. (11), Eq. (18 a) becomes R 1c2=0. 0165 Ni -0. 275 log 10 (D50/0. 4) =0. 0165{Ni -16. 7 log 10 (D50/0. 4)} (19) By replacing N 1 with Ni -16. 7 log 10 (D50/0. 4) in Eq. (15) for taking account of the effect of grain size on Nl> we get for M=6. 3
( ) i [Ni -16. 7 log 10 (D50/0. 4)] (20)
The data of the case reported by Pyke et al. (1978) are M=6. 3, .-....,Q. 016 mm, with the averaged value of D 50 being 0. 083 mm.
Ni =10 and D 50 =0.15 By substituting these
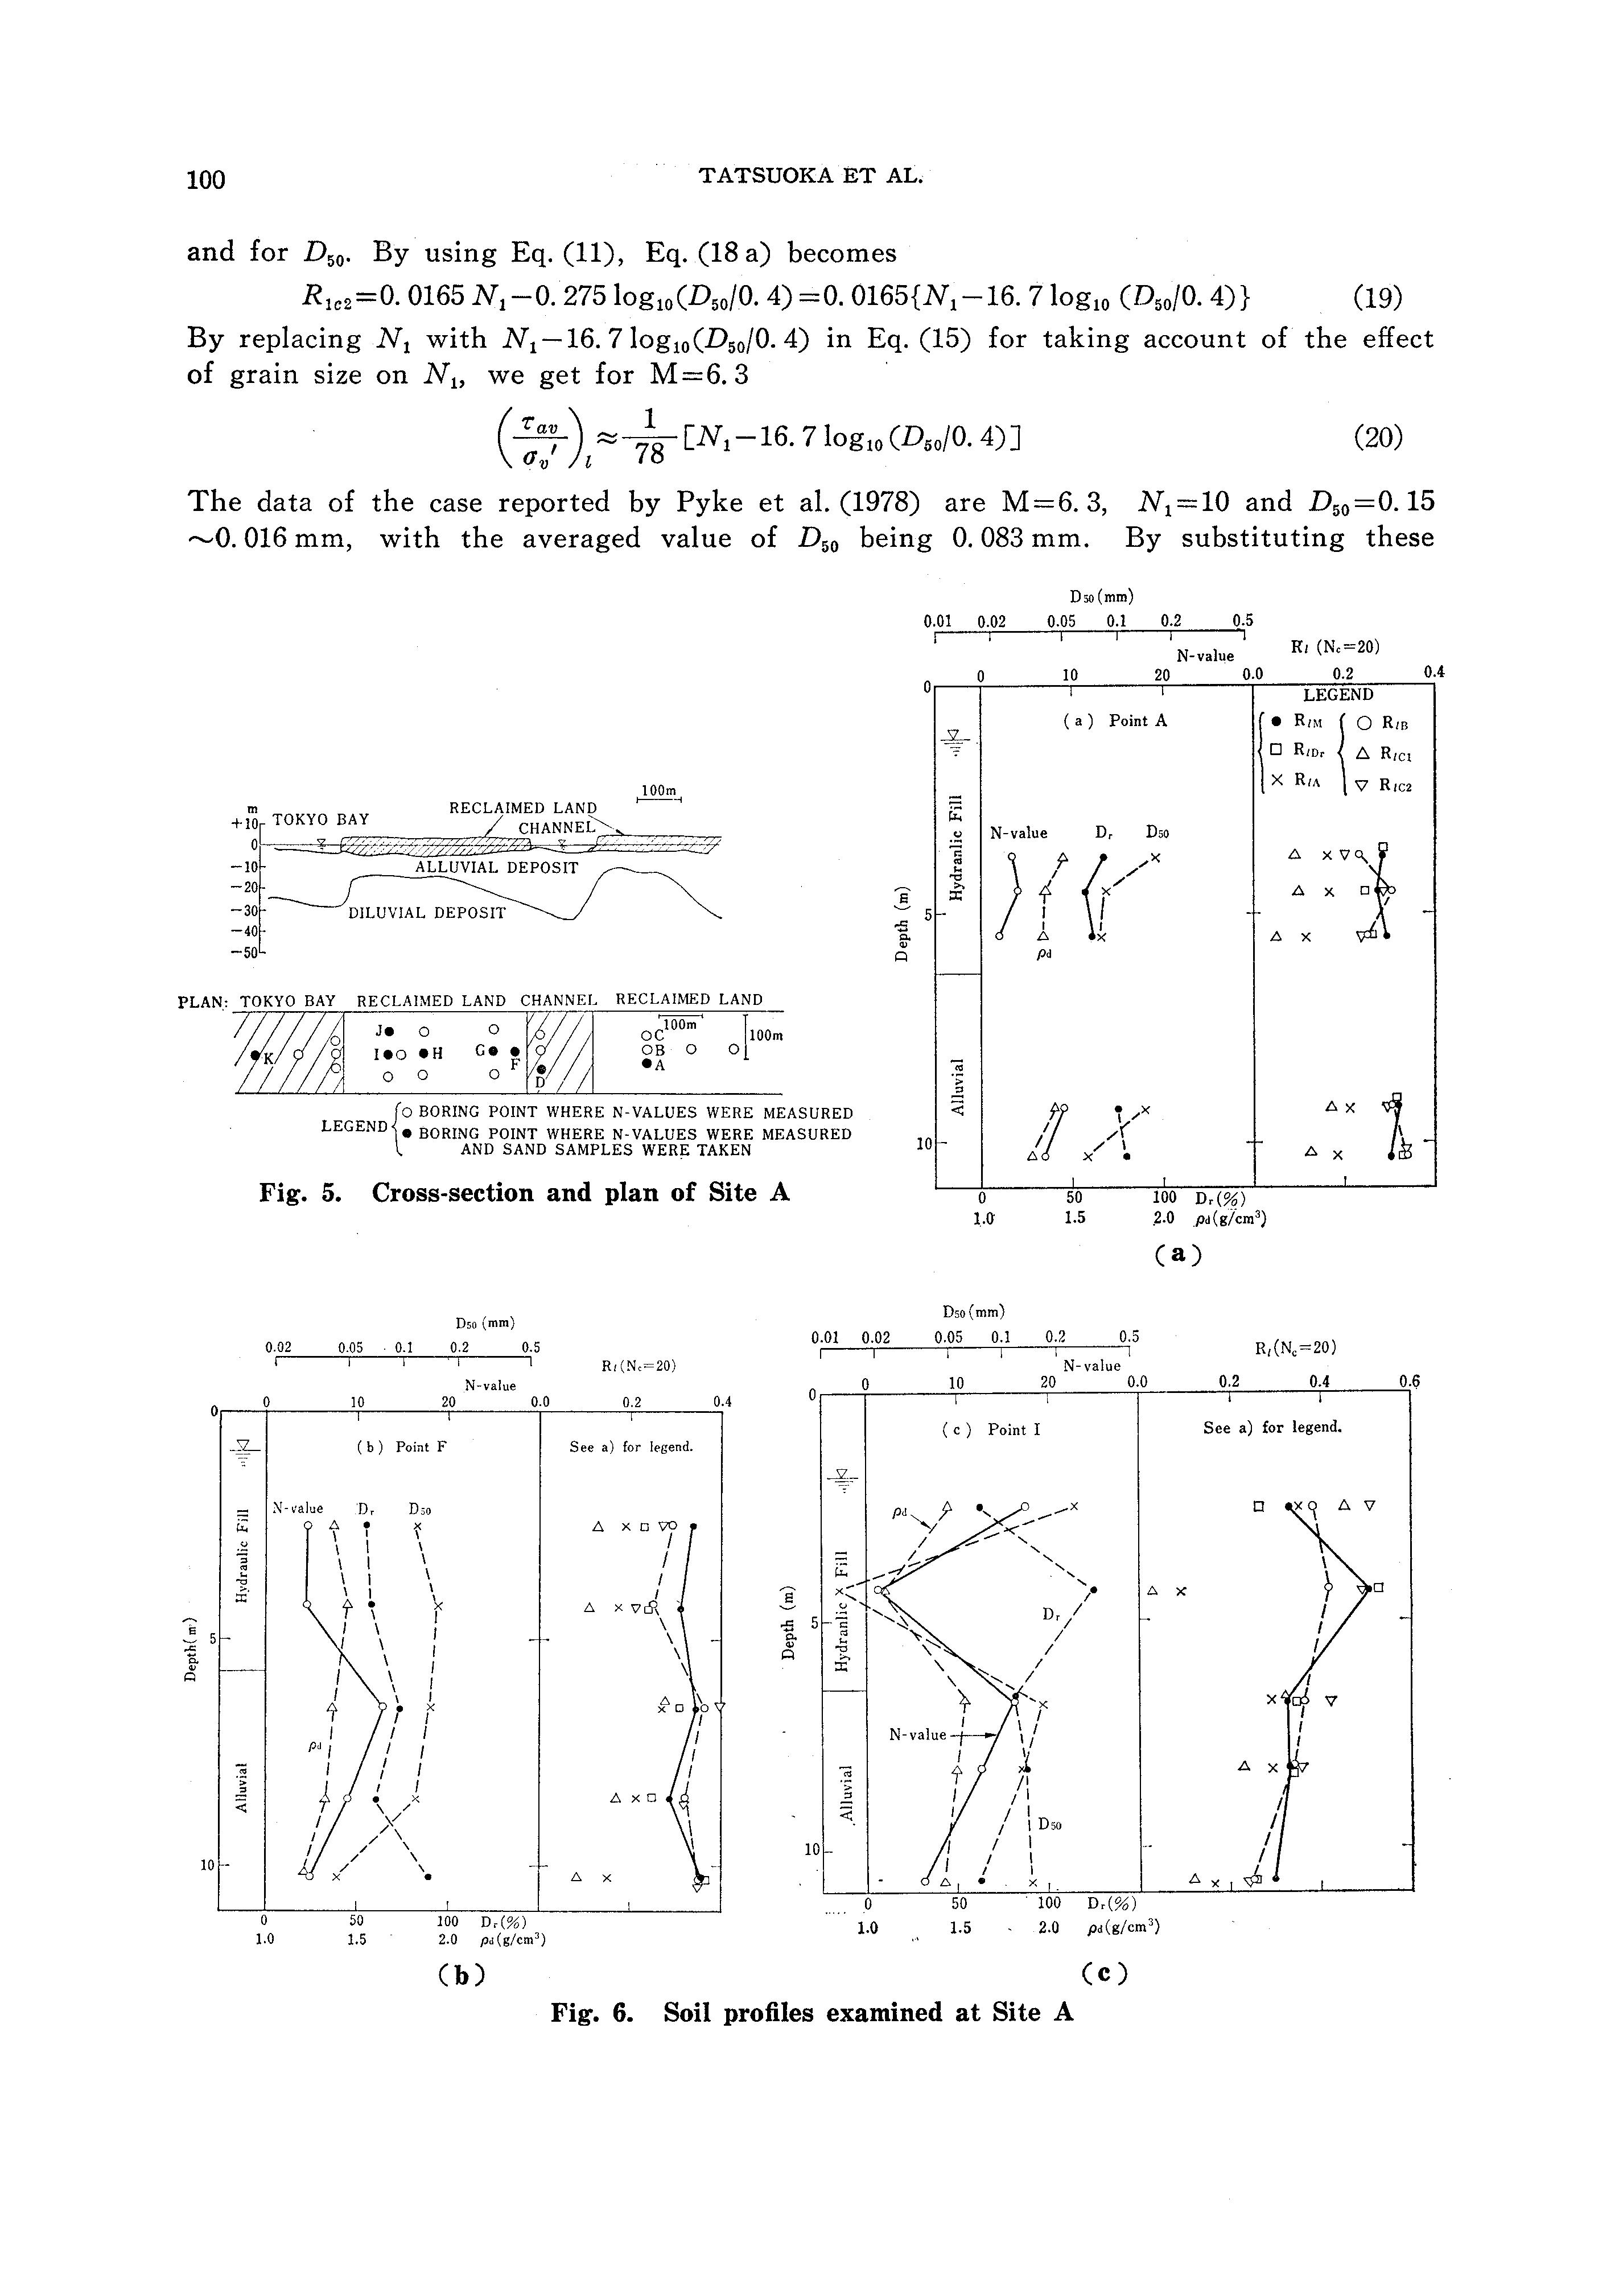
m RECLAIMED LAND +10LYO BAY
{ O BORING POINT WHERE N-VALUES WERE MEASURED LEGEND e BORING POINT
Fig. 5. Cross-section and plan of Site A
Fig. 6. Soil profiles examined at Site A
values into Eq. (20), we get (T'av/a,/)i of around 0. 274, which is much larger than 0.128 estimated by Eq. (15) and is well comparable with the value of 0. 2 or more which was the strength estimated from the recorded acceleration. It should be emphasized here that Eq. (18) is a result of one trial to improve Eq. (14) for taking account of the effects of grading or grain size on N-values. Eq. (18) should be improved in future based on our improved knowledges.
SOME APPLICATIONS
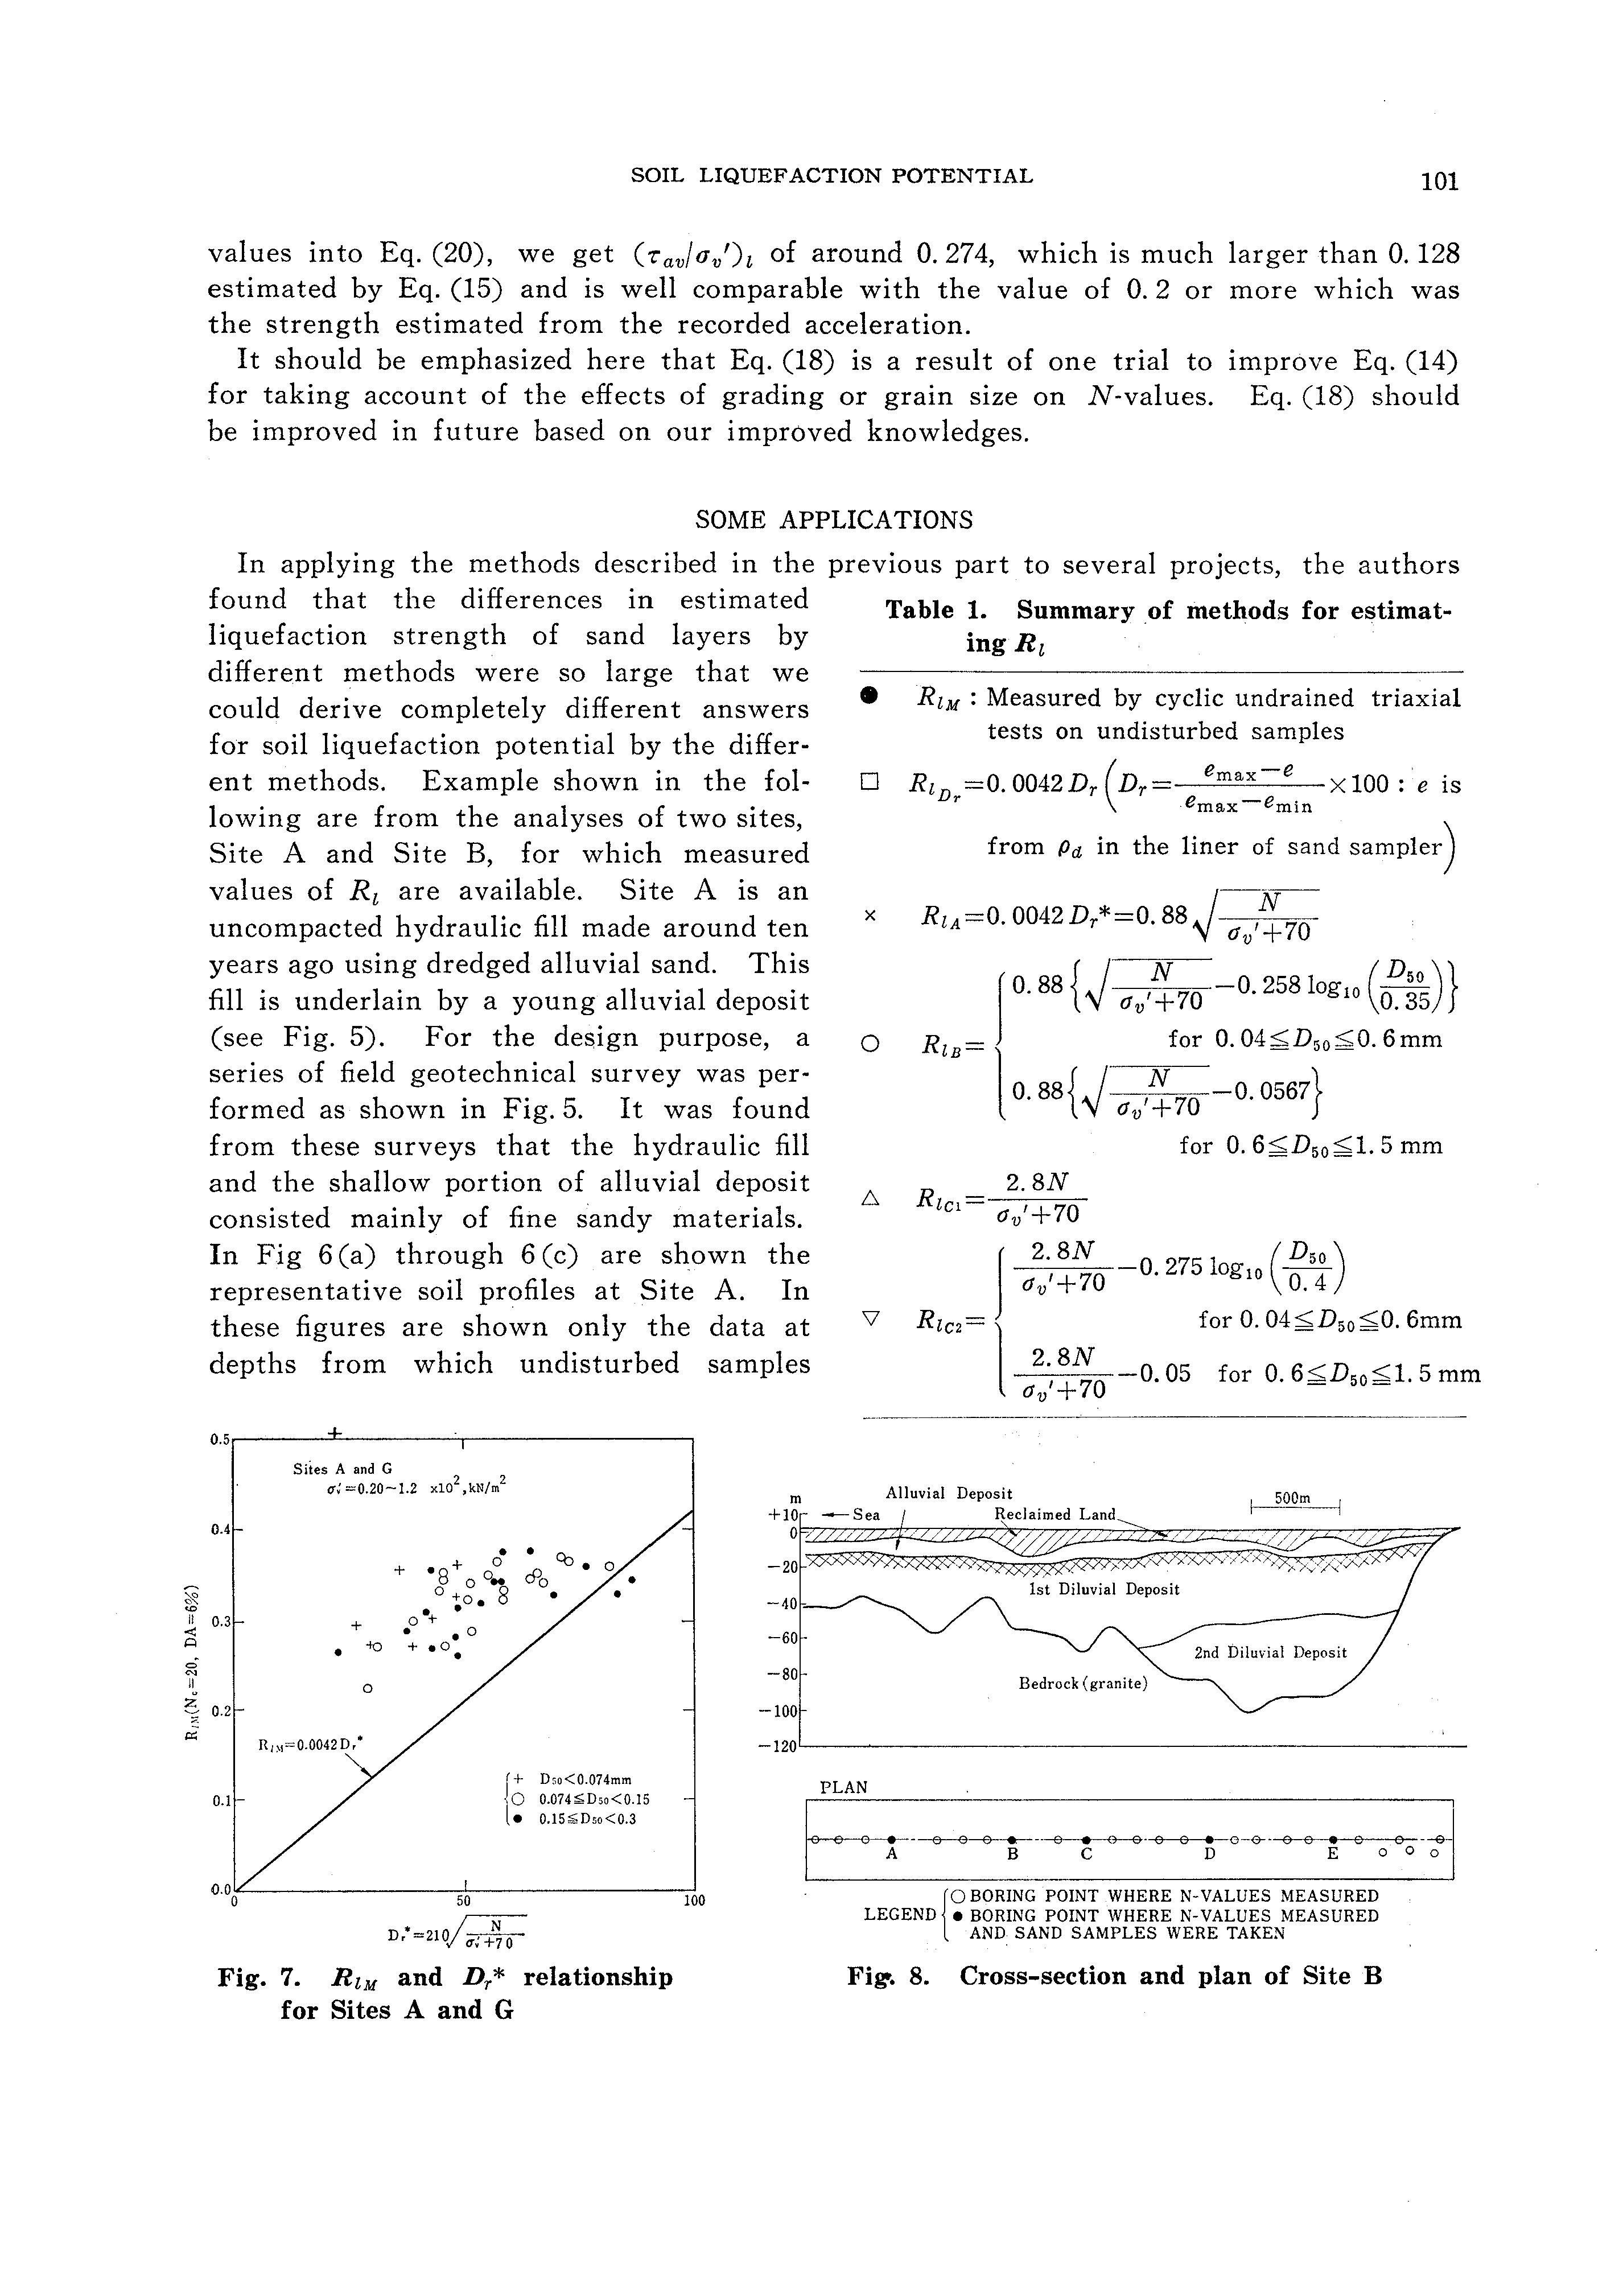
Table 1. Summary of methods for estimating Rt
RiM : Measured by cyclic undrained triaxial tests on undisturbed samples ( emax-e
Ri Dr =0. 0042 Dr Dr X 100 : e is Cmax-emin from Pa in the liner of sand sampler)
= lo. 88 { 0
0. 88 70 -0. 0567} for 0. 5 mm Rici 2.8N l1v'+70
2.BN ( D5o) l1v 1 +70 o. 21s 1og1 0 TI
In applying the methods described in the previous part to several projects, the authors found that the differences in estimated liquefaction strength of sand layers by different methods were so large that we could derive completely different answers for soil liquefaction potential by the different methods. Example shown in the following are from the analyses of two sites, Site A and Site B, for which measured values of Ri are available. Site A is an uncompacted hydraulic fill made around ten years ago using dredged alluvial sand. This fill is underlain by a young alluvial deposit (see Fig. 5). For the design purpose, a series of field geotechnical survey was performed as shown in Fig. 5. It was found from these surveys that the hydraulic fill and the shallow portion of alluvial deposit consisted mainly of fine sandy materials. In Fig 6 (a) through 6 (c) are shown the representative soil profiles at Site A. In these figures are shown only the data at depths from which undisturbed samples
for 0. 6mm 2.BN 0.05 for 0. 5 mm O'v'+70
2nd Diluvial Deposit
Bedrock (granite)
0.1
r + Dso<0.074mm jO o.074:;;Dso<0.15 [e 0.15:;;Dso<0.3 O.OO"'----------,,c50--------:-'IOO ..D, =210/ cr:+70
Fig. 7. RtM and Dr* relationship for Sites A and G
0 BORING POINT WHERE N-VALUES MEASURED LEGEND e BORING POINT WHERE N-VALUES MEASURED AND SAND SAMPLES WERE TAKEN
8. Cross-section and plan of Site B
T ATSUOKA ET AL.
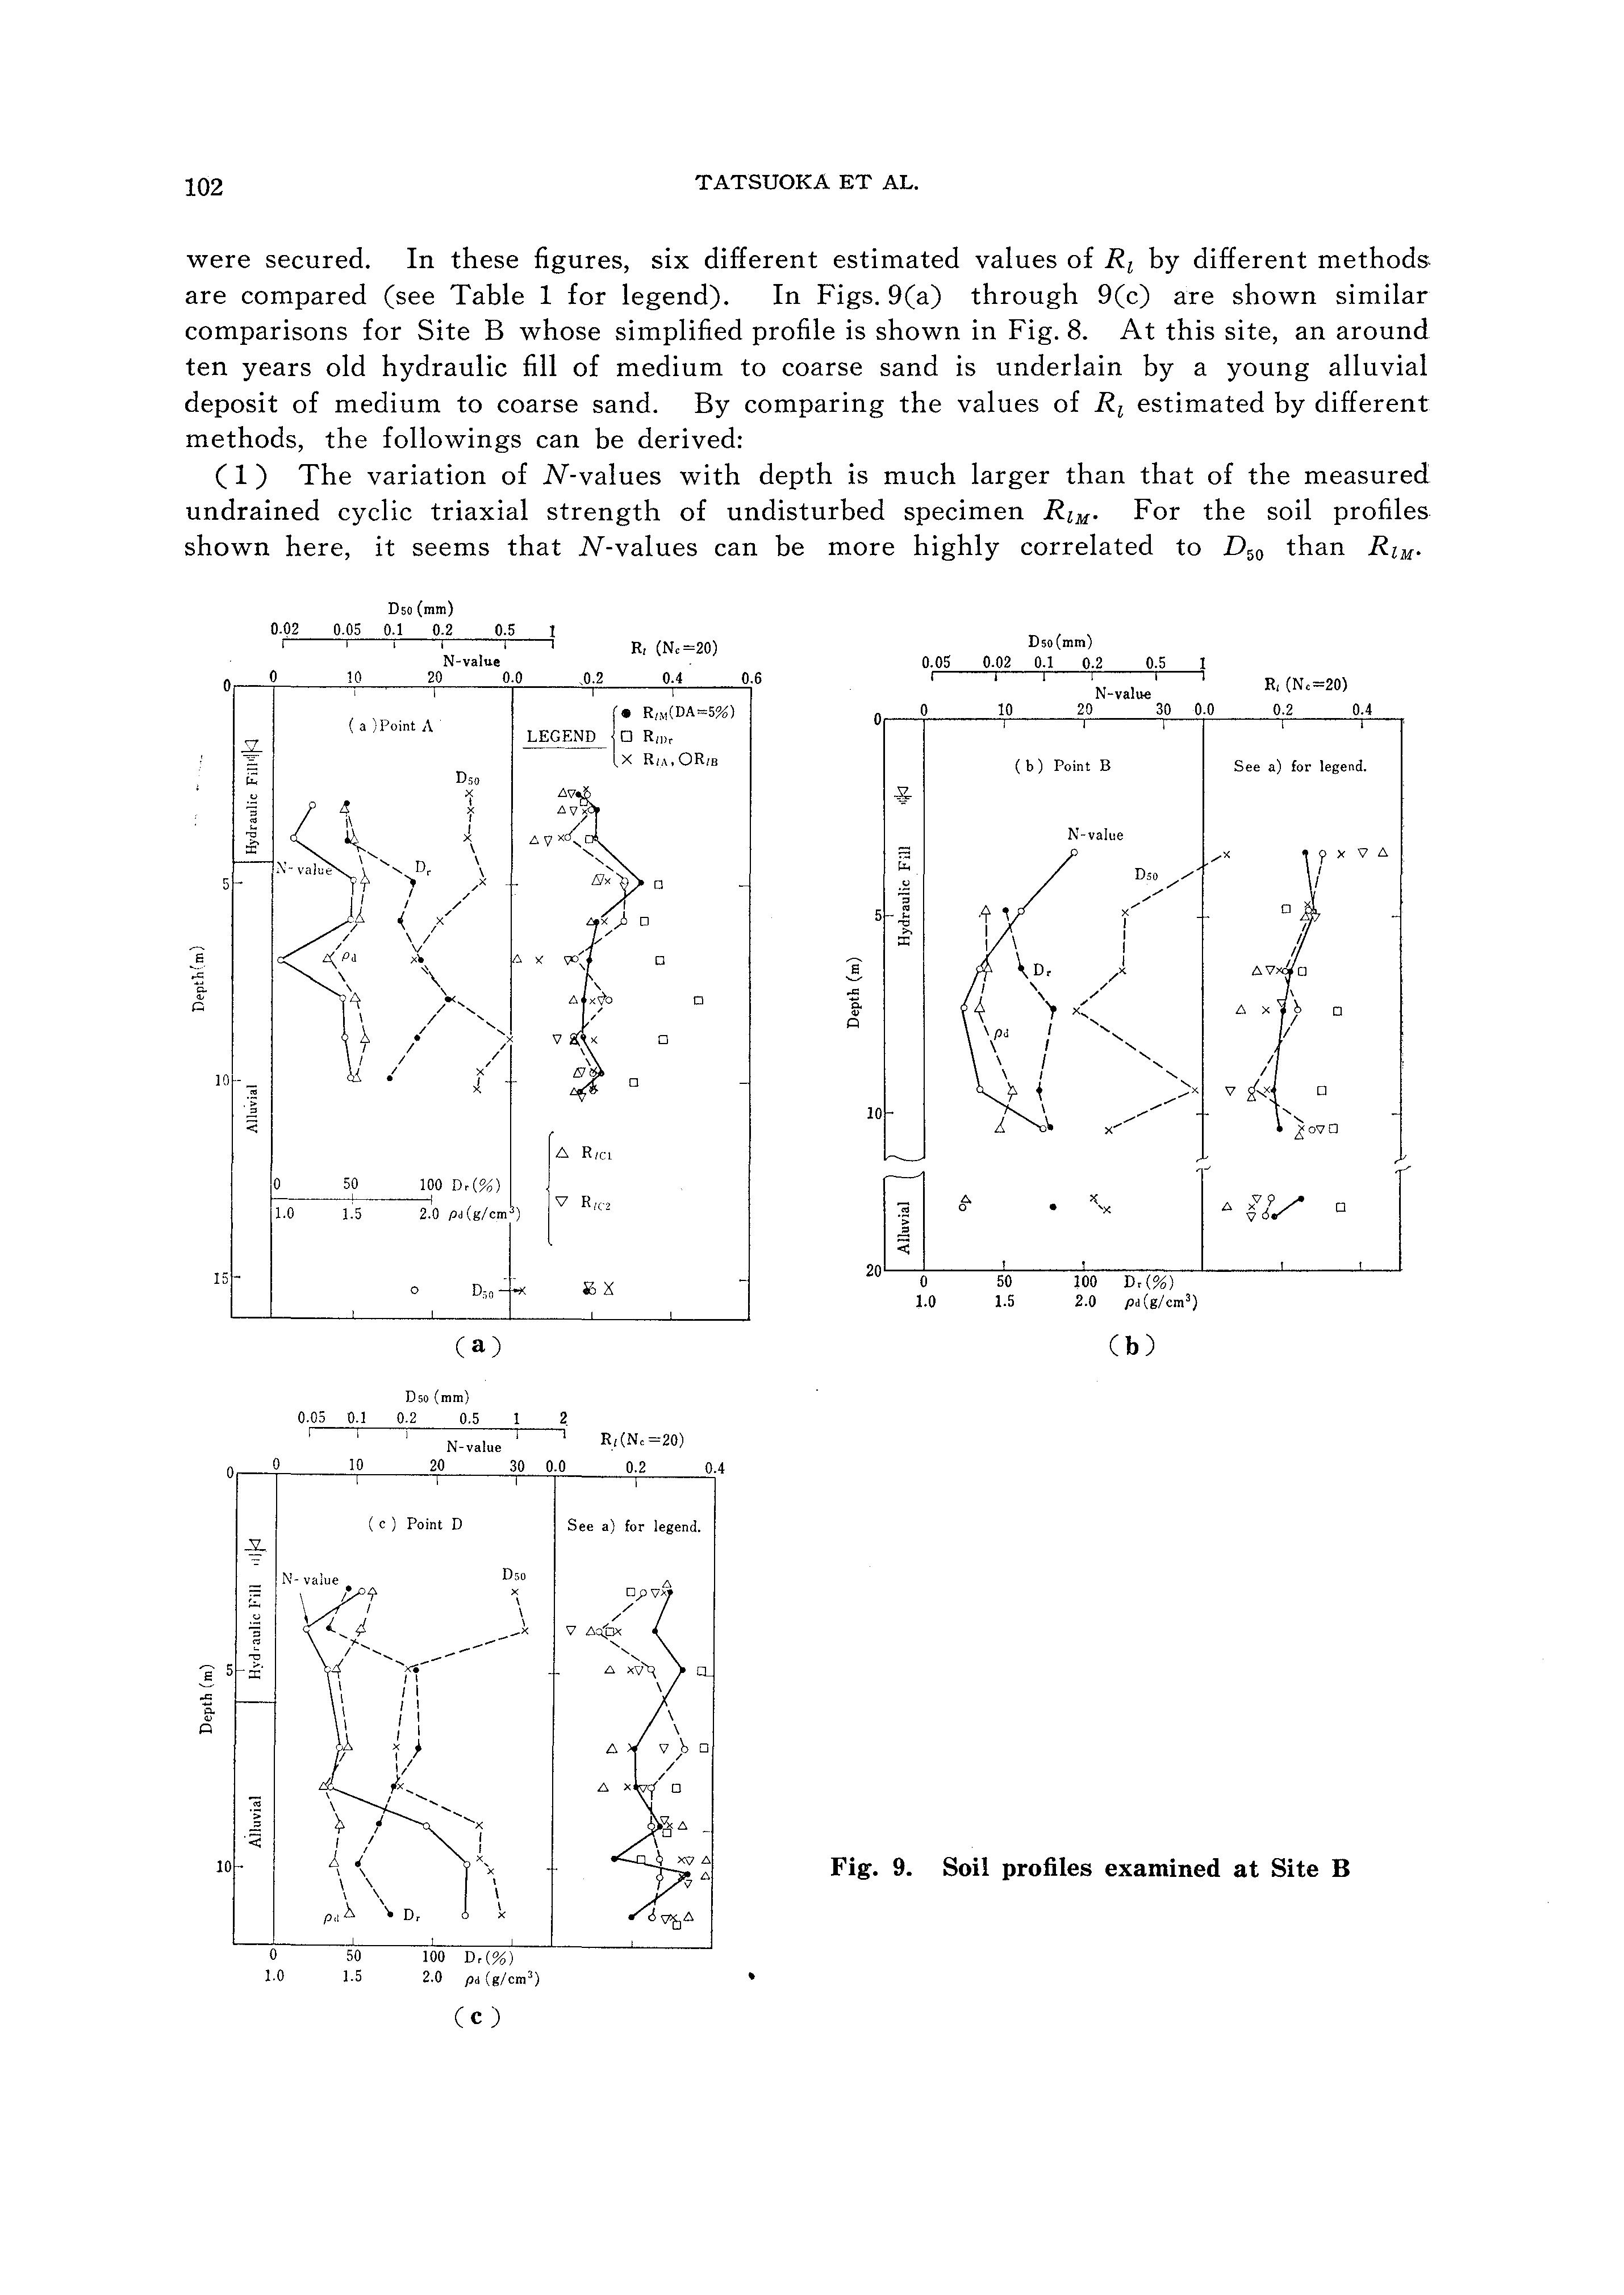
were secured. In these figures, six different estimated values of Ri by different methods. are compared (see Table 1 for legend). In Figs. 9(a) through 9(c) are shown similar comparisons for Site B whose simplified profile is shown in Fig. 8. At this site, an around ten years old hydraulic fill of medium to coarse sand is underlain by a young alluvial deposit of medium to coarse sand. By comparing the values of Ri estimated by different methods, the followings can be derived:
( 1) The variation of N-values with depth is much larger than that of the measured undrained cyclic triaxial strength of undisturbed specimen RtM· For the soil profiles shown here, it seems that N-values can be more highly correlated to D 50 than RtM·
9. Soil profiles examined at Site B
Fig.
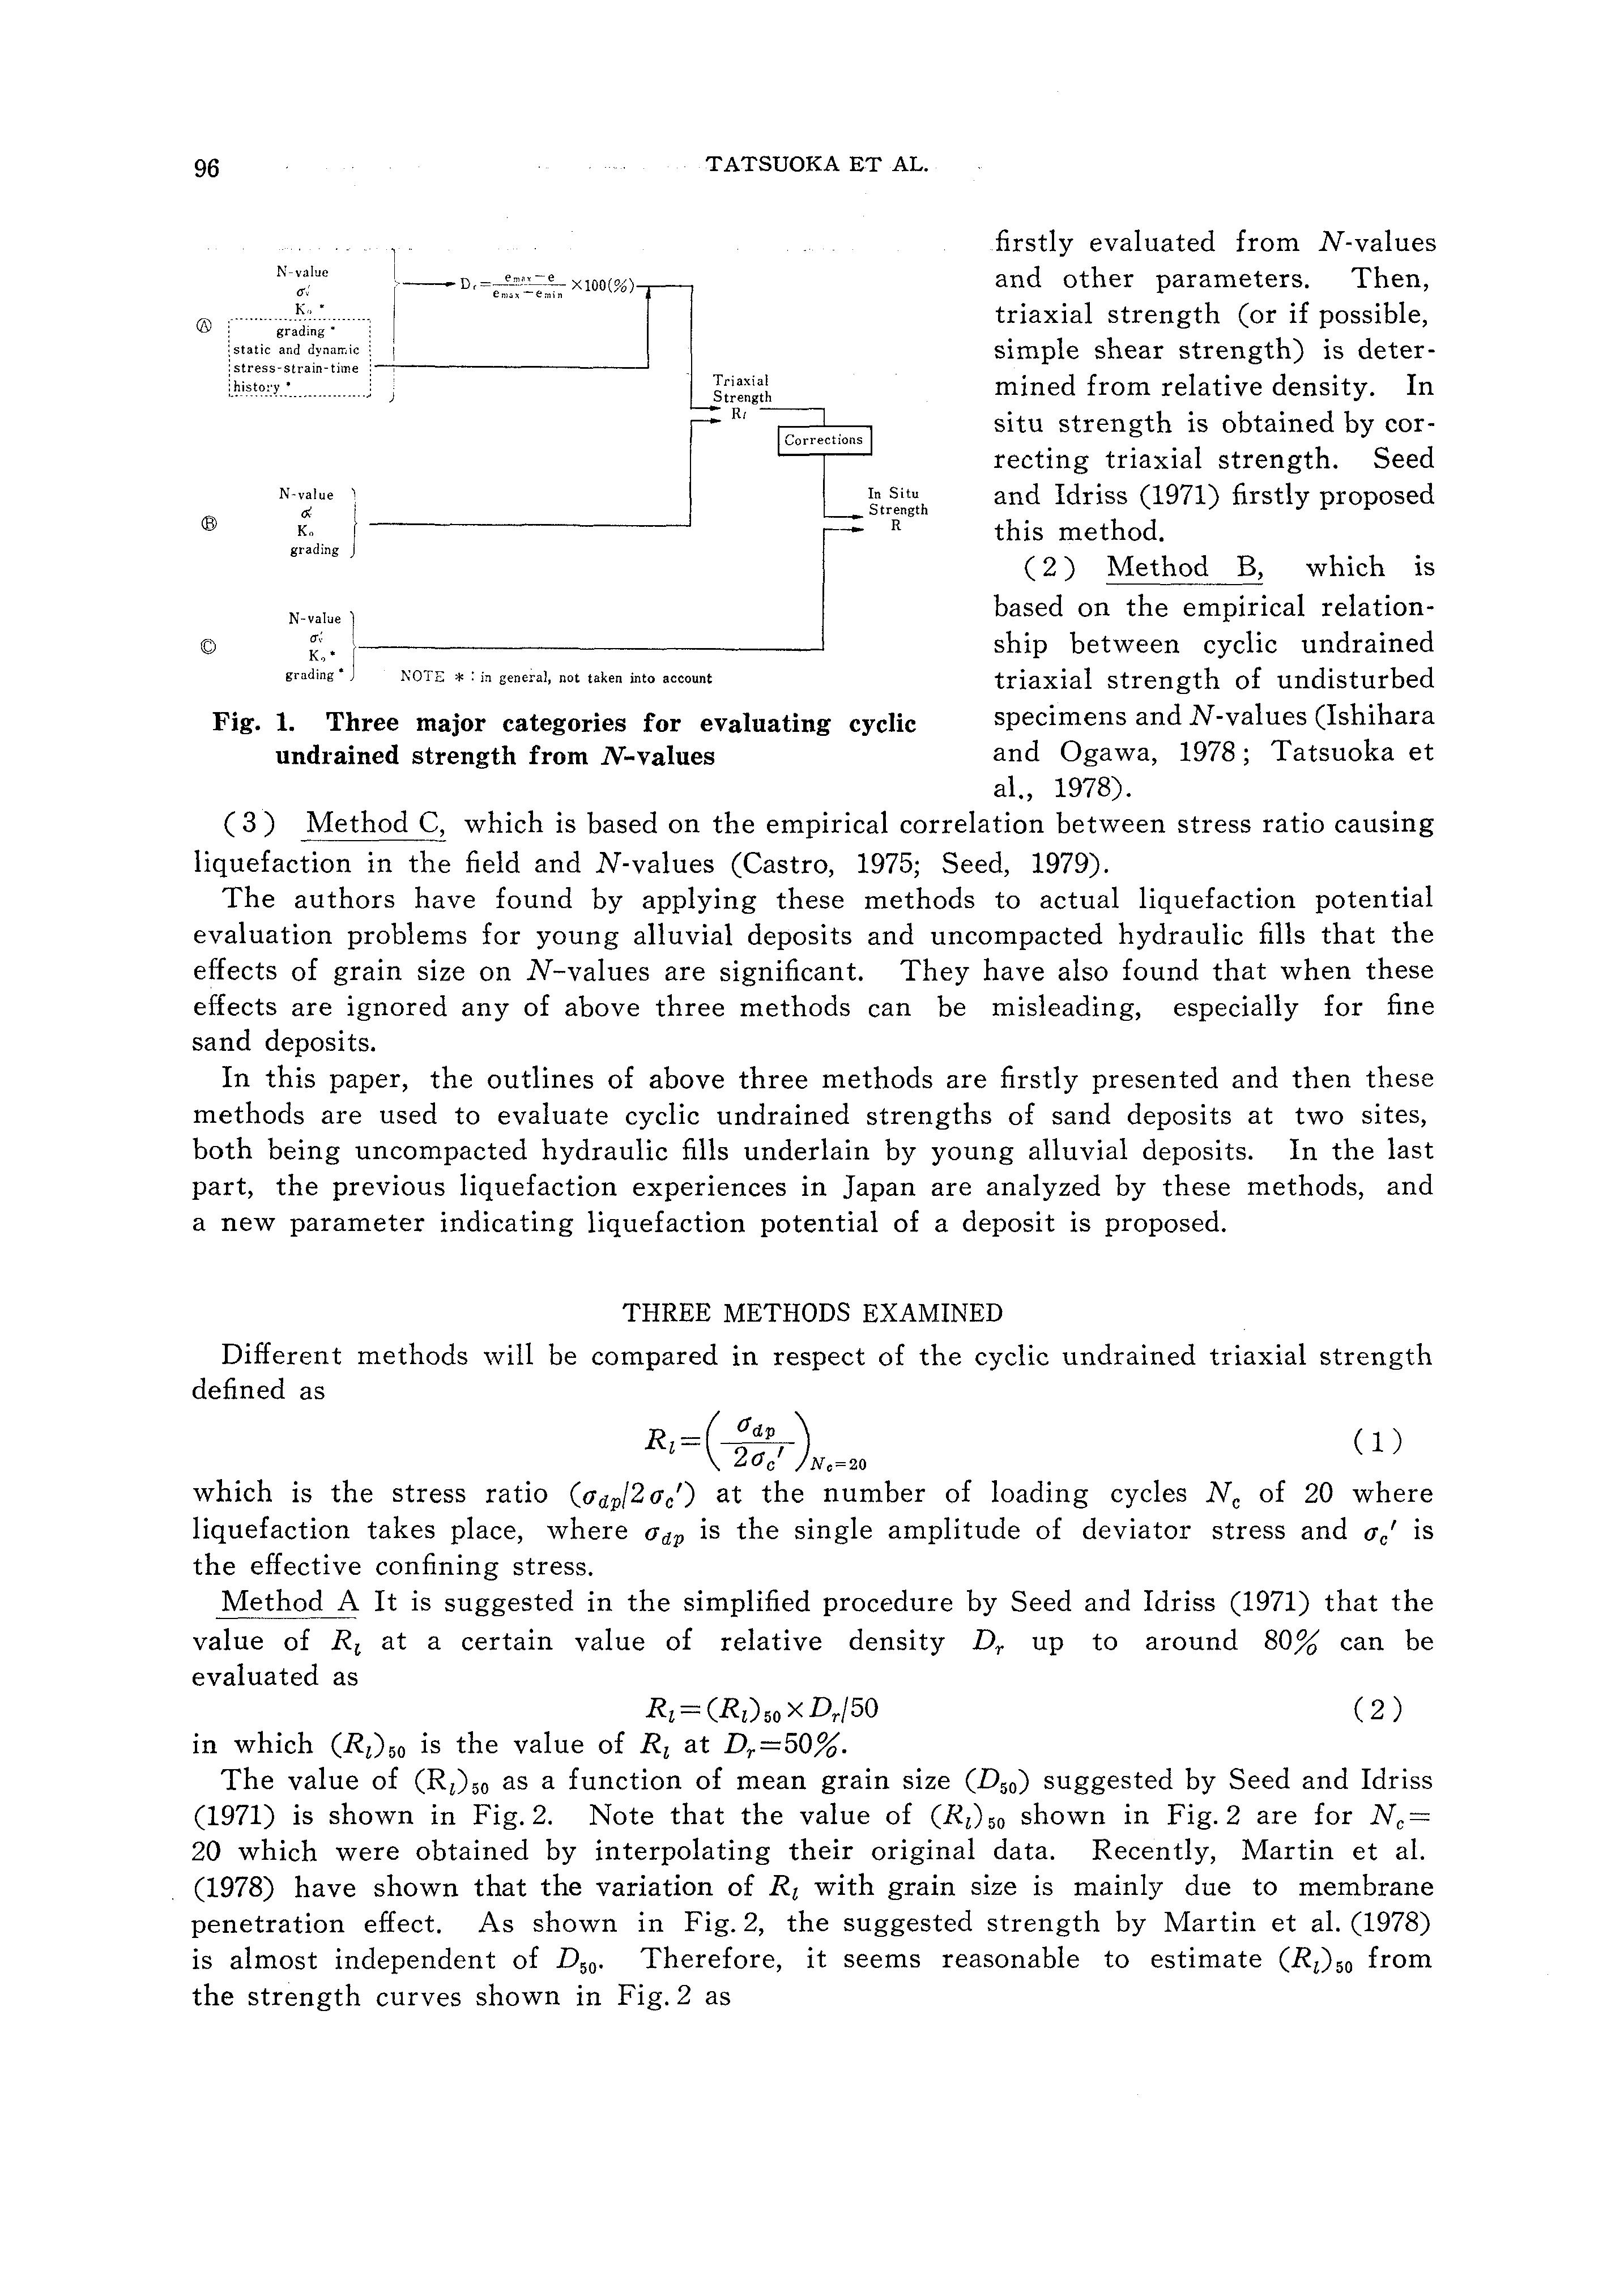
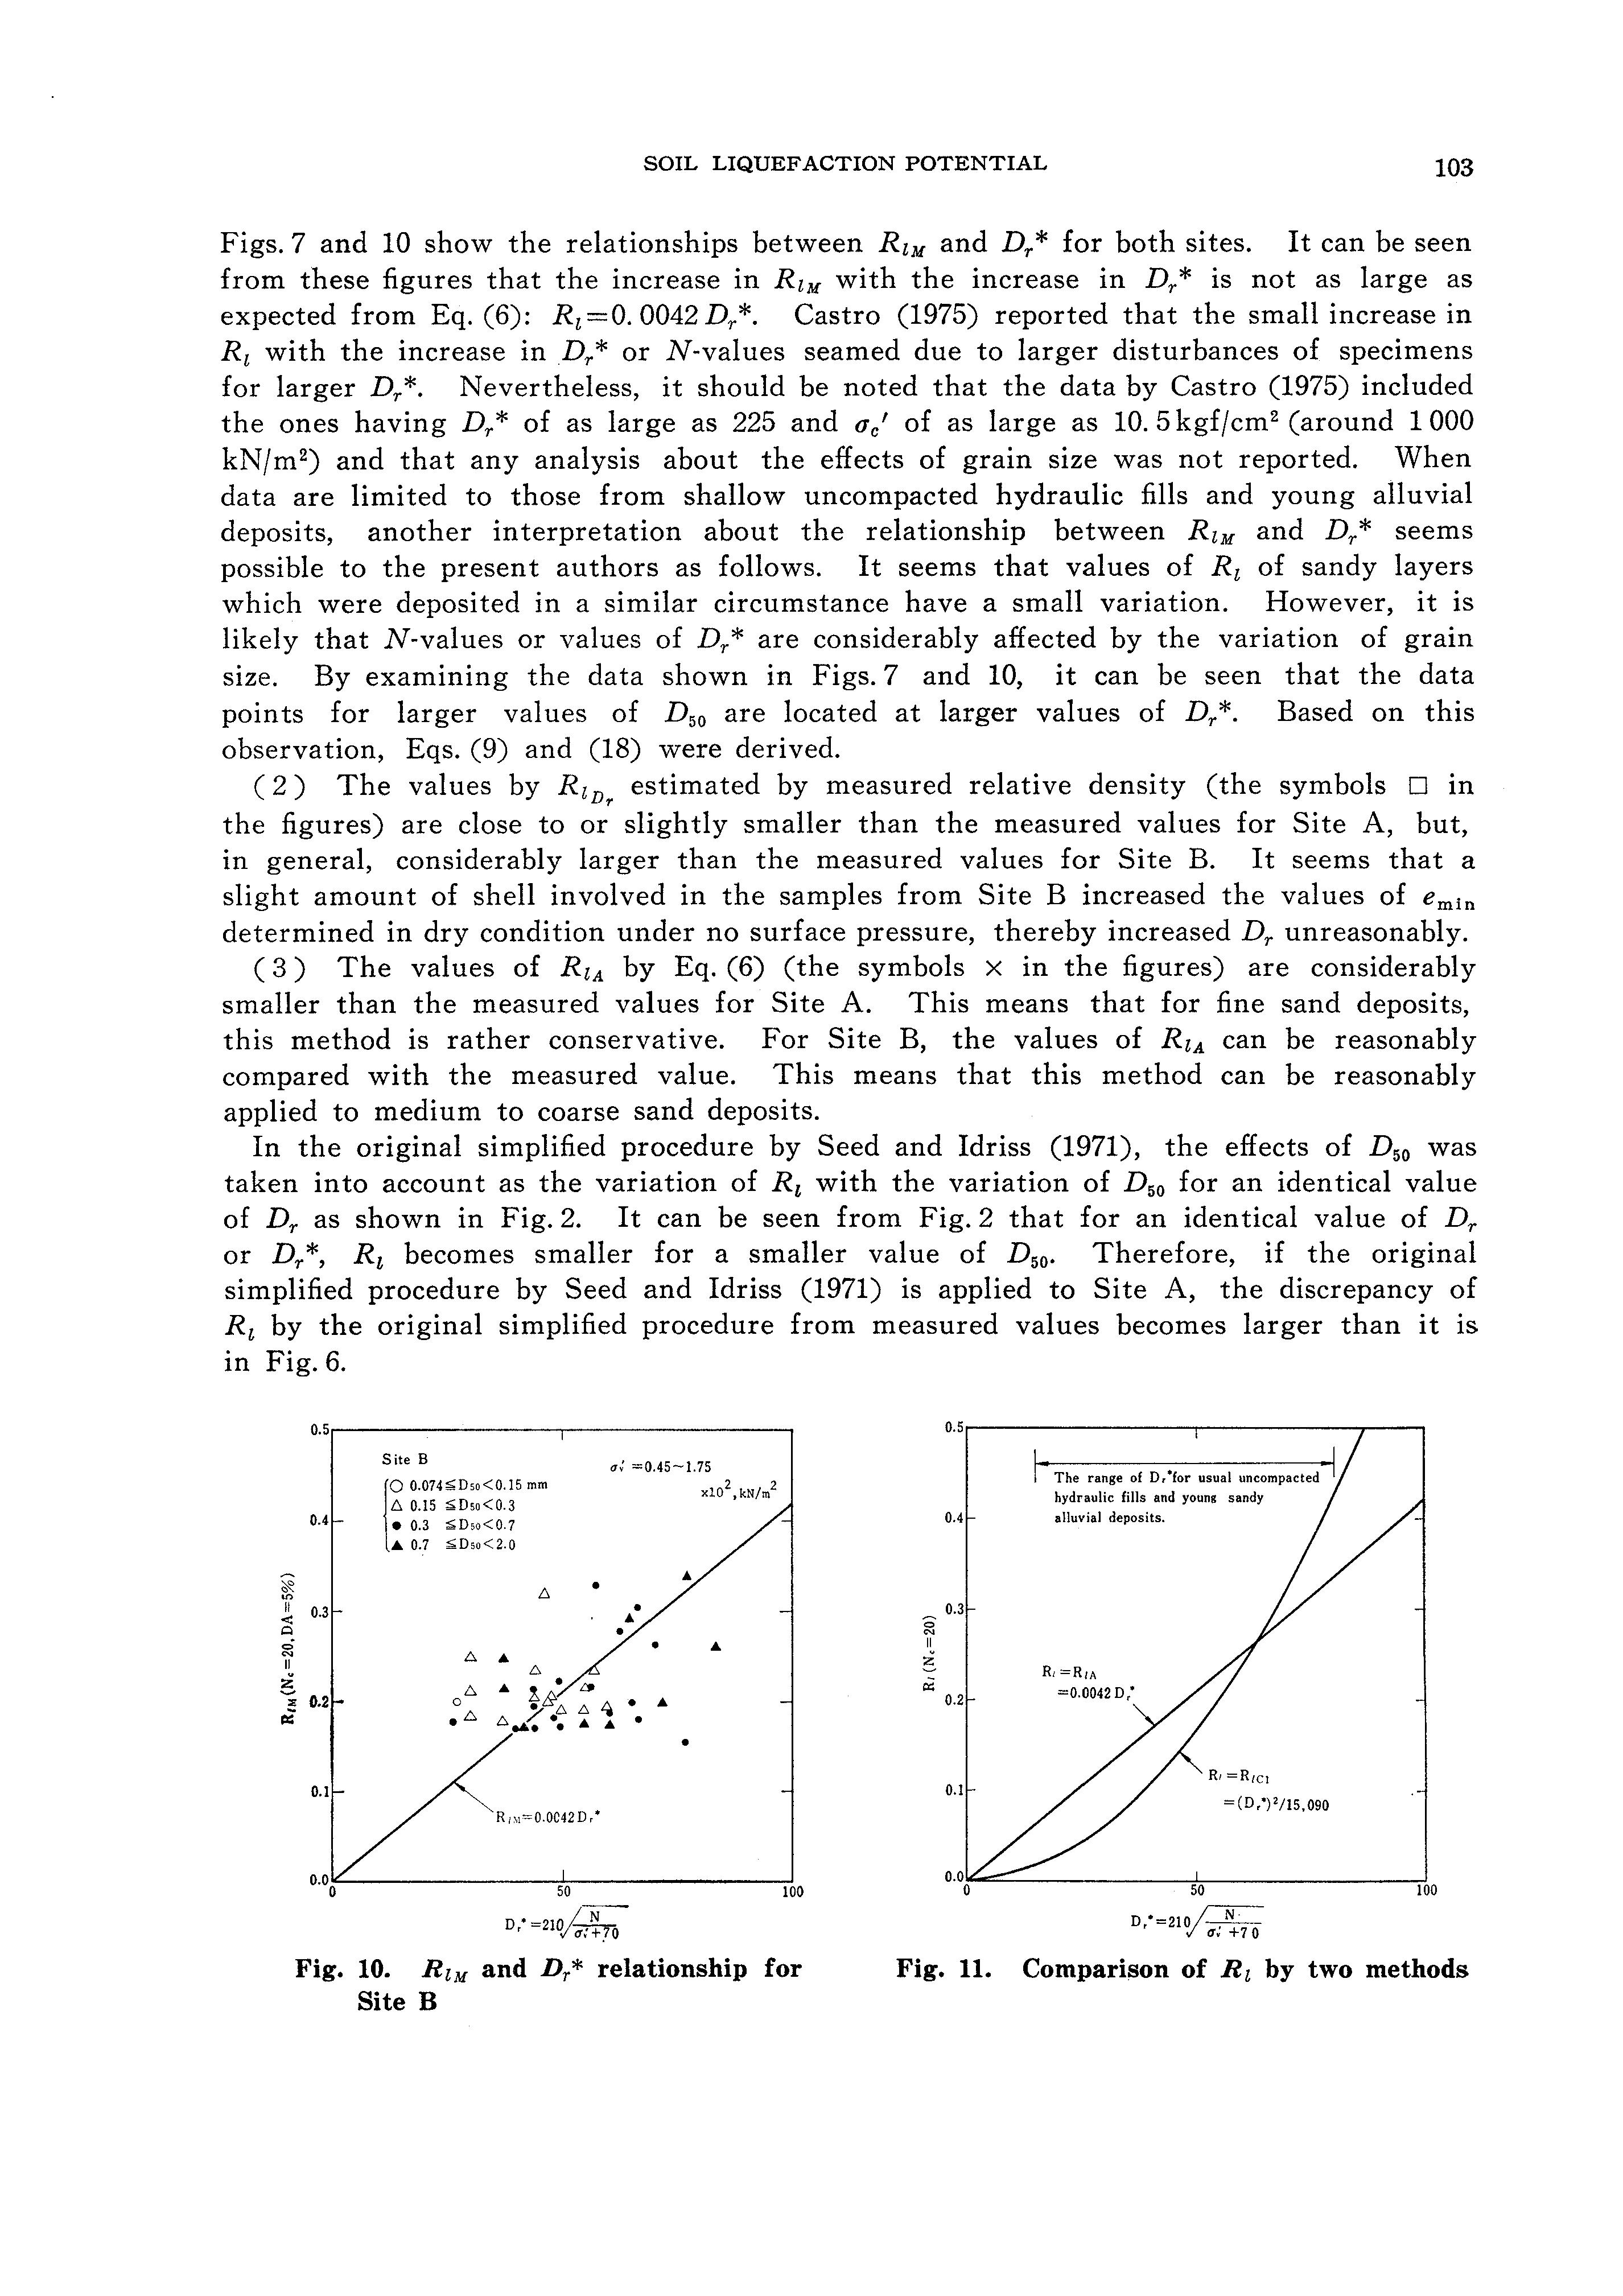
Figs. 7 and 10 show the relationships between RiM and Dr* for both sites. It can be seen from these figures that the increase in RiM with the increase in Dr* is not as large as expected from Eq. (6): Ri =0. 0042 Dr*. Castro (1975) reported that the small increase in Ri with the increase in Dr* or N-values seamed due to larger disturbances of specimens for larger Dr*. Nevertheless, it should be noted that the data by Castro (1975) included the ones having Dr* of as large as 225 and <Jc' of as large as 10. 5 kgf/cm 2 (around 1000 kN/m 2) and that any analysis about the effects of grain size was not reported. When data are limited to those from shallow uncompacted hydraulic fills and young alluvial deposits, another interpretation about the relationship between RiM and Dr* seems possible to the present authors as follows. It seems that values of Ri of sandy layers which were deposited in a similar circumstance have a small variation. However, it is likely that N-values or values of Dr* are considerably affected by the variation of grain size. By examining the data shown in Figs. 7 and 10, it can be seen that the data points for larger values of D 50 are located at larger values of Dr*. Based on this observation, Eqs. (9) and (18) were derived.
( 2) The values by RiDr estimated by measured relative density (the symbols D in the figures) are close to or slightly smaller than the measured values for Site A, but, in general, considerably larger than the measured values for Site B. It seems that a slight amount of shell involved in the samples from Site B increased the values of emin determined in dry condition under no surface pressure, thereby increased Dr unreasonably.
( 3) The values of RiA by Eq. (6) (the symbols x in the figures) are considerably smaller than the measured values for Site A. This means that for fine sand deposits, this method is rather conservative. For Site B, the values of RiA can be reasonably compared with the measured value. This means that this method can be reasonably applied to medium to coarse sand deposits.
In the original simplified procedure by Seed and Idriss (1971), the effects of D 50 was taken into account as the variation of Ri with the variation of D 50 for an identical value of Dr as shown in Fig. 2. It can be seen from Fig. 2 that for an identical value of Dr or Dr*, Ri becomes smaller for a smaller value of D 50 • Therefore, if the original simplified procedure by Seed and Idriss (1971) is applied to Site A, the discrepancy of Ri by the original simplified procedure from measured values becomes larger than it is m Fig. 6.
Fig. 10. RiM and Dr* relationship for Site B
Fig. 11. Comparison of Ri by two methods
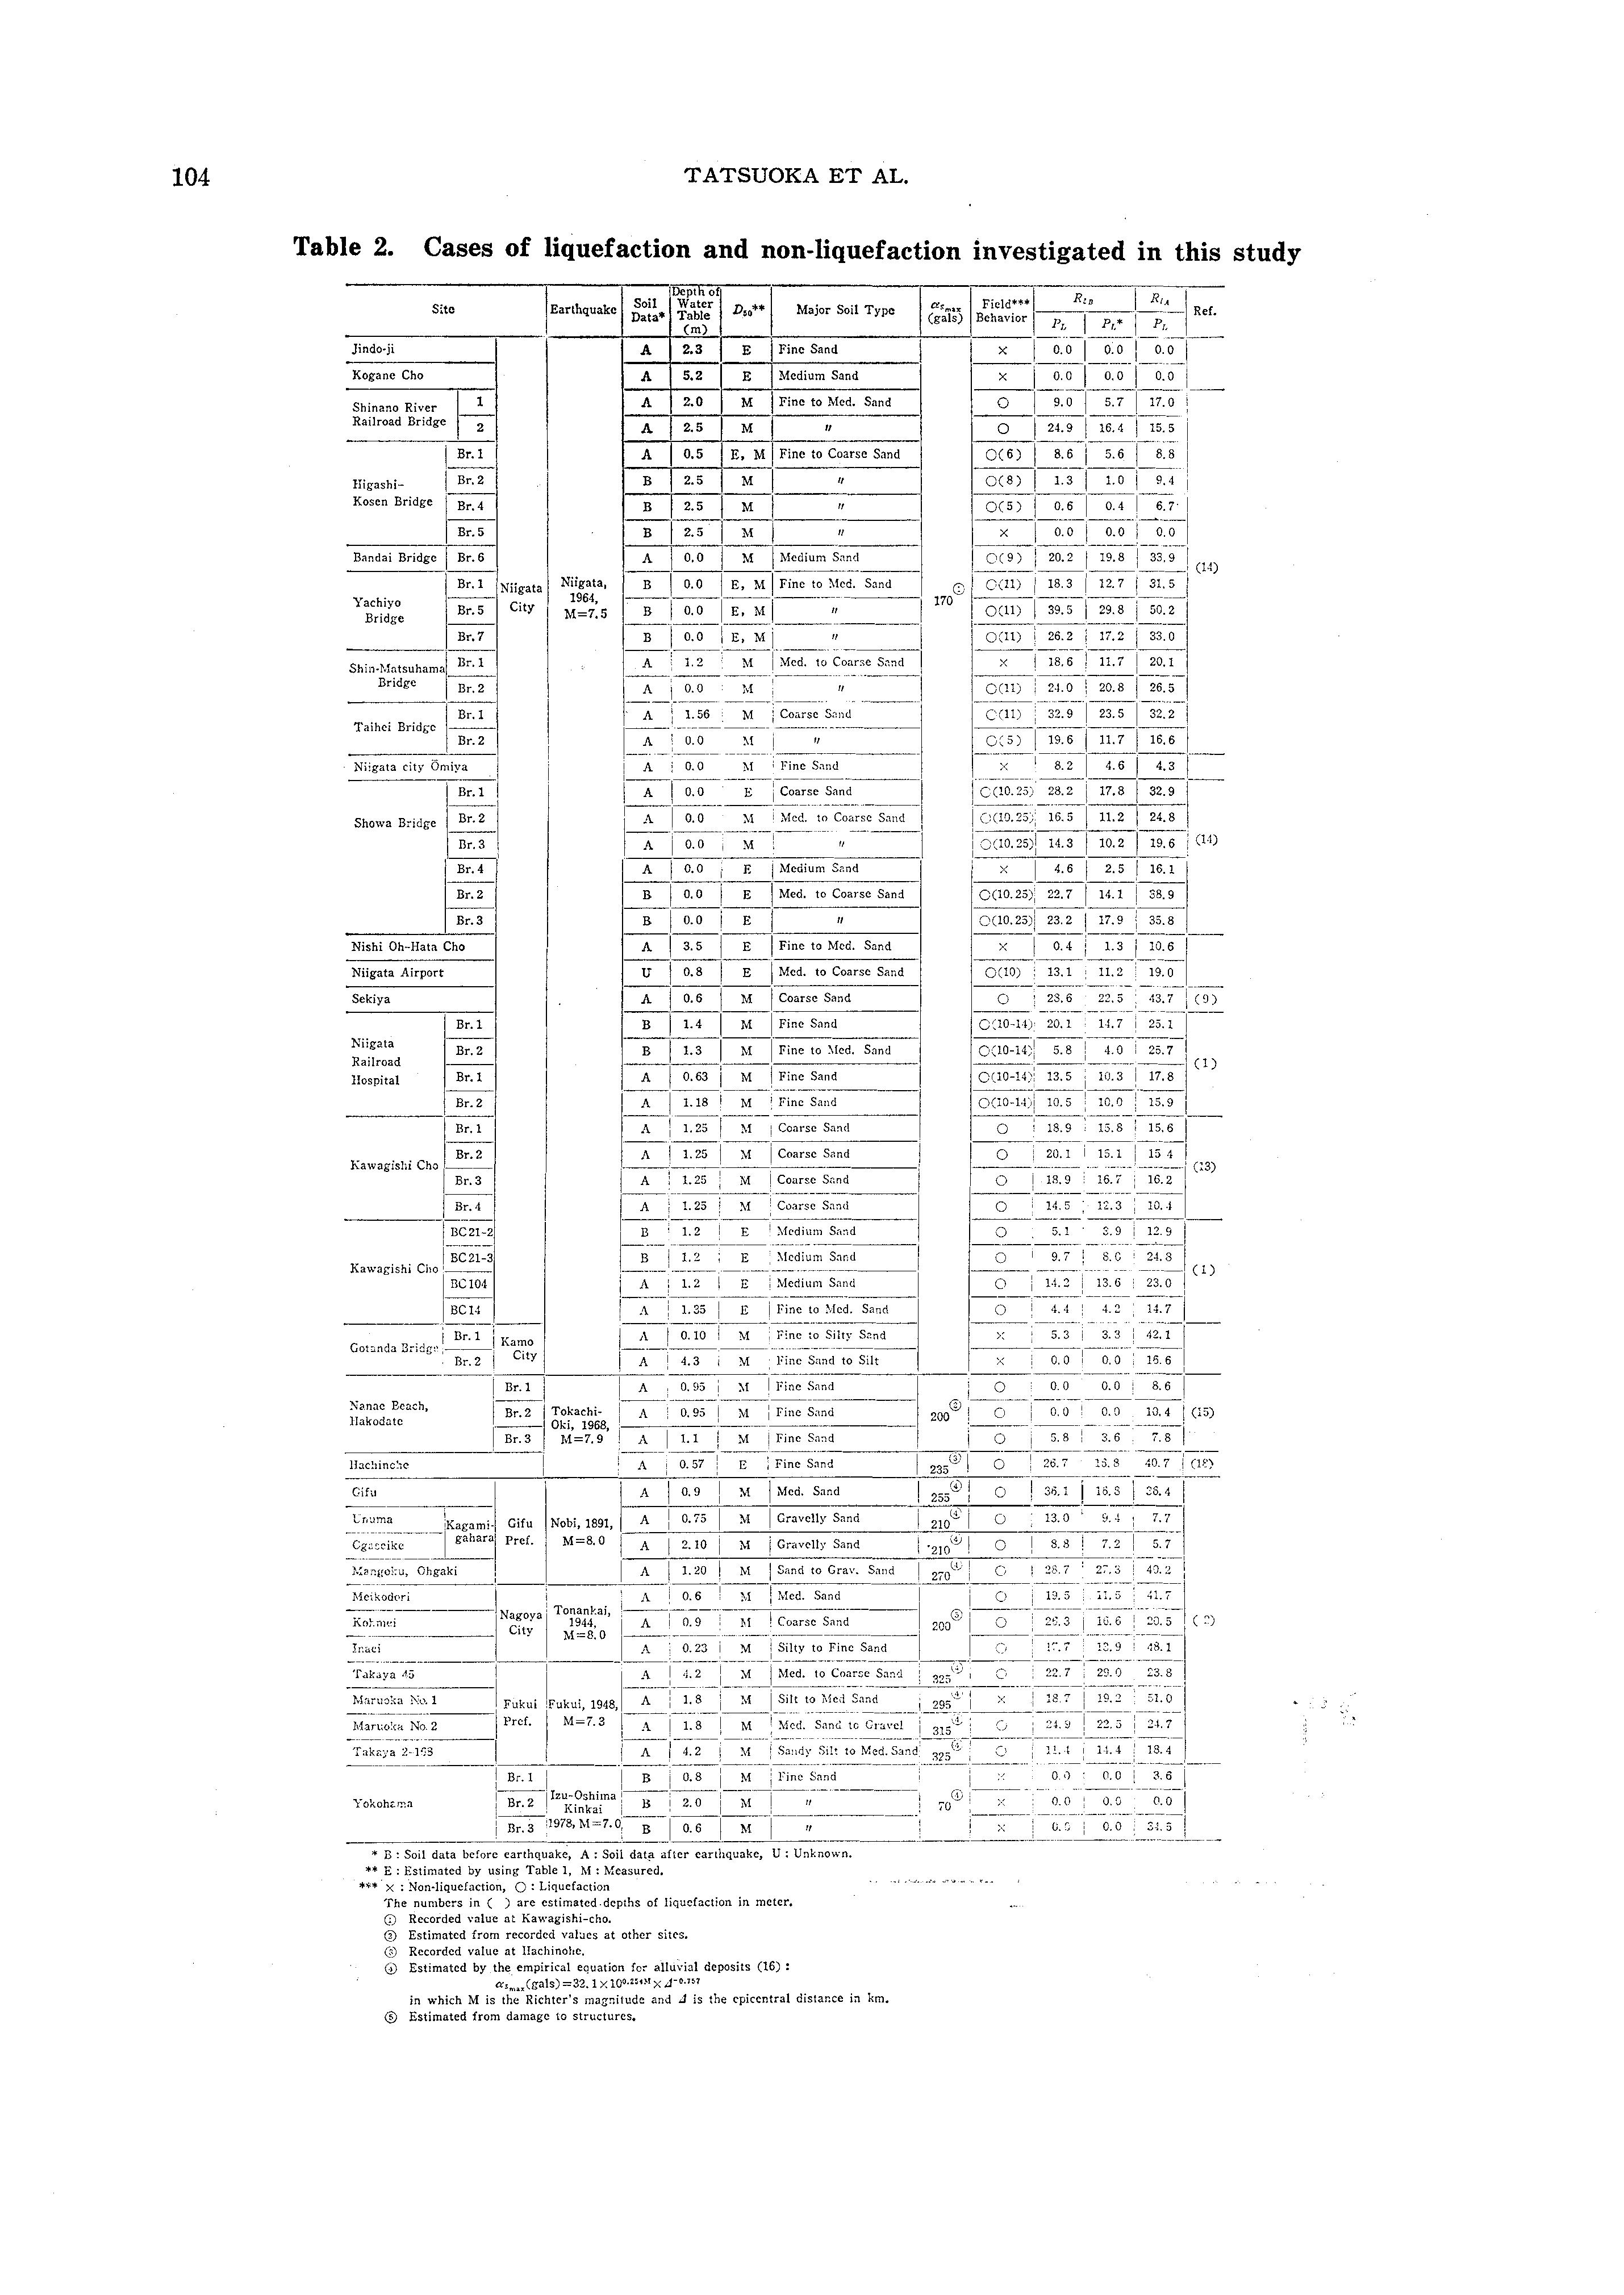
Table 2. Cases of liquefaction and non-liquefaction investigated in this study
Jindo·ji
Kogane Cho
Shinano River Railroad Bridge
I Br.!
Higashi-
Kosen Bridge I Br. 4 Br.5
Bandai Bridge I Br. 6
Yachiyo Bridge Br.5 City Br.7
Bridge Br. 2
Taihci Bridi;c Br.2
Niigata city Omiya i
:::: : Br.3
Nishi Oh-Hata Cho
Niigata Airport
Sekiya
Niigata Railroad Hospital
N"nac Beach, 1Iakodatc Br.1 Br.2 Br. I
* B: Soil data before earthquake, A: Soil after earthquake, U: Unknown.
** E : Estimated by using Table 1, M : Measured, *"'* x : Non-liquefaction, O : Liquefaction The numbers in ( ) are estimated.depths of liquefaction in meter.
CD Recorded value at Kawagishi-cho.
@ Estimated from recorded val:.ics at other sit('S,
@ Recorded value at Ua.chinolic, (i) Estimated by the empirical equation for alluvial deposits (16) : a 5max(gals) =32.1 x x in which M is the Richter's magnitude and J is the cpiccntral distar:ce in km.
® Estimated from damage to structures.
( 4) Both the values of Rls by Eq. (9) (the symbols O m the figures) and the ones of Rzc 2 by Eq. (18) (the symbols v in the figures) are, in general, in well agreement with the measured values for both sites. This means that for both sites, it is necessary to take account of the effects of grain size on N-values to obtain reasonable values of R 1 from N-values. At the same time, it can be seen by examining the data shown in Figs. 6 and 9 carefully that the values of RlB (the symbols O) are slightly closer to the measured values than the values of R1c 2 (the symbols v). This is because Rlc 2 is more sensitive to the variation of N-values than Rzs·
( 5) The values of Rici by Eq. (14) (the symbols D. in the figures) are considerably smaller than the measured values for smaller N-val ues and are larger than measured values for larger N-values. This is because Rici is very sensitive to the variation of N-values. Therefore, for fine sand deposits which have smaller N-values, Rici is extremely small. It is also noted that Rici is much smaller than RzA (the symbols x) for Site A. The difference between Rici and RtA is illustrated in Fig. 11. It can be seen that for the value of Dr* smaller than 50, R1c 1 is considerably smaller than RzA· By two reasons; no considerations about the effects of grain size on N-values and high sensitivity to the variation of N-values, R 1c1 seems significantly conservative for fine or silty sand deposits. In summary, it seems essential to the present authors to take account of the effects of grading or grain size on N-values in evaluating in situ cyclic undrained strength from N-values, especially for fine sands.
CASE STUDIES
To examine the validity of Eq. (9), which can be recommended at present, field data of liquefaction and non-liquefaction cases in Japan will be analyzed (see Table 2). In these analyses, the following index will be used to represent the degree of resistance of a soil element against liquefaction, (21)
in which FL is the liquefaction resistance factor, R is the resistance of a soil element and L is the cyclic load applied to the soil element. Both R and L will be defined later. In this method, the effects of diffusion of excess pore pressure during earthquake are not directly accounted for. The value of R can be related to Rias (Iwasaki et al., 1978) (22)
C 1 is the correction factor for the difference of in situ confining pressures from those in triaxial tests and has been proposed as (1 +2 K 0 )/3 by Ishihara and Li (1972). C 2 is that for the difference between in situ "random" loading forms during earthquake motions and the sinusoidal loading form in triaxial tests and has been proposed as 1/0. 55,........,1/0. 7 with the average being 1. 62 by Ishihara and Yasuda (1975). The value of C 2 can be related to the parameter b in Eq. (13) and the randomness of earthquake motions or earthquake magnitude and epicentral distance (Tatsuoka et al., 1980). As this relationship is not well established yet, the average value of 1. 62 will be used in this study. C 3 is that for the effects of soil disturbances in the process of sampling and handling. c4 is that for the effects of densification in the process of sampling and handling. As samples tested in this study are relatively loose, it is likely that some increases in strength due to densification occured. Because densification of samples is caused by disturbances during sampling and handling, these effects may cancel. Thus, the value of the product C 3 x C 4 was taken to be unity in this study. C 5 is the correction factor for the multi-direction shaking which may be anticipated in actual in situ loading conditions. According to Seed (1979) this factor is equal to 0. 9. Using the values of C 1 through C 5 described above,
Eq. (22) becomes
R=2/3x1. 62x1. 0 x 0. 9 x (23) for K 0 =0. 5. This value of K 0 can be considered adequate for uncompacted reclaimed lands and alluvial deposits which will be analyzed later.
The cyclic load L can be estimated as (24)
in which (-r/av')max is the maximum stress ratio during an earthquake motion, asmax is the estimated maximum acceleration on the ground surface in gals, g is the acceleration of gravity (980 gals), <Iv is the total overburden pressure, av' is the effective overburden pressure and rd is a stress reduction coefficient with a value less than 1 (Seed and Idriss, 1971).
Iwasaki et al. (1978) has reported that it was found by a comprehensive series of response analyses of soil layers that rd is a function of depth, the predominant period of input motion (Te) and the natural period (T g) of the site concerned. As a simple correlation among rd• Te (or M, LI), T g or so was not established yet, it was considered reasonable to estimate rd for the simplified method from the average relationship as rd= 1-0. 015 z (z: depth in meter) (25)
While the effects of earthquake magnitude M on FL are not taken into account in this method, these effects are taken into account in the method by Seed and Idriss (1971). By following their method, FL can be obtained as FL= Cr(ddp/2d/)Neq (26) 0. 65·asmaxfg·dvfdv' ·rd
Cr is 0. 63 for K 0=0. 5 by Seed (1979). As in Eq. (13), (adp/2 ac')N•q can be related to Ri for Nc=20 as (27)
The values of Neq were suggested by Seed (1979) as Neq=2l for M=8, Neq=lO for M=7 and Neq=4 for M=6. For the same values of Ri and rd, the ratio of FL by the method proposed here (Eqs. (23) and (24)) to that based on the Seed-Idriss method (Eqs. (26) and (27)) can be obtained as
__ _!'_L in this investigation FL based on Seed and Idriss (1971)
(28)
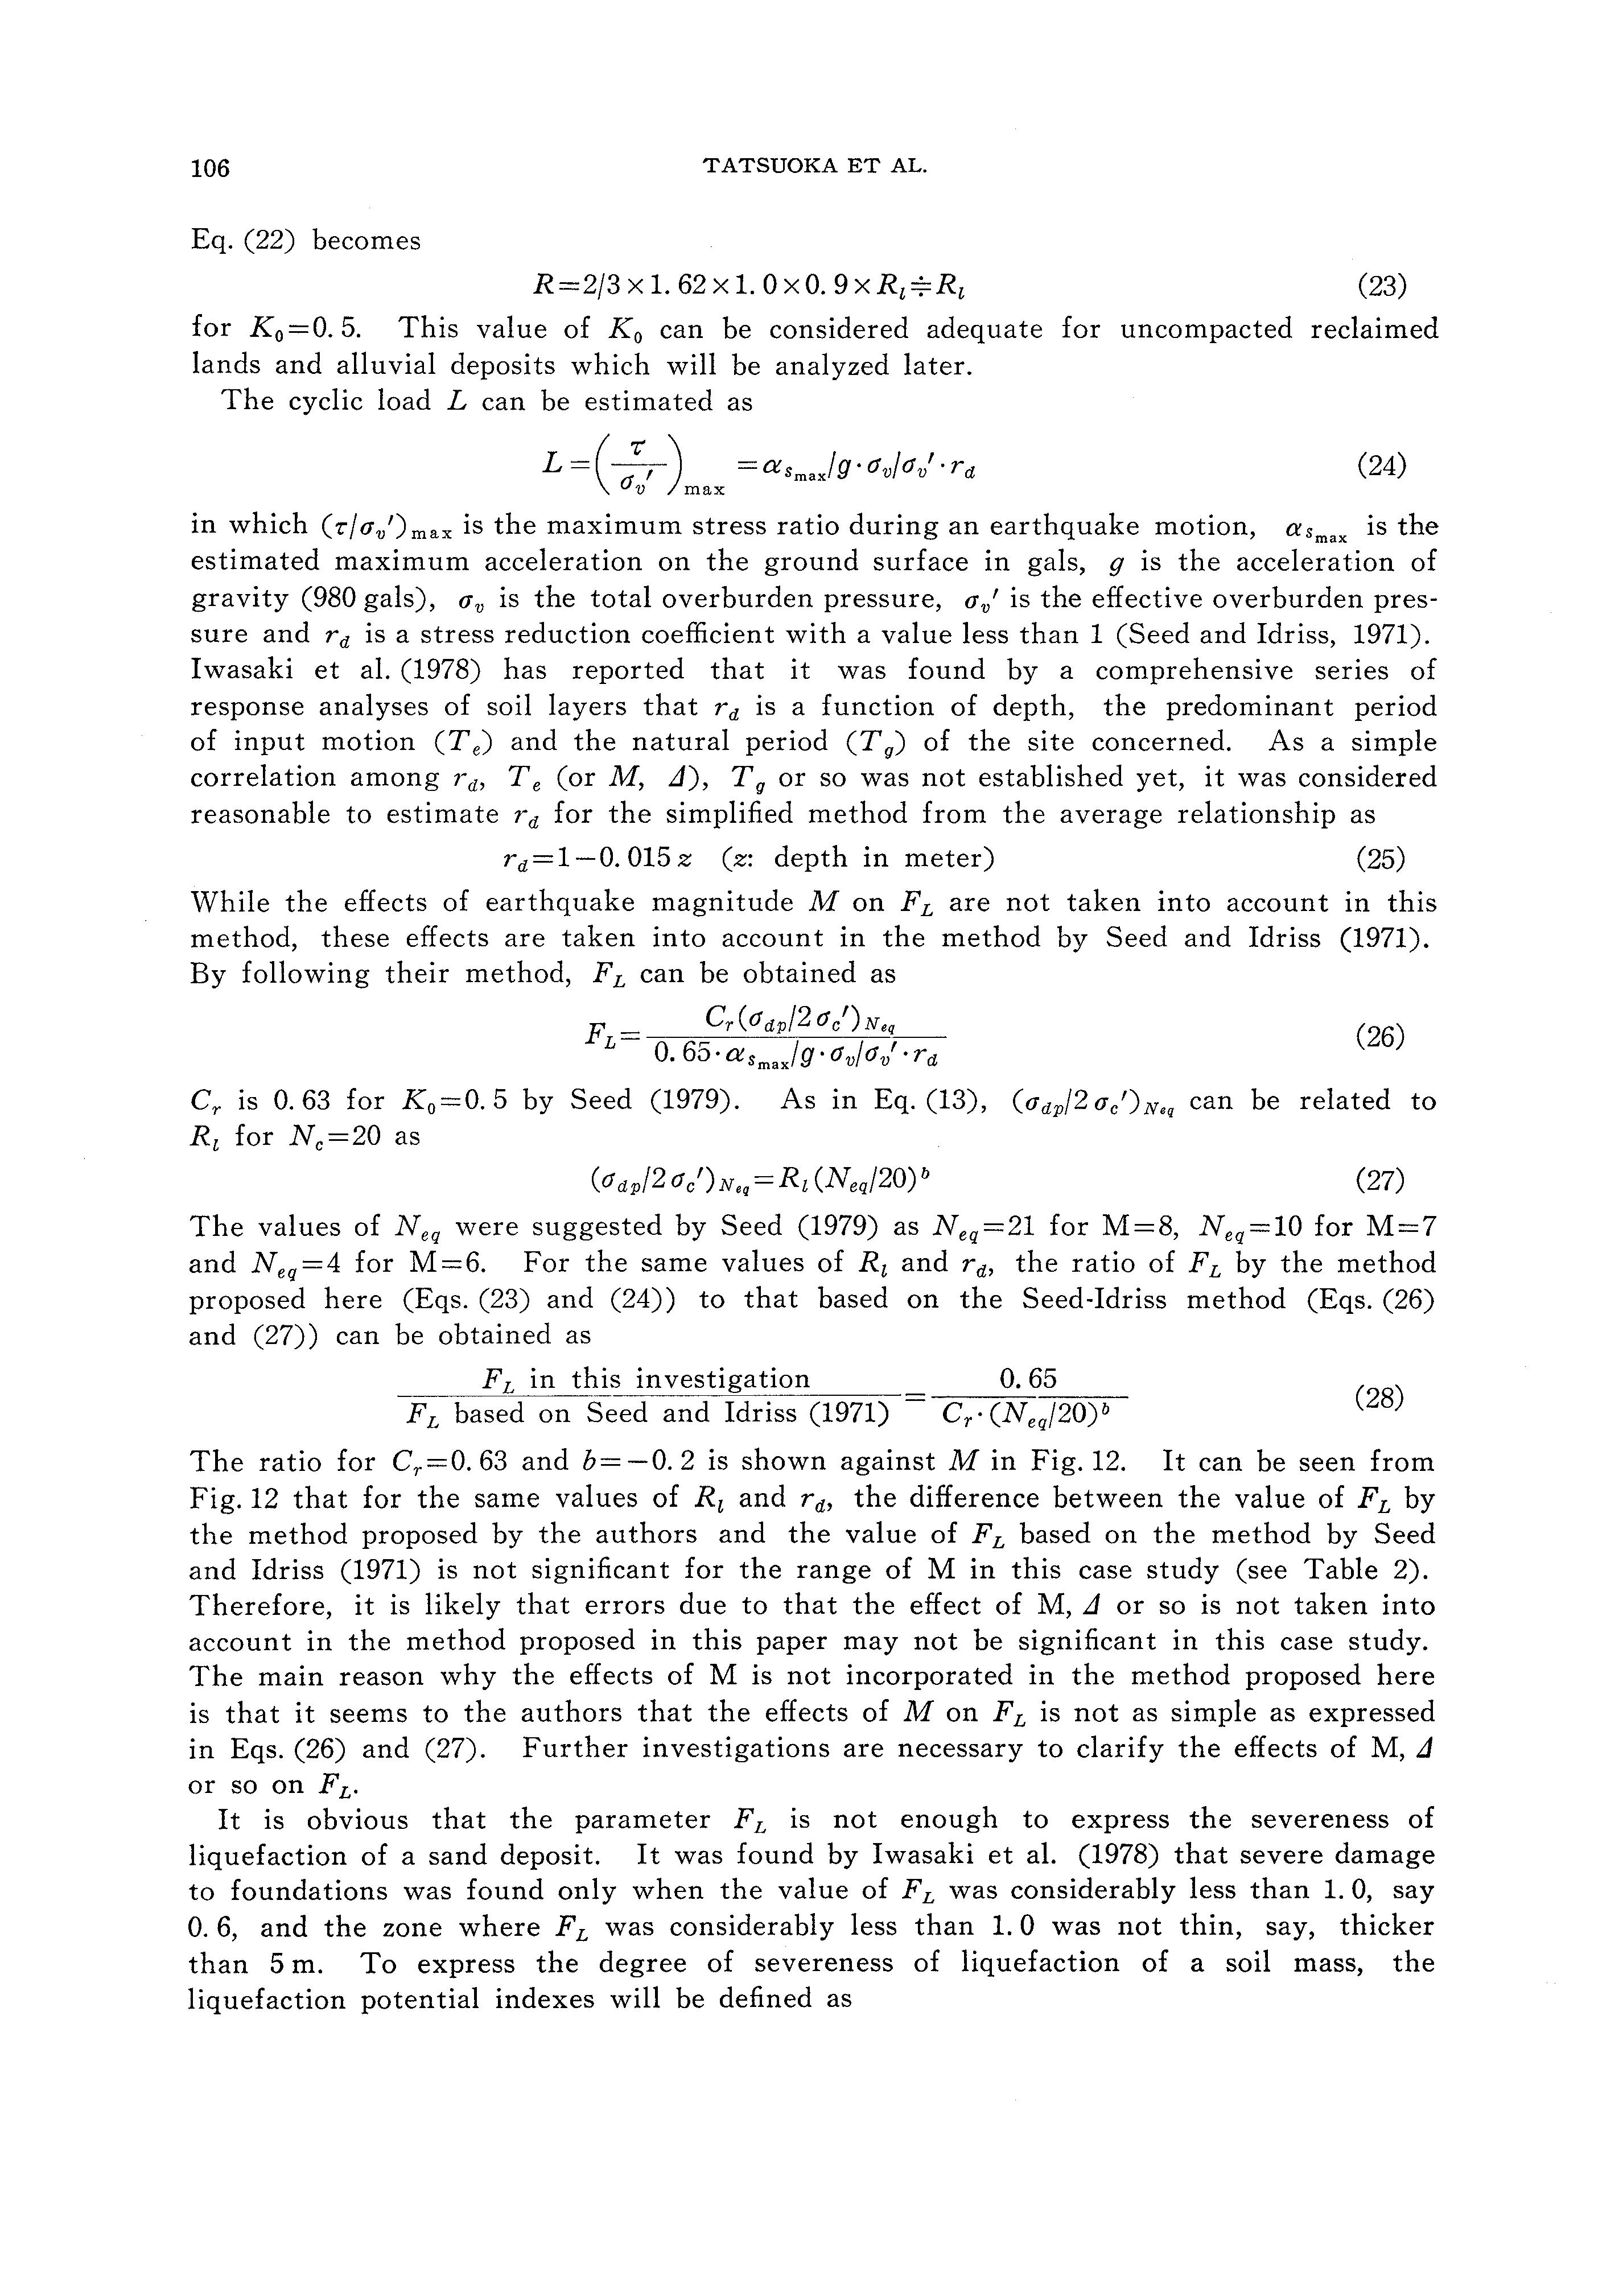
The ratio for Cr=O. 63 and b= -0. 2 is shown against M in Fig. 12. It can be seen from Fig. 12 that for the same values of Ri and rd, the difference between the value of FL by the method proposed by the authors and the value of FL based on the method by Seed and Idriss (1971) is not significant for the range of M in this case study (see Table 2). Therefore, it is likely that errors due to that the effect of M, LI or so is not taken into account in the method proposed in this paper may not be significant in this case study. The main reason why the effects of M is not incorporated in the method proposed here is that it seems to the authors that the effects of M on FL is not as simple as expressed in Eqs. (26) and (27). Further investigations are necessary to clarify the effects of M, LI or so on FL.
It is obvious that the parameter FL is not enough to express the severeness of liquefaction of a sand deposit. It was found by Iwasaki et al. (1978) that severe damage to foundations was found only when the value of FL was considerably less than 1. 0, say 0. 6, and the zone where FL was considerably less than 1. 0 was not thin, say, thicker than 5 m. To express the degree of severeness of liquefaction of a soil mass, the liquefaction potential indexes will be defined as
Fig. 12. Ratio of FL by two methods as a function of earthquake magnitude
Fig. 13. Integration of FL
PL= i 2 °F·w(z)dz (29a), PL*= i 2 °F·w*(z)dz (29b)
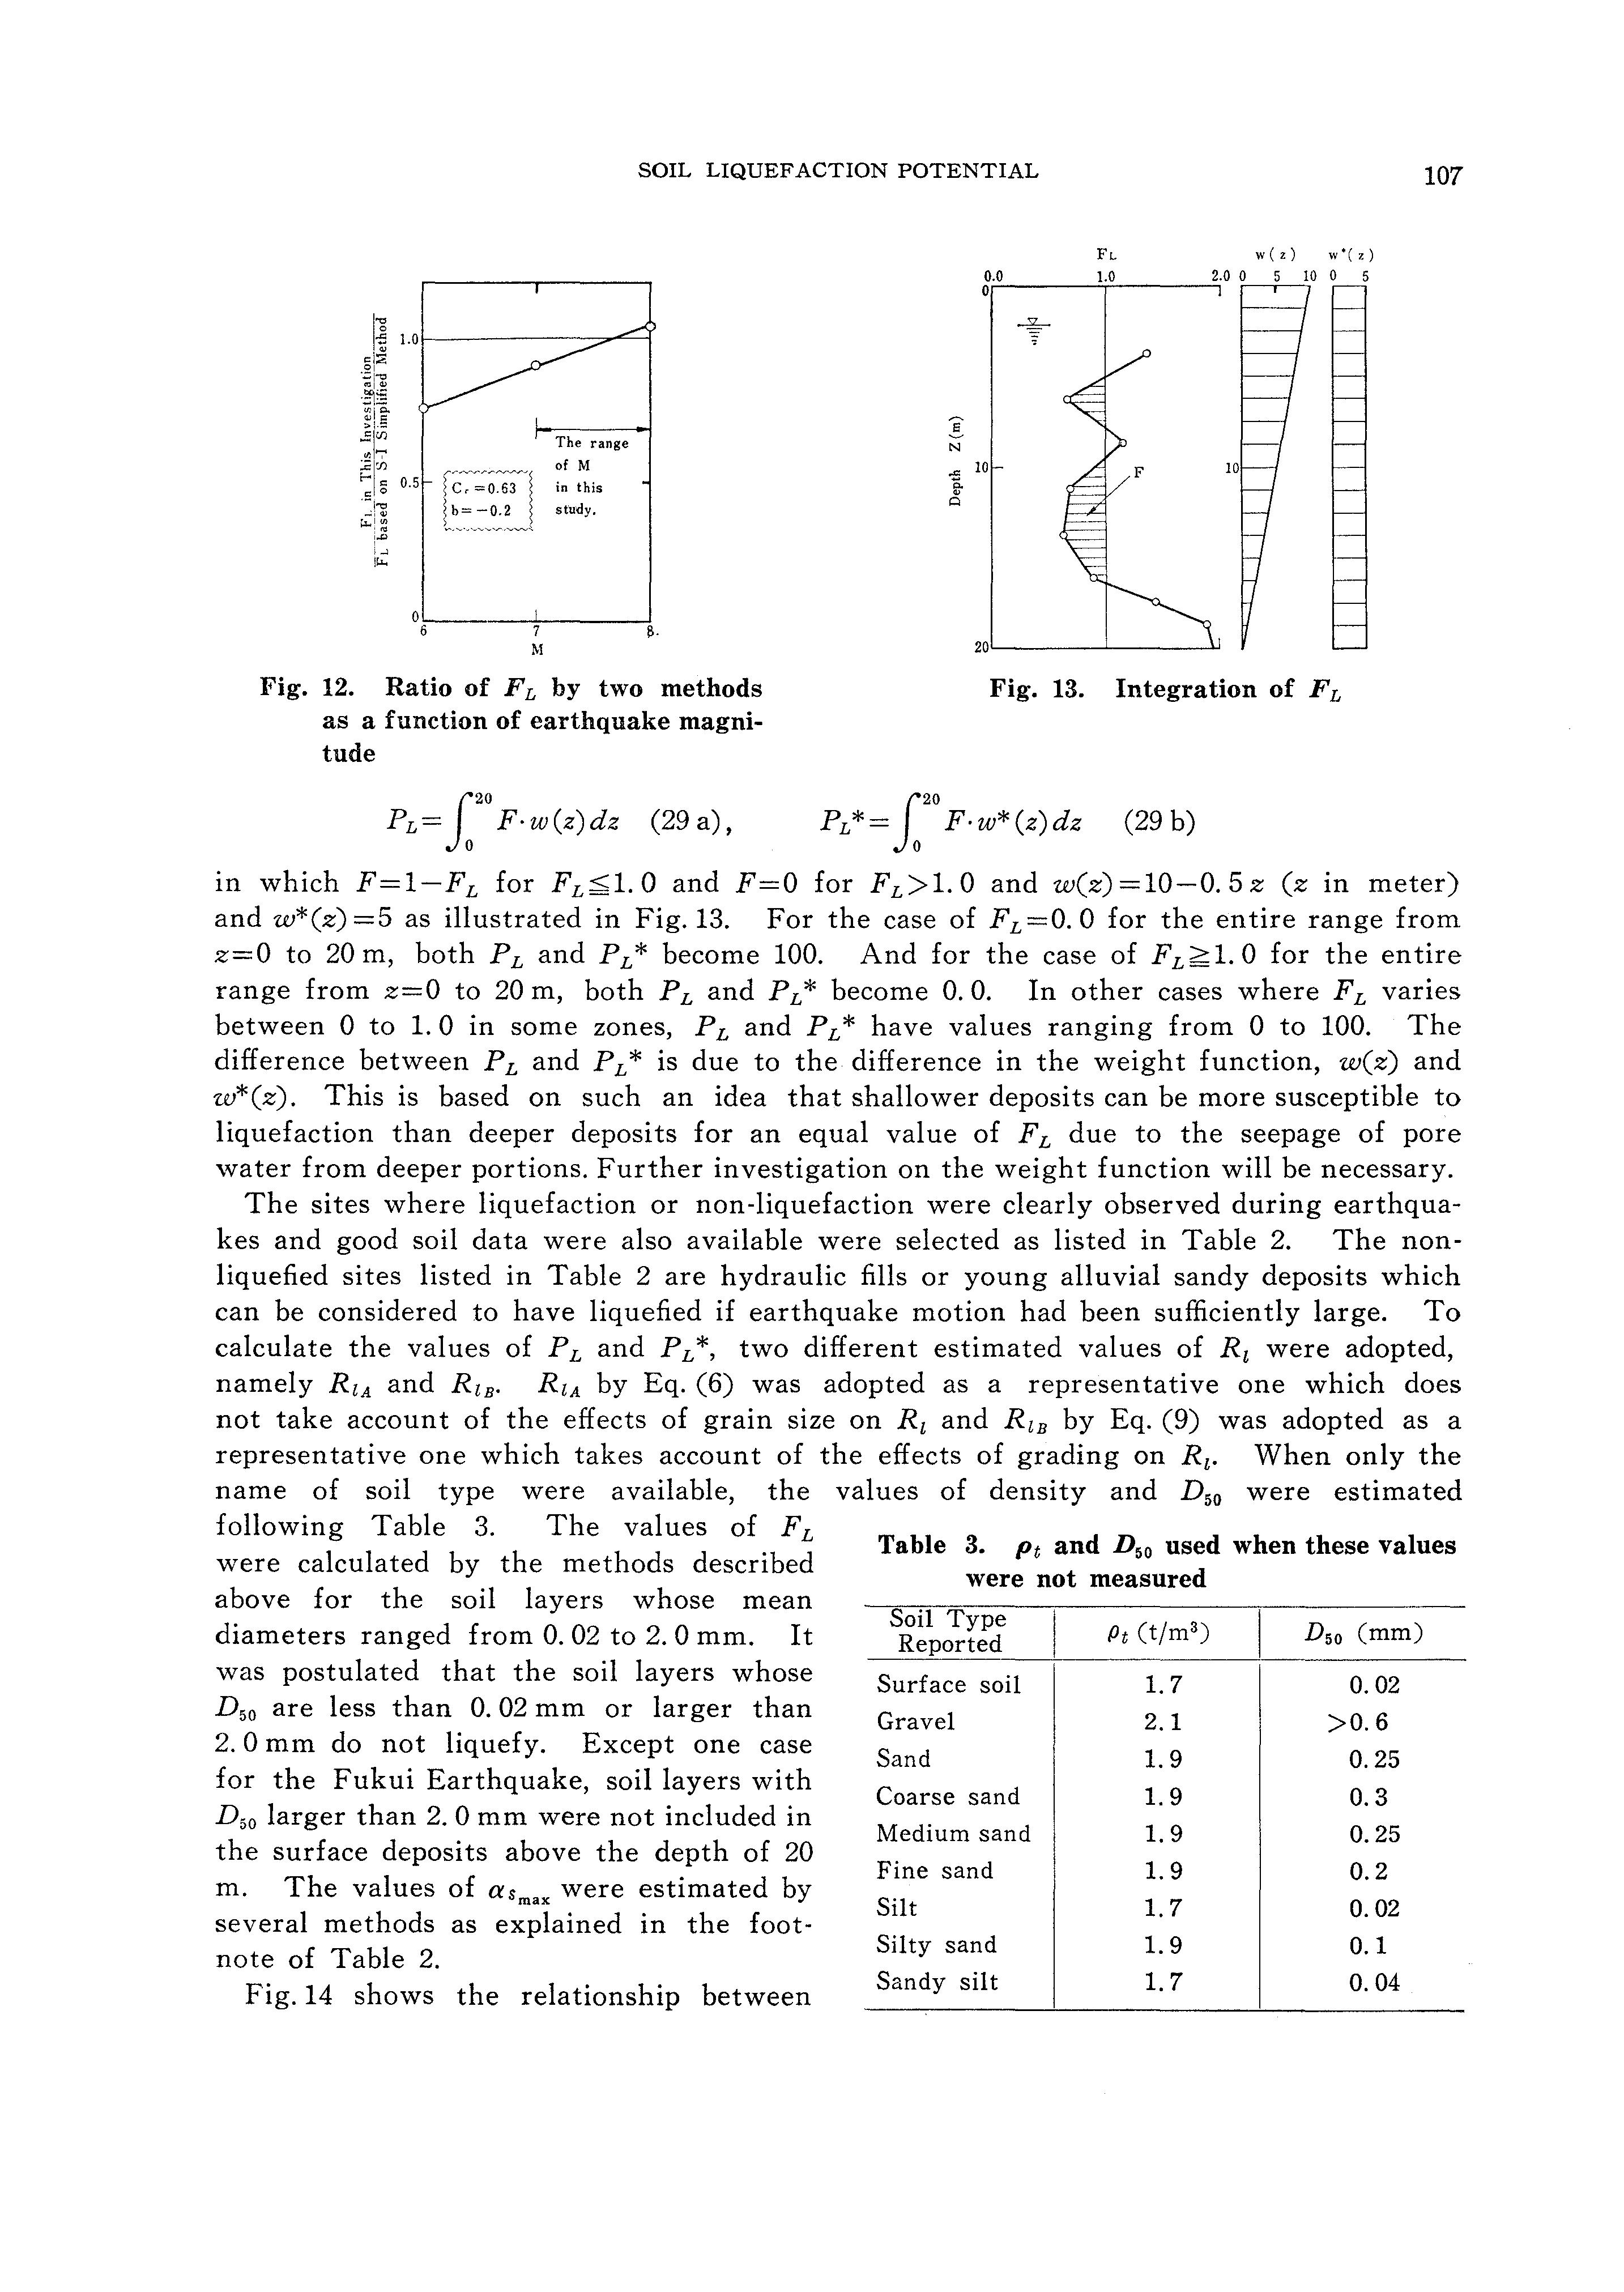
in which F=l-FL for 0 and F=O for FL>l. 0 and w(z) =10-0. 5 z (z in meter) and w*(z) =5 as illustrated in Fig.13. For the case of FL=O. 0 for the entire range from z=O to 20 m, both PL and PL* become 100. And for the case of 0 for the entire range from z=O to 20 m, both PL and PL* become 0. 0. In other cases where FL varies between 0 to 1. 0 in some zones, PL and PL* have values ranging from 0 to 100. The difference between PL and PL* is due to the difference in the weight function, w(z) and w*(z). This is based on such an idea that shallower deposits can be more susceptible to liquefaction than deeper deposits for an equal value of FL due to the seepage of pore water from deeper portions. Further investigation on the weight function will be necessary. The sites where liquefaction or non-liquefaction were clearly observed during earthquakes and good soil data were also available were selected as listed in Table 2. The nonliquefied sites listed in Table 2 are hydraulic fills or young alluvial sandy deposits which can be considered to have liquefied if earthquake motion had been sufficiently large. To calculate the values of PL and PL*, two different estimated values of Ri were adopted, namely RzA and Rz 8 • RzA by Eq. (6) was adopted as a representative one which does not take account of the effects of grain size on Ri and RzB by Eq. (9) was adopted as a representative one which takes account of the effects of grading on Rz. When only the name of soil type were available, the values of density and D 50 were estimated following Table 3. The values of FL were calculated by the methods described above for the soil layers whose mean diameters ranged from 0. 02 to 2. 0 mm. It was postulated that the soil layers whose D 50 are less than 0. 02 mm or larger than 2. 0 mm do not liquefy. Except one case for the Fukui Earthquake, soil layers with D 50 larger than 2. 0 mm were not included in the surface deposits above the depth of 20 m. The values of asmax were estimated by several methods as explained in the footnote of Table 2.
Fig. 14 shows the relationship between
Table 3. Pt and D 50 used when these values were not measured
Soil Type
Reported
Surface soil
Gravel
Sand
Coarse sand
Medium sand
Fine sand
Silt
Silty sand
Sandy silt
PL and PL* which were obtained by using RzB· It can be seen from this figure that while the values of PL* are somewhat less than those of PL, there is an almost linear relationship between PL and PL*. Therefore, since similar results can be expected from analyses by using PL or PL*, only PL will be used in the following.
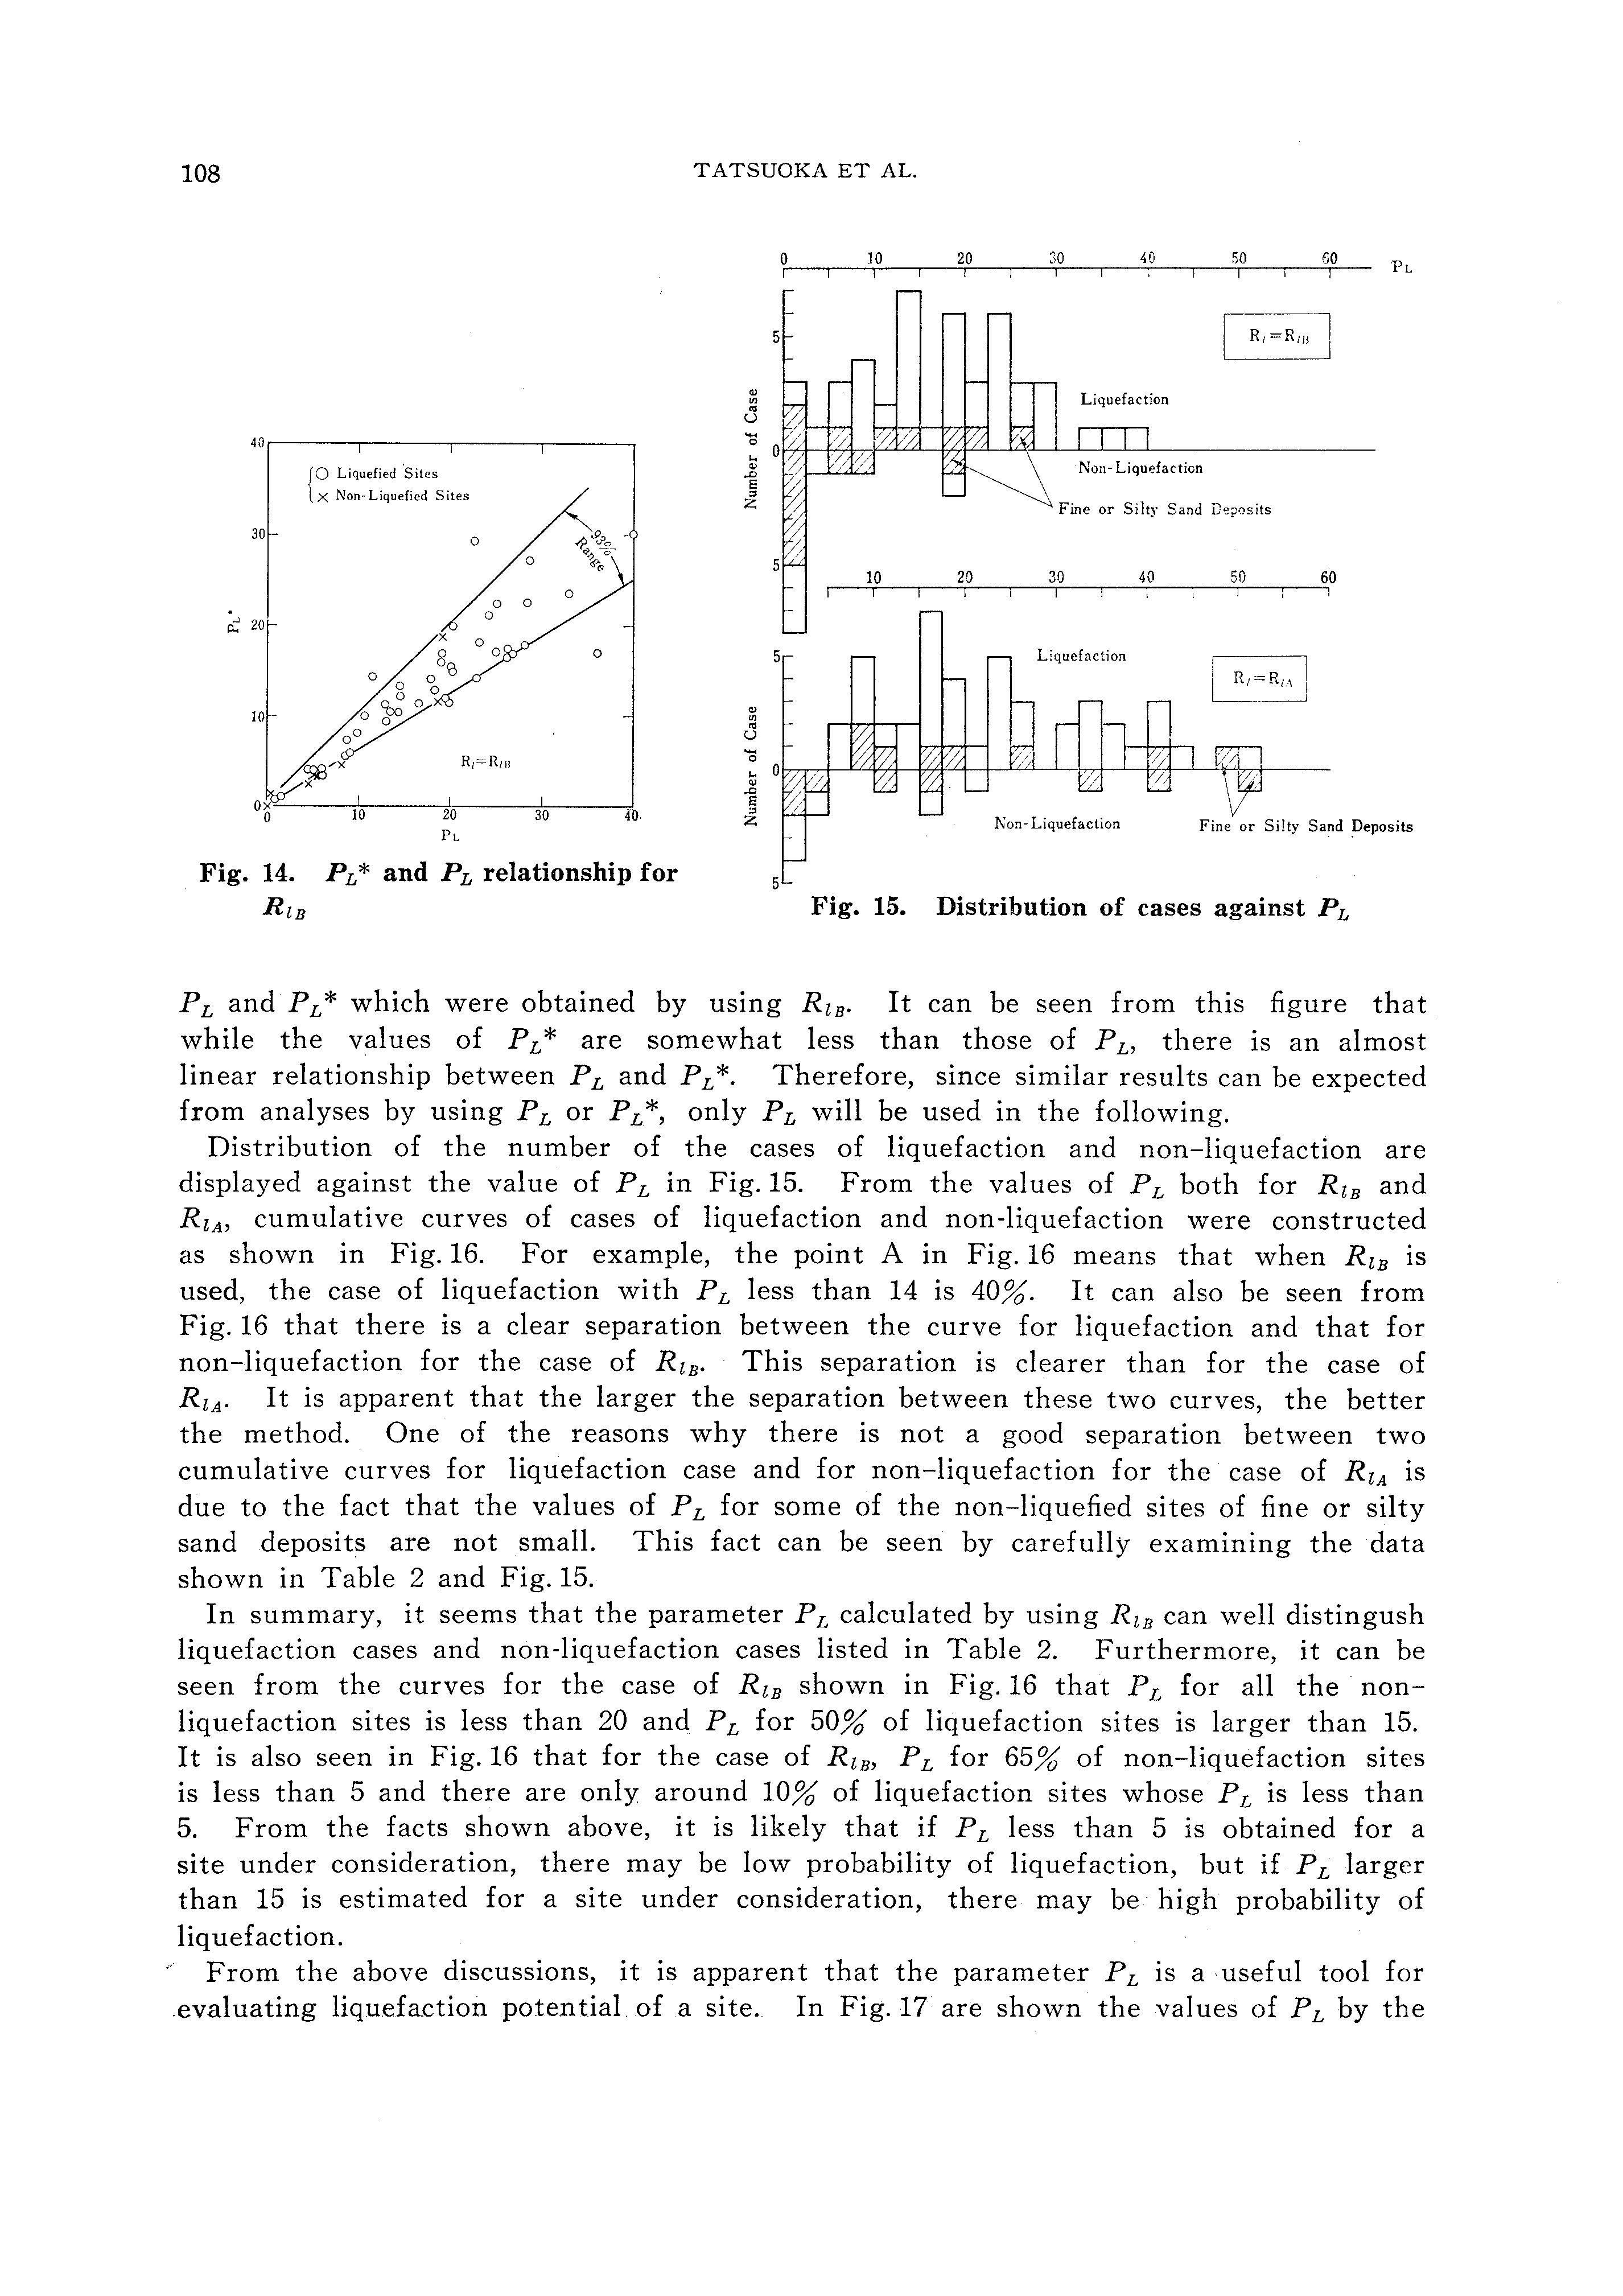
Distribution of the number of the cases of liquefaction and non-liquefaction are displayed against the value of PL in Fig. 15. From the values of PL both for RzB and RiA, cumulative curves of cases of liquefaction and non-liquefaction were constructed as shown in Fig. 16. For example, the point A in Fig. 16 means that when RiB is used, the case of liquefaction with PL less than 14 is 40%. It can also be seen from Fig. 16 that there is a clear separation between the curve for liquefaction and that for non-liquefaction for the case of RlB· This separation is clearer than for the case of RzA· It is apparent that the larger the separation between these two curves, the better the method. One of the reasons why there is not a good separation between two cumulative curves for liquefaction case and for non-liquefaction for the case of RzA is due to the fact that the values of PL for some of the non-liquefied sites of fine or silty sand deposits are not small. This fact can be seen by carefully examining the data shown in Table 2 and Fig. 15.
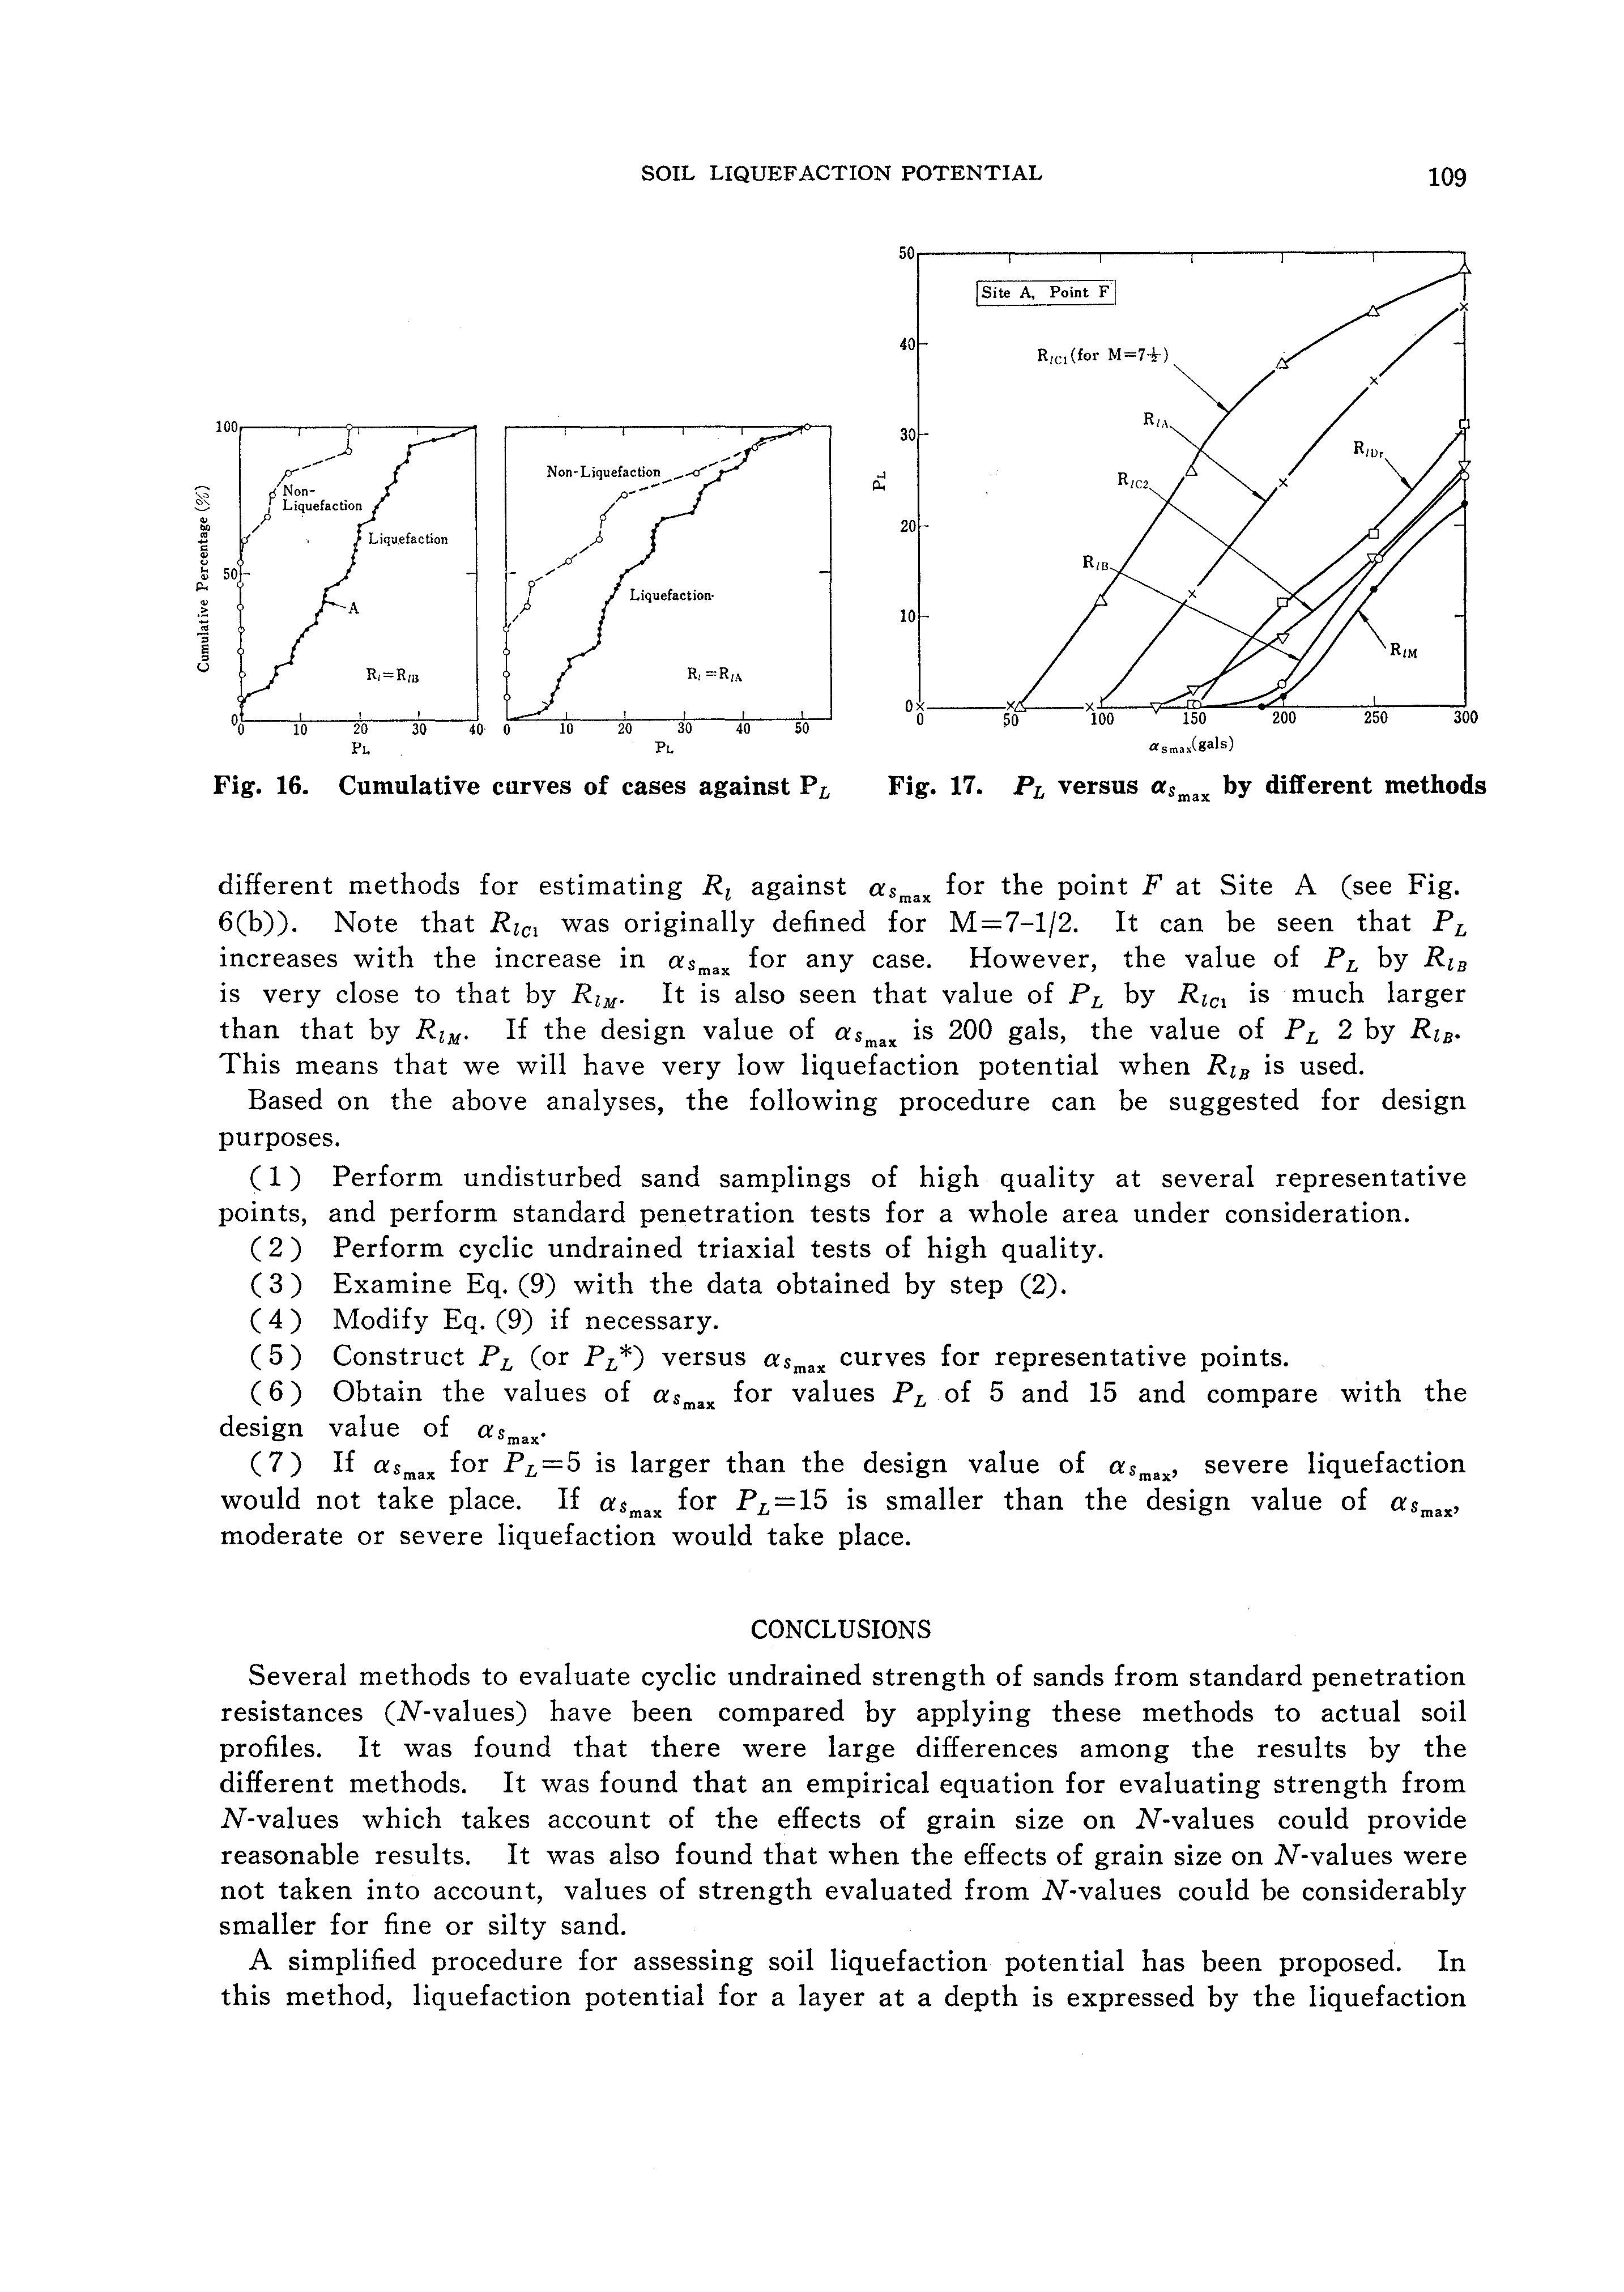
In summary, it seems that the parameter PL calculated by using RiB can well distingush liquefaction cases and non-liquefaction cases listed in Table 2. Furthermore, it can be seen from the curves for the case of RzB shown in Fig. 16 that PL for all the nonliquefaction sites is less than 20 and PL for 50% of liquefaction sites is larger than 15. It is also seen in Fig. 16 that for the case of RzB, PL for 65% of non-liquefaction sites is less than 5 and there are only around 10% of liquefaction sites whose PL is less than 5. From the facts shown above, it is likely that if PL less than 5 is obtained for a site under consideration, there may be low probability of liquefaction, but if PL larger than 15 is estimated for a site under consideration, there may be high probability of liquefaction.
From the above discussions, it is apparent that the parameter PL is a ·useful tool for evaluating liquefaction potential of a site. In Fig. 17 are shown the values of PL by the
Fig. 14. PL* and PL relationship for RlB
Fig. 15. Distribution of cases against PL
Fig. 16. Cumulative curves of cases against PL Fig. 17. PL versus asmax by different methods
different methods for estimating Ri against asmax for the point F at Site A (see Fig. 6(b)). Note that Rzc 1 was originally de.fined for M=7-1/2. It can be seen that PL increases with the increase in asmax for any case. However, the value of PL by RzB is very close to that by RzM· It is also seen that value of PL by Rici is much larger than that by RlM· If the design value of as max is 200 gals, the value of p L 2 by RlB• This means that we will have very low liquefaction potential when Rin is used.
Based on the above analyses, the following procedure can be suggested for design purposes.
( 1) Perform undisturbed sand samplings of high quality at several representative points, and perform standard penetration tests for a whole area under consideration.
( 2) Perform cyclic undrained triaxial tests of high quality.
( 3) Examine Eq. (9) with the data obtained by step (2).
( 4) Modify Eq. (9) if necessary.
( 5) Construct PL (or PL*) versus asmax curves for representative points.
( 6) Obtain the values of asmax for values PL of 5 and 15 and compare with the design value of asmax•
( 7) If asmax for PL=5 is larger than the design value of asmax' severe liquefaction would not take place. If asmax for PL=15 is smaller than the design value of asmax' moderate or severe liquefaction would take place.
CONCLUSIONS
Several methods to evaluate cyclic undrained strength of sands from standard penetration resistances (N-values) have been compared by applying these methods to actual soil pro.files. It was found that there were large differences among the results by the different methods. It was found that an empirical equation for evaluating strength from N-values which takes account of the effects of grain size on N-values could provide reasonable results. It was also found that when the effects of grain size on N-values were not taken into account, values of strength evaluated from N-values could be considerably smaller for fine or silty sand.
A simplified procedure for assessing soil liquefaction potential has been proposed. In this method, liquefaction potential for a layer at a depth is expressed by the liquefaction
T ATSUOKA ET AL.
resistance factor FL and liquefaction potential for a soil deposit from the surface to the depth of 20 m is expressed by the liquefaction potential index PL or PL* which can be obtained by integrating FL with a weight function w(z) or w*(z). The values of FL and PL or PL* were calculated for the sites of liquefaction and non-liquefaction during previous earthquakes in Japan. It was found that when the effects of grain size on N-values are taken into account, the value of PL or PL* are quite different between the sites of liquefaction and those of non-liquefaction. The index PL or PL* can be useful in liquefaction potential evaluation of soil deposits.
ACKNOWLEDGEMENTS
Extensive in situ geotechnical surveys and laboratory tests have been conducted by the Kanto Regional Construction Bureau of the Ministry of Construction, Honshu-Shikoku Bridge Authority and Yokohama City. The whole authors express their cordial appreciation to the staff members concerned. The authors are also grateful to Miss M. Torimitsu for her help in typing the manuscript.
NOTATIONS
Dr=relative density
Dr*=210vN/(av'+70) (av' m kN/m 2 )
D 50 =mean grain size in mm
FL=R/L; liquefaction resistance factor
L =cyclic load in stress ratio
N =standard penetration resistances
Nc=number of loading cycles
PL> PL*= liquefaction po ten ti al indexes
R=resistance of a soil element against liquefaction
Ri=stress ratio which causes liquefaction in triaxial specimen at Nc=20 Rz , RlA, RiB, Rici and Rzc 2 =estimated values of Ri
Dr rd=l-0.015z (z: depth in m)
asmax=maximum acceleration at ground surface m gals
pa, Pt =dry and total unit densities
av'=effective overburden stress in kN/m 2
O"t=total overburden stress in kN/m2
REFERENCES
1) BRI (1965) : "Report on damage to buildings during the Niigata Earthquake," The Building Research Institute, Ministry of Construction, No. 42, 1965 (in Japanese).
2) BRI (1969) : "Investigation on liquefaction of saturated sand and some problems on soil-structure-interaction," The Building Research Institute, Ministry of Construction, No. 55 (in Japanese).
3) Castro, G. (1975) : "Liquefaction and cyclic mobility of saturated sands," Journal of the Geot. Eng. Div., ASCE, Vol.101, No. GT 6, pp. 551-569.
4) De Alba, P., Chan, C. K. and Seed, H. B. (1975) : "Determination of soil liquefaction characteristics by large scale laboratory tests," Report No. EERC 75-14, Earthquake Engineering Research Center, University of California, Berkeley.
5) Gibbs, H. J. and Holtz, W. G. (1957) : "Research on determining the density of sand by spoon penetration test," Proc. 4th International Conference on Soil Mechanics and Foundation Engineering, London, Vol. I, pp. 35-39.
SOIL LIQUEFACTION POTENTIAL
6) Ishihara, K. and Li, S. (1972) : "Liquefaction of saturated sand in triaxial torsion shear test," Soils and Foundations, Vol.12, No. 2, pp. 19-39.
7) Ishihara, K. and Yasuda, S. (1975) : "Sand liquefaction in hollow cylinder torsion under irregular excitation," Soils and Foundations, Vol.15, No. 1, pp. 29-45.
8) Ishihara, K. (1977) : "Simple method of analysis for liquefaction of sand deposits during earthquake," Soils and Foundations, Vol.17, No. 3, pp.1-17.
9) Ishihara, K., Silver, M. L. and Kitagawa, H. (1978) : "Cyclic strength of undisturbed sands obtained by large diameter sampling," Soils and Foundations, Vol.18, No. 4, pp. 61-76.
10) Ishihara, K. and Ogawa, K. (1978) : "Liquefaction susceptibility map of downtown Tokyo," Proc. of the 2nd Int. Conf. on Microzonation, San Francisco, Vol. II, pp. 897-910.
11) lshizawa, M., Nakagawa, S. and Kurohara, I. (1977) : "Liquefaction test of undisturbed samples containing fine content," Proc. the 12th Annual Meeting of JSSMFE, pp. 397-400 (in Japanese).
12) Iwasaki, T., Tatsuoka, F., Tokida, K. and Yasuda, S. (1978) : "A practical method for assessing soil liquefaction potential based on case studies at various sites in Japan," Proc. of the 2nd Int. Conf. on Microzonation, San Francisco, Vol. II, pp. 885-896.
13) Japanese Society of Soil Mechanics and Foundation Engineering (1976) : "Report on earthquake damage of subground streets and structures," March (in Japanese).
14) Japanese Society of Civil Engineers : "The report on the damage during the Niigata Earthquake of 1964," (in Japanese).
15) Kishida, H. (1970) : Characteristics of liquefaction of level sandy ground during the Tokachioki earthquake, Soils and Foundations, Vol. X, No. 2, pp. 103-111.
16) Martin, G. R., Finn, W. D. L. and Seed, H.B. (1978) : "Effects of system compliance on liquefaction tests," Proc. of the Geotechnical Div., ASCE, Vol.104, No. GT4, Proc. Paper 13667, April, pp. 463-479.
17) Meyerhof, G. G. (1957) : "Discussion of Session 1," Proc. 4th International Conference on Soil Mechanics and Foundation Engineering, London, Vol.3.
18) Ohsaki, Y. (1970) : "Effects of sand compaction on liquefaction during the Tokachioki Earthquake," Soils and Foundations, Vol.X, No. 2, pp.112-128.
19) Pyke, R. M., Knuppel, L.A. and Lee, K. L. (1978) : "Liquefaction potential of hydraulic fills," Journal of the Geotechnical Engineering Division, ASCE, Vol.104, No. GTll, Proc., Paper 14133, Nov., pp.1335-1354.
20) Seed, H.B. and Idriss, I. M. (1971) : "A simplified procedure for evaluating soil liquefaction potential," Journal of the SMFE Div., ASCE, Vol.97, No. SM9, Sept., pp.249-274.
21) Seed, H.B. (1979) : "Evaluation of soil liquefaction effects on level ground during earthquakes," S-0-A Report, Reprint of ASCE, Annual Convention and Exposition on Liquefaction Problems in Geotechnical Engineering, Philadelphia.
22) Tatsuoka, F., Iwasaki, T., Tokida, K., Yasuda, S., Hirose, M., Imai, T. and M. Kon-no (1978) : "A method for estimating undrained cyclic strength of sandy soils using standard penetration Nvalues, Soils and Foundations, Vol.18, No. 3, pp. 43-58.
23) Tatsuoka, F., Yasuda, S., Iwasaki, T. and Tokida, K. (1980) : "Normalized dynamic undrained strength of sands subjected to cyclic and random loading," Soils and Foundations, Vol. 20, No. 3, pp.1-16.
(Received December 3, 1979)
Other documents randomly have different content
We rode up in the elevator and entered the imposing offices of the great munitions corporation, where the executive business was conducted for the score or more plants owned or controlled by the company in various parts of the country.
Hastings led the way familiarly past the girl sitting at a desk in the outside office and we soon found ourselves in the section that was set apart for the accounting department, over which Randall had charge.
It seemed that the lawyer was well acquainted with the cashier as he introduced him to us, and we noted that Randall was a man approaching middle age, at least outwardly, with that solid appearance that seems to come to men who deal with numbers and handle large sums of money.
While we talked I looked about curiously. Randall had an inner office, though in the outer office stood the huge safe which was evidently the one which had been rifled.
The cashier himself seemed to have lost, for the time, some of his customary poise. Trying to make him out, I fancied that he was nearly frantic with fear lest he might be suspected, not so much, perhaps, of having had anything to do with the loss of the telautomaton as of being remiss in his duties, which included the guardianship of the safe.
The very anxiety of the man seemed to be a pretty good guarantee of his honesty. There could be no doubt of how deeply he felt the loss, not only because it was of such vital importance, but from the mere fact that it might reflect on his own management of his department.
“It seems almost incredible,” Randall exclaimed as we stood talking. “The most careful search has failed to reveal any clue that would show even how access to the office was gained. Not a lock on any of the doors has been tampered with, not a scratch indicates the use of a jimmy on them or on the windows. In fact, entrance by the windows at such a height above the surrounding buildings is almost beyond the range of possibility as well as probability. How could it
have been accomplished? I am forced to come back to the explanation that the outer office doors had been opened by a key!”
“There were keys—in the hands of several people, I suppose?” inquired Kennedy.
“Oh yes! There are in every large office like this,” hastened Randall.
“Mr. Maddox had a key, of course?”
“Yes.”
“And you?”
“Certainly.”
“Who else?”
“The agent of the building.”
“I mean who else in the office?”
“My assistant—oh, several. Still, I am sure that no one had a key except those whom we could trust.”
“Did Shelby Maddox ever have a key?” cut in Hastings.
The cashier nodded in the negative, for the moment surprised, apparently, at the very idea that Shelby would ever have had interest enough in business to have such a thing.
I saw Burke looking in covert surprise at Hastings as he asked the question. For the moment I wondered why he asked it. Had he really thought that Shelby might have a key? Or was he trying hard to make a case? What was his own connection with the affair? Kennedy had been looking keenly about.
“Is that the safe over there?” he indicated. “I should like to examine it.”
“Yes, that’s it, and that’s the strangest part of it,” hastened Randall, as though eager to satisfy us on all points, leading the way to a modern chrome-steel strong-box of a size almost to suggest a miniature bank vault surely a most formidable thing to tackle.
“You see,” he went on, nervously, as though eager to convince us, “there is not a mark on it to show that it has been tampered with. Yet the telautomaton is gone. I know that it was there last night, all right, for I looked in the compartment where we keep the little model, as well as the papers relating to it. It is a small model, and of course was not charged with explosive. But it is quite sufficient for its purpose, and if its war-head were actually filled with a high explosive it would be sufficiently deadly against any ordinary ship in spite of its miniature size.”
Kennedy had already begun his examination, first of all assuring himself that it was useless to try to look for finger-prints, inasmuch as nearly everybody had touched the safe since the robbery and any such clue, had it once existed, must have been rendered valueless.
“How did you discover the loss?” I ventured as Craig bent to his work. “Did anything excite your suspicion?”
“N-no,” returned the cashier. “Only I have been very methodical about the safe. The model was kept in that compartment at the bottom. I make it a practice in opening and closing the safe to see that that and several other valuable things we keep in it are there. This morning nothing about the office and certainly nothing about the safe suggested that there was anything wrong until I worked the combination. The door swung open and I looked through it. I could scarcely believe my own eyes when I saw that that model was gone. I couldn’t have been more astonished if I had come in and found the door open. I am the only one who knows the combination—except for a copy kept in a safety deposit box known only to Marshall Maddox and Mr. Hastings.”
Before any of us could say a word Kennedy had completed his first examination and was facing us. “I can’t find a mark on it,” he confessed. “No ‘soup’ has been used to blow it. Nitroglycerin enough might have wrecked the building. The old ‘can-opener’ is of course out of the question with a safe like this. No instrument could possibly rip a plate off this safe unless you gave the ripper unlimited time. There’s not a hint that thermit or the oxy-acetylene blowpipe have
been used. Not a spot on the safe indicates the presence of anything that can produce those high temperatures.”
“Yet the telautomaton is gone!” persisted Hastings.
Kennedy was looking about, making a quick search of the office.
As his eye traveled over the floor he took a step or two forward and bent down. Under a sanitary desk, near a window, he picked up what looked like a small piece of rubber tubing. He looked at it with interest, though it conveyed no idea to me. It was simply a piece of rubber tubing. Then he took another step to the window and raised it, looking out. Far below, some hundred or more feet, was the roof of the next building, itself no mean structure for height.
“Have you searched the roof below?” he asked, turning to Burke. Burke shook his head. “How could any one get in that way?” he negatived.
“Well—search the roof below,” repeated Kennedy.
Even though he did not understand what good might come of such a strange request, Burke had known Kennedy long enough not to question his actions. He moved away, seeking one of his men whom he could send on the errand.
While we waited Kennedy continued to question Randall.
“Mr. Maddox was very careful of his key, I suppose?” he ventured.
“Yes, sir, very careful. So we all were of the combination, too. Not even my assistant knows that. If I should drop dead, there would be only one way to get it—to open that safety deposit box, and that must be done by some one with the proper authority. It has all been carefully safeguarded.”
“You know of no one intimate with Mr. Maddox—who might have obtained the key—or the combination?”
I wondered at what Kennedy was driving. Had he the little dancer, Paquita, in mind? Did he suspect that she might have wormed from Maddox the secret? Or was he, too, thinking of Shelby?
Randall shook his head, and Kennedy continued his quick examination of the office, questioning the assistant, who was unable to add anything of value.
So far there had been nothing to show that the robbery might not have been an inside job. As Kennedy was still pondering on the new mystery that confronted us Burke approached with the man whom he had sent to make the search.
His face indicated that he was puzzled. In his hand he was holding a disk that was something like the flat telephone receivers one sees often on interior office telephones. To it was attached a rubber tube like that which Kennedy had picked up in the office a few minutes before.
“My man found this thing on the roof below,” explained Burke, with a look of inquiry. “What do you suppose it is? How did it get there?”
Kennedy took the disk and began examining it carefully, fitting on the other rubber tube.
“Perhaps it had served its purpose—was no longer of use,” he meditated. “At any rate, if some one had to get away with that telautomaton he would not want to burden himself with anything else that was unnecessary. He might very well have discarded this.”
What the thing was I could not imagine. We all crowded about, examining it, not even Burke offering an explanation.
Suddenly Craig’s face lightened up. He thrust the tubes into his ears and walked over to a smaller safe that was still locked. As he turned the combination handle he held the black disk up close to the safe. The intent look on his face caused us all to watch without a word. Around and around he turned the handle slowly. Finally he stopped. Then, with a few quick turns, he gave the door a pull and it swung open on its oiled hinges.
We fairly gasped. “What is it?” I demanded. “Magic?”
Kennedy smiled. “Not magic, but black science,” he replied. “This is a burglar’s microphone.”
“A burglar’s microphone?” I repeated. “What’s that?”
“Well,” he explained, “the microphone is now used by burglars for picking combination locks. When you turn the lock a slight sound is made when the proper number comes opposite the working part. It can be heard by a sensitive ear, sometimes, I am told. However, it is imperceptible to most persons. But by using a microphone it is an easy matter to hear the sounds. Having listened to the fall of the tumblers, the expert can determine what are the real numbers of the combination and open the safe. That is what happened in this case.”
We followed Kennedy, speechless. What was there to say? We had already seen him open a safe with it himself.
Though we were thus far on our way, we had not even a clue as to the identity of the criminal or criminals.
I recalled Burke’s own theory as he had expressed it. Could it be that some one had betrayed to a foreign government agent the priceless secret of the telautomaton?
THE WHITE LIGHT CAFÉ
“
A� long as I am back in the city,” continued Kennedy, while we stared at one another, wondering what next move to make, “I think that I had better take the opportunity to make some investigations in my laboratory which would be impossible out at Westport.”
In the mean time Burke had been examining the burglar’s microphone, turning it over and over thoughtfully, as if in the hope that it might furnish some clue.
“It might have been possible,” he ruminated, “for some one to get into the building at night if the night watchman was off his guard and he had a key to the building. I suppose he might get out again, too, under the same circumstances.”
“A good lead,” agreed Kennedy. “While you are finding the night watchman and getting anything else along that line of reconstructing what actually did take place it will give me just the chance I need. Let us meet in two or three hours—say, at Mr. Hastings’s office. Let me see, I believe your firm is Hastings & Halsey, isn’t it?”
“Hastings & Halsey,” repeated the lawyer. “You are quite welcome to meet again there. You know where it is, on Wall Street?”
We noted the number and Kennedy and I hurried up-town to the laboratory which we had left only a few short hours before.
Already there were waiting for him, by special messenger, the materials from the autopsy which had been promised by the Westport coroner, who for once had appreciated the importance of a case and had acted with speed and decision.
Kennedy lost no time in throwing off his coat and donning his acid-stained smock. For some minutes I watched him in silence as
he arranged his jars and beakers and test-tubes for the study which he had in mind. He had taken some of the material and placed it over a Bunsen burner in an apparatus which looked like a miniature still. Another apparatus which he took from a cabinet was disposed on a table. It seemed to consist primarily of three tubes. In one was a slit, and through the slit evidently rays of light were caused to stream. Inside I saw a lens. Each of the tubes seemed to radiate from a triangular prism of some substance that looked like glass. Two of the radiating tubes had an eye-piece and on one was a sort of scale.
As Kennedy made these rapid preparations he paused now and then to study carefully the slivers of bright metal he had picked up from the carpet in the state-room, while on a porcelain plate he placed the powder which he had scraped from the brass fittings.
“I’m not doing you a bit of good here, Craig,” I remarked, at length. “Isn’t there something I can do while you are working? I can come back here in time to go down and meet Hastings and Burke with you.”
He paused a moment. “Yes,” he replied, “there is something that you might be doing. I have been wondering just how intimate that little Mexican dancer was with Marshall Maddox and whether Shelby actually knew her in New York before he met her out at Westport the other night. I think you might make some inquiries along that line, and by the time you find anything you may find me more interesting also.”
Glad of the opportunity to be of service, for anything was better than to sit about idle in the present high-keyed state of my nerves, I started out.
My first impulse was to visit the New Amsterdam Club, one of the oldest clubs in the city, of which I knew that Maddox had been a member.
I knew several men who were members, and I was sure that among them I might find some one at the club at that time, and