Sample Introduction Systems in ICPMS and ICPOES
Edited by
Diane Beauchemin
Elsevier
Radarweg 29, PO Box 211, 1000 AE Amsterdam, Netherlands
The Boulevard, Langford Lane, Kidlington, Oxford OX5 1GB, United Kingdom
50 Hampshire Street, 5th Floor, Cambridge, MA 02139, United States
© 2020 Elsevier B.V. All rights reserved.
No part of this publication may be reproduced or transmitted in any form or by any means, electronic or mechanical, including photocopying, recording, or any information storage and retrieval system, without permission in writing from the publisher. Details on how to seek permission, further information about the Publisher’s permissions policies and our arrangements with organizations such as the Copyright Clearance Center and the Copyright Licensing Agency, can be found at our website: www.elsevier.com/permissions
This book and the individual contributions contained in it are protected under copyright by the Publisher (other than as may be noted herein).
Notices
Knowledge and best practice in this field are constantly changing. As new research and experience broaden our understanding, changes in research methods, professional practices, or medical treatment may become necessary.
Practitioners and researchers must always rely on their own experience and knowledge in evaluating and using any information, methods, compounds, or experiments described herein. In using such information or methods they should be mindful of their own safety and the safety of others, including parties for whom they have a professional responsibility.
To the fullest extent of the law, neither the Publisher nor the authors, contributors, or editors, assume any liability for any injury and/or damage to persons or property as a matter of products liability, negligence or otherwise, or from any use or operation of any methods, products, instructions, or ideas contained in the material herein.
Library of Congress Cataloging-in-Publication Data
A catalog record for this book is available from the Library of Congress
British Library Cataloguing-in-Publication Data
A catalogue record for this book is available from the British Library
ISBN: 978-0-444-59482-2
For information on all Elsevier publications visit our website at https://www.elsevier.com/books-and-journals
Publisher: Susan Dennis
Acquisition Editor: Kathryn Eryilmaz
Editorial Project Manager: Sara Pianavilla
Production Project Manager: Anitha Sivaraj
Cover Designer: Victoria Pearson
Typeset by SPi Global, India
Contributors
Jean Aupiais CEA, DAM, DIF, Arpajon, France
Diane Beauchemin Department of Chemistry, Queen’s University, Kingston, ON, Canada
Ian D. Brindle Chemistry Department, Brock University, St. Catharines, ON, Canada
John A. Burgener Burgener Research Inc., Mississauga, ON, Canada
Frédéric Chartier CEA, DEN, DPC & Université Paris Saclay, Gif-sur-Yvette, France
Fanny Claverie CNRS/Univ Pau & Pays Adour/e2s UPPA, Institut des Sciences Analytiques et de Physicochimie pour l'Environnement et les Materiaux (UMR 5254), Pau, France
William M. Geiger Consolidated Sciences, Pasadena, TX, United States
Lily Huang Department of Chemistry, Queen’s University, Kingston, ON, Canada
Ram P. Lamsal Department of Chemistry, Queen’s University, Kingston, ON, Canada
Yoseif Makonnen SGS Canada Inc., Mississauga, ON, Canada
Blake A. McElmurry Consolidated Sciences, Pasadena, TX, United States
Sutthinee Mekprayoon Department of Chemistry and Center of Excellence for Innovation in Chemistry, Faculty of Science, Mahidol University, Bangkok, Thailand
Nausheen Waheed Sadiq Brooks Applied Labs, Bothell, WA, United States
Rattaporn Saenmuangchin Department of Chemistry and Center of Excellence for Innovation in Chemistry, Faculty of Science, Mahidol University, Bangkok, Thailand
Atitaya Siripinyanond Department of Chemistry and Center of Excellence for Innovation in Chemistry, Faculty of Science, Mahidol University, Bangkok, Thailand
Takdanai Techarang Department of Chemistry and Center of Excellence for Innovation in Chemistry, Faculty of Science, Mahidol University, Bangkok, Thailand
Novy Lailatuz Zulfah Department of Chemistry and Center of Excellence for Innovation in Chemistry, Faculty of Science, Mahidol University, Bangkok, Thailand
The inductively coupled plasma as a source for optical emission spectrometry and mass spectrometry
Yoseif Makonnena, Diane Beaucheminb
aSGS Canada Inc., Mississauga, ON, Canada bDepartment of Chemistry, Queen’s University, Kingston, ON, Canada
Chapter outline
1.1 Introduction 2
1.2 The ICP torch 3
1.2.1 Plasma generation 5
1.2.2 Analyte e xcitation and ionization 7
1.3 Detection 9
1.3.1 Plasma viewing mode in ICPOES 9
1.3.2 Wavelength dispersion in ICPOES 11
1.3.3 Detectors in ICPOES 12
1.3.4 Plasma sampling inter face in ICPMS 14
1.3.5 Mass analyzer in ICPMS 15
1.3.6 Detectors in ICPMS 16
1.4 Analytical figures of merit for an ICP spectrometer 17
1.5 Interferences 18
1.5.1 Spectroscopic interferences in ICPOES 18
1.5.2 Spectroscopic interferences in ICPMS 22
1.6 Matrix (non-spectroscopic) interferences 23
1.6.1 Matrix inter ferences in ICPOES 23
1.6.2 Matrix inter ferences in ICPMS 25
1.7 Mitigation of matrix effects 26
1.7.1 Optimizing instrumental parameters 26
1.7.2 Robust plasma approach 27
1.7.3 Calibration strategies 29
1.7.4 Sample pretreatment 31
1.8 Mixed-gas plasmas 32
1.8.1 Mixed-gas plasmas in ICPOES 33
1.8.2 Mixed-gas plasmas in ICPMS 36
1.9 Conclusions 38
References 40
Sample Introduction Systems in ICPMS and ICPOES. https://doi.org/10.1016/B978-0-444-59482-2.00001-4
1.1 Introduction
Elemental analysis via optical emission spectrometry (OES), using an atmospheric pressure inductively coupled plasma (ICP) as an emission source, was first reported by Stanley Greenfield in 1964 [1]. Compared to earlier emission sources such as flames, AC (alternating current) sparks and DC (direct current) arcs, using a plasma source allowed for a high degree of stability, overcoming interference effects due to stable compound formation and exciting a greater number of elements than chemical flame methods [1]. Through the mid-1970s, studies by Velmer Fassel and co-workers lead to refinements to the ICP emission source (i.e., removal of noise sources and the optimization of torch designs, gas flows and plasma settings) that would make it practical for the OES analysis of nebulized solutions [2]. Since the introduction of the first commercially available ICPOES instrument in 1974, the argon (Ar) ICP has been a powerful source for OES, which features a wide linear dynamic range, freedom from chemical interferences (like those experienced in flame atomic absorption spectrometry (FAAS)), the advantage of working with solutions (i.e., better control of homogeneity and simplified calibration), similar precision and better sensitivity than FAAS, and multi-element capability [3,4]. Because all elements of the Periodic Table, with the exception of fluorine (F), helium (He) and neon (Ne) (which have a higher ionization potential than Ar), can be significantly ionized in the Ar ICP, it was coupled to mass spectrometry (MS) in an attempt to add several features: rapid acquisition of mass spectra, low detection limits and easy isotope analysis. Although ICPMS is not as robust (free of chemical interference) as ICPOES, it is nonetheless well established because of its multi-elemental, ultra-trace detection capability with a wider linear dynamic range than ICPOES [5].
In ICPOES/MS, solutions are introduced into the plasma using a nebulizer and spray chamber (see Chapter 2), where a majority of the sample (up to 95%) is lost to the drain [4,6]. Solid sampling techniques such as electrothermal vaporization (ETV; see Chapter 9) and laser ablation (LA; see Chapter 10) are also available when total sample introduction is required and/or the sample must be preserved, respectively. The major issues in ICPOES/MS are sample introduction efficiency and non-spectroscopic interferences (also called matrix effects). Only a handful of specialized systems are capable of 100% sample introduction efficiency for nebulized solutions. The simultaneous introduction of matrix components along with analytes into the plasma can produce both spectroscopic interferences, which bias results high, and matrix effects that can suppress (most of the time) or enhance (occasionally) analyte signals. Internal standardization and especially the method of standard addition can compensate for matrix effects, which nonetheless pose a significant problem for users through the degradation of sensitivity associated with analyte signal suppression. Additionally, the calibration methods used to compensate for matrix effects are susceptible to sample contamination or analyte loss. Instrumental parameters can be optimized within a specific matrix [7]; however, there are very few systems that allow the accurate determination of several elements (>10) in complex sample matrices, without using internal standardization or matrix matching external calibration strategies.
1.2 The ICP torch
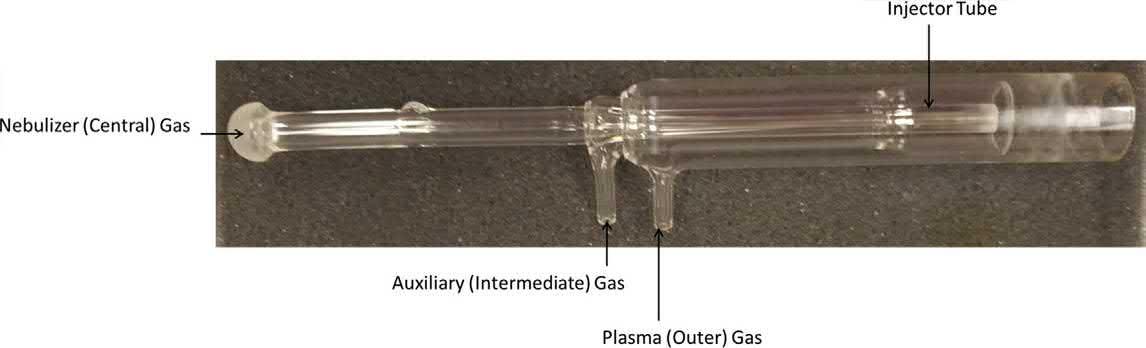
The current conventional ICP torch assembly is similar to the early design reported by Fassel and co-workers [8], which consists of three concentric quartz (fused-silica) tubes (Fig. 1.1). Two tangential gas flow inlets are used for the outer and intermediate channels of the torch, while the inner (or central) gas flow inlet is at the torch base. The Ar gas flow (7–18 L min 1) in the outer tube sustains the plasma and cools the torch walls, so as to prevent melting and allow for the observation of analyte emissions [3]. Typically, the outer tube diameter (i.e., torch diameter) ranges from 9 to 27 mm. The intermediate (called auxiliary) Ar gas flow (0–2 L min 1) positions the plasma above the torch injector (i.e., central or inner tube). Spacing between the outer and intermediate tubes is minimal to ensure that the gas flow between them will emerge at a high velocity and maintain the spiral tangential flow pattern. The inner Ar gas flow (0.5–1.5 L min 1) transports the sample aerosol into the central channel of the plasma [4]. Due to the small diameter of the inner channel (called injector), the high velocity sample aerosol can punch through the base of the plasma. The inner gas flow also serves as the carrier gas for solid aerosols from spark ablation, LA and ETV sample introduction techniques. In the presence of organic solvents, the intermediate Ar gas flow can also be used to dilute the inner gas flow in order to minimize carbon depositions [3] The Ar plasma is observed to have an annular shape with the conventional ICP torch design. Sometimes, other gases, in particular nitrogen (N2) or oxygen (O2) and more rarely hydrogen (H2) [9], can be added to either the central, intermediate and/or outer torch channels to generate mixed-gas plasmas. In most cases, the Ar ICP is first generated and then the other gas is slowly added.
Generally, the conventional torch design is a one-piece torch, which consists of the three concentric quartz tubes sealed together. The one-piece torch provides good stability and is simple to use. However, it is relatively difficult to fabricate. It is also not resistant to hydrofluoric acid (HF) corrosion. Hence, if the torch is damaged, the entire torch must usually be replaced [4]. In addition, devitrification of the quartz tubes can occur because
Fig. 1.1
A photograph of a used ICP torch.
Chapter 1
of alkali contamination on the quartz surface or metal impurities within the quartz being subjected to the high temperature environment of the ICP [10]. Devitrification is a result of the atoms rearranging themselves into an ordered, crystalline structure. Using high temperatures (i.e., high RF power) and/or any additional gases, such as O2, will cause the quartz to devitrify at a faster rate, which will lead to eventual torch melting or cracking. If only the outer tube is damaged, the torch may be repaired, in which case a length of the outer tube is cut off and a new piece is attached. If the attached tube is concentric with the other tubes, then similar performance as with a new torch can be achieved.
A more popular alternative, quickly becoming the standard for most commercially available ICPOES/MS instruments, is the demountable torch design (Fig. 1.2) [11]. Typically, the inner (or injector) tube plugs into the base of an assembly of the outer and intermediate quartz tubes.
Injector Tube
Fig. 1.2
A diagram of a demountable ICP torch [4]
Quartz Tube Assembly
Adapter Tube (with O-rings)
The demountable torch design allows disassembly of the concentric tubes for modification and/or replacement without having to replace the entire torch [12]. This allows for easy interchange of a variety of corrosion-resistant injector tube materials (i.e., ceramic, alumina, sapphire, etc.) and/or different injector bore diameters (0.8–2.5 mm) while still using the same main torch body. Thus, users can easily analyze vastly different sample types without having to change the entire ICP torch. The added advantages of lower torch replacement costs and simpler fabrication have led to the popularity of the demountable torch design among commercial manufacturers of ICP instruments [4]. Finally, there are also reports on low-flow torch designs that are able to use either water [13] or pressurized air [14] to cool the torch and reduce the Ar consumption to <1 L min 1. Because lowering Ar consumption is a prominent concern for ICPOES/MS users, some instrument manufacturers now offer ICP systems that operate with reduced Ar flow rates (such as 9 instead of over 14 L min 1).
1.2.1 Plasma generation
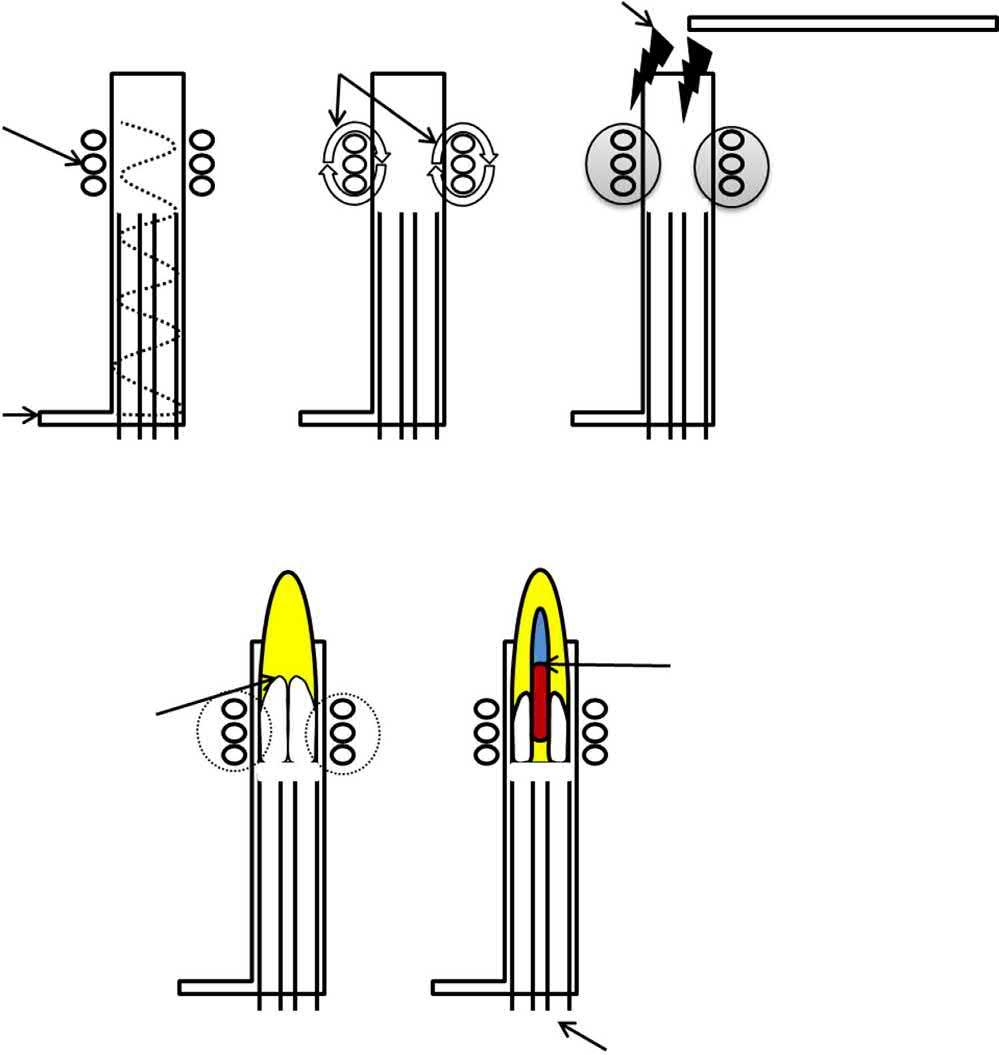
The top of the torch is surrounded by a water or gas cooled, two- or three-turn copper coil (load coil) (or interlaced coils on some instruments) that is connected to a radio frequency (RF) generator. The RF generator serves to supply an alternating current that oscillates at a rate corresponding to the frequency of the generator (27.12 or 40.68 MHz). The high frequency current oscillation creates an electromagnetic field at the top of the torch. With an RF power (750–1500 W) applied to the load coil and Ar gas flowing through the torch, a Tesla spark is used to ionize some Ar atoms within the load coil region (Fig. 1.3). The resulting electrons are accelerated by the magnetic field and ionize more Ar upon collision, in a chain reaction, ultimately forming a high-temperature plasma [3]. The plasma is sustained within the load coil region (i.e., the torch tip) by the inductive coupling process, whereby the energy from the RF generator is continually supplied via the load coil.
The RF generator in a modern ICP instrument is typically free-running, whereby the oscillating frequency and thus the power supplied to the torch are dependent on both the electronic circuitry of the generator and changes in the plasma conditions due to changing solvent or sample types [15]. Changes in plasma conditions are compensated for by an impedance matching network, which matches the impedance of the load (from the ICP) to the output impedance of the RF generator, allowing for maximum energy transfer efficiency [15]. The use of solid-state electronics eliminates the need for the large vacuum-based power amplifier tubes of older RF generators and allows for much smaller dimensions for commercially available ICP instruments. RF generators operating at 40.68 MHz may have improved coupling efficiency and lower background noise compared to generators operating at 27.12 MHz [4].
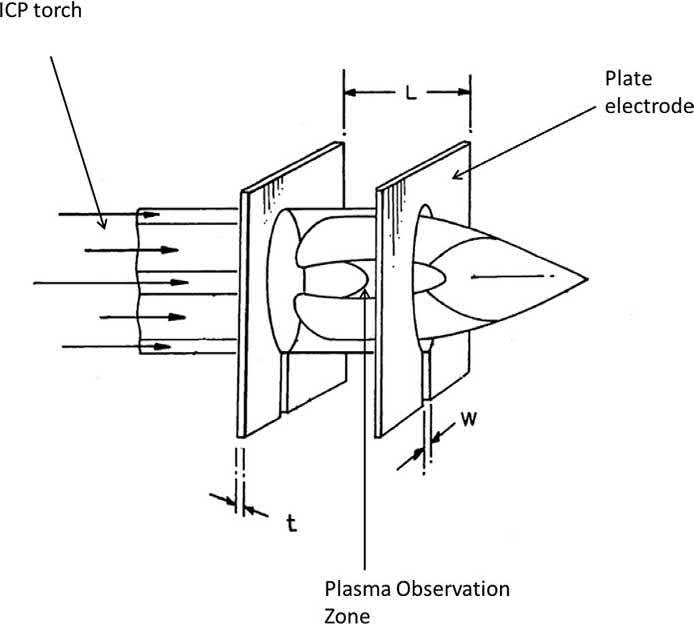
An alternative to the traditional helical-coil induction systems is the Flat Plate™ plasma technology [16,17], which also creates a transversely symmetrical ICP. The system uses a
High voltage spark
Electromagnetic field
RF Load Coil
Collision induced Ar ionization
Formation of ICP discharge
Sample introduction via injector
Fig. 1.3
Graphical depiction of the steps in ICP generation: (A) Tangential Ar flow; (B) application of current to load coil to generate electromagnetic field within torch tip; (C) application of voltage spark; (D) collision induced ionization within load coil induction region; (E) formation of ICP discharge. Adapted from C. B. Boss, K. J. Fredeen. Concepts, Instrumentation and Techniques in Inductively Coupled Plasma Optical Emission Spectrometry. Norwalk, CT, USA: Perkin-Elmer Corporation, (1997).
totally solid-state, free-running 40 MHz RF generator coupled to an electrode consisting of two parallel plates spaced some distance apart. The apertures at the center of the electrode plates allow the tip of the ICP torch to be positioned horizontally (Fig. 1.4). The torch region between the two electrode plates serves as the induction region as opposed to the helical
Tangential Ar Flow
Fig. 1.4
Flat plate RF generation diagram. Adapted from P. J. Morrisroe, T. Myles. ICP-OES and ICP-MS Induction Current. United States of America Patent 7,106,438 B2, (2006).
coils of traditional ICP instruments. This allows for a robust, flat-bottom ICP to be generated and sustained using approximately half the Ar gas consumption of traditional helical-coil induction systems. In addition, the RF power and frequency supplied to each electrode plate can be independently controlled and varied for optimal plasma excitation and emission [16].
1.2.2 Analyte excitation and ionization
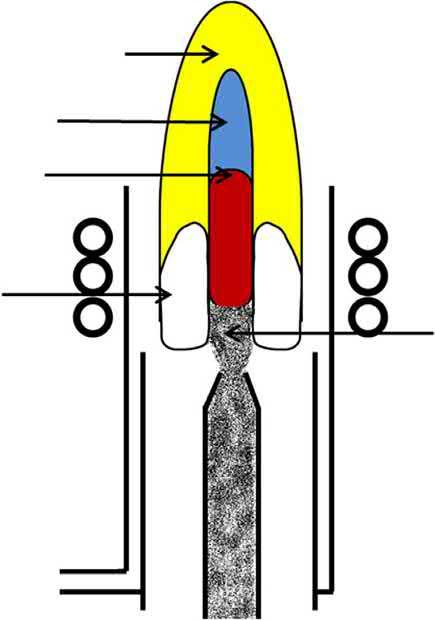
Several regions exist in the ICP (Fig. 1.5) [18,19]. The toroidal (doughnut-shaped) base of the plasma, from the sample aerosol punching a hole in its center, is the induction region, with a temperature of around 10,000 K. The induction region is where energy is transferred from the load coil to the plasma via the inductive coupling process. As the sample aerosol is introduced into the ICP torch injector channel, via the central gas flow (i.e., nebulizer or carrier gas), the desolvation, vaporization and atomization processes will occur in the preheating zone. Desolvation serves to remove the solvent from the sample aerosol droplets, resulting in microscopic solid particles [3]. The sample particles are vaporized into gas phase molecules and then broken into atoms during the vaporization and atomization steps, respectively. Excitation and ionization of the resulting sample atoms occur in the initial radiation zone (IRZ) and normal analytical zone (NAZ), respectively, which are at a temperature of 6000–8000 K. The emitted light from excited atoms and/or ions is collected by the plasma
Induction Region
6000 K
6200 K
6500 K
6800 K
8000 K 10,000 K
Preheating Zone
The various zones in a typical ICP along with approximate temperature regions, in Kelvin (±10%).
viewing optics for detection in ICPOES, whereas an ion beam is extracted from the plasma via a sampling interface in ICPMS. The top of the ICP is called the tail plume [4].
The main excitation and ionization processes are believed to involve collisions of sample atoms with high-energy electrons and/or charge transfer from Ar+ [20,21]. The energy required for the stripping of electrons to form analyte ions is termed the first ionization energy for that analyte. The Saha equation can be used to indirectly estimate the degree of analyte ionization, assuming that the ICP is under local thermodynamic equilibrium (LTE) conditions [22]:
where ni, na and ne refer to the number density of the ions, atoms and electrons, respectively, Zi and Za represent the ionic and atomic partition functions, respectively, T is the plasma temperature, k is the Boltzmann constant, h is the Planck constant, m is the electron mass and Ei is the first ionization energy. The degree of ionization can then be determined by taking the number density ratio of ni to the sum of ni and na. From the Saha equation, the degree of ionization clearly depends on the electron number density, the plasma temperature and the ionization energy of the analyte to be ionized. The degree of ionization for analytes can be determined as a function of the first ionization energy for a given electron number density (i.e., 4 × 1015 cm 3 for an Ar plasma) and ionization temperature [23].
Tail Plume
NAZ IRZ
Fig. 1.5
When additional gases such as N2 are used to generate mixed-gas plasmas, the excitation and ionization processes may be different due to the observable changes in the plasma shape, temperatures, electron density and background emission/signal [9]. The advantages of the ICP over flame or furnace atomizers are its high temperature (6000–8000 K) and high electron density (1014–1016 cm 3), which translate into the efficient atomization of even refractory compounds as well as the reproducible excitation and ionization of nearly all elements in a variety of matrices [4].
1.3 Detection
1.3.1
Plasma viewing mode in ICPOES
The high temperature ICP produces intense emission at several wavelengths for nearly all elements. Analyte emission intensity is dependent on the fraction of ions (or atoms) that are in the excited state within the plasma volume (i.e., usually the NAZ) from which the emission signal is collected [24]. The Boltzmann factor (e -E/kT) is proportional to the population of any particular excited state for an element, where E is the energy of the upper state for the spectroscopic transition, k is the Boltzmann constant and T is the temperature [25]. Each element possesses an average of 294 emission lines at different wavelengths in the ultraviolet (UV)/visible region of the light spectrum (10–800 nm), with some elements, such as H, having <10 and others, such as cesium (Cs), exhibiting 2500 emission lines [26,27]. The specific wavelength of the emission line corresponds to the energy of the emitted photon, which is dependent on the energy difference between the excited and ground states for the ion (or atom). The energy (E) and wavelength (λ) are inversely proportional to one another, based on Planck's equation: (1.2)
= / λ
where h is the Planck constant. Once sensitive emission lines have been identified, selection for quantitative analysis is typically based on specific criteria. An analyte emission line should be free from overlap from other emission lines (or interferences) that arise from sample components or from the plasma. Its emission intensity should also be linearly dependent on analyte concentration. Finally, there should be a low background emission at the particular emission wavelength [28].
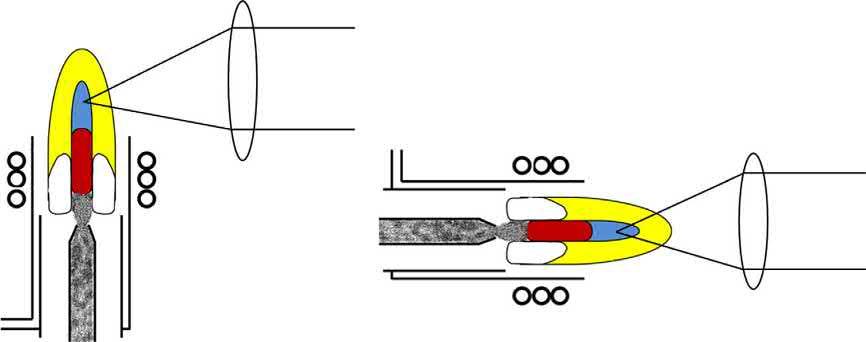
The ICP may be viewed using either a lateral (often called radial, despite the fact that there is a single line of sight) or axial configuration (Fig. 1.6). In both viewing modes, the emitted plasma radiation is collected and focused, using a concave mirror or a convex lens, onto the entrance slit of the spectrometer, or wavelength dispersive device [4]. Most modern ICPOES instruments are capable of the dual view mode, whereby the radiation emitted from the ICP is viewed using both configurations in a quasi-simultaneous manner. The dual view systems allow for users to switch between lateral and axial views, depending on the analyte emission lines sensitivities and detection limits, without having to use a different ICPOES instrument.
Ehc
Fig. 1.6
A comparison of the lateral (side-on) and axial (end-on) modes of viewing the plasma in ICPOES.
Adapted from C. B. Boss, K. J. Fredeen. Concepts, Instrumentation and Techniques in Inductively Coupled Plasma Optical Emission Spectrometry. Norwalk, CT, USA: Perkin-Elmer Corporation, (1997).
Typically, the plasma is viewed laterally (side-on), at 90° to the central channel. The observation height can be adjusted when the focusing optic (lens or mirror) is used in combination with mirrors that permit the collection of emission at different heights above the load coil of the ICP [3]. The observation height must be optimized in the lateral view mode, as there is a considerable background from the Ar around the central channel [29]. On the other hand, the plasma can also be viewed axially (end-on) in order to improve detection limits [30,31]. The improved detection limits, when using the axial mode, are a result of the reduced Ar background, an increase in analyte path length through the ICP and an increase in the plasma observation region, compared to the lateral viewing mode [4,29]. An added benefit of using the axial viewing mode is eliminating the need to adjust the observation height; however, the torch must still be centered, on axis, to the optical observation region. This is typically accomplished using a motor driven x, y, z-translational stage [29]. Unfortunately, matrix effects are more severe with the axial viewing mode, as the atomization zone (IRZ) is incorporated, along with the NAZ, in the plasma observation region [32]. Thus, when complex sample matrices are analyzed (i.e., requiring robust plasma conditions), the lateral view configuration offers the best performance in terms of analytical figures of merit [30,33,34]. The lateral viewing mode also offers shorter instrument warm-up times, compared to the axial viewing mode [30].
In the axial viewing mode, it is especially important to prevent damage to the instrument optics used for the transmission of the emitted plasma radiation. At the tip of the tail plume region in the ICP, there is an unstable recombination zone of Ar and hot air, which must be eliminated, not only to protect the instrument optics, but to ensure adequate transmission of light [29]. Atomic resonance lines are strongly absorbed by the outer fringe of the plasma, when using the axial viewing mode [35]. This issue is overcome by a variety of instrumental design modifications, such as using a cross-flow shear gas [36–38], using an end-on gas flow [39–41] or using a metallic skimmer cone interface [42], in order to divert the cool,
The inductively coupled plasma as a source
outer plasma fringe from the optical path to the spectrometer [37]. The typical gases used for such designs are air, Ar, N2 or He [37]. Not all commercial manufacturers use the same instrumental design modifications for the axially viewed plasma configuration, although the cross-flow shear gas does seem to be the most common [37].
1.3.2 Wavelength dispersion in ICPOES
Once the emitted plasma radiation has been collected using the focusing optics, the emission of one analyte must be differentiated from the emission of another analyte and/ or interferences, using a spectrometer. The spectrometer functions to focus the incoming polychromatic light onto a reflection diffraction grating, so as to achieve wavelength dispersion and to focus the dispersed, monochromatic light onto the exit slit plane or circle, where it arrives at the detector [3,4]. A monochromator allows the measurement of emission at a single wavelength at a time, measurement at a range of wavelengths requiring a rotation of the grating. Polychromators on the other hand allow simultaneous detection at a wide range of wavelengths [3,4]. The ability to detect several elements simultaneously is particularly useful for transient signals and allows for a high sample throughput. Hence, most of the instruments sold today use a polychromator in one of two configurations. The most compact polychromator uses a prism combined to an echelle grating for two-dimensional dispersion of the emission spectrum. The other polychromator involves a Rowland circle with a concave grating to disperse light onto detectors positioned around the circle.
In order to measure the signal from one emission line (or wavelength) without having interferences from the numerous other spectral emission lines generated by the ICP source, the spectrometer must have a high enough resolution (or resolving power, R). The resolving power required to separate the signal from any two adjacent emission lines is:
(1.3)
where λ is the average of the two emission line wavelengths and Δλ is the difference in wavelength between the two emission lines. The resolving power for a grating is given by: (1.4)
where n is the order of diffraction and N is the total number of grooves in the grating that are exposed to light from the entrance slit [43]. With an echelle grating, a prism is used to separate the orders of diffraction, dispersion in each order being done by the grating.
The echelle grating is a coarsely ruled grating that uses a much higher blaze angle than conventional gratings in the fabrication process. The blaze angle simply refers to the angle of the cut for the groove on the grating surface. As a result, the echelle grating has a much higher angle of dispersion and results in higher orders of diffraction (n > 1), whereas conventional diffraction gratings are usually optimized for first-order diffraction (n = 1) [43]. A second
dispersion component, usually a prism, is then required to sort the overlapping higher order diffractions at right angles to the echelle grating, which generates a two-dimensional pattern called an echellogram [4]. The echellogram, which can be read with an array type detector, has wavelength on one axis and the diffraction order on the other axis. Compared to conventional grating-based systems, the echelle grating offers superior resolution, as higher diffraction orders are used [3].
In contrast, the polychromator with a Rowland geometry is composed of an entrance slit, a Paschen-Runge mounted concave grating and several detectors on the periphery of a Rowland circle [4]. In this design, the incoming light from the plasma enters the Rowland circle, is dispersed by the concave grating placed on the circumference of the circle and arrives at multiple detectors around the circle for detection [44]. Because the diameter of the Rowland circle is equal to the radius of curvature of the concave grating, the diffracted light will always be focused on the circle periphery. This feature allows the Rowland geometry to eliminate the need for any collimating or focusing lenses or mirrors [3,45]. However, the lack of lenses and mirrors along with the Rowland circle diameter result in the overall size of the instrument housing being relatively large.
1.3.3 Detectors in ICPOES
Once the light emitted from the ICP has been dispersed, the emitted photons must be converted into an electronic signal that can measured. In earlier ICPOES instruments, detection of the analyte emission intensity, at isolated wavelengths, was done using photomultiplier tube (PMT) based polychromators or sequential monochromators [4,24,46]. PMT-based polychromators offer high sample throughput, but suffer from versatility in measuring the entire spectrum, whereas using sequential spectrometers offers high spectral versatility, but suffers from relatively low sample throughput [37]. In modern instrument designs, these obstacles have been largely overcome by using solid-state charge transfer device (CTD) array detectors, such as the charge coupled device (CCD) or the chargeinjection device (CID), which are able to simultaneously capture the entire spectrum (120–800 nm) [4,12,47].
The PMT consists of a vacuum tube that contains a photocathode, a series of dynodes (9–16) and an anode. The photocathode is composed of photoemissive material that serves to eject electrons when a photon hits the surface, provided that the energy of the photon is greater than the work function of the photocathode material (typically an alkali metal oxide) [3] Electrons ejected by the photocathode are accelerated toward the first dynode, which in turn ejects two to five secondary electrons per electron that strikes its surface. The secondary electrons from the first dynode then strike the second dynode, ejecting more electrons that strike the third dynode and so on through the series of dynodes. The dynodes have an increasingly negative gradient potential applied to them, where the potential is roughly 100 V
The inductively coupled plasma as a source
more negative for each successive dynode [3]. Thus, by the time it reaches the anode, the electron signal generated from a single photon, emitted by the ICP, has been significantly multiplied. The gain (G) factor, for a PMT with n number of dynodes emitting x secondary electrons, is given by: (1.5)
The gain may be as high as 108, depending on the voltage gradient across the PMT, and it is accomplished with very little to no increase in noise, which is ideal for the detection of trace analyte signals in ICPOES [43]. On sequential monochromators, multi-element detection is achieved by changing the grating angle to effectively scan through the wavelengths arriving at the PMT. Simultaneous detection at several wavelengths is also possible by positioning several PMTs along the focal curve or focal plane of the spectrometer. However, this approach is limited by the spectrometer geometry and the PMT size.
CTDs, such as the CCD or the CID, are solid-state silicon-based array detectors, which are relatively small in size and usually more effective than PMTs for simultaneous multi-element detection [48–50]. In the CTD, photons arriving at the p-type silicon semiconductor material substrate will generate electron-hole pairs [48]. The electron holes are positive and freely migrate through the p-type silicon substrate. The negative electrons are collected and temporarily stored using a two-dimensional array of metal oxide semiconductor (MOS) capacitors. A MOS capacitor consists of a small metal electrode and a thin silicon oxide insulating layer on top of the p-type silicon substrate. Upon applying a positive potential to the metal electrode, the electrons are ensnared just under the silicon oxide insulation layer. Each individual MOS capacitor is referred to as a pixel, with widths of 5–50 μm and lengths up to 200 μm [3]. Electrons will accumulate in the potential well of each pixel (up to 106 charges); however, if too many electrons are accumulated at one pixel, the charges will leak or “bloom” into an adjacent pixel. The two-dimensional pixel array can vary from 512 × 512 to 4096 × 4096 [43]. The CTD pixel arrays are positioned strategically along the focal curve (i.e., the periphery of a Rowland circle) or the focal plane (i.e., the two-dimensional echellogram) of the spectrometer to achieve simultaneous detection of several wavelengths. Typically, the entire spectrum (120–800 nm) can be recorded simultaneously. The electronic signal from each pixel is then presented to a readout amplifier.
The difference between the CCD and the CID is the manner in which the charge from each pixel is delivered to the readout amplifier [3]. For a CCD, the charges from each pixel are shifted systematically through the array and arrive at the readout amplifier in a sequential manner. Alternatively, the CID uses a non-destructive random-access mode where the readout amplifier is sequentially connected to each pixel in the array, using a multiplex system, which allows the charge from any one pixel to be delivered to the readout amplifier [48]. A popular commercial array design is the segmented array charge coupled device detector (SCD) for an echelle spectrometer. The SCD uses >200 subarrays (20–80 pixels each) that are positioned
along the focal plane, with each subarray corresponding to one of the 236 most prominent emission line wavelengths for 70 elements. This approach allows for discrete wavelength measurements and collection of spectral data in the vicinity of the analytical wavelength, without having to tediously scan the entire spectrum [51]. Another approach involves image-mapping the detector, whereby the CCD array is custom-designed to match the exact two-dimensional echellogram image on the focal plane [52]. Compared to earlier PMT detectors, the CCD is a rugged imaging detector that offers a large linear dynamic range, high sensitivity and low background noise levels, which is ideal for ICP spectrometry [12]. The low noise and high sensitivity of CCD detectors also allows for the determination of halogens and non-metal elements in the low UV range (120 nm) of the emission spectrum [37] if the spectrometer is evacuated or filled with inert gas (such as Ar).
1.3.4 Plasma sampling interface in ICPMS
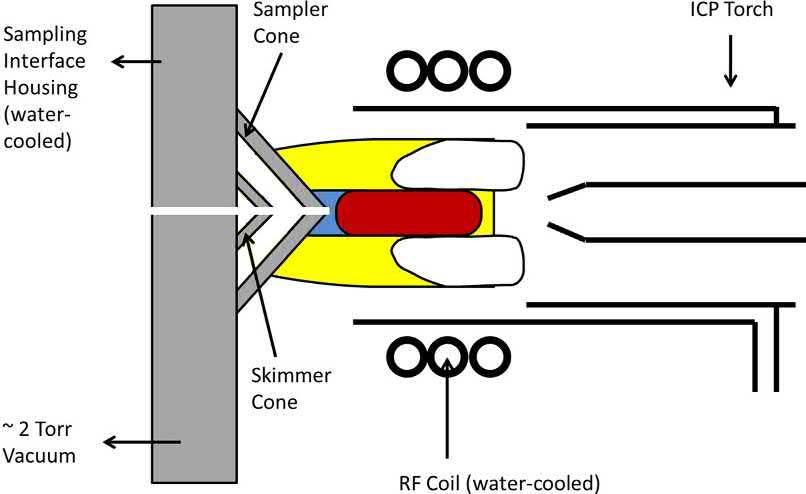
The ICP torch is typically aligned onto a sampling interface, which serves to extract ions from the atmospheric pressure plasma via a differentially pumped system (see Fig. 1.7) that evacuates the majority of the Ar [53]. The differentially pumped interface usually consists of two nickel (Ni) (or platinum (Pt) [54]) cones, within a water-cooled copper or aluminum (Al) housing that is maintained at ~2 Torr using a mechanical roughing pump. The first (sampler) cone has an orifice diameter of 0.8–1.2 mm, while the second (skimmer) cone has an orifice diameter of 0.4–0.8 mm. There may also be a third (hyper skimmer) cone in some ICPMS instruments, which simply allows for a more gradual pressure reduction and thus, reduced
Fig. 1.7
A diagram of the plasma sampling interface for ICP-MS. Adapted from Y. Makonnen, N. Sadiq, D. Beauchemin. Inductively coupled plasma mass spectrometry. in The Encyclopedia of Plasma Technology. Taylor & Francis Group (2017) pp. 623–654.
The inductively coupled plasma as a source
dispersion of the extracted ion beam [55]. Ions pass through the extraction cones and are guided to the mass analyzer and detector, using a series of ion lenses and/or mirrors [53]. For maximum sensitivity (i.e., slope of the calibration curve), the ICP is positioned so that the sampler orifice is a few mm downstream from the tip of the IRZ (i.e., near the onset of the NAZ).
In order to prevent the formation of a secondary discharge between the ICP and the sampling interface, due to the electrostatic (capacitive) coupling between the ICP and load coil (potential difference of 100–200 V), the load coil must be appropriately grounded [56]. The secondary discharge may lead to a wide spread in the kinetic energy of sampled ions, an increase in the number of doubly charged ions and the generation of ions from the sampling interface itself, which inevitably reduces the lifetime of the cones [53]. There are a variety of methods that can be used to electrically ground the interface: (1) balance the oscillator within the electronic circuitry of the RF generator [57]; (2) insert a grounded shield or plate between the torch and load coil [58]; (3) use two interlaced load coils, where the RF fields travel in opposite directions [59].
1.3.5 Mass analyzer in ICPMS
The mass analyzer serves to separate the extracted ions from the ICP based on the massto-charge (m/z) ratio. It is usually maintained under vacuum (<10 6 Torr) using a turbomolecular pump. There are a few different types of mass analyzers, all of which will exhibit a non-uniform response across the mass range (i.e., mass bias). This mass bias may be corrected for by using an internal standard, with another element in the sample (such as 203Tl/205Tl to correct Pb207/Pb208), or an external correction, with standards of known isotopic makeup [60]. There are several thorough investigations in the literature as to the operational principles, features and applications of the different mass analyzers that can be used within an ICPMS instrument [24, 61–65]. The three main categories are quadrupole, sector field and time-of-flight (ToF) mass analyzers. One important characteristic is their resolving power (R): (1.6)
where m is the nominal mass of the desired peak and Δm is the mass difference between two resolved peaks of equal intensity. A typical quadrupole has a resolving power of 300–400 [66]. The corresponding resolution, i.e., peak width at 10% of peak height, is typically 0.7–1.0 amu. The abundance sensitivity is the ratio of the analyte signal, at its m/z, to the signal at the same m/z contributed by an ion at an adjacent m/z (i.e., either one mass lower or one mass higher) and is typically >106 [67]. Abundance sensitivity determines the capability to perform accurate ultra-trace determinations in real samples. The double focusing (DF) sector field instruments [68–70] offer the highest resolving power, up to around 10,000. The current commercially available ToF instruments [71–74] offer intermediate resolving power, of 2000–3000.
Instead of increasing resolving power when an ion has the same m/z as the analyte, a collision/ reaction cell (CRC) can be used upstream from the quadrupole or other mass analyzer to mitigate spectroscopic interferences. Although a quadrupole can be operated with a narrow bandwidth, a hexapole or octopole is generally preferred as a CRC [64,75,76]. Collision gases will fragment interfering polyatomic ions, while reaction gases will chemically modify the interfering (or analyte) ions. Both of these methods serve to shift the m/z of the interfering ion (or analyte ion) so that the analyte may be measured at a m/z without the spectroscopic interference [77,78]. The collision gas may also be introduced via a hollow skimmer cone (collision reaction interface or CRI) to achieve a similar effect. Although using the CRC usually results in some loss in sensitivity, the signal-to-background ratio is improved. He, H2, O2, methane (CH4) and ammonia (NH3) are commonly employed as collision/reaction gases. Other gases may be used as well, depending on the analyte. Tandem MS-MS, where the CRC is located between two quadrupoles, can also be useful to mitigate spectroscopic interferences [79], while also drastically increasing selectivity, accuracy and the linear dynamic range that can be obtained relative to the single quadrupole [80]
1.3.6 Detectors in ICPMS
After the mass analyzer, an electrostatic deflector is used to push the separated ions into a discrete dynode electron multiplier (DDEM), which is generally perpendicular to the ion beam axis, so that the background from neutrals and photons can be minimized. A series of dynodes (10–24), with an increasingly negative potential gradient applied to them, is used to amplify the signal of one incident ion that strikes the primary dynode [81]. If the mass and energy of the incident ion is appropriate to overcome the dynode plating work function, the primary dynode will emit secondary electrons that are propelled to the next dynode in the series, to produce even more secondary electrons, and so on through the series of dynodes. Depending on the application intended (i.e., high ion current versus ultra-trace analysis) the signal gain with a DDEM is 104–108 [61]
A Faraday cup can also be used for ion detection and is a robust, yet cost-effective alternative to DDEMs. The narrow and deep cup shape is designed to collect ions emerging form the mass analyzer, with the ions transferring their charge to the conductive surface material of the cup upon impact. An electrical circuit is used to discharge the accumulated ion charge, where the resulting current I (in amp) corresponds to the ion beam intensity and is measured via: (1.7)
where N is the number of ions observed, t is the integration time (in s) and e is the charge of an electron. As few as 104 ions can be detected [81]; however, the charge detection may be affected by secondary electrons released from the incident ion striking the cup surface or by backscattering of the incident ion. The secondary electrons can be prevented from escaping the cup or from entering from outside the cup via a secondary electron suppressor. Faraday
The inductively coupled plasma as a source 17 cups are regarded for their accuracy, as they provide unity gain [82]. Despite not being as sensitive as the DDEM, the Faraday cup is preferred in multi-collector (MC) instruments for isotope ratio measurements, where several cups are used to simultaneously measure ions over a small m/z range [83].
There are also array detectors, which have been implemented in commercially available DFMS instruments with the Mattauch-Herzog geometry [81]. An example is the active pixel sensor (APS) array [84]. Compared to passive devices like CCDs, where there is a single amplifier for several pixels, each APS pixel has its own amplifier. An incident ion arriving from the mass analyzer will hit the conductive surface of a linear array of Faraday cups, whereby the charge of the ion is transmitted to a field-effect transistor (FET) gate. The gate voltage is inversely related to the capacitance between the ground and the Faraday cup, with detection being based on the variation in the gate voltage (down to μV). Unfortunately, the pixels are read in a serial manner instead of simultaneously [84].
1.4 Analytical figures of merit for an ICP spectrometer
There are several complex diagnostic techniques that have been used to investigate the fundamental mechanisms within the ICP and determine the effect of operating parameters [85,86]. The radial intensity distributions of the emission lines can be determined using Abel inversion measurements [87,88]. Thomson scattering and Rayleigh scattering techniques can be used to provide time-resolved measurements on the distribution of electrons and neutral Ar atoms [85,89,90]. These sophisticated diagnostic tools have been used to reduce or eliminate sources of noise and matrix interferences [91]. However, they are not available to the average user with a commercially available ICPOES/MS instrument.
Fortunately, there are simple diagnostic tests that can be performed by the user to evaluate plasma conditions [92]. A specific set of analytical figures of merit, proposed by Mermet and co-workers based on simple diagnostic tests, can serve to characterize an analytical method for elemental analysis [33]:
(1) number of elements, (2) selectivity (or lack of susceptibility to spectroscopic interferences), (3) precision (or the repeatability), (4) long-term stability, (5) robustness (or lack of susceptibility to matrix effects), (6) detection limits and (7) accuracy.
The number of elements that can be detected by an ICPOES instrument is dependent on the UV/visible light spectrum that can be observed, with the widest range covered being 120–800 nm [33]. The number of elements detectable with ICPMS is dependent on the accessible mass range (amu), usually 1–320 amu, and the selectivity.
Selectivity in ICPOES can be gauged using the full width at half-maximum of the Ba II 230 nm line (or the Cd II 228 nm line) and Ba II 455 nm line profiles [92]. The 230 nm region is typically used as it includes many sensitive analyte emission lines [93]. Selectivity in ICPMS can be gauged by the resolving power, abundance sensitivity (low mass and high mass sides) and scan speed (amu/s) of the mass analyzer, along with the linear dynamic range of the detector [67].
The precision is typically determined by measuring the percent relative standard deviation (%RSD) of an analyte signal (significantly higher than the detection limit) for several (>10) replicates, while using standard integration times for the instrument optics. Long-term stability can be defined in terms of warm-up time and instrumental drift, using selected analyte emission lines or m/z. Warm-up time is the time taken by the instrument from plasma ignition to the collection of a stable analyte emission signal (%RSD < 5). Instrumental drift is measured by the %RSD of the analyte signal over long periods of operation [94].
Robustness of the ICP can be gauged by using the Mg II 280.270 nm/Mg I 285.213 nm line intensity ratio in ICPOES [95,96]. A ratio above 10 indicates robust plasma conditions, where the ICP should be relatively free of matrix interferences and shows improved transfer of energy from the bulk plasma to the central channel [97,98]. Conversely, when the Mg II/ Mg I ratio is below 4, the ICP is highly susceptible to matrix interferences, and mitigating calibration strategies, such as internal standardization, should be employed [33]. In ICPMS, the Be+/Li+ ratio was proposed as a robustness indicator, where a ratio of 0.25–0.30 should be obtained from an equimolar solution of Be and Li [99], but its validity across many different instruments has not been demonstrated. Instead, the oxide (MO+/M+) and doubly charged (M2+/M+) fractions around 1.5%, a removal of matrix effects and the complete ionization of elements with a high ionization potential (such as As or Zn) are used to indicate a robust plasma [7,67,98].
Limits of detection (LODs) are defined as the lowest analyte concentration, above the blank solution, that can be detected with certainty. The LOD is generally defined as three times the standard deviation of the blank's signal divided by the slope of the calibration curve (i.e., the sensitivity). In ICPOES, the Ni II 231.604 nm emission line may be used as a representative line for the behavior of ionic analytical lines because it has a high sum of excitation and ionization energies (14.01 eV) [100]. Accuracy, or closeness to the true value, is assessed through the analysis of certified reference materials (CRMs), by comparing the measured concentrations to the certified ones.
1.5 Interferences
1.5.1 Spectroscopic interferences in ICPOES
Due to the very large number of analyte emission lines existing in an ICP excitation source, there can be several matrix and/or background emission lines overlapping analyte
The inductively coupled plasma as a source
emission lines. Of course, as the complexity and concentration of the sample or matrix increases, the prevalence of spectroscopic overlap is more troublesome. As discussed previously, the most practical method to separate the intensity of adjacent emission line wavelengths is to use a spectrometer with a high enough resolving power. Sometimes, even the highest resolution spectrometer will not be able to separate the spectroscopic interference from the analyte signal. Thus, another analyte emission line, free of spectroscopic interference, needs to be chosen or background correction techniques need to be employed. In general, there are four background correction techniques corresponding to the four types of spectroscopic interferences: (1) simple background shift, (2) sloping background shift, (3) direct spectral overlap and (4) complex background shift [4].
A simple background shift is the most common and usually the easiest to correct for. It involves an increase or decrease in the background intensity, which is essentially constant for a given region (i.e., 0.5 nm) on either side of the analyte emission line. Without correcting for the background emission, analyte determinations will have a positive bias. A single background correction point is selected somewhere along the spectral profile of the analyte emission, usually on either side of the analyte wavelength, without incorporating the actual analyte peak (Fig. 1.8). The intensity of this background correction point is then subtracted from the intensity of the analyte emission line [3].
Fig. 1.8
Single-point background correction for the simple background shift from 1000 mg/L Al on the W 207.911 nm line. Adapted from C. B. Boss, K. J. Fredeen. Concepts, Instrumentation and Techniques in Inductively Coupled Plasma Optical Emission Spectrometry. Norwalk, CT, USA: Perkin-Elmer Corporation, (1997).