Chapter1 FundamentalsofReservoirFluid Behavior
Naturallyoccurringhydrocarbonsystemsfoundinpetroleumreservoirsare mixturesoforganiccompoundsthatexhibitmultiphasebehavioroverwide rangesofpressuresandtemperatures.Thesehydrocarbonaccumulationsmay occurinthegaseousstate,theliquidstate,thesolidstate,orinvariouscombinationsofgas,liquid,andsolid.
Thesedifferencesinphasebehavior,coupledwiththephysicalpropertiesof reservoirrockthatdeterminetherelativeeasewithwhichgasandliquidare transmittedorretained,resultinmanydiversetypesofhydrocarbonreservoirs withcomplexbehaviors.Frequently,petroleumengineershavethetasktostudy thebehaviorandcharacteristicsofapetroleumreservoirandtodeterminethe courseoffuturedevelopmentandproductionthatwouldmaximizetheprofit.
Theobjectiveofthischapteristoreviewthebasicprinciplesofreservoir fluidphasebehaviorandillustratetheuseofphasediagramsinclassifyingtypes ofreservoirsandthenativehydrocarbonsystems.
CLASSIFICATIONOFRESERVOIRSANDRESERVOIRFLUIDS
Petroleumreservoirsarebroadlyclassifiedasoilorgasreservoirs.Thesebroad classificationsarefurthersubdivideddependingon:
Thecompositionofthereservoirhydrocarbonmixture
Initialreservoirpressureandtemperature
Pressureandtemperatureofthesurfaceproduction
Theconditionsunderwhichthesephasesexistareamatterofconsiderablepracticalimportance.Theexperimentalorthemathematicaldeterminationsofthese conditionsareconvenientlyexpressedindifferenttypesofdiagramscommonly called phasediagrams. Onesuchdiagramiscalledthe pressure-temperature diagram.
Pressure-TemperatureDiagram
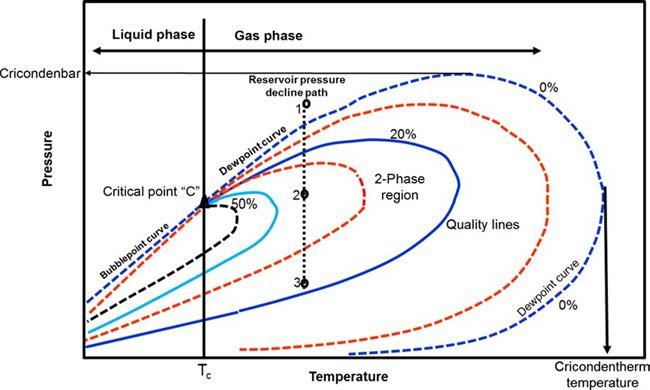
Figure1-1 showsatypicalpressure-temperaturediagramofamulticomponent systemwithaspecificoverallcomposition.Althoughadifferenthydrocarbon
Atypicalp-Tdiagramforamulticomponentsystem.
systemwouldhaveadifferentphasediagram,thegeneralconfigurationis similar.
Thesemulticomponentpressure-temperaturediagramsareessentiallyusedto:
Classifyreservoirs
Classifythenaturallyoccurringhydrocarbonsystems
Describethephasebehaviorofthereservoirfluid
Tofullyunderstandthesignificanceofthepressure-temperaturediagrams,itis necessarytoidentifyanddefinethefollowingkeypointsonthesediagrams:
Cricondentherm(Tct)—TheCricondenthermisdefinedasthemaximum temperatureabovewhichliquidcannotbeformedregardlessofpressure (pointE).ThecorrespondingpressureistermedtheCricondenthermpressurepct
Cricondenbar(pcb)—TheCricondenbaristhemaximumpressureabove whichnogascanbeformedregardlessoftemperature(pointD).ThecorrespondingtemperatureiscalledtheCricondenbartemperatureTcb.
Criticalpoint—Thecriticalpointforamulticomponentmixtureisreferred toasthestateofpressureandtemperatureatwhichallintensiveproperties ofthegasandliquidphasesareequal(pointC).Atthecriticalpoint,the correspondingpressureandtemperaturearecalledthecriticalpressurepc andcriticaltemperatureTc ofthemixture.
Phaseenvelope(two-phaseregion)—Theregionenclosedbythebubblepointcurveandthedew-pointcurve(lineBCA),whereingasandliquid
2-Phase region
FIGURE1-1
coexistinequilibrium,isidentifiedasthephaseenvelopeofthehydrocarbonsystem.
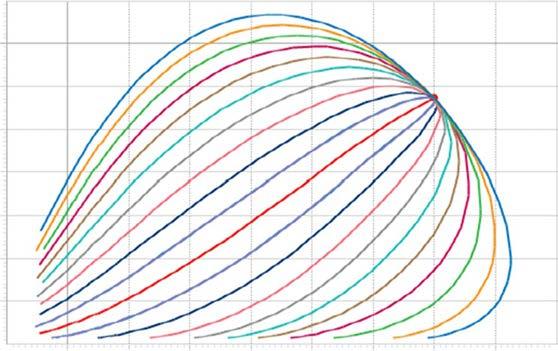
Qualitylines—Thedashedlineswithinthephasediagramarecalledquality lines.Theydescribethepressureandtemperatureconditionsforequalvolumesofliquids.Notethatthequalitylinesconvergeatthecriticalpoint (pointC).
Bubble-pointcurve—Thebubble-pointcurve(lineBC)isdefinedasthe lineseparatingtheliquid-phaseregionfromthetwo-phaseregion.
Dew-pointcurve—Thedew-pointcurve(lineAC)isdefinedastheline separatingthevapor-phaseregionfromthetwo-phaseregion.
Ingeneral,reservoirsareconvenientlyclassifiedonthebasisofthelocationof thepointrepresentingtheinitialreservoirpressurepi andtemperatureTwith respecttothepressure-temperaturediagramofthereservoirfluid.Accordingly, reservoirscanbeclassifiedintobasicallytwotypes.Theseare:
Oilreservoirs—IfthereservoirtemperatureTislessthanthecriticaltemperatureTc ofthereservoirfluid,thereservoirisclassifiedasanoil reservoir.
Gasreservoirs—Ifthereservoirtemperatureisgreaterthanthecriticaltemperatureofthehydrocarbonfluid,thereservoirisconsideredagasreservoir.
OilReservoirs
Dependinguponinitialreservoirpressurepi,oilreservoirscanbesubclassified intothefollowingcategories:
1. Undersaturatedoilreservoir. Iftheinitialreservoirpressurepi (asrepresentedbypoint1on Figure1-1),isgreaterthanthebubble-pointpressurepb ofthereservoirfluid,thereservoirislabeledanundersaturatedoilreservoir.
2. Saturatedoilreservoir. Whentheinitialreservoirpressureisequaltothe bubble-pointpressureofthereservoirfluid,asshownon Figure1-1 bypoint 2,thereservoiriscalledasaturatedoilreservoir.
3. Gas-capreservoir. Iftheinitialreservoirpressureisbelowthebubblepoint pressureofthereservoirfluid,asindicatedbypoint3on Figure1-1,thereservoiristermedagas-caportwo-phasereservoir,inwhichthegasorvapor phaseisunderlainbyanoilphase.
Crudeoilscoverawiderangeinphysicalpropertiesandchemicalcompositions, anditisoftenimportanttobeabletogroupthemintobroadcategoriesofrelated oils.Ingeneral,crudeoilsarecommonlyclassifiedintothefollowingtypes:
Ordinaryblackoil
Low-shrinkagecrudeoil
High-shrinkage(volatile)crudeoil
Near-criticalcrudeoil
4 ReservoirEngineeringHandbook
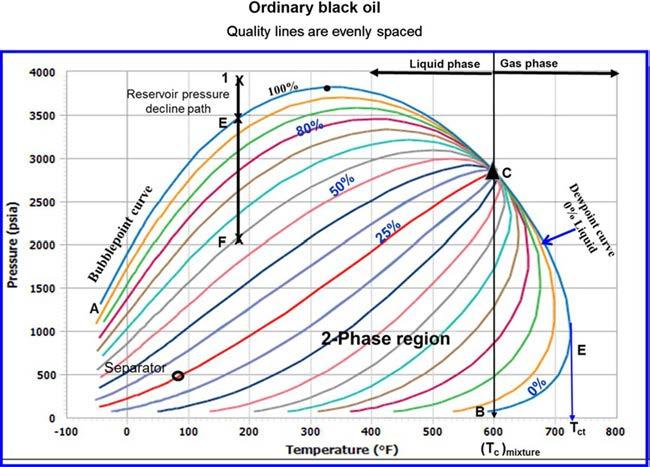
Atypicalp-Tdiagramforanordinaryblackoil.
Theaboveclassificationsareessentiallybaseduponthepropertiesexhibitedby thecrudeoil,includingphysicalproperties,composition,gas-oilratio,appearance,andpressure-temperaturephasediagrams.
1. Ordinaryblackoil. Atypicalpressure-temperaturephasediagramforordinaryblackoilisshownin Figure1-2.Itshouldbenotedthatqualitylines, whichareapproximatelyequallyspacedcharacterizethisblackoilphase diagram.Followingthepressurereductionpathasindicatedbythevertical lineEFon Figure1-2,theliquidshrinkagecurve,asshownin Figure1-3,is preparedbyplottingtheliquidvolumepercentasafunctionofpressure.The liquidshrinkagecurveapproximatesastraightlineexceptatverylowpressures.Whenproduced,ordinaryblackoilsusuallyyieldgas-oilratios between200–700scf/STBandoilgravitiesof15to40API.Thestocktank oilisusuallybrowntodarkgreenincolor.
2. Low-shrinkageoil. Atypicalpressure-temperaturephasediagramforlowshrinkageoilisshownin Figure1-4.Thediagramischaracterizedbyquality linesthatarecloselyspacednearthedew-pointcurve.Theliquid-shrinkage curve,asgivenin Figure1-5,showstheshrinkagecharacteristicsofthiscategoryofcrudeoils.Theotherassociatedpropertiesofthistypeofcrudeoil are:
Oilformationvolumefactorlessthan1.2bbl/STB
Gas-oilratiolessthan200scf/STB
Oilgravitylessthan35° API
FIGURE1-2
FIGURE1-3 Liquid-shrinkagecurveforblackoil.
Quality lines are distant from the bubble-point curve
FIGURE1-4 Atypicalphasediagramforalow-shrinkageoil.
Blackordeeplycolored Substantialliquidrecoveryatseparatorconditionsasindicatedbypoint Gonthe85%qualitylineof Figure1-4.
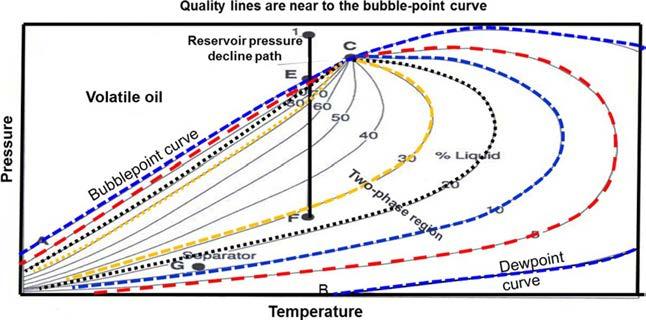
3. Volatilecrudeoil. Thephasediagramforavolatile(high-shrinkage)crude oilisgivenin Figure1-6.Notethatthequalitylinesareclosetogethernear thebubble-pointandaremorewidelyspacedatlowerpressures.Thistypeof crudeoiliscommonlycharacterizedbyahighliquidshrinkageimmediately
Oil-shrinkagecurveforlow-shrinkageoil.
FIGURE1-6 Atypicalp-Tdiagramforavolatilecrudeoil.
belowthebubble-pointasshownin Figure1-7.Theothercharacteristic propertiesofthisoilinclude:
Oilformationvolumefactorlessthan2bbl/STB
Gas-oilratiosbetween2,000-3,200scf/STB
Oilgravitiesbetween45-55° API
LowerliquidrecoveryofseparatorconditionsasindicatedbypointGon
Figure1-6
Greenishtoorangeincolor
AnothercharacteristicofvolatileoilreservoirsisthattheAPIgravityofthe stock-tankliquidwillincreaseinthelaterlifeofthereservoirs.
FIGURE1-5
FIGURE1-7 Atypicalliquid-shrinkagecurveforavolatilecrudeoil.
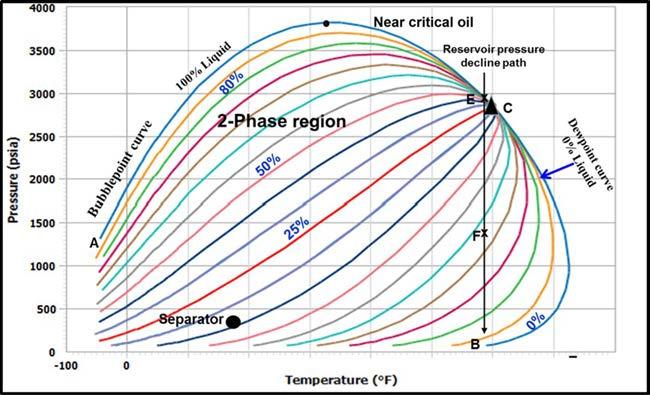
4. Near-criticalcrudeoil.IfthereservoirtemperatureTisnearthecritical temperatureTc ofthehydrocarbonsystem,asshownin Figure1-8,the hydrocarbonmixtureisidentifiedasanear-criticalcrudeoil.Becauseall thequalitylinesconvergeatthecriticalpoint,anisothermalpressuredrop (asshownbytheverticallineEFin Figure1-8)mayshrinkthecrudeoil from100%ofthehydrocarbonporevolumeatthebubble-pointto55% orlessatapressure10to50psibelowthebubble-point.Theshrinkagecharacteristicbehaviorofthenear-criticalcrudeoilisshownin Figure1-9.The
FIGURE1-8 Aschematicphasediagramforthenear-criticalcrudeoil.
FIGURE1-9 Atypicalliquid-shrinkagecurveforthenear-criticalcrudeoil.
How near are the quality lines to the bubblepoint curve will determine the type of crude oil
(A) Low-shrinkage oil
(B)Ordinarybalckoil
(C) High-shrinkage oil
(D)Nearcriticaloil
FIGURE1-10 Liquidshrinkageforcrudeoilsystems.
near-criticalcrudeoilischaracterizedbyahighGORinexcessof3,000scf/ STBwithanoilformationvolumefactorof2.0bbl/STBorhigher.Thecompositionsofnear-criticaloilsareusuallycharacterizedby12.5to20mol% heptanes-plus,35%ormoreofethanethroughhexanes,andtheremainder methane.
Figure1-10 comparesthecharacteristicshapeoftheliquid-shrinkagecurvefor eachcrudeoiltype.
GasReservoirs
Ingeneral,ifthereservoirtemperatureisabovethecriticaltemperatureofthe hydrocarbonsystem,thereservoirisclassifiedasanaturalgasreservoir.Onthe basisoftheirphasediagramsandtheprevailingreservoirconditions,natural gasescanbeclassifiedintofourcategories:
Retrogradegas-condensate
Near-criticalgas-condensate
Wetgas
Drygas
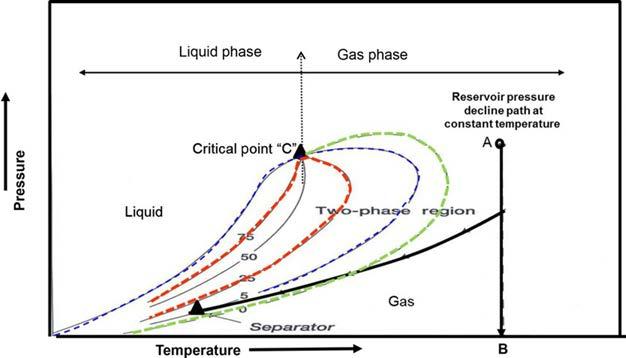
Retrogradegas-condensatereservoir. IfthereservoirtemperatureTlies betweenthecriticaltemperatureTc andcricondenthermTct ofthereservoir fluid,thereservoirisclassifiedasaretrogradegascondensatereservoir.This categoryofgasreservoirisauniquetypeofhydrocarbonaccumulationinthat thespecialthermodynamicbehaviorofthereservoirfluidisthecontrollingfactorinthedevelopmentandthedepletionprocessofthereservoir.Whenthe pressureisdecreasedonthesemixtures,insteadofexpanding(ifagas)orvaporizing(ifaliquid)asmightbeexpected,theyvaporizeinsteadofcondensing.
Considerthattheinitialconditionofaretrogradegasreservoirisrepresented bypoint1onthepressure-temperaturephasediagramof Figure1-11.Because thereservoirpressureisabovetheupperdew-pointpressure,thehydrocarbon systemexistsasasinglephase(i.e.,vaporphase)inthereservoir.Asthereservoirpressuredeclinesisothermallyduringproductionfromtheinitialpressure (point1)totheupperdewpointpressure(point2),theattractionbetweenthe moleculesofthelightandheavycomponentscausesthemtomovefurtherapart
FIGURE1-11 Atypicalphasediagramforaretrogradesystem.
furtherapart.Asthisoccurs,attractionbetweentheheavycomponentmolecules becomesmoreeffective;thus,liquidbeginstocondense.
Thisretrogradecondensationprocesscontinueswithdecreasingpressure untiltheliquiddropoutreachesitsmaximumatpoint3.Furtherreductionin pressurepermitstheheavymoleculestocommencethenormalvaporization process.Thisistheprocesswherebyfewergasmoleculesstriketheliquidsurfaceandcausesmoremoleculestoleavethanentertheliquidphase.Thevaporizationprocesscontinuesuntilthereservoirpressurereachesthelowerdewpointpressure.Thismeansthatalltheliquidthatformedmustvaporizebecause thesystemisessentiallyallvaporsatthelowerdewpoint.
Figure1-12 showsatypicalliquidshrinkagevolumecurveforacondensate system.Thecurveiscommonlycalledthe liquiddropoutcurve. Inmostgascondensatereservoirs,thecondensedliquidvolumeseldomexceedsmorethan 15%–19%oftheporevolume.Thisliquidsaturationisnotlargeenoughto allowanyliquidflow.Itshouldberecognized,however,thataroundthewellborewherethepressuredropishigh,enoughliquiddropoutmightaccumulate togivetwo-phaseflowofgasandretrogradeliquid.
Theassociatedphysicalcharacteristicsofthiscategoryare:
Gas-oilratiosbetween8,000and70,000scf/STB.Generally,thegas-oil ratioforacondensatesystemincreaseswithtimeduetotheliquiddropout andthelossofheavycomponentsintheliquid.
Condensategravityabove50° API
Stock-tankliquidisusuallywater-whiteorslightlycolored.
Thereisafairlysharpdividinglinebetweenoilsandcondensatesfromacompositionalstandpoint.Reservoirfluidsthatcontainheptanesandareheavierin concentrationsofmorethan12.5mol%arealmostalwaysintheliquidphasein thereservoir.Oilshavebeenobservedwithheptanesandheavierconcentrations
Atypicalphasediagramforanear-criticalgascondensatereservoir.
aslowas10%andcondensatesashighas15.5%.Thesecasesarerare,however, andusuallyhaveveryhightankliquidgravities.
Near-criticalgas-condensatereservoir. Ifthereservoirtemperatureis nearthecriticaltemperature,asshownin Figure1-13,thehydrocarbonmixture isclassifiedasanear-criticalgas-condensate.Thevolumetricbehaviorofthis categoryofnaturalgasisdescribedthroughtheisothermalpressuredeclinesas shownbytheverticalline1-3in Figure1-13 andalsobythecorrespondingliquiddropoutcurveof Figure1-14.Becauseallthequalitylinesconvergeatthe criticalpoint,arapidliquidbuildupwillimmediatelyoccurbelowthedewpoint (Figure1-14)asthepressureisreducedtopoint2.
Thisbehaviorcanbejustifiedbythefactthatseveralqualitylinesare crossedveryrapidlybytheisothermalreductioninpressure.Atthepointwhere theliquidceasestobuildupandbeginstoshrinkagain,thereservoirgoesfrom theretrograderegiontoanormalvaporizationregion.
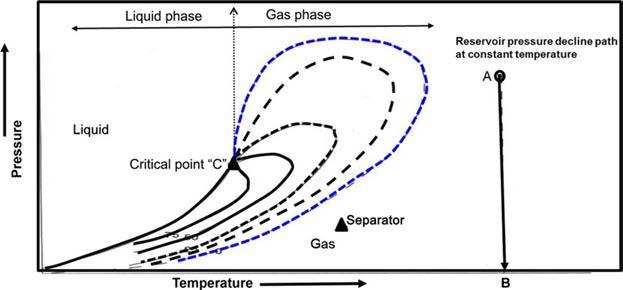
Wet-gasreservoir. Atypicalphasediagramofawetgasisshownin Figure1-15,wherereservoirtemperatureisabovethecricondenthermofthe hydrocarbonmixture.Becausethereservoirtemperatureexceedsthecricondenthermofthehydrocarbonsystem,thereservoirfluidwillalwaysremain inthevaporphaseregionasthereservoirisdepletedisothermally,alongthe verticallineA-B.
Astheproducedgasflowstothesurface,however,thepressureandtemperatureofthegaswilldecline.Ifthegasentersthetwo-phaseregion,aliquid phasewillcondenseoutofthegasandbeproducedfromthesurfaceseparators. Thisiscausedbyasufficientdecreaseinthekineticenergyofheavymolecules
FIGURE1-13
FIGURE1-14 Liquid-shrinkage(dropout)curveforanear-criticalgas-condensatesystem.
FIGURE1-15 Phasediagramforawetgas. (AfterClark,N.J.ElementsofPetroleumReservoirs, SPE, 1969).
withtemperaturedropandtheirsubsequentchangetoliquidthroughtheattractiveforcesbetweenmolecules.
Wet-gasreservoirsarecharacterizedbythefollowingproperties: Gasoilratiosbetween60,000to100,000scf/STB Stock-tankoilgravityabove60° API
Phasediagramforadrygas. (AfterClark,N.J.ElementsofPetroleumReservoirs, SPE,1969).
Liquidiswater-whiteincolor
Separatorconditions,i.e.,separatorpressureandtemperature,liewithinthe two-phaseregion
Dry-gasreservoir. Thehydrocarbonmixtureexistsasagasbothinthereservoirandinthesurfacefacilities.Theonlyliquidassociatedwiththegasfroma dry-gasreservoiriswater.Aphasediagramofadry-gasreservoirisgivenin Figure1-16.Usuallyasystemhavingagas-oilratiogreaterthan100,000 scf/STBisconsideredtobeadrygas.
Kineticenergyofthemixtureissohighandattractionbetweenmoleculesso smallthatnoneofthemcoalescetoaliquidatstock-tankconditionsoftemperatureandpressure.
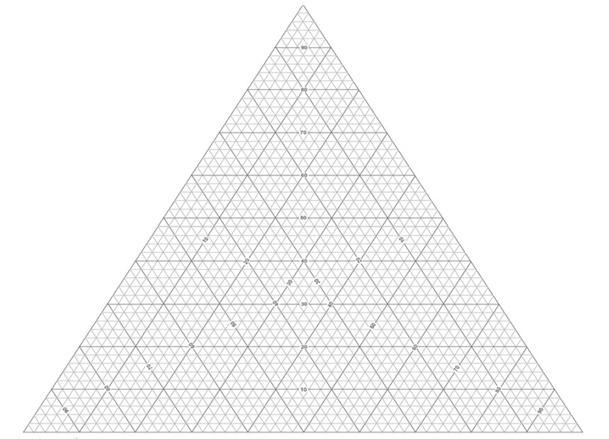
Itshouldbepointedoutthattheclassificationofhydrocarbonfluidsmight bealsocharacterizedbytheinitialcompositionofthesystem. McCain(1994) suggestedthattheheavycomponentsinthehydrocarbonmixtureshavethe strongesteffectonfluidcharacteristics.Theternarydiagram,asshownin Figure1-17,withequilateraltrianglescanbeconvenientlyusedtoroughly definethecompositionalboundariesthatseparatedifferenttypesofhydrocarbonsystems.
Fromtheforegoingdiscussion,itcanbeobservedthathydrocarbonmixtures mayexistineitherthegaseousorliquidstate,dependingonthereservoirand operatingconditionstowhichtheyaresubjected.Thequalitativeconceptspresentedmaybeofaidindevelopingquantitativeanalyses.Empiricalequations ofstatearecommonlyusedasaquantitativetoolindescribingandclassifying thehydrocarbonsystem.Theseequationsofstaterequire:
Detailedcompositionalanalysesofthehydrocarbonsystem Completedescriptionsofthephysicalandcriticalpropertiesofthemixture individualcomponents
FIGURE1-16
A- Dry gas
B- Wet gas
C- Retrograde gas
D- Near critical
E- Volatile oil
F- Ordinary oil
G- Low shrinkage oil
Manycharacteristicpropertiesoftheseindividualcomponents(inotherwords, puresubstances)havebeenmeasuredandcompiledovertheyears.Thesepropertiesprovidevitalinformationforcalculatingthethermodynamicpropertiesof purecomponents,aswellastheirmixtures.Themostimportantofthesepropertiesare:
Criticalpressure,pc
Criticaltemperature,Tc
Criticalvolume,Vc
Criticalcompressibilityfactor,zc
Acentricfactor,T
Molecularweight,M
Table1-2 documentstheabove-listedpropertiesforanumberofhydrocarbon andnonhydrocarboncomponents.
KatzandFiroozabadi(1978) presentedageneralizedsetofphysicalpropertiesforthepetroleumfractionsC6 throughC45.Thetabulatedproperties includetheaverageboilingpoint,specificgravity,andmolecularweight. Theauthors’proposedasetoftabulatedpropertiesthatweregeneratedbyanalyzingthephysicalpropertiesof26condensatesandcrudeoilsystems.These generalizedpropertiesaregivenin Table1-1.
C2-C6+CO2
FIGURE1-17 Compositionsofvariousreservoirfluidtypes.
450.884677.375614.394
Ahmed(1985) correlatedKatz-Firoozabadi-tabulatedphysicalproperties withthenumberofcarbonatomsofthefractionbyusingaregressionmodel. Thegeneralizedequationhasthefollowingform:
Where:
θ ¼ anyphysicalproperty
n ¼ numberofcarbonatoms,i.e.,6.7 ,45
a1 a5 ¼ coefficientsoftheequationandaregivenin Table1-3
UndefinedPetroleumFractions
Nearlyallnaturallyoccurringhydrocarbonsystemscontainaquantityofheavy fractionsthatarenotwelldefinedandarenotmixturesofdiscretelyidentified components.Theseheavyfractionsareoftenlumpedtogetherandidentifiedas theplusfraction,e.g.,C7+ fraction.
Aproperdescriptionofthephysicalpropertiesoftheplusfractionsandother undefinedpetroleumfractionsinhydrocarbonmixturesisessentialinperformingreliablephasebehaviorcalculationsandcompositionalmodelingstudies. Frequently,adistillationanalysisorachromatographicanalysisisavailable forthisundefinedfraction.Otherphysicalproperties,suchasmolecularweight andspecificgravity,mayalsobemeasuredfortheentirefractionorforvarious cutsofit.
Touseanyofthethermodynamicproperty-predictionmodels,e.g.,equation ofstate,topredictthephaseandvolumetricbehaviorofcomplexhydrocarbon mixtures,onemustbeabletoprovidetheacentricfactor,alongwiththecritical temperatureandcriticalpressure,forboththedefinedandundefined(heavy)
fractionsinthemixture.Theproblemofhowtoadequatelycharacterizethese undefinedplusfractionsintermsoftheircriticalpropertiesandacentricfactors hasbeenlongrecognizedinthepetroleumindustry. Whitson(1984) presented anexcellentdocumentationontheinfluenceofvariousheptanes-plus(C7+) characterizationschemesonpredictingthevolumetricbehaviorofhydrocarbon mixturesbyequations-of-state.
RiaziandDaubert(1987) developedasimpletwo-parameterequationfor predictingthephysicalpropertiesofpurecompoundsandundefinedhydrocarbonmixtures.Theproposedgeneralizedempiricalequationisbasedontheuse ofthemolecularweightMandspecificgravity γ oftheundefinedpetroleum fractionasthecorrelatingparameters.Theirmathematicalexpressionhasthe followingform:
where
θ ¼ anyphysicalproperty
a f ¼ constantsforeachpropertyasgivenin Table1-4
γ ¼ specificgravityofthefraction
M ¼ moleclarweight
Tc ¼ cirticaltemperature, °R
Pc ¼ criticalpressure,psia(Tabl1-4)
Tb ¼ boilingpointtemperature, °R
Vc ¼ criticalvolume,ft3/lb
Edmister(1958) proposedacorrelationforestimatingtheacentricfactorTof purefluidsandpetroleumfractions.Theequation,widelyusedinthepetroleum industry,requiresboilingpoint,criticaltemperature,andcriticalpressure.The proposedexpressionisgivenbythefollowingrelationship:
¼ 3logpc =14:70 ðÞ ½ 7Tc =Tb 1 ½ðÞ 1(1-3)
TABLE1-4 CorrelationConstantsforEquation 1-2
where
T ¼ acentricfactor
pc ¼ criticalpressure,psia
Tc ¼ criticaltempterature, °R
Tb ¼ normalboilingpoint, °R
Iftheacentricfactorisavailablefromanothercorrelation,theEdmisterequationcanberearrangedtosolveforanyofthethreeotherproperties(providing theothertwoareknown).
Thecriticalcompressibilityfactor“Zc”isanotherpropertythatisoftenused inthermodynamic-propertypredictionmodels.Itisdefinedasthecomponent compressibilityfactorcalculatedatitscriticalpoint.Thispropertycanbeconvenientlycomputedbytherealgasequation-of-stateatthecriticalpoint,or
where
R ¼ universalgasconstant,10.73psia-ft3/lb-mol. °R
Vc ¼ criticalvbolume,ft3/lb
M ¼ molecularweight
TheaccuracyofEquation 1-4 dependsontheaccuracyofthevaluesofpc,Tc, andVc usedinevaluatingthecriticalcompressibilityfactor. Table1-5 presents asummaryofthecriticalcompressibilityestimationmethods.
Example1-1
Estimatethecriticalpropertiesandtheacentricfactoroftheheptanes-plus fraction,i.e.,C7+,withameasuredmolecularweightof150andspecificgravity of0.78.
TABLE1-5 CriticalCompressibilityEstimationMethods
Solution
Step1. UseEquation 1-2 toestimateTc,pc,Vc,andTb: Tc ¼ 544.2(150).2998 (.78)1.0555 exp[–1.3478 10–4 (150) –0.61641(.78)+0] ¼ 1139.4 °R pc ¼ 4.5203 104 (150)–.8063 (.78)1.6015 exp[–1.8078 10–3 (150) – 0.3084(.78)+0] ¼ 320.3psia Vc ¼ 1.206 10–2 (150).20378 (.78)–1.3036 exp[–2.657 10–3 (150) +0.5287(.78) ¼ 2.6012 10–3 (150)(.78)] ¼ .06035ft3/lb Tb ¼ 6.77857(150).401673 (.78)–1.58262 exp[3.77409 10–3 (150)+ 2.984036(0.78) – 4.25288 10–3 (150)(0.78)] ¼ 825.26 °R
Step2. UseEdmister’sEquation(Equation 1-3)toestimatetheacentricfactor:
PROBLEMS
1. Thefollowingisalistofthecompositionalanalysisofdifferenthydrocarbonsystems.Thecompositionsareexpressedinthetermsofmol%.
ComponentSystem#1System#2System#3System#4
2. Classifythesehydrocarbonsystems.
3. Ifapetroleumfractionhasameasuredmolecularweightof190andaspecificgravityof0.8762,characterizethisfractionbycalculatingtheboiling point,criticaltemperature,criticalpressure,andcriticalvolumeofthefraction.UsetheRiaziandDaubertcorrelation.
4. Calculatetheacentricfactorandcriticalcompressibilityfactorofthecomponentintheaboveproblem.
REFERENCES
Ahmed,T.,1985.CompositionmodelingofTylerandMissionCanyonformationoilswithCO2 and leangases. FinalreportsubmittedtotheMontana’sonaNewTrackforScience(MONTS)program(MontanaNationalScienceFoundationGrantProgram)