SustainableOilandGasDevelopmentSeries RESERVOIR DEVELOPMENT
M.RAFIQULISLAM
GulfProfessionalPublishingisanimprintofElsevier
50HampshireStreet,5thFloor,Cambridge,MA02139,UnitedStates
TheBoulevard,LangfordLane,Kidlington,Oxford,OX51GB,UnitedKingdom
Copyright©2022ElsevierInc.Allrightsreserved.
Nopartofthispublicationmaybereproducedortransmittedinanyformorbyanymeans,electronicor mechanical,includingphotocopying,recording,oranyinformationstorageandretrievalsystem,without permissioninwritingfromthepublisher.Detailsonhowtoseekpermission,furtherinformationaboutthe Publisher’spermissionspoliciesandourarrangementswithorganizationssuchastheCopyrightClearance CenterandtheCopyrightLicensingAgency,canbefoundatourwebsite: www.elsevier.com/permissions. ThisbookandtheindividualcontributionscontainedinitareprotectedundercopyrightbythePublisher(other thanasmaybenotedherein).
Notices
Knowledgeandbestpracticeinthisfieldareconstantlychanging.Asnewresearchandexperiencebroadenour understanding,changesinresearchmethods,professionalpractices,ormedicaltreatmentmaybecome necessary.
Practitionersandresearchersmustalwaysrelyontheirownexperienceandknowledgeinevaluatingandusing anyinformation,methods,compounds,orexperimentsdescribedherein.Inusingsuchinformationormethods theyshouldbemindfuloftheirownsafetyandthesafetyofothers,includingpartiesforwhomtheyhavea professionalresponsibility.
Tothefullestextentofthelaw,neitherthePublishernortheauthors,contributors,oreditors,assumeanyliability foranyinjuryand/ordamagetopersonsorpropertyasamatterofproductsliability,negligenceorotherwise,or fromanyuseoroperationofanymethods,products,instructions,orideascontainedinthematerialherein.
LibraryofCongressCataloging-in-PublicationData
AcatalogrecordforthisbookisavailablefromtheLibraryofCongress
BritishLibraryCataloguing-in-PublicationData
AcataloguerecordforthisbookisavailablefromtheBritishLibrary
ISBN:978-0-12-820053-7
ForinformationonallGulfProfessionalpublications
visitourwebsiteat https://www.elsevier.com/books-and-journals
Publisher: CharlotteCockle
SeniorAcquisitionsEditor: KatieHammon
EditorialProjectManager: LeticiaLima
ProductionProjectManager: ManjuThirumalaivasan
Coverdesigner: ChristianBilbow
TypesetbySTRAIVE,India
Contents
Forewordvii
1.Introduction1
1.1Openingstatement1
1.2Worldenergy2
1.3Roleofoilandgas14
1.4Keyeventsandfutureoutlookofoilandgas27
1.5Sustainabilitystatusofcurrenttechnologies38
1.6Summaryofvariouschapters50
2.Reservoirrockandfluid characterization53
2.1Introduction53
2.2Uniquefeatures61
2.3Sustainabilitycriteria67
2.4Fluidcharacterizationbasedonorigin72
2.5Abiogenicpetroleumorigintheory79
2.6Scientificrankingofpetroleum106
2.7Characterizationofreservoirs117
2.8Reservoirheterogeneity178
3.Complexreservoirs185
3.1Introduction185
3.2Complexreservoirs186
3.3Fracturemechanicsingeologicalscale190
3.4Coreanalysis214
3.5Modelingunstableflow221
3.6Essenceofreservoirsimulation232
3.7Materialbalanceequation233
3.8Representativeelementalvolume,REV236
3.9Thermalstress238
3.10Reservoirgeochemistry251
3.11Fluidandrockproperties264
3.12Avoidingspurioussolutions265
4.Unconventionalreservoirs267
4.1Introduction267
4.2Unconventionaloilandgasproduction271
4.3Currentpotentials275
4.4Sustainabledevelopmentofunconventional reservoirs337
4.5Improvingoilandgasrecoveryfrom unconventionalreservoirs339
4.6Reservegrowthpotential437
4.7Quantitativemeasuresofwellproduction variability461
4.8Coupledfluidflowandgeomechanicalstress model465
4.9Sustainabilitypathways492
4.10Zero-wasteoperations520
4.11Greeningofhydraulicfracturing523
5.Basementreservoirs533
5.1Introduction533
5.2Worldreserve534
5.3Reservoircharacterization548
5.4Organicsourceofhydrocarbon576
5.5Nonconventionalsourcesofpetroleum fluids590
5.6Scientificrankingofpetroleum597
6.Reservespredictionand deliverability609
6.1Introduction609
6.2Conventionalmaterialbalance615
6.3Analyticalsolutions622
6.4Inclusionoffluidmemory637
6.5Anomalousdiffusion:Amemoryapplication649
6.6Resultsanddiscussion662
6.7Thecompositionalsimulatorusingengineering approach673
7.Fieldguidelines737
7.1Introduction738
7.2Scalingguidelines738
7.3Planningwithreservoirsimulators770
7.4Uncertaintyanalysis794
7.5Thepredictionuncertainty800
7.6Recentadvancesinreservoirsimulation800
7.7Real-timemonitoring814
7.8Sustainabilityanalysisofazero-wastedesign817
7.9Globalefficiencycalculations831
8.Conclusions845
8.1Factsandfictions845
8.2Conclusions846
8.3Recommendations848
References851
Index899
1 Introduction
1.1Openingstatement
Theevolutionofhumancivilizationissynonymouswithhowitmeetsitsenergyneeds. Somemayarguethatthehumanracehasbecomeprogressivelymorecivilizedwithtime. Yet,forthefirsttimeinhumanhistory,anenergycrisishasseizedtheentireglobeand theverysustainabilityofthiscivilizationitselfhassuddenlycomeintoquestion.Ifhumanity hasactuallyprogressedasaspecies,itmustexhibit,aspartofitsbasis,someevidencethat overallefficiencyinenergyconsumptionhasimproved.Intermsofenergyconsumption,this wouldmeanthatlessenergyisrequiredpercapitatosustainlifetodaythan,say,50years earlier.However,exactlytheoppositehashappened.Theoilpricehasbeentumbledintonegativeterritory.Fortheoilbusiness,whichisusedtorollercoasterridesinprices,thiswasa newlowandhighlightstheneedforaparadigmshiftinmanagingthisvaluableresource, whichisthedriverofmoderncivilization.Thescenariohasbecomemorecomplexbyinvoking‘climatechangehysteria’,whichisnotbasedonscience(IslamandKhan,2019).Withthe increasingpoliticizationoffossilfuelsandtheensuingglobal‘climateemergency’agenda,the originalthrustofsustainabilityisallbutabandoned,asifpetroleumresourcescannotbedevelopedsustainably.ThisbookonSustainablePetroleumdevelopmentisallaboutintroducingtechnologiesthatwouldmakepetroleumoperationssustainable. IslamandHossain,2020 presentedsuchtechnologiesforsustainabledrilling,whereasthisvolumeisdedicatedto presentingtechnologiesforsustainablereservoirdevelopment.
Atrueparadigmshiftcanbeinvokedbyintroducingzero-wasteengineeringintoallaspectsofpetroleumresourcedevelopment.Thezero-wastemodeassuresthattheproposed recoverymodeissustainableunderallscenariosofoilprices.Inrecentyears,Islamand hisresearchgroup(Islametal.,2010; IslamandKhan,2019)havedemonstratedthatcurrent practicesofoilandgasproductionoperationsarenotsustainable.Theprincipalimpediment tosustainabilityistheintroductionofsyntheticchemicals,whichareintroducedatvarious levelsofoilandgasproduction.Previously,ithasbeendemonstratedthatconventional‘renewable’technologiesarelesssustainablethanconventionaloilrecoveryandprocessing schemes(Islametal.,2018).Inreservoirevaluationandreserveassessment,century-oldtechnologiesareused.Fundamentalmathematicalformulasandscientificdescriptionsofoiland
Practices
Schematicshowingthepositionofcurrenttechnologicalpracticesrelatedtonaturalpractices.
gasreservoirshavenotbeenupdateddespitetheadventofimprovedmathematicaltools,reservoirsandmoreaccuratescientificmodelstodescribefluidflowthroughporousmedia.
Fig.1.1 showsthatcurrenttechnologicalpracticesarefocusedonshortterm,linearized solutionsthatarealsoinherentlyunsustainable.Asaresult,technologicaldisasterprevailed inpracticallyeveryaspectofthepost-renaissanceera.Petroleumpracticesareconsideredto bethedriveroftoday’ssociety.Here,moderndevelopmentisessentiallydependentonartificialproductsandprocesses.Wehavereviewedthepostrenaissancetransition,callingit thehoney-sugar-saccharine-aspartame(HSSA)degradation(KhanandIslam,2016).Inthis allegoricaltransition,honey(witharealsourceandprocess)hasbeensystematicallyreplaced byAspartame,whichhasbothasourceandapathwaythatarehighlyartificial.Thissetsin motionthetechnologydevelopmentmodethatNobelLaureateinChemistry-RobertCurl called“technologicaldisaster.”
Sustainablepetroleumoperationsdevelopmentrequiresasustainablesupplyofcleanand affordableenergyresourcesthatdonotcausenegativeenvironmental,economic,andsocial consequences.Inaddition,itshouldconsideraholisticapproachwherethewholesystemwill beconsideredinsteadofjustonesectoratatime(Islametal.,2010).In2007,ourresearchgroup developedaninnovativecriterionforachievingtruesustainabilityintechnologicaldevelopment(describedin Islam,2020).Newtechnologyshouldhavethepotentialtobeefficient andfunctionalfarintothefutureinordertoensuretruesustainability.Sustainabledevelopmentisseenashavingfourelements:economic,social,environmental,andtechnological.
1.2Worldenergy
Humancivilizationissynonymouswithcarbon-basedfuel.Theuseoffossilfuelsfor energybeganattheonsetoftheIndustrialRevolution.Inthebeginning,coalwasthefuel ofchoice.Shortlybeforetheintroductionofoilandgasasthefossilfuelofconvenience, Non-linearity/ Complexity
Aphenomenal “ Technological disaster” – Robert Curl (Chemistry Nobel Laureate)
FIG.1.1
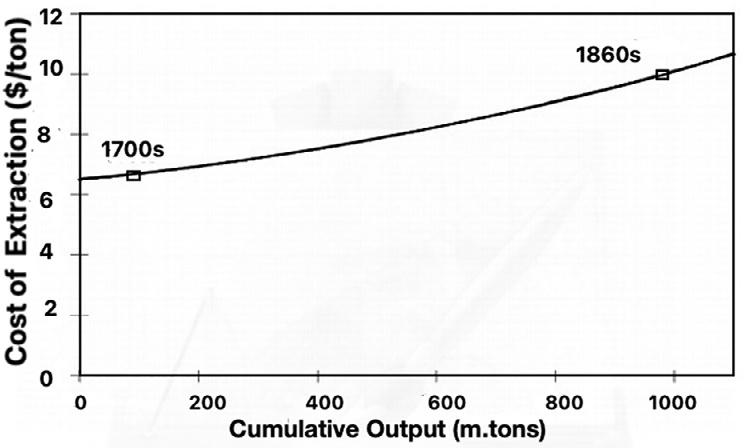
thescarcityofcoalinthecomingdecadeswasdrummedup(Zatzman,2012).Inthis,coal offeredapeculiardistinction.Aspointedoutby ClarkandJacks(2007),despiteenormous increasesinoutput,thecoalindustrywascreditedwithlittleofthenationalproductivityadvanceeitherdirectly,orindirectlythroughlinkagestosteampower,metallurgy,orrailways. The‘cliometric’accountofcoalintheIndustrialRevolutionisrepresentedin
Fig.1.2.Thehorizontalaxisshowscumulativeoutputsincethebeginningofextractioninthenortheastcoal field,andtheverticalaxisshowsthehypotheticalrealcostofextractionperton,whichrises slowlyastotalextractionincreases.However,realextractioncostsareonlymoderatelyhigher atthecumulativeoutputofthe1860sthanatthecumulativeoutputofthe1700s.Inthisportrayal,thesupplyofcoaliselastic.Whendemandincreased,sodidoutput,withlittleincrease inpriceatthepithead.Butthesameexpansionofoutputcouldhaveoccurredearlierorlater haddemandconditionsbeenappropriate.Themovementoutwardintherateofextraction wascausedbythegrowthinthepopulationandincomesandincomes,andbyimprovements intransportandreductionsintaxeswhichreducedthewedgebetweenpitheadpricesand pricestothefinalconsumers.
Althoughthealarmthattheworldwouldrunoutofcoalwassoundedover100yearsago, thishasnotbeenthecase.Itistrueallaroundtheworld,butparticularlymeaningfulinthe USA,whichachievedenergyindependenceonlyinrecentyears.
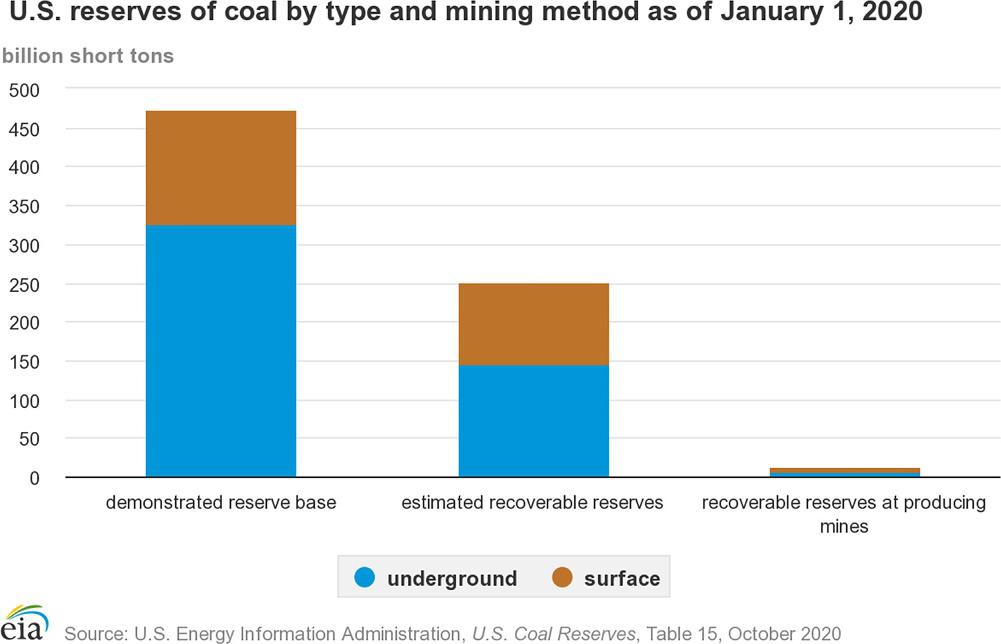
In1975,theU.S.GeologicalSurvey(USGS)publishedthemostcomprehensivenational assessmentofU.S.coalresources,whichindicatedthat,asofJanuary1,1974,coalresources intheUnitedStatestotaled4trillionshorttons.AlthoughtheUSGShasconductedmorerecentregionalassessmentsofU.S.coalresources,anewnational-levelassessmentofU.S.coal resourceshasnotbeenconducted.HisbestestimatesarepublishedbytheU.S.EnergyInformationAdministration(EIA),whichpublishesthreemeasuresofhowmuchcoalisleftinthe UnitedStates.Themeasuresarebasedonvariousdegreesofgeologiccertaintyandonthe economicfeasibilityofminingcoal.
TheEIA’sestimatesoftheamountofcoalreservesasofJanuary1,2020,bytypeofreserve •TheDemonstratedReserveBase(DRB)isthesumofcoalinbothmeasuredandindicated resourcecategoriesofreliability.TheDRBrepresents100%ofthein-placecoalthatcould
FIG.1.2 Thecliometricaccountof thecoalindustryintheIndustrial Revolution. FromClark,G.,Jacks,D., 2007.Coalandtheindustrialrevolution, 1700–1869.Eur.Rev.Econ.Hist.11, 39–72.
beminedcommerciallyatagiventime.TheEIAestimatestheDRBatabout473billion shorttons,ofwhichabout69%isundergroundmineablecoal.
•Estimatedrecoverablereservesincludeonlythecoalthatcanbeminedwithtoday’s miningtechnologyafterconsideringaccessibilityconstraintsandrecoveryfactors.TheEIA estimatesU.S.recoverablecoalreservesatabout252billionshorttons,ofwhichabout58% isundergroundmineablecoal.
•Recoverablereservesatproducingminesaretheamountofrecoverablereservesthatcoal miningcompaniesreporttotheEIAfortheirU.S.coalminesthatproducemorethan25,000 shorttonsofcoalinayear.TheEIAestimatesthesereservesatabout14billionshorttonsof recoverablereserves,ofwhich60%issurfacemineablecoal.
Fig.1.3 showsUScoalreservesin2019.BasedonU.S.coalproductionin2019,ofabout 0.706billionshorttons,therecoverablecoalreserveswouldlastabout357years,andrecoverablereservesatproducingmineswouldlastabout20years.Theactualnumberofyears thatthosereserveswilllastdependsonchangesinproductionandreserveestimates.
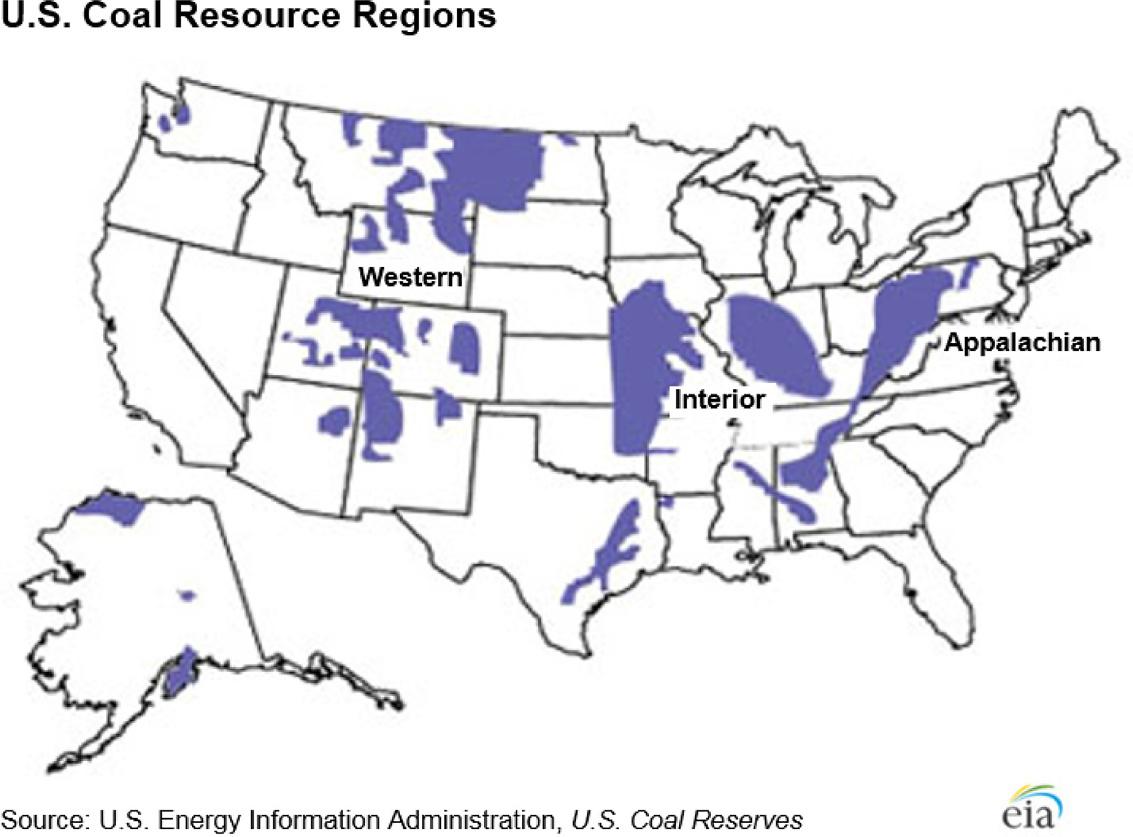
Sixstateshad77%ofthe demonstratedreservebase (DRB)ofcoalasofJanuary1,2020:
•Montana—25%
•Illinois—22%
•Wyoming—12%
•WestVirginia—6%
•Kentucky—6%
•Pennsylvania—5%
FIG.1.3 UScoalreserves. FromEIA,2020.
Twentyfiveotherstateshadtheremaining23%oftheDRB.
Intermsofworldreserves,asofDecember31,2016,EIAestimatesoftotalworldproved recoverablereservesofcoalwereabout1144billionshorttons(orabout1.14trillionshort tons),andfivecountrieshadabout75%oftheworld’sprovedcoalreserves. Thetopfive countriesandtheirshareofworldprovedcoalreservesasof12/31/2016
•UnitedStates—22%
•Russia—15%
•Australia—14%
•China—13%
•India—10%
Table1.1 showsfuelconsumptionintheworldfortheyear2019.ThistrendshowstheimpactoftheTrumperaintheUSA.
Growthinenergymarketsslowedin2019inlinewithweakereconomicgrowthandapartialunwindingofsomeoftheone-offfactorsthatboostedenergydemandin2018.ThisslowdownwasparticularlyevidentintheUS,RussiaandIndia,eachofwhichexhibitedunusually stronggrowthin2018.Chinawastheexception,withitsenergyconsumptionacceleratingin
TABLE1.1 Fuelsharesofprimaryenergyandcontributionstogrowthin2019.
a Renewablepower(excludinghydro)plusbiofuels.
From BP,2020.BPAnnualReport. https://www.bp.com/content/dam/bp/business-sites/en/global/corporate/pdfs/investors/bp-annual-report-andform-20f-2020.pdf
2019.Asaresult,Chinadominatedtheexpansionofglobalenergymarkets—contributingthe largestincrementtodemandforeachindividualsourceofenergyotherthannaturalgas, whereitwasonlynarrowlysurpassedbytheUS.DespitethesupportfromChina,allfuels (otherthannuclear)grewataslowerratethantheir10-yearaverages,withcoalconsumption decliningforthefourthtimein6years.Nevertheless,renewablesstillgrewbyarecordincrementandprovidedthelargestcontribution(41%)togrowthinprimaryenergy,with thelevelofrenewablepowergenerationexceedingnuclearpowerforthefirsttime.Theslowdowninenergydemandgrowth,combinedwithashiftinthefuelmixawayfromcoaland towardnaturalgasandrenewables,ledtoasignificantslowinginthegrowthofcarbonemissions,althoughonlypartiallyunwindingtheunusuallystrongincreaseseenin2018.Energy pricesfellonthewhole,particularlyforcoalandgaswheregrowthinproductionoutpaced consumptionleadingtoabuildupofinventories.Oilpriceswerealittlelower.
Eversincetheoilembargoof1972,theworldhasbeengrippedbythefearofan‘energy crisis’.U.S.PresidentJimmyCarter,in1978,toldtheworldinatelevisedspeechthatthe worldwasinfactrunningoutofoilatarapidpace—apopularPeakOiltheoryofthe time—andthattheUShadtoweanitselfoffofthecommodity.Sincethedayofthatspeech, worldwideoiloutputhasactuallyincreasedbymorethan30%,andknownavailablereserves arehigherthantheywereatthattime.ThishysteriahassurvivedtheeraofReaganomics, PresidentClinton’scoldwardividend,PresidentG.W.Bush’spost-9-11eraof‘fearingeverythingbutpetroleum’andtodayeventhemostardentsupportersofthepetroleumindustry havebeenconvincedthatthereisanenergycrisisloomingandthatitisonlyamatteroftime beforewewillbeforcedtoswitchtono-petroleumenergysources.DuringPresidentObama’s time,therehadbeenamarkedshifttowardso-calledrenewableenergyandthebackground of‘onlyacarbontaxcanfixtheclimatechangedebacle’mantrawasfirmlyestablished.PresidentTrumphasstrivedtoundomuchofthosebiasesawayfrompetroleumresources,but thescientificcommunityremainsunconvinced.Inthischapter,wedeconstructsomeofthe hysteriaandunscientificbiasthathavegrippedthescientificcommunityaswellastheleft leaningsegmentofthegeneralpublic.
Thegeneralpublicisbeingpreparedtofaceanenergycrisisthatisperceivedtobeforthcoming.Sincethedemandforoilisunlikelytodeclineitinevitablymeansthatthepricewill increase,probablyquitedramatically.Thiscrisisattributedtopeakoiltheoryisproposedto beremediedwith(1)austeritymeasuresinordertodecreasedependenceonenergy,possibly decreasingpercapitaenergyconsumption,and(2)alternativestofossilfuels.Noneofthese measuresseemappealingbecauseanyausteritymeasurecaninduceanimbalanceintheeconomicsystemthatisdependentonthespendinghabitsofthepopulationandanyalternative energysourcemayprovetobemoreexpensivethanfossilfuel.Theseconcernscreatepanic, whichisbeneficialtocertainenergyindustries,includingbiofuel,nuclear,wind,andothers. Addtothisproblemistherecenthysteriacreatedbasedonthepremisethatoilconsumption isthereasonbehindglobalwarming.Thisinitselfhascreatedopportunitiesformanysectors engagedincarbonsequestration.
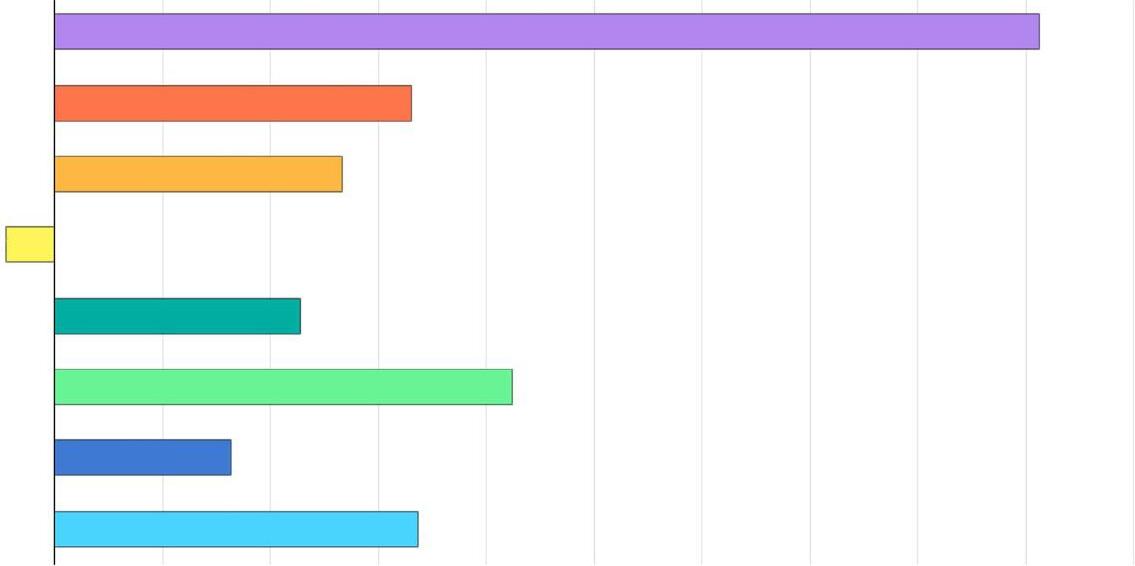
Ingeneral,therehasbeenaperceptionthatsolar,windandotherformsof‘renewable’energyaremoresustainableorlessharmfultotheenvironmentthantheirpetroleumcounterparts.Itisstatedthatrenewableenergyisenergythatiscollectedfromrenewableresources thatarenaturallyreplenishedonahumantimescale,suchassunlight,wind,rain,tides, waves,andgeothermalheat. ChhetriandIslam(2008) havedemonstratedthattheclaimof harmlessnessandabsolutesustainabilityisnotonlyexaggerated,itisnotsupportedbyscience.However,irrespectiveofscientificresearch,thispositiveperceptiontranslatedinto globalpublicsupport.OnesuchsurveywasconductedbyIpsosGlobalin2011thatfound averyfavorableratingfornon-fossilfuelenergysources(Fig.1.4).Perceptiondoeshaveeconomicimplicationsattachedtoit.TheIpsosstudyfound75%agreedwiththeslogan “scientificresearchmakesadirectcontributiontoeconomicgrowthintheUK”.However, intheworkshops,althoughparticipantsagreedwiththis,theydidnotalwaysunderstand themechanismsthroughwhichscienceaffectseconomicgrowth.Thereisstrongsupport forthepublicfundingofscientificresearch,withthree-quarters(76%)agreeingthat“even ifitbringsnoimmediatebenefits,researchwhichadvancesknowledgeshouldbefunded bytheGovernment.”Veryfew(15%)thinkthat“Governmentfundingforscienceshould becutbecausethemoneycanbebetterspentelsewhere”.Thisisinspiteofpublicsupport forcuttingGovernmentspendingoverall.ItisnotanydifferentintheUSA,whereperception

FIG.1.4 Publicperceptiontowardenergysources(Ipsos,2011).
translatesdirectlyintopressureonthelegislativebody,resultinginimprovedsubsidiesfor certainactivities.
TheEnergyOutlookconsidersarangeofalternativescenariostoexploredifferentaspects oftheenergytransition(Fig.1.4).Thescenarioshavesomecommonfeatures,suchasasignificantincreaseinenergydemandandashifttowardalowercarbonfuelmix,butdifferin termsofparticularpolicyortechnologyassumptions.InFig.4.2,theEvolvingTransition(ET) scenarioisadirectfunctionofpublicperceptionthatdictatesgovernmentpolicies,technologyandsocialpreferences.Somescenariosfocusonparticularpoliciesthataffectspecific fuelsortechnologies,e.g.,abanonsalesofinternalcombustionengine(ICE)cars,agreater policypushtowardrenewableenergy,orweakerpolicysupportforaswitchfromcoaltogas considered,e.g.,fasterandevenfastertransitions(Fig.1.5).
Inthemeantime,itispredictedthattheso-calleddecarbonizationschemeisinfullswing infavorofenergysourcesotherthanfossilfuels.a Theaimistoreducegreenhousegas(GHG) emissionsdramatically,ignoringthefactthatnon-petroleumenergysourcesarenolesstoxic thanpetroleumemissions(IslamandKhan,2019). BP(2018) predictsthatelectricvehicleswill playamajorroleinloweringemissionsfromtransportandboastsaboutprovidinganetwork of6500chargingpointsacrosstheUK,andplanstorolloutultra-fastchargingonourforecourtnetwork.Theassumptioninalltheseisthatsomehowelectriccarsareenvironmentally friendly.Thisiscontrarytothescientificanalysisconductedoveradecadeagoby Chhetriand Islam(2008),whoshowedthatelectricvehiclesarefarmoretoxictotheenvironmentandfar lessefficientthanregularvehicles,runoninternalcombustionengines.BPfurtherpredicts thatby2040,halfofEurope’scarsandonethirdoftheworld’svehicleswillavoidhaving
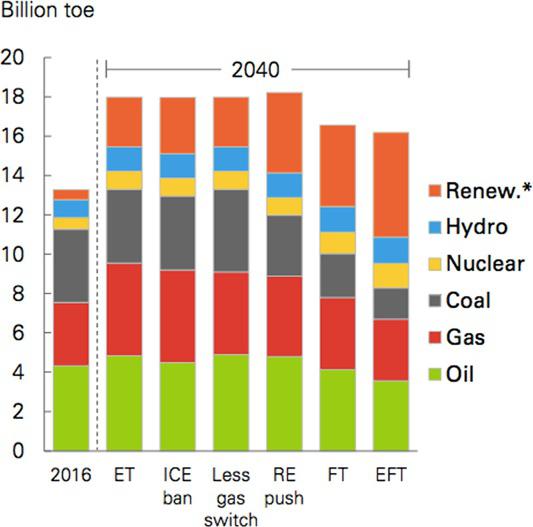
FIG.1.5 Energyoutlookfor2040ascomparedto2016undervariousscenarios(*Renewablesincludewind,solar, geothermal,biomass,andbiofuels,fromBPReport,2018).
a Evenelectriccarsareconsideredtobeaproductofdecarbonizationirrespectiveofthesourceofelectricalenergy.
internalcombustionengines(ICE).Thisprocessof‘decarbonization’isfurtheracceleratedby introducingelectrificationusing‘renewables’,hydrogen,e-fuelb andevennuclearenergy. Clearly,theworldstageisreadytoacceptevennuclearinfavorof‘decarbonization’.For instance, Kannetal.(2019) indicatedthenuclearoptionasthenumberoneprioritytocut downonGHGemissions.
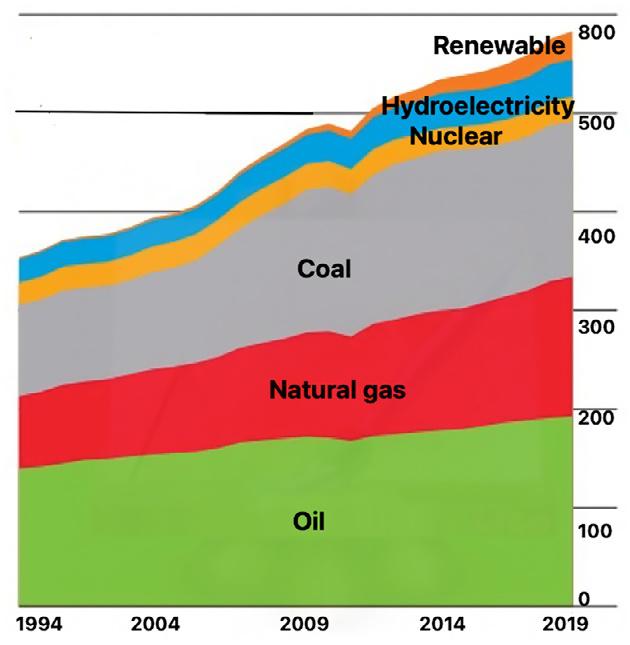
Fig.1.6 showsthegrowthofvariousenergysources.Onlyrenewableenergymadegains. MeanwhileCO2 emissionsdeclined.Itistemptingtoconcludethatthedeclineisdueto reductioninfossilfuelconsumption.Thisisnotscientificaseachrenewabletechnologyends upcausinggreaterCO2 emissionswhentheentirelifecycleisconsidered.
In2020,theCovid-19pandemicplayedasignificantroleinshapingtheglobalenergyoutlook.Becauseofsomedegreeoflockdownineverycountry,theCovid-19pandemichas causedmoredisruptiontotheenergysectorthananyothereventinrecenthistory.The 2020IEAWorldEnergyOutlook(WEO)report(IEA,2020a,b,c)examinedindetailtheeffects ofthepandemic,andinparticularhowitaffectstheprospectsforrapidcleanenergytransitions.Asshownin Fig.1.7,theIEAassessmentisthatglobalenergydemandissettodropby 5%in2020,energy-relatedCO2 emissionsby7%,andenergyinvestmentby18%.Theimpacts varybyfuel.Theestimatedfallsof8%inoildemandand7%incoalusestandinsharpcontrasttoaslightriseinthecontributionofrenewables.Thereductioninnaturalgasdemandis around3%,whileglobalelectricitydemandlookssettobedownbyarelativelymodest2%for theyear.TheglobalCOVID-19lockdownscausedfossilcarbondioxideemissionstodecline byanestimated2.4billiontonnesin2020-arecorddropaccordingtoresearchersatFuture Earth’sGlobalCarbonProject(EurekAlert,2020).Thefallisconsiderablylargerthanprevious significantdecreases-0.5(in1981and2009),0.7(1992),and0.9(1945)billiontonnesofCO2 (GtCO2).Itmeansthatin2020fossilCO2 emissionsarepredictedtobeapproximately 34GtCO2,7%lowerthanin2019.Ironically,thereleaseof2020sGlobalCarbonBudgetcame justaheadofthefifthanniversaryoftheadoptionoftheUNParisClimateAgreement,which aimstoreducetheemissionofgreenhousegasestolimitglobalwarming.Cutsofaround1to 2GtCO2 areneededeachyearonaveragebetween2020and2030tolimitclimatechangein linewithitsgoals.However,theTrumpadministrationwasnotonboardwiththeagreement andrelaxedmanyofthegreenhousegasemissionregulationswhileachievingverydesirable results.
Notsurprisingly,emissionsfromtransportaccountforthelargestshareoftheglobaldecrease.Thosefromsurfacetransport,suchascarjourneys,fellbyapproximatelyhalfatthe peakoftheCOVID-19lockdowns.ByDecember2020,emissionsfromroadtransportandaviationwerestillbelowtheir2019levels,byapproximately10%and40%,respectively,dueto continuingrestrictions.TotalCO2 emissionsfromhumanactivities—fromfossilCO2 and land-usechange—aresettobearound39GtCO2 in2020.
TheemissionsdecreaseisnotablymorepronouncedintheUS( 12%)andEU27countries ( 11%),whereCOVID-19restrictionsacceleratedpreviousreductionsinemissionsfromcoal use.ItappearsleastpronouncedinChina( 1.7%),wheretheeffectofCOVID-19restrictions onemissionsoccurredontopofrisingemissions.Inaddition,restrictionsinChinaoccurred earlyintheyearandweremorelimitedintheirduration,givingtheeconomymoretimeto
b E-fuelinvolvessyntheticfuel,madeoutofnon-petroleumcarbonandisbrandedas‘carbon-free’(Palmer,2015).
Energygrowthofvariousenergysources.
FIG.1.6
FIG.1.7 Globalenergyconsumption(BP,2020),y-axisisenergyinexajoules(EJ)(1.1exajoule ¼ 1018 joules).
recover.IntheUK,whichfirstintroducedlockdownmeasuresinMarch,emissionsare projectedtodecreasebyabout13%.ThelargedecreaseinUKemissionsisduetotheextensive lockdownrestrictionsandthesecondwaveofthepandemic.InIndia,wherefossilCO2 emissionsareprojectedtodecreasebyabout9%,emissionswerealreadylowerthannormal inlate2019becauseofeconomicturmoilandstronghydropowergeneration,andthe COVID-19effectispotentiallysuperimposedonthischangingtrend.
Despiteloweremissionsin2020,thelevelofCO2 intheatmospherecontinuestogrow-by about2.5ppm(ppm)in2020-andisprojectedtoreach412ppmaverageovertheyear,48% abovepre-industriallevels.Preliminaryestimatesbasedonfireemissionsindeforestation areasindicatethatemissionsfromdeforestationandotherland-usechangesfor2020aresimilartothepreviousdecade,ataround6GtCO2.Approximately16GtCO2 wasreleased,primarilyfromdeforestation,whiletheuptakeofCO2 fromregrowthonmanagedland,mainly afteragriculturalabandonment,wasjustunder11GtCO2. IslamandKhan(2019) explained howclimatechangeactivistshavewronglytargetedfossilfuelsastheprimarycauseofglobal warming.Theyidentifiedrefiningactivities,chemicalfertilizers,andothermodernpractices astheprimaryoffendersofenvironmentalintegrity.Notethatso-calledrenewableenergy operationsdonotalleviatetheproblemoftheoverallCO2 budget.
Deforestationfireswerelowerin2020comparedto2019levels,whichsawthehighestrates ofdeforestationintheAmazonsince2008.In2019deforestationanddegradationfireswere about30%abovethepreviousdecade,whileothertropicalemissions,mainlyfromIndonesia, weretwiceaslargeasthepreviousdecadebecauseofunusuallydryconditionsthat promotedpeatburninganddeforestation.Theseactivitiesarenotconventionallyincluded inglobalwarminganalysis.
Intheinteractivechart,weseeglobalfossilfuelconsumptionbrokendownbycoal,oil,and gassince1800.Earlierdata,pre-1965,issourcedfromVaclavSmil’sworkonenergytransitions;thishasbeencombinedwithdatapublishedinBP’sStatisticalReviewofWorldEnergy from1965onwards.c
Fig.1.7 showsriseinprimaryenergyconsumptionroseby1.3%in2019.Thisisdownfrom lessthanhalfitsratein2018(2.8%).Growthwasdrivenbyrenewables(3.2EJ)andnaturalgas (2.8EJ),whichtogethercontributedtothree-quartersoftheincrease.Allfuelsgrewataslower ratethantheir10-yearaverages,apartfromnuclear,withcoalconsumptionfallingforthe fourthtimein6years( 0.9EJ).Thepaceofnuclearenergyiscurious.Nuclearenergy nowprovidesabout10%oftheworld’selectricityfromabout440powerreactors.Itistouted tobetheworld’ssecond-largestsourceoflow-carbonpower(29%ofthetotalin2019).Nuclearpowerplantsareoperationalin31countriesworldwide.Infact,throughregionaltransmissiongrids,manymorecountriesdependinpartonnuclear-generatedpower;Italyand Denmark,forexample,getalmost10%oftheirelectricityfromimportednuclearpower. Thelatestsustainabilitycriterionthatvilifiesfossilfuelenergyascarbon-intensivehasled thewaytonuclearenergy.
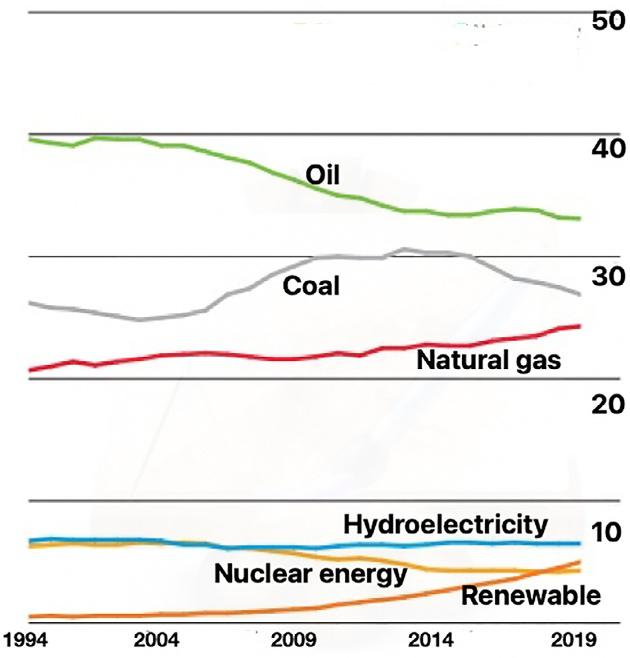
Fig.1.8 showsvariousfractionsofdifferentenergysources.Oilcontinuestoholdthelargestshareoftheenergymix(33.1%).Coalisthesecond-largestfuelbutlostsharein2019to accountfor27.0%,itslowestlevelsince2003.Theshareofbothnaturalgasandrenewables rosetorecordhighsof24.2%and5.0%respectively.Renewableshavenowovertakennuclear
FIG.1.8 Variousfractionsofdifferentenergysourcesonglobalconsumption.
c See https://ourworldindata.org/fossil-fuels#note-1
whichmakesuponly4.3%oftheenergymix.Theshareofhydroelectricityhasbeenstableat around6%forseveralyears.
Table1.2 showssharesofvariousenergysources.Primaryenergyconsumptionroseby 1.3%in2019,belowits10-yearaveragerateof1.6%peryear,andmuchweakerthanthe 2.8%growthseenin2018.Byregion,consumptionfellinNorthAmerica,Europe,andCIS andgrowthwasbelowaverageinSouth&CentralAmerica.DemandgrowthinAfrica, MiddleEast,andAsiawasroughlyinlinewithhistoricalaverages.Chinawasbyfarthe biggestindividualdriverofprimaryenergygrowth,accountingformorethanthree-quarters ofnetglobalgrowth.IndiaandIndonesiawerethenextlargestcontributors,whiletheUSand Germanypostedthelargestdeclinesinenergyterms.Thereisashiftintermsofenergy consumptionhabitsandlifestylesbetweeneasternandwesterncountries.
Lookingatenergybyfuel,2019growthwasdrivenbyrenewables,followedbynaturalgas, whichtogethercontributedoverthree-quartersofthenetincrease.Theshareofbothrenewablesandnaturalgasinprimaryenergyincreasedtorecordhighs.Meanwhile,coalconsumptiondeclined,withitsshareoftheenergymixfallingtoitslowestlevelsince2003.
BP(2020) summarizedcoalandotherenergyconsumptionasbelow: Coal
•Coalconsumptiondeclinedby0.6%anditsshareofprimaryenergyfelltoitslowestlevel in16years(27%).
•Increasesincoalconsumptionweredrivenbytheemergingeconomies,particularlyChina (1.8EJ)andIndonesia(0.6EJ).However,thiswasoutweighedbyasharpfallinOECD demandwhichfelltoitslowestlevelinourdataseries(whichstartedin1965).
•Globalcoalproductionroseby1.5%,withChinaandIndonesiaprovidingtheonly significantincreases(3.2EJand1.3EJrespectively).ThelargestdeclinescamefromtheUS ( 1.1EJ)andGermany( 0.3EJ).
Renewables,hydroandnuclearenergy
•Renewableenergy(includingbiofuels)postedarecordincreaseinconsumptioninenergy terms(3.2EJ).Thiswasalsothelargestincrementforanysourceofenergyin2019.
TABLE1.2 Fuelsharesofprimaryenergyandcontributionstogrowthin2019(BP,2020).
a Renewablepower(excludinghydro)plusbiofuels.
•Windprovidedthelargestcontributiontorenewablegrowth(1.4EJ)followedcloselyby solar(1.2EJ).
•Bycountry,Chinawasthelargestcontributortorenewablegrowth(0.8EJ),followedbythe US(0.3EJ)andJapan(0.2EJ).
•Hydroelectricconsumptionrosebyabelow-average0.8%,withgrowthledbyChina(0.6 EJ),Turkey(0.3EJ),andIndia(0.2EJ).
•Nuclearconsumptionroseby3.2%(0.8EJ),itsfastestgrowthsince2004.China(0.5EJ)and Japan(0.1EJ)providedthelargestincrements.
1.3Roleofoilandgas
Fossilfuelconsumptionhasincreasedsignificantlyoverthepasthalf-century,around eight-foldsince1950,androughlydoublingsince1980.However,thetypesoffuelwerely onhavealsoshifted,fromsolelycoaltowardacombinationwithoil,andthengas.Today, coalconsumptionisfallinginmanypartsoftheworld.Meanwhile,oilandgasarestillgrowingquickly. BP(2020) givesthefollowingupdatefortheyear2019.
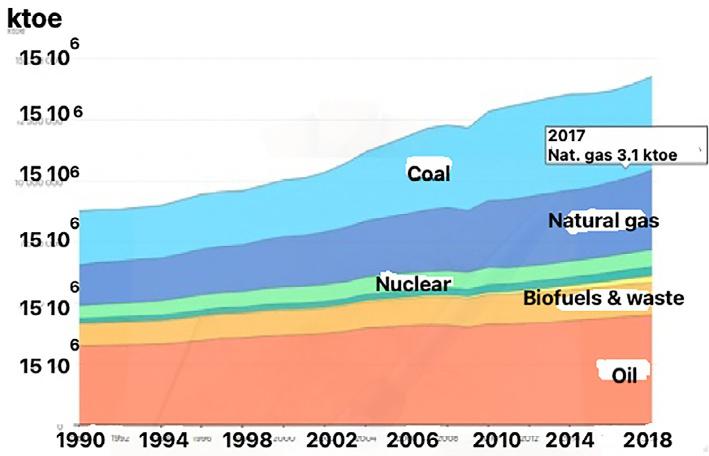
Fig.1.9 showstheworldenergybalancesofthelastthreedecadesasreportedbythe IEA (2020a,b,c).TheIEA’sWorldEnergyBalancespresentcomprehensiveenergybalancesforall theworld’slargestenergy-producingandconsumingcountries.Itcontainsdetaileddataon thesupplyandconsumptionofenergyfor150countriesandregions,includingallOECD countries,over100otherkeycountries,aswellasworldtotals.
Energydataisgenerallycollectedindependentlyacrossdifferentcommodities.Energystatisticsarethesimplestformattopresentallthedatatogether,assemblingtheindividualbalancesofallproducts,eachexpressedinitsownphysicalunit(e.g.,TJfornaturalgas,ktfor coal,etc).Thesearecalledcommoditybalances.However,energyproductscanbeconverted intooneanotherthroughanumberoftransformationprocesses.Therefore,itisveryusefulto alsodevelopacomprehensivenationalenergybalance,tounderstandhowproductsare
FIG.1.9 Thehistoricalworldenergybalances. FromIEA,2020, https://www.iea.org/reports/oil-2020.
transformedintooneanother,andtohighlightthevariousrelationshipsbetweenthem.By presentingallthedatainacommonenergyunit,theenergybalanceallowsuserstosee thetotalamountofenergyusedandtherelativecontributionofeachdifferentsource,for thewholeeconomyandforeachindividualconsumptionsector;tocomputethedifferentfuel transformationefficiencies;todevelopvariousaggregatedindicatorsandtoestimateCO2 emissionsfromfuelcombustion.Theenergybalanceisanaturalstartingpointtostudy theevolutionofthedomesticenergymarket,forecastenergydemand,monitorimpactsof energypolicies,andassesspotentialareasforaction.
Theenergybalancetakestheformofamatrix,wherecolumnspresentallthedifferentenergysources(products)categoriesandrowsrepresentallthedifferent“flows,”groupedin threemainblocks:energysupply,transformation/energyuse,andfinalconsumption (Table1.3).Todevelopanenergybalancefromthesetofcommoditybalances,thetwomain stepsare:
(i) allthedataareconvertedtoacommonenergyunit–alsoallowingtocomputea“total” product;and
(ii) somere-formattingisperformedtoavoiddoublecountingwhensummingallproducts together.
TABLE1.3 Someusefuldefinitions,relatedtoenergysustainability.
Flow ShortnameDefinition
Transformation processes
Mainactivityproducer electricityplants
TOTTRANFTransformationprocessescomprisetheconversionofprimaryformsof energytosecondaryandfurthertransformation(e.g.,cokingcoalto coke,crudeoiltooilproducts,andfueloiltoelectricity).Inputsto transformationprocessesareshownasnegativenumbersandoutput fromtheprocessisshownasapositivenumber.Transformationlosses willappearinthe“total”columnasnegativenumbers
MAINELECReferstoplantsthataredesignedtoproduceelectricityonly.Ifoneor moreunitsoftheplantisaCHPunit(andtheinputsandoutputscannot bedistinguishedonaunitbasis)thenthewholeplantisdesignatedasa CHPplant.Mainactivityproducersgenerateelectricityforsaletothird parties,astheirprimaryactivity.Theymaybeprivatelyorpublicly owned.Notethatthesaleneednottakeplacethroughthepublicgrid
Autoproducerelectricity plants
Mainactivityproducer plants
AUTOELECReferstoplantsthataredesignedtoproduceelectricityonly.Ifoneor moreunitsoftheplantisaCHPunit(andtheinputsandoutputscannot bedistinguishedonaunitbasis)thenthewholeplantisdesignatedasa CHPplant.Autoproducerundertakingsgenerateelectricitywhollyor partlyfortheirownuseasanactivitythatsupportstheirprimary activity.Theymaybeprivatelyorpubliclyowned
MAINCHPReferstoplantsthataredesignedtoproducebothheatandelectricity (sometimesreferredtoasco-generationpowerstations).Ifpossible,fuel inputsandelectricity/heatoutputsareonaunitbasisratherthanona plantbasis.However,ifdataarenotavailableonaunitbasis,the conventionfordefiningaCHPplantnotedaboveshouldbeadopted. Mainactivityproducersgenerateelectricityand/orheatforsaletothird parties,astheirprimaryactivity.Theymaybeprivatelyorpublicly owned.Notethatthesaleneednottakeplacethroughthepublicgrid
Flow
AutoproducerCHP plants
Mainactivityproducer heatplants
ShortnameDefinition
AUTOCHPReferstoplantsthataredesignedtoproducebothheatandelectricity (sometimesreferredtoasco-generationpowerstations).Ifpossible,fuel inputsandelectricity/heatoutputsareonaunitbasisratherthanona plantbasis.However,ifdataarenotavailableonaunitbasis,the conventionfordefiningaCHPplantnotedaboveshouldbeadopted. NotethatforautoproducerCHPplants,allfuelinputstoelectricity productionaretakenintoaccount,whileonlythepartoffuelinputsto heatsoldisshown.Fuelinputsfortheproductionofheatconsumed withintheautoproducer’sestablishmentarenotincludedherebutare includedwithfiguresforthefinalconsumptionoffuelsinthe appropriateconsumingsector.Autoproducerundertakingsgenerate electricityand/orheat,whollyorpartlyfortheirownuseasanactivity thatsupportstheirprimaryactivity.Theymaybeprivatelyorpublicly owned
MAINHEATReferstoplants(includingheatpumpsandelectricboilers)designedto produceheatonlyandwhosellheattoathirdparty(e.g.,residential, commercialorindustrialconsumers)undertheprovisionsofacontract. Mainactivityproducersgenerateheatforsaletothirdparties,astheir primaryactivity.Theymaybeprivatelyorpubliclyowned.Notethat thesaleneednottakeplacethroughthepublicgrid
Autoproducerheat plants
Heatpumps
Electricboilers
Chemicalheatfor electricityproduction
Gasworks
AUTOHEATReferstoplants(includingheatpumpsandelectricboilers)designedto produceheatonlyandwhosellheattoathirdparty(e.g.,residential, commercialorindustrialconsumers)undertheprovisionsofacontract. Autoproducerundertakingsgenerateheat,whollyorpartlyfortheir ownuseasanactivitythatsupportstheirprimaryactivity.Theymaybe privatelyorpubliclyowned
THEATIncludesheatproducedbyheatpumpsintransformation.Heatpumps thatareoperatedwithintheresidentialsectorwheretheheatisnotsold arenotconsideredatransformationprocessandarenotincludedhere— theelectricityconsumptionwouldappearasresidentialuse
TBOILERIncludeselectricboilersusedtoproduceheat
TELEIncludesheatfromchemicalprocessesthatisusedtogenerateelectricity
TGASWKSIncludestheproductionofrecoveredgases(e.g.,blastfurnacegasand oxygensteelfurnacegas).Theproductionofpig-ironfromironorein blastfurnacesusesfuelsforsupportingtheblastfurnacechargeand providingheatandcarbonforthereductionoftheironore.Accounting forthecalorificcontentofthefuelsenteringtheprocessisacomplex matterastransformation(intoblastfurnacegas)andconsumption(heat ofcombustion)occursimultaneously.Somecarbonisalsoretainedin thepig-iron;almostallofthisreappearslaterintheoxygensteelfurnace gas(orconvertergas)whenthepig-ironisconvertedtosteel.Inthe 1992/1993annualquestionnaires,membercountrieswereaskedforthe firsttimetoreportintransformationprocessesthequantitiesofallfuels (e.g.,pulverizedcoalinjection[PCI]coal,cokeovencoke,naturalgas, andoil)enteringblastfurnacesandthequantityofblastfurnacegasand
TABLE1.3 Someusefuldefinitions,relatedtoenergysustainability—Cont’d
Flow ShortnameDefinition
oxygensteelfurnacegasproduced.TheIEASecretariatthenneededto splittheseinputsintothetransformationandconsumption components.Thetransformationcomponentisshownintherowblast furnacesinthecolumnappropriateforthefuel,andtheconsumption componentisshownintherowironandsteel,inthecolumn appropriateforthefuel.TheIEASecretariatdecidedtoassumea transformationefficiencysuchthatthecarboninputintotheblast furnacesshouldequalthecarbonoutput.Thisisroughlyequivalentto assuminganenergytransformationefficiencyof40%
Gasworks TGASWKSIncludesthemanufactureoftowngas.Note:inthesummarybalances thisitemalsoincludesothergasesblendedwithnaturalgas (TBLENDGAS)
Oilrefineries TREFINERCoverstheusetransformationofhydrocarbonsforthemanufactureof finishedoilproducts
PetrochemicalplantsTPETCHEMCoversbackflowsreturnedfromthepetrochemicalindustry.Notethat backflowsfromoilproductsthatareusedfornon-energypurposes(i.e., whitespiritandlubricants)arenotincludedherebutinnonenergyuse
CoalliquefactionplantsTCOALLIQIncludescoal,oil,andtarsandsusedtoproducesyntheticoil
Gas-to-liquids(GTL) plants
TGTLIncludesnaturalgasusedasfeedstockfortheconversiontoliquids,e.g., thequantitiesoffuelenteringthemethanolproductionprocessfor transformationintomethanol
Blastfurnaces EBLASTFURRepresentstheenergywhichisusedinblastfurnaces NuclearindustryENUCRepresentstheenergyusedinthenuclearindustry
Theworldiswitnessingseveralglobalenvironmentalchallenges.Asenergyproduction andusearemajorcausesofenvironmentalproblems,properchoiceofenergytechnology canhaveasignificantimpactonreversingtheseglobalproblems,suchasglobalwarming andclimatechange.Withtheincessantcampaign againstfossilfuel,thustargetingcarbon asthe‘enemy’,everyenergysourceotherthanfossilfuelhasbeentoutedassustainable.For instance,‘sustainablepetroleumtechnology’isvastlyconsideredtobeanoxymoronwhile others,includingnuclearenergyisconsideredtobeoneofthemostefficientandcleanest energytechnologies.Particularly,nuclearenergywasprojectedasoneofthecheapest energysourcesandareliablealternativetofossilfuel.ThiswasalsopromotedasaneffectivesolutiontoreduceCO 2 ,aprecursortoglobalwarming.However,nuclearenergyhas severalenvironmental,social,andeconomicissuesthathavenotyetbeenaddressedand remainthemostcontroversialenergysourcetodate(ChhetriandIslam,2008).Currentscientificanalysesportraynuclearenergyasoneofthemostefficienttechnologies.However, thesescientificanalysesonlyconsider‘locale fficiency’asthemeasureofthetrueefficiency ofasystem.If‘globalefficiency’,whichinclud eslong-termenvironmentalsustainability,is considered,theefficiencypicturebecomesgloomyfornuclearenergy.Thisaspectwillbe