Pressure estimation of wave-in-deck loading using velocity fields obtained by particle image velocimetry
Tien Trung Duong a , Kwang Hyo Jung a, * , Gang Nam Lee a , Hyung Joon Kim a , Sung Boo Park a , Seongyun Shin a , Jaeyong Lee b , Sung Bu Suh b
a Department of Naval Architecture and Ocean Engineering, Pusan National University, 2 Busandaehak-ro, Busan, 46241, Republic of Korea
b Department of Naval Architecture and Ocean Engineering, Dong-Eui University, 176 Eomgwang-ro, Busan, 47340, Republic of Korea
ARTICLE INFO
Keywords:
Wave-in-deck load
Pressure distribution
Focused waves
PIV-based pressure estimation
Euler equation
1. Introduction
ABSTRACT


This study presents the application of a particle image velocimetry based pressure estimation method to reconstruct pressure distributions along a deck due to wave-in-deck loading. A series of experiments on wave-indeck loading caused by focused waves were conducted in a two-dimensional wave tank to measure vertical force, pressure distributions and the PIV velocity fields under the deck. Fluid pressure fields were reconstructed by spatial integration of pressure gradients computed from Euler equation. The estimated pressures from PIV velocity data were compared and validated with the measured pressures by five pressure sensors under the deck. In the material acceleration calculation based on the Eulerian and pseudo-Lagrangian approaches, a proper time interval could be chosen to reduce errors in the pressure estimation results. The Eulerian approach provided less errors for pressure time series estimation, but the pseudo-Lagrangian approach showed a better agreement at maximum pressure. The estimated pressure fields and pressure distributions under the deck were studied to understand the mechanism of loading phenomena. Finally, the effect of the vortex beneath the leading edge during the water exit phase was discussed in relation to force and pressure measurements.
Decks of offshore structures are designed to withstand environmental loads induced by waves during their lifetime. However, offshore structures could be damaged or even destroyed by wave-in-deck (WID) loading under extreme ocean conditions such as hurricanes, when the wave crest exceeds the deck height (Energo Engineering, 2010). Additionally, foundation subsidence or reservoir compaction also reduces deck clearance (Broughton and Horn, 1987), which may increase the probability of WID occurrence.
Numerous studies have been conducted over the years to investigate the nature of WID loading through experimental or numerical investigations. Pioneering studies on the prediction of WID loads were conducted by Kaplan (1992) and Isaacson and Bhat (1996) Murray et al. (1997) measured wave forces acting on a jacket structure model with a horizontal deck in regular and irregular waves. They discovered no significant difference between peak forces caused by regular and focused waves with the same zero-crossing period and crest height. Baarholm and Faltinsen (2004) used two-dimensional (2D) potential flow to
* Corresponding author.
E-mail address: kjung@pusan.ac.kr (K.H. Jung). Contents lists
https://doi.org/10.1016/j.oceaneng.2022.111581
predict the time series of global wave force underneath a horizontal deck, whereas an empirical correlation based on dimensional analysis was developed by Cuomo et al. (2007) to estimate the peak values of these forces. Baarholm (2009) compared vertical WID forces measured in 2D and three-dimensional (3D) model tests to reveal the effect of 3D flow on loading characteristics. The results showed that 3D flow reduced the magnitude of the upward force by 15%–30%. Schellin et al. (2011) performed computational fluid dynamics (CFD) simulations of WID loading caused by freak waves on a three-leg jack-up platform. The numerical results showed that impact loads caused by freak waves exceeded those caused by Stokes waves. Scharnke et al. (2014) conducted a series of experiments on a fixed jacket platform in regular and irregular wave conditions to measure WID loads and compared the experimental results with a simplified prediction model proposed by API (API, 2014). The simplified loading model was found to underestimate horizontal forces in both regular and irregular wave conditions. Abdussamie et al. (2017) measured global forces and local pressure of extreme long-crested irregular waves on a 3D fixed box-shaped deck model. They concluded that the magnitude of the impact pressure varied
Received 27 January 2022; Received in revised form 27 April 2022; Accepted 16 May 2022
0029-8018/©2022ElsevierLtd.Allrightsreserved.
significantly among repeated runs of identical wave conditions, and waves induced larger pressures on the front half of the bottom plate than the rear section. Qin et al. (2017) used a fully coupled fluid-structure interaction method to numerically study the hydroelastic effect on WID loading. The results showed that the hydroelastic effect caused oscillations in the force time series and a larger peak force value. Duong et al. (2019) measured the vertical force and local pressures on a fixed horizontal plate subjected to regular waves, and the velocity maps under the deck were also obtained using particle image velocimetry (PIV) technique to study the effect of the deck on flow kinematics. A linear relationship was revealed between the vertical force and the square of the maximum vertical velocity estimated from the linear wave theory.
Sun et al. (2019) numerically studied the suction effect of WID loading during the water exit phase using the smoothed particle hydrodynamics (SPH) method. They found that the negative suction force slightly decreased when reducing the deck clearance. Santo et al. (2020) conducted several experiments to investigate the effect of impact force on a solid deck with and without an I-beam grillage subjected to focused waves. The impact force with the I-beam grillage contained more high-frequency spikes, and the peak force was three to four times larger than that of the pure deck. Fang et al. (2021) experimentally investigated forces exerted on a coastal bridge with a box girder under actions of focused waves. They found that a focused wave with a high peak frequency induced significantly larger horizontal and vertical slamming forces than those generated by a focused wave with a smaller peak frequency. Duong et al. (2021) reported experimental results for WID loading caused by focused waves with PIV measurements of velocity maps under the deck. The focused wave generated smaller upward force
and maximum pressures but larger downward force than those generated by a regular wave with an identical crest height and a zero up-crossing period. Wen et al. (2021) numerically studied the hydrodynamic phenomena of a coastal bridge deck subjected to a combined load of regular waves and onshore wind. The results showed that the intensity of the wave impact was increased due to the distorted wave profile under the wind action.
PIV techniques have recently been widely used in many applications in fluid mechanics as efficient and nonintrusive flow measurement methods (Raffel et al., 2018). Several PIV-based pressure estimation methods have been developed to derive fluid pressure by integrating PIV data and flow governing equations. These methods have the advantage of determining instantaneous pressures in an entire measurement field, whereas traditional pressure probes could only measure the local surface pressure. Furthermore, the PIV-based pressure estimation enable the ability to dig further into the relation between the kinematic flow characteristics and the surface loads. There are two strategies to estimate pressure from PIV data: direct integration of pressure gradients and solving the Poisson equation for the pressure (van Oudheusden, 2013).
To implement the first strategy, pressure gradients are computed from instantaneous PIV velocity data using either Navier–Stokes equation for viscous flow or Euler equation for incompressible inviscid flow. The pressure gradients are then spatially integrated from a boundary condition to obtain instantaneous pressure data. Liu and Katz (2006) proposed an omnidirectional virtual boundary integration scheme to estimate the pressure in a cavity turbulent shear flow. Panciroli and Porfiri (2013) evaluated pressure fields on a symmetric rigid wedge impacting a quiescent free surface and obtained a good match between
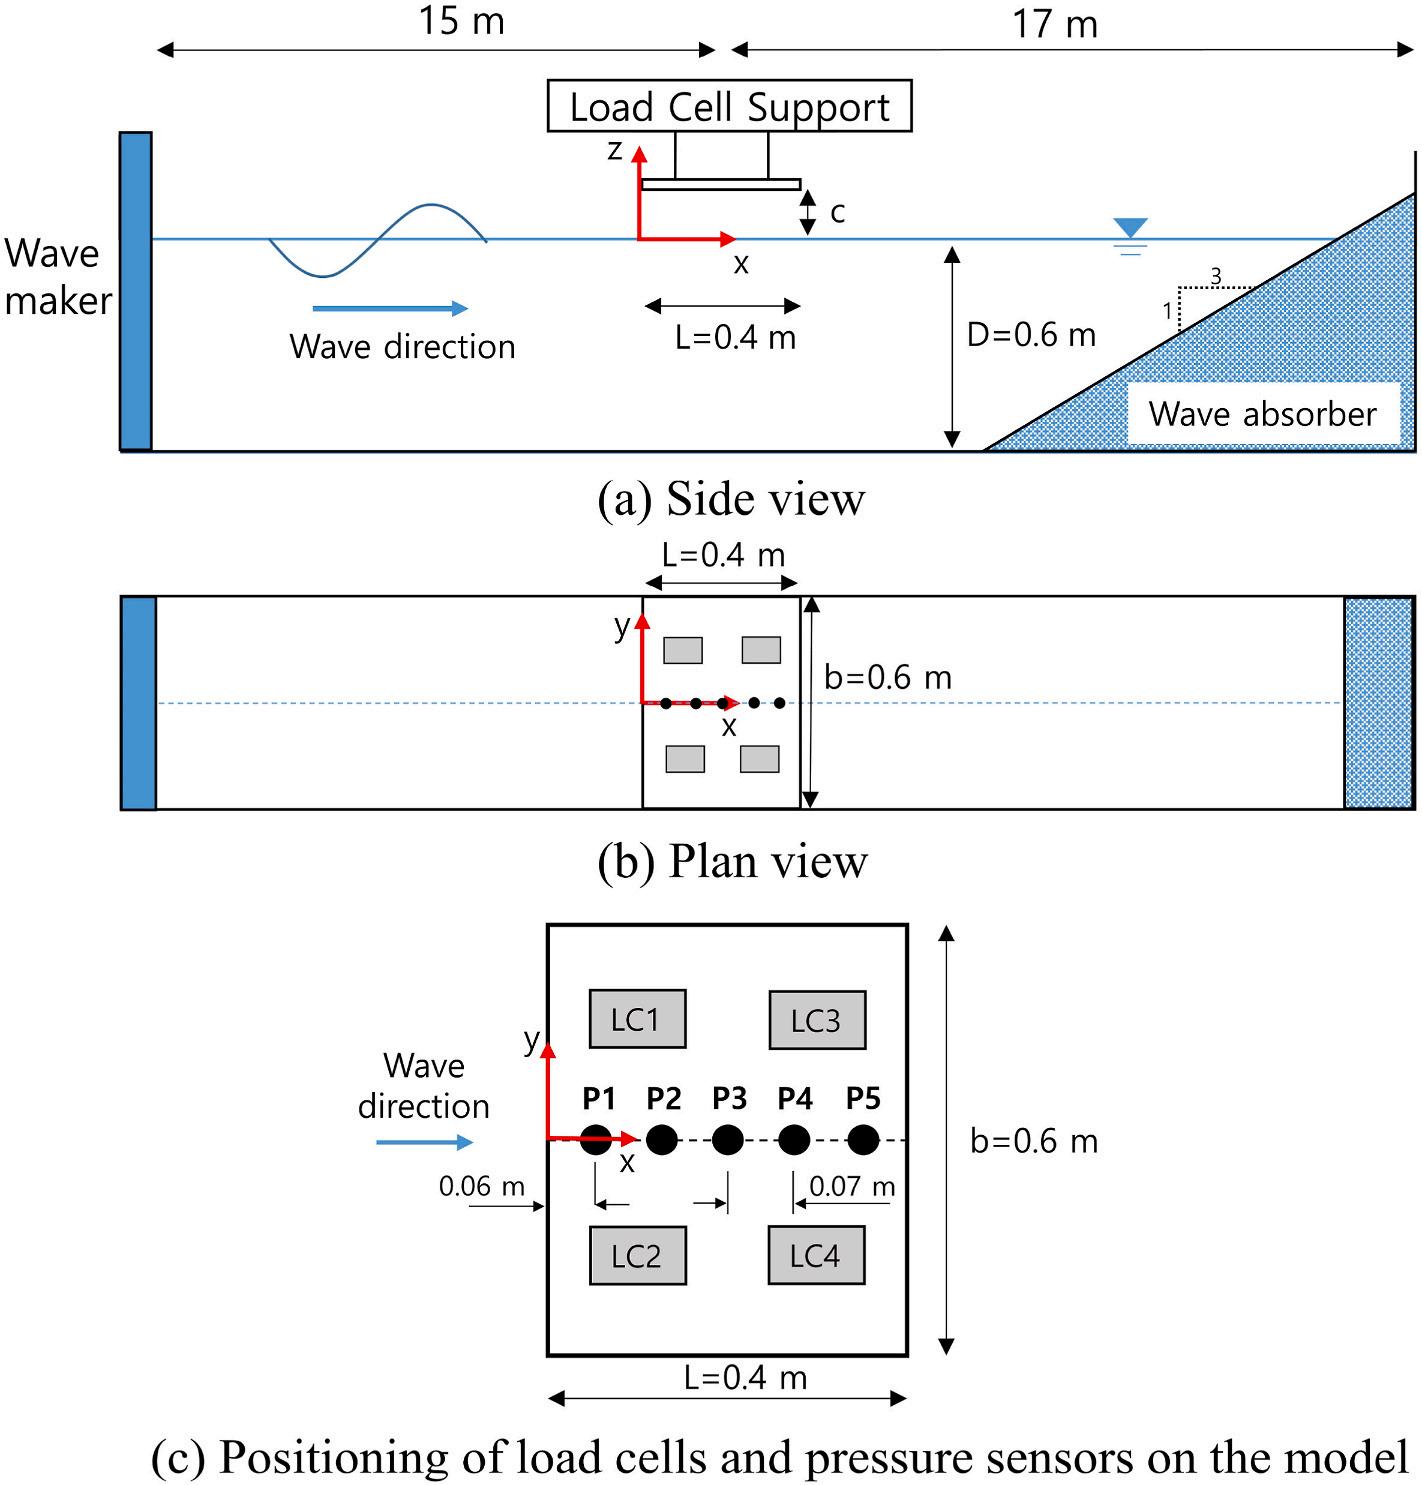
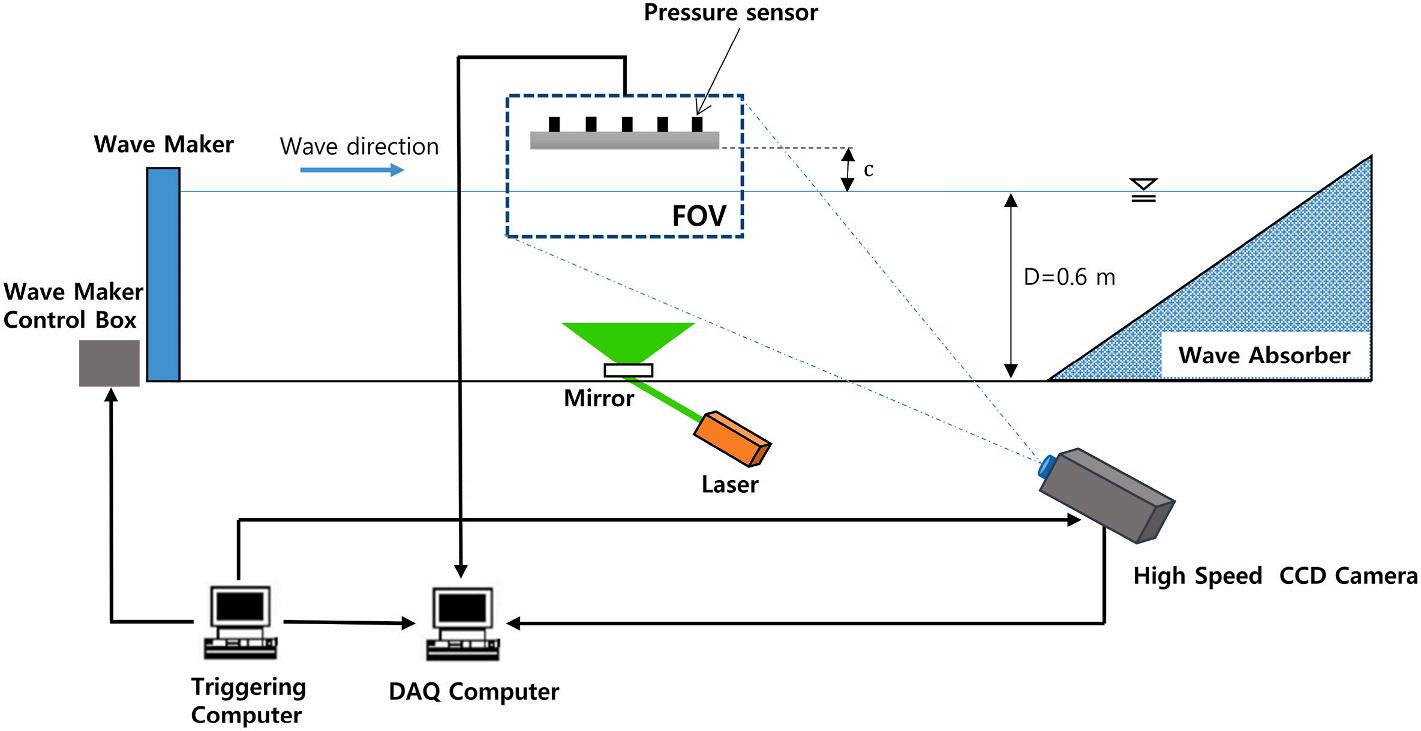
Fig. 1. Schematic view of the experimental setup in the 2D wave tank.
T.T.
Table 1
Main dimensions of the prototype and the model (λ = 1/56).
the estimated results and Wagner’s theoretical solution. Jeon et al. (2018) proposed a sequential least-squares reconstruction procedure to evaluate the instantaneous pressure field of a flow around an airfoil. Kim et al. (2020) estimated pressures and forces exerted on a 2D rectangular structure in a free roll decay test from PIV measurements to validate CFD results. Lee et al. (2020a) used the Eulerian approach to estimate the instantaneous pressure fields of WID loading caused by focused waves using measured PIV data. Compared with direct pressure measurements using pressure sensors, the PIV-based pressure estimation method produced a good match of pressure time series but underestimated the maximum pressures. She et al. (2021) used a pseudo-Lagrangian approach to estimate the pressure distribution on the water entry of a bulbous bow. For the second strategy, the fluid pressure is determined by solving the Poisson equation with proper Dirichlet and/or Neumann boundary conditions. For water entry phenomena, Nila et al. (2013) used the pressure Poisson solver to compute the slamming pressure of a falling symmetric wedge; meanwhile, Shams et al. (2015) reconstructed pressure fields on water entry of asymmetric wedges using a similar approach. Jacobi et al. (2019) adopted the Poisson approach with a Neumann boundary condition obtained from the Reynolds averaged momentum equation to reconstruct pressure fields in front of an interceptor of a ship model based on stereo PIV data.
In this study, a PIV-based pressure estimation method using the pseudo-Lagrangian approach was used to compute instantaneous pressure fields under the deck based on measured PIV data, which were obtained from a WID experiment subjected to focused waves (Duong et al., 2021). The estimated pressures from the pseudo-Lagrangian approach were compared with the measured pressures using pressure sensors and the estimated pressures using the Eulerian approach (Lee et al., 2020a) to validate the estimated pressure results. The effect of time interval on the accuracy of the estimated pressures from each approach was investigated in terms of the normalized root-mean-square error (NRMSE). The performance of each approach in estimating pressure time series, as well as maximum pressures, was discussed. Finally, the estimated pressure fields and pressure distributions under the deck were investigated in relation to the measured force and pressure data to
understand the nature of the WID phenomena.
2. Experimental setup and conditions
2.1. Experimental setup
A series of experiments were conducted in a 2D wave tank to measure PIV velocity fields under the deck subjected to focused waves. Detailed analysis of experimental results, including the effect of deck clearance and wave crest height on the characteristics of WID loads, was reported in Duong et al. (2021) Fig. 1 illustrates the schematics of the experimental setup and the positioning of the load cells and pressure sensors on the model. The glass-walled wave tank was 0.6 m wide and 32 m long, and the water depth D was maintained at 0.6 m during the experiments. A piston-type wavemaker was installed at one end of the wave tank, and a wave absorber was installed at the other end to reduce the wave reflection. An acrylic flat deck model with a length L = 0 4 m and a width b = 0 6 m was used, and the deck model was designed on the basis of a fixed jacket platform in the Gulf of Suez (Abdel Raheem, 2016) with a 1:56 scale ratio (λ). Table 1 presents the dimensions of the prototype and model. The model was located 15 m away from the wavemaker and fixed by an aluminum frame above the still water level (SWL). The vertical distance between the SWL and the underside of the deck called deck clearance c could be manually adjusted. Along the centerline of the deck, five Kistler 4043A2 piezoresistive pressure sensors denoted as P1–P5 were installed to measure the pressure under the deck, as shown in Fig. 1c. The distance between the pressure sensor P1 and the leading edge was 0.07 m, and the spacing between two consecutive pressure sensors was 0.06 m. Four two-component Wonbang Forcetech Model MCL-2A01-100 N load cells denoted as LC1–LC4 with a maximum capacity of 100 N were used to measure the global vertical force acting on the deck model. The force and pressure measurements were conducted with a sampling rate of 5 kHz, which was determined from a pressure convergence test with varying DAQ rates. Based on the method suggested by Lee et al. (2020b), a finite impulse response low-pass filter with a cut-off frequency of 150 Hz and an order of 91 was used to eliminate noise in raw pressure data.
The planar PIV system shown in Fig. 2 was used to measure the instantaneous 2D velocity fields of the wave loading along the centerline of the deck. Seeding polyamide 12 particles (VESTOSINT® 2157) with a mean diameter of 57 μm and a specific gravity of 1.02 were illuminated by a continuous laser source with a 532 nm wavelength. The laser beam was reflected by a mirror placed at the bottom of the wave tank. A highspeed CCD camera (Redlake Y5) with a sensor size of 2352 × 1728 pixels was used to capture PIV images. The camera was equipped with a 105 mm, f/1.8 macro focal lens set to 2.8, and the field of view (FOV) was
Fig. 2. PIV setup schematics.
T.T. Duong
Table 2
Characteristics of regular wave components for focused wave generation. Wave condition Wave component 1 Wave component 2
approximately 0.44 × 0.32 m2 The image acquisition rate was set to 500 Hz, corresponding to a time step of 2 ms, and the measurement time window was 2 s in all experiments. The DynamicStudio software was utilized to calculate the velocity vectors using the adaptive correlation method (Theunissen et al., 2007) with an interrogation area of 64 × 64 pixels and 50% overlap. The dimensions of the calculated velocity fields were 72 × 53 vectors, corresponding to 5.95 mm spatial resolution between two adjacent velocity vectors. Spurious vectors in the vector fields were removed using a median filter with a window size of 3 × 3 (Westerweel, 1994). The error of the PIV measurements was estimated at approximately 0.06 pixels (Lee et al., 2020a).
The experiment procedure comprised two steps. The first step was to measure PIV velocity maps and the elevation of the incident wave using a two-wire wave probe placed at the center of the deck with a sampling
rate of 100 Hz. Then, the deck was installed to measure the force, pressure, and velocity maps under the deck, and all measurement systems were synchronized with the wavemaker.
2.2. Experimental conditions
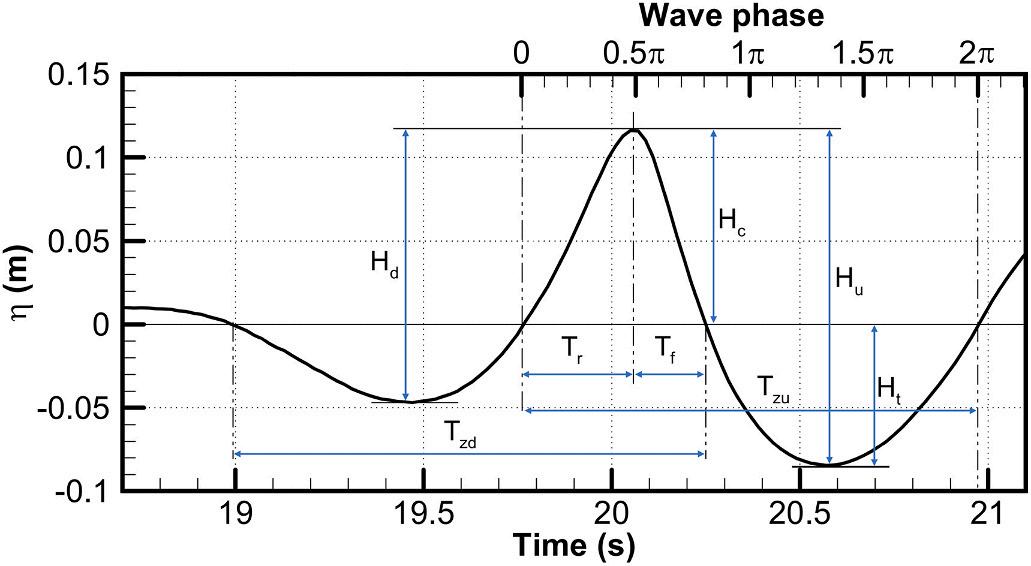
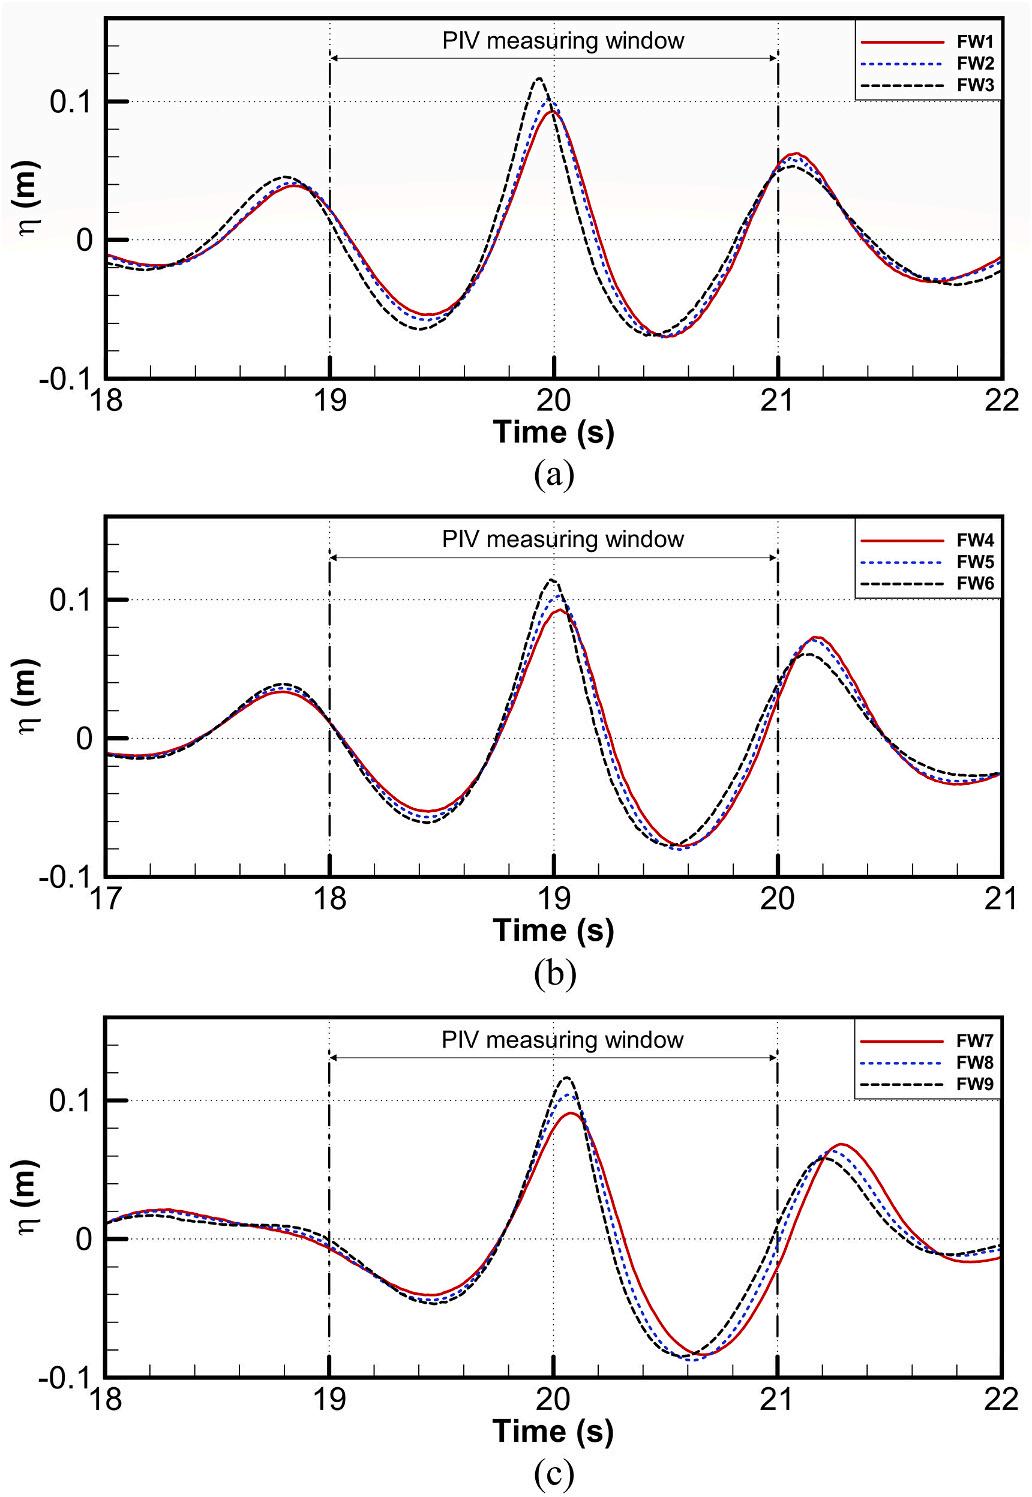
In this study, focused waves were generated to model a 100-year return period wave condition in the Gulf of Suez, which had a wave height of 7.92 m and a period of 8.0 s (Abdel Raheem, 2016). A total of nine focused wave conditions were used in this experiment, denoted as FW1–FW9. Each focused wave was generated by superposing two regular wave components at the center of the deck model. Table 2 presents the wave period (T ) and wave height (H) of each wave component. Note that the amplitudes of regular wave components were adjusted to generate three focused waves with different crest heights. Fig. 3 presents the wave elevations measured at the center of the deck for all focused wave conditions and the corresponding PIV measuring windows. Note that only the focused wave with the largest wave crest height in the wave train interacted with the deck model. Fig. 4 presents wave parameters used to characterize the time series of focused waves. Here Hc , Ht , Hu , and Hd represent the wave crest height, wave trough height, zero up-crossing wave height, and zero down-crossing wave height, respectively. Tzd and Tzu denote the zero down-crossing and zero up-crossing periods, respectively, whereas Tr and Tf are time intervals between the instant of the wave crest and the zero-crossing points (Myrhaug and Kjeldsen, 1986), respectively. Table 3 presents the characteristics of all focused wave conditions used in the experiments.
Three values of deck clearance c were 0.06, 0.07, and 0.08 m, which were denoted by three letters A, B, and C, respectively. The experiments were performed at 27 experimental conditions of nine focused wave conditions and three deck clearances, and the combination of the wave condition and deck clearance was used to denote the experimental condition. For example, the experimental condition FW1-A indicates a test condition with a focused wave FW1 and a deck clearance of 0.06 m. In this study, the time series of any physical quantity within the time interval of one zero up-crossing period was presented by the wave phase in radian with the zero phase, corresponding to the time instant of the zero up-crossing elevation measured at the center of the deck, as shown in Fig. 4.
3. PIV-based pressure estimation method
3.1. Principle of pressure estimation using Euler equation
In this study, viscous terms in momentum equations of fluid flow were ignored because they could not be properly resolved from the present PIV measurement with the present spatial resolution of 5.95 mm. For incompressible and inviscid flows, pressure gradients were directly computed from the measured PIV data using Euler equation as
Fig. 3. Wave elevation measured at the center of the deck.
Fig. 4. Wave parameters to characterize focused waves.
T.T. Duong
Table 3
Characteristics
below:
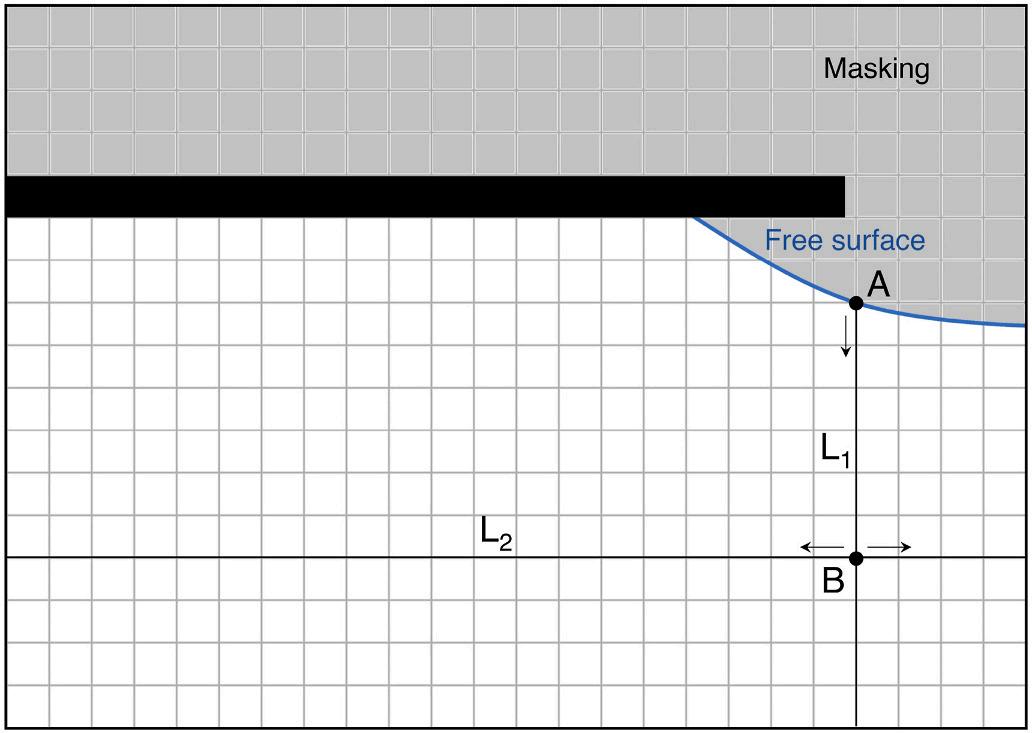
where P represents pressure; u and w represent the horizontal and vertical velocity components of a fluid particle, respectively; and t , ρ, and g represent time, the density of the fluid, and gravitational acceleration, respectively. Then, the pressure field could be reconstructed by spatial integration of computed pressure gradients from locations with known pressure data. Fig. 5 shows the process of spatial integration of pressure gradients used in this study, which is similar to the process proposed by Kim et al. (2020) and Lee et al. (2020a) First, from point A at the free surface, with atmospheric pressure, pressure data along the vertical line L1 was calculated by applying a simple forward integration. From point B located on line L1, the pressure gradient was then horizontally integrated to obtain pressure data on line L2. With known pressure data on
lines L1 and L2, the unknown pressure at the rest of the fluid domain was reconstructed using the pressure eroding scheme developed by Baur and Kongeter (1999) The same process was performed with the different selections of points A and B, and the final pressure field was obtained by taking the average of all resulting pressure fields to reduce the effect of the random error on the measured PIV data.
3.2. Acceleration evaluation
To calculate the pressure gradient using Euler equation, the material acceleration of fluid particles was estimated on the basis of measured PIV velocities using either the Eulerian or pseudo-Lagrangian approach. The Eulerian approach, which was adopted by Lee et al. (2020a) to calculate the pressure fields of WID, was briefly described for completeness. The central finite difference scheme was used to compute the spatial and temporal derivatives of PIV velocity components inside the fluid domain, as shown in Eqs. (3)–(5):
where h represents the spatial resolution of the PIV measurement (5.95 mm), δt represents the time separation between two successive PIV frames (2 ms), and Δt = nδt is the time interval between the two PIV frames used in the acceleration calculation. Additionally, the forward and backward finite difference schemes were adopted to calculate the acceleration of fluid particles located at the free surface, at the edges of the FOV, and slightly under the deck.
For the pseudo-Lagrangian approach, the material acceleration of fluid particles was calculated using fluid path reconstruction using PIV data (Novara and Scarano, 2013). With the assumption that the velocity of a particle remains constant during time separation δt , the position of an imaginary particle along the path at the i previous and subsequent instants was estimated as
Fig. 5. Process of spatial integration of pressure gradients.
Fig. 6. Reconstruction of particle path using pseudo-Lagrangian approach from five instants (n = 4).
T.T. Duong
position and true velocity vector of the imaginary particle.
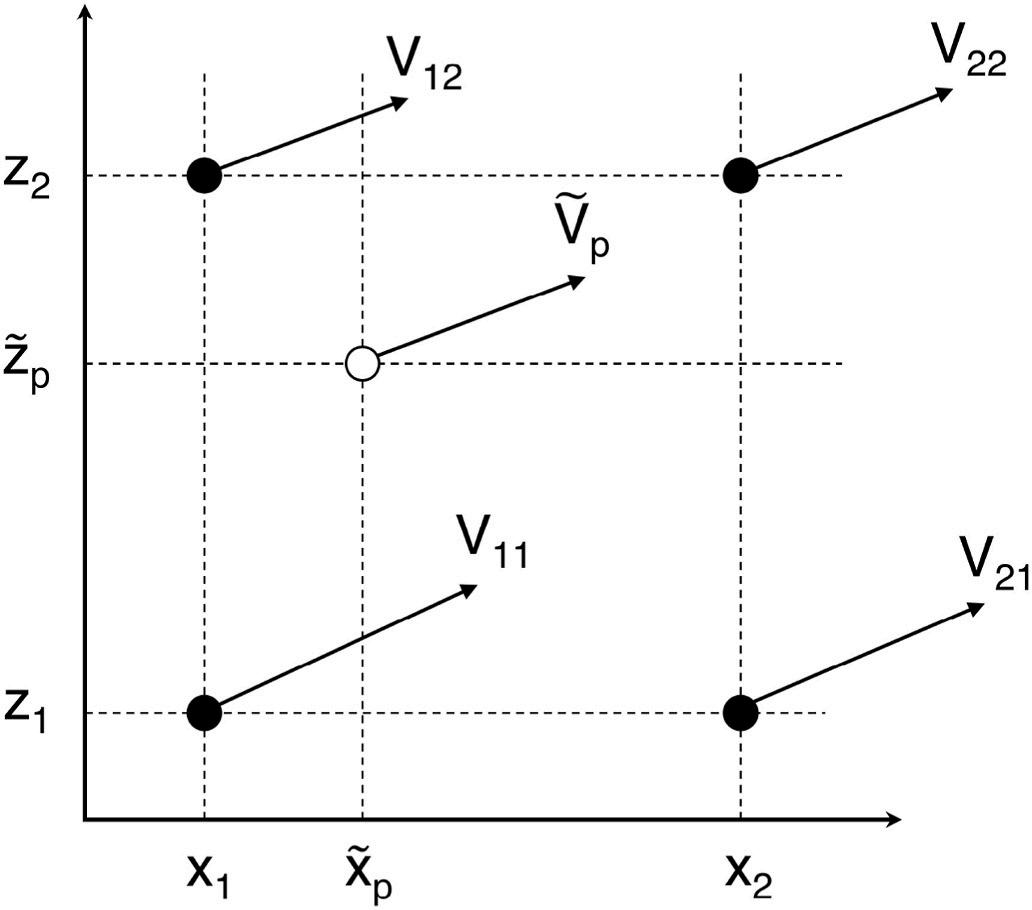
The velocity of the imaginary particle V p (xp , zp ) at each instant could be estimated from four adjacent velocity vectors obtained from PIV measurements at the same instant, as shown in Fig. 7, using the bilinear interpolation method (Press et al., 2007):
where ̃ rp represents the estimated position of the imaginary particle and ̃ V p denotes the estimated velocity of the imaginary particle computed from the surrounding PIV vectors. Note that the number of PIV frames used in the acceleration calculation by the pseudo-Lagrangian approach is n + 1, whereas only two PIV frames are used in the Eulerian approach to compute acceleration. Fig. 6 shows the path reconstruction using PIV data along with five time instants (n = 4). rp and Vp are the actual
The material derivative was then computed using the central finite difference of the estimated velocity as
where Δt = nδt is the time interval between the beginning and end of path reconstruction.
4. Results and discussion
4.1. PIV measurement uncertainty using divergence-based approach
The divergence-based approach (Zhang et al., 2020) was used to estimate the error distribution in velocity fields obtained from the present PIV measurements. The measured velocity V could be decomposed into the true velocity Vt and the velocity error εV , as follows: V = Vt + εV , (11)
For incompressible flows, the continuity equation implies that the true velocity should have the divergence-free property, which is expressed as
Fig. 7. Bilinear interpolation from four adjacent velocity vectors.
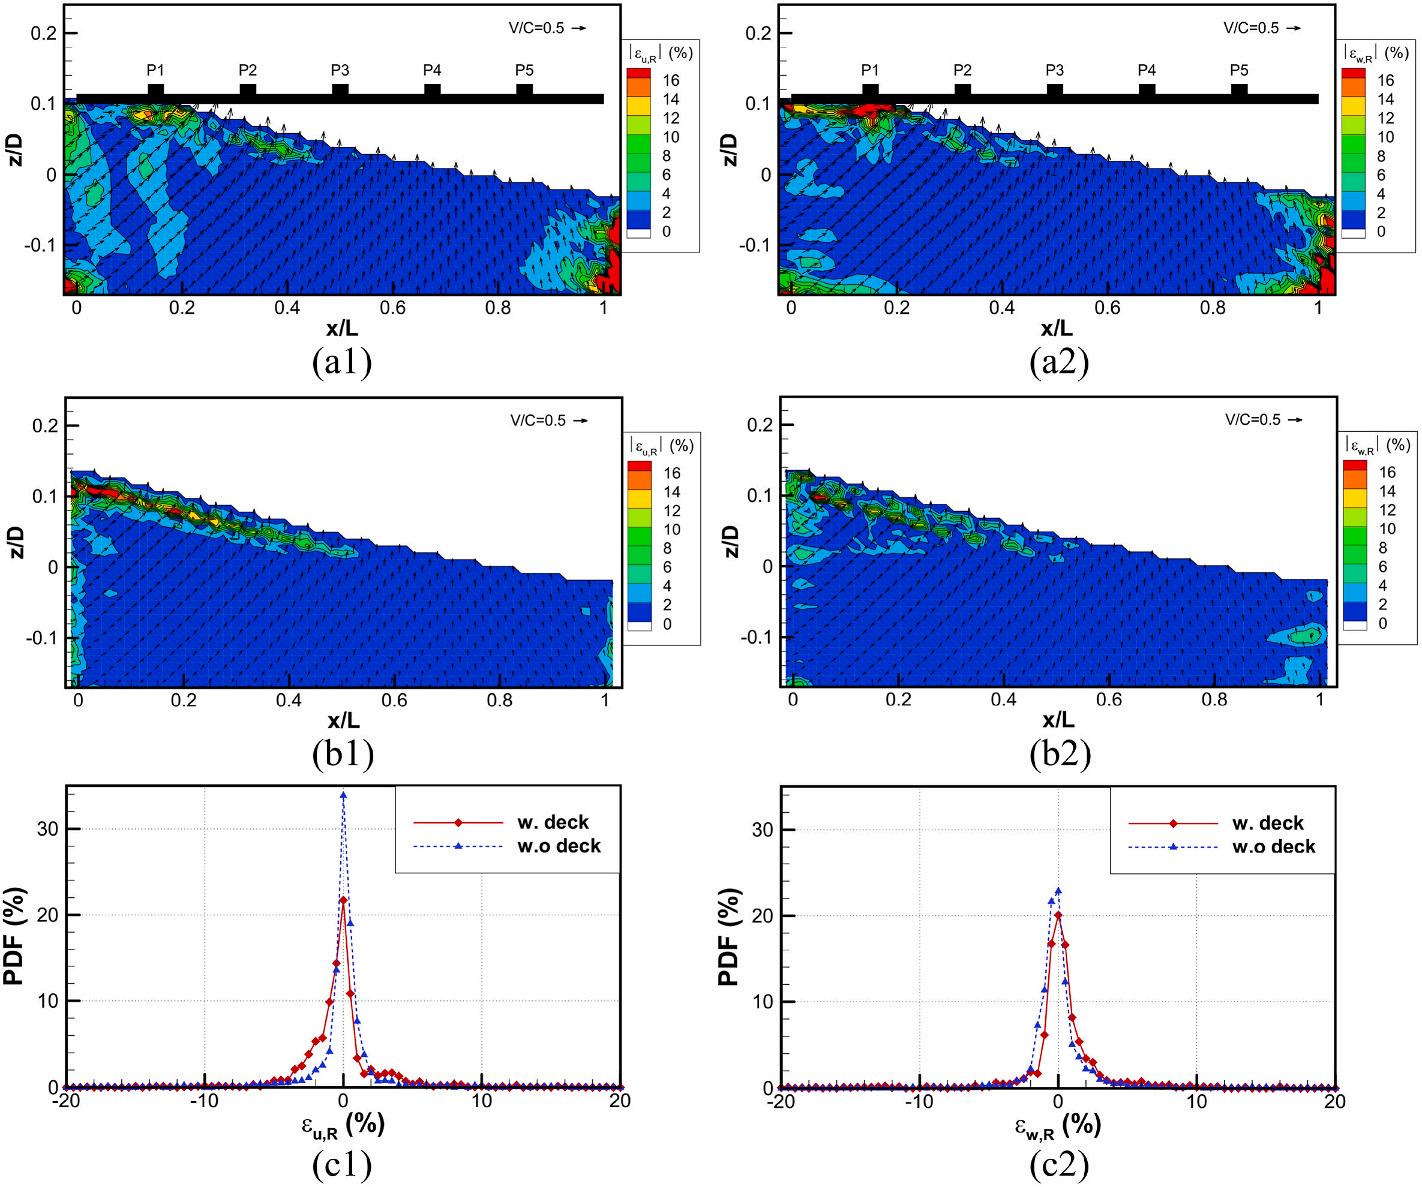
Fig. 8. PIV measurement uncertainty at the instant of maximum pressure at P1. Magnitudes of horizontal and vertical velocity errors with the deck (first row) and without the deck (second row) and their PDF (third row). T.T.
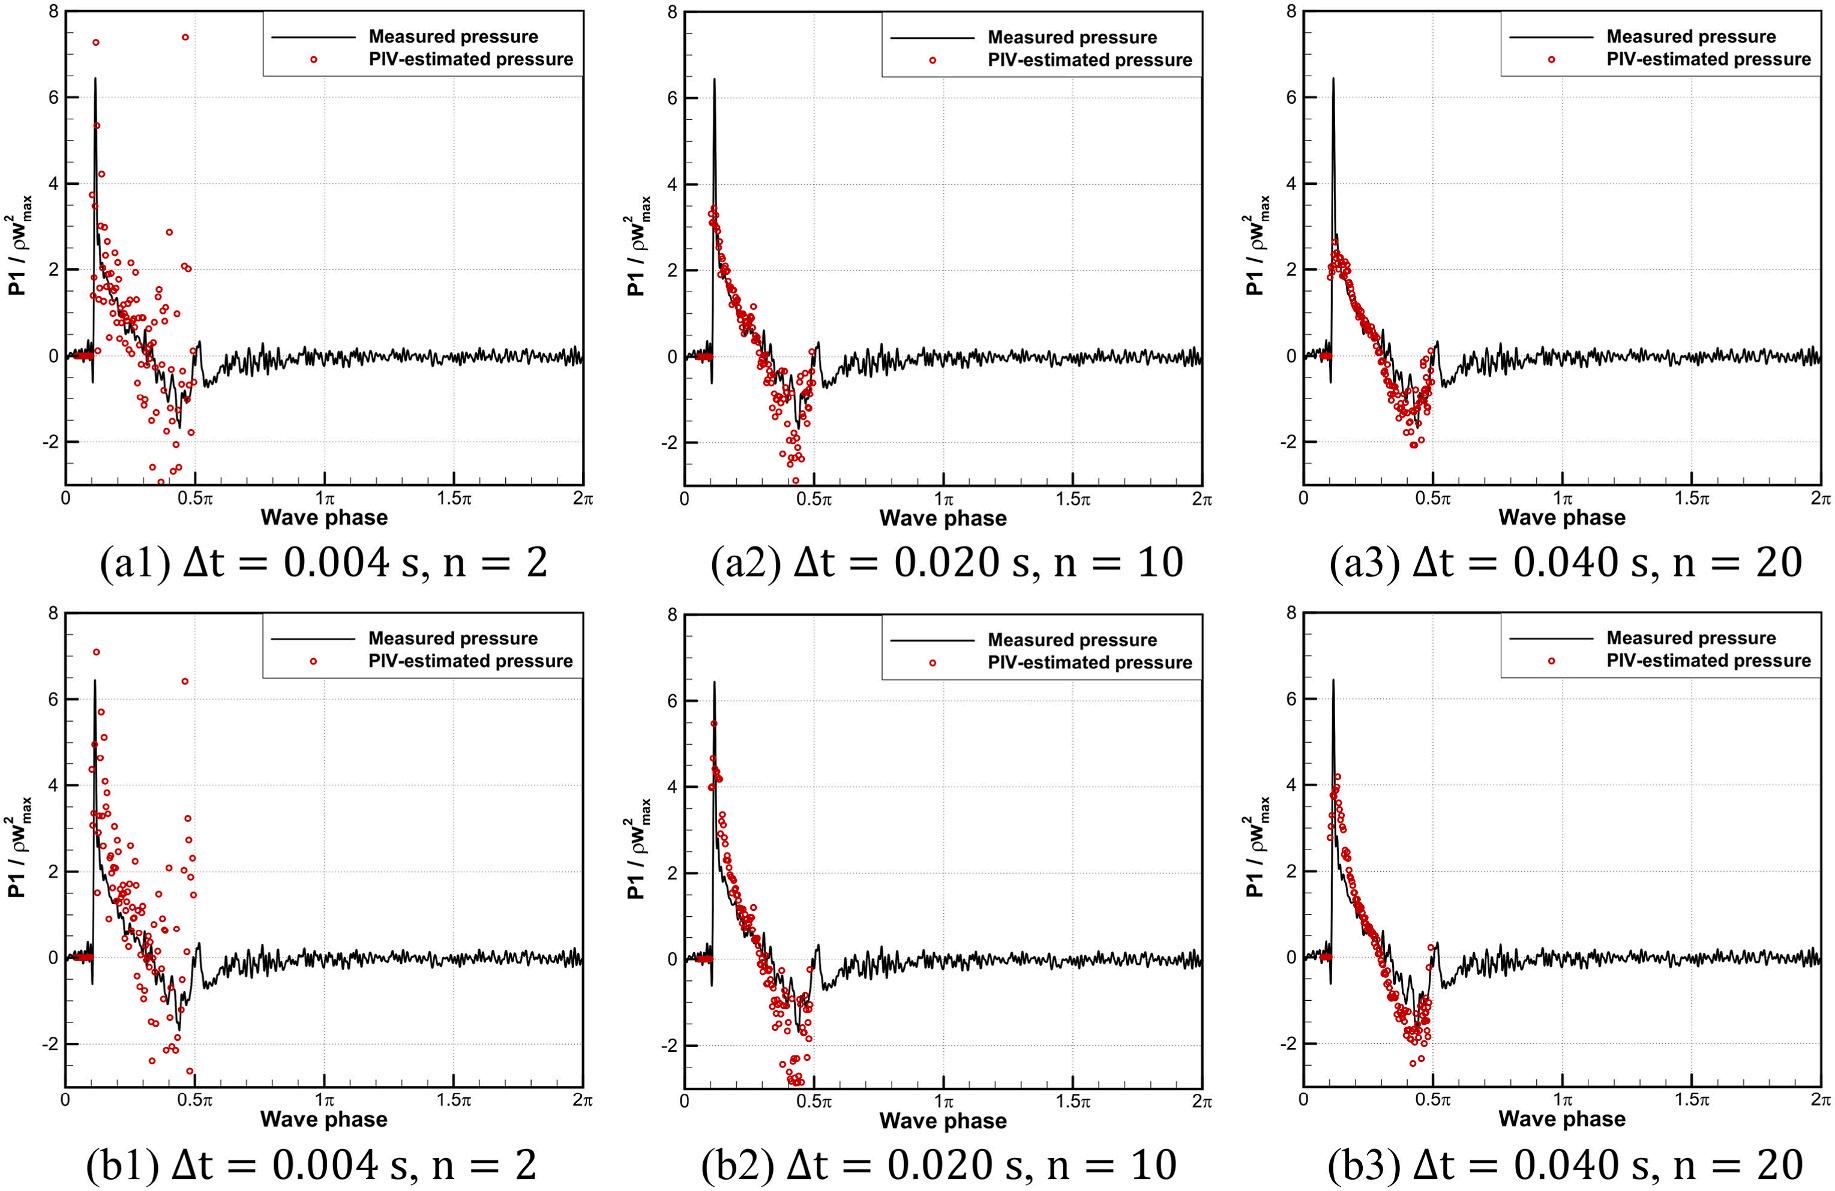
9. Time histories of the measured and estimated pressure with varying n for the experimental condition
∇ Vt = ∂ut ∂x + ∂wt ∂z = 0 (12)
Therefore, the divergence of the velocity error, which is typically nonzero, could be estimated by taking the divergence of the measured velocity, as shown in Eq. (13).
∇ ⋅ εV = ∇⋅V (13)
The velocity error field could be estimated by computing the leastsquares solution to Eq. (13):
ε V = (∇ )T ( ∇2 ) 1 (∇ ⋅ V ), (14)
where ∇ represents the divergence matrix and V represents the column vector containing all components of the measured velocity. The divergence matrix is constructed using the central finite difference scheme for velocities inside the fluid domain and the backward and forward scheme for velocities at the edges of the FOV, at the free surface, and slightly under the deck. Note that the velocity error estimated using this method is also accompanied by the truncation error of finite difference schemes used in the construction of the divergence matrix.
In this study, relative velocity errors εu,R and εw,R in horizontal and vertical directions, respectively, are calculated as follows:
εu,R = εu wmax , (15)
εw,R = εw wmax , (16)
where εu and εw are the horizontal and vertical components of velocity errors estimated from Eq. (14) and wmax (0.47 m/s) is the maximum vertical particle velocity estimated from the linear wave theory for a regular wave with an identical wave height and a zero up-crossing wave period as the focused wave condition. Fig. 8 shows the uncertainty of PIV measurement at the instant maximum pressure at P1 for condition
FW1-A. The first row shows the magnitudes of the relative velocity error with the presence of the deck, whereas the second row shows the magnitudes of the relative velocity error of the incident wave without the deck, and the third row shows their probability density function (PDF). The large velocity errors (>10%) in both cases are distributed near the deck, the free surface, and the edges of the FOV, whereas, inside the fluid domain, the relative velocity error is smaller than 2%. This observation is a common feature in any PIV measurements (Raffel et al., 2018). Most of the relative velocity errors are less than 5%, as shown in subfigures 8c1 and 8c2.
4.2. Assessment of PIV-based pressure estimation accuracy
In the reconstruction of pressure using PIV data, the time interval Δt between the beginning and ending instants used in the acceleration calculation significantly influences the resulting pressure. The time interval should be sufficiently long to reduce precision errors, but truncation errors in finite difference schemes would increase with a longer time interval (van Oudheusden, 2013). A proper value of the time interval Δt or the number of PIV frames used in the acceleration calculation must be determined to minimize the total error during pressure reconstruction (Jensen and Pedersen, 2004). Fig. 9 illustrates the time series of the estimated pressure and the measured pressure obtained at P1 for the experimental condition FW1-A with different time intervals. The pressure was nondimensionalized by the term ρw2 max The first and second rows present the estimated pressure from the Eulerian (Lee et al., 2020a) and pseudo-Lagrangian approaches, respectively. In both approaches, with a smaller time interval Δt = 0 004 s in subfigures 9a1 and 9b1, the estimated pressure fluctuates significantly, which is attributed to a higher precision error. By contrast, with Δt = 0 020 s and Δt = 0 040 s, the estimated pressure matches well with the measured pressure, but the value of the maximum pressure estimated from PIV data decreases as the time interval increases.
The NRMSE between the estimated and measured pressures is used
Fig.
FW1-A. First row: Eulerian approach (Lee et al., 2020a); second row: pseudo-Lagrangian approach.
T.T.
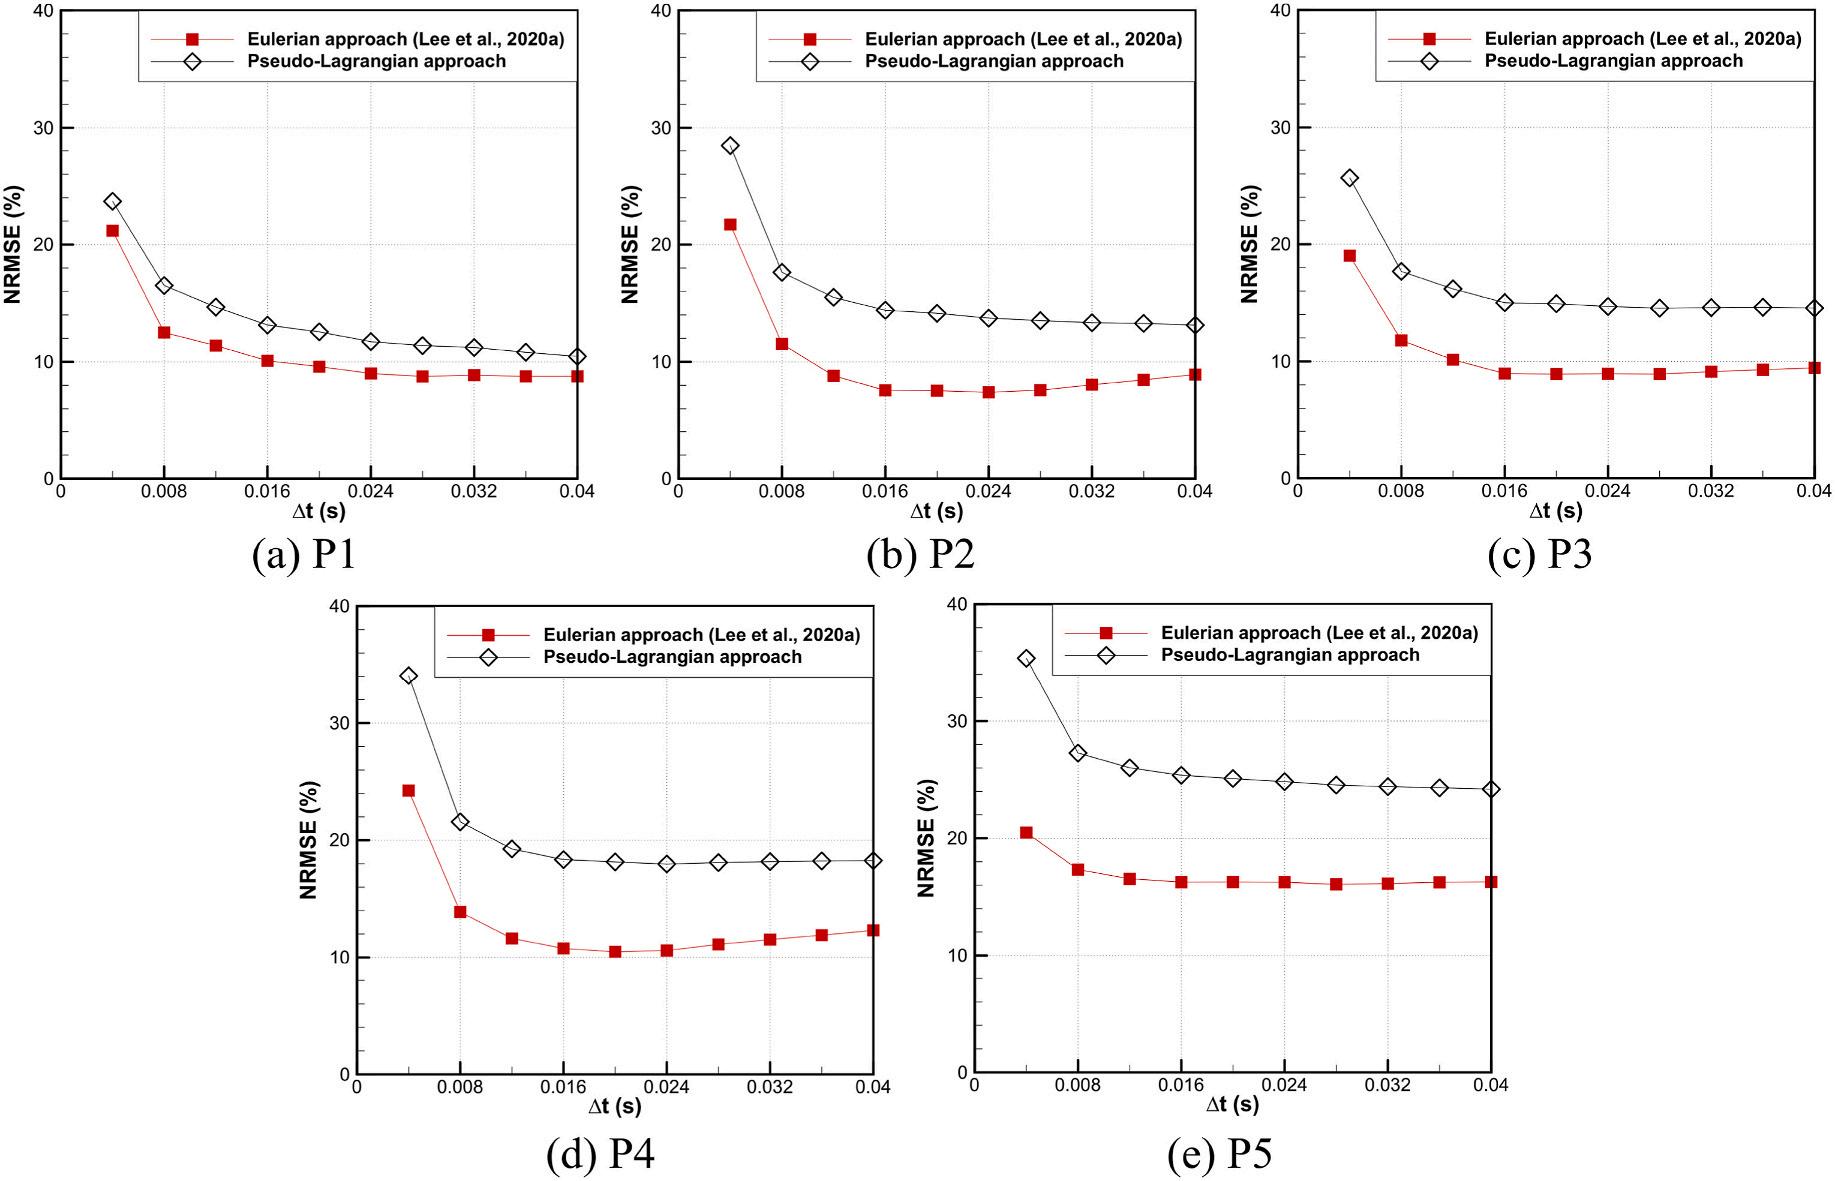
10. NRMSE with varying Δt for the experimental condition FW1-A.
11. Time histories of measured and estimated pressures using the Eulerian approach with Δt = 0 02 s (n = 5) for the experimental condition FW1-A (Lee et al., 2020a).
Fig.
Fig.
Fig. 12. Time histories of measured and estimated pressures using the pseudo-Lagrangian approach with Δt = 0 02 s (n = 5) for the experimental condition FW1-A.
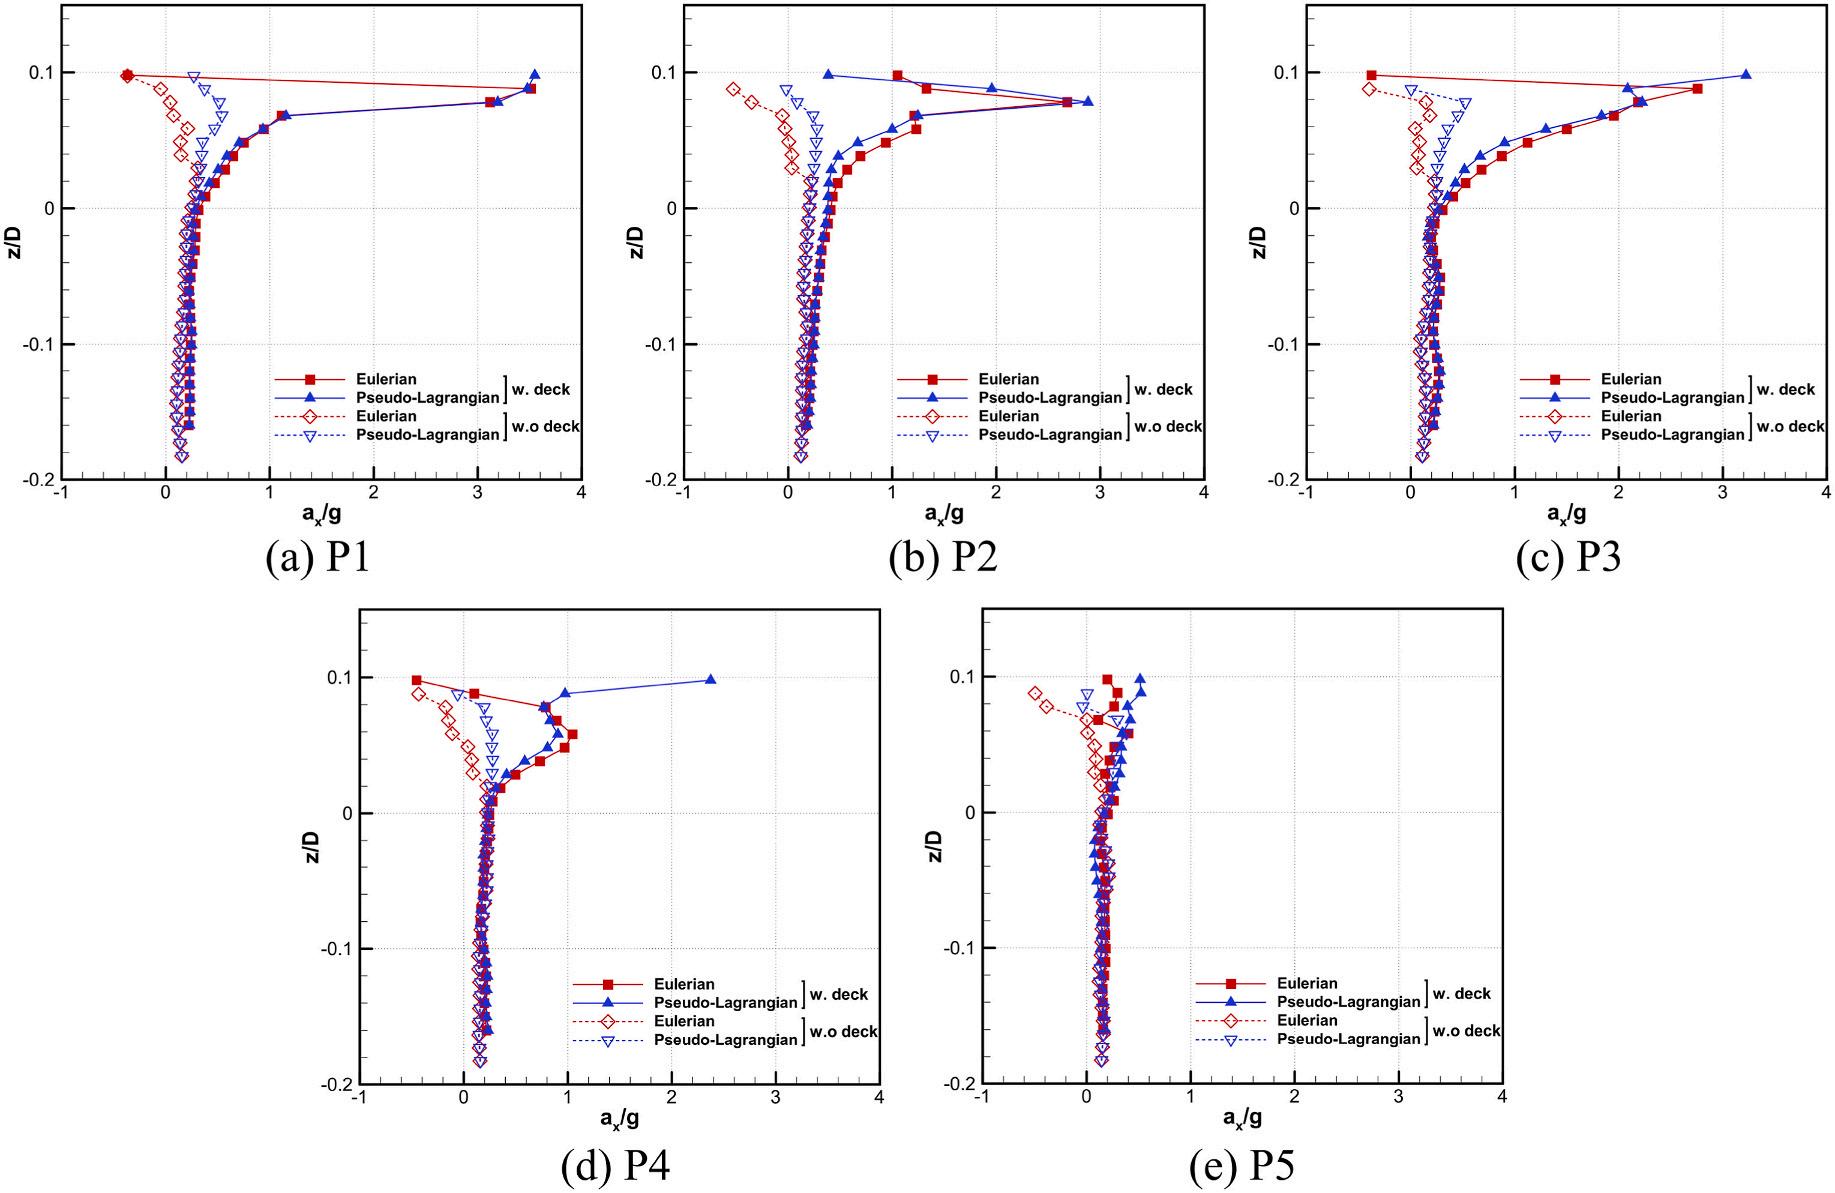
Fig. 13. Horizontal component ax of material acceleration under each pressure sensor at the instants of maximum pressure occurrence for the experimental condition FW1-A.
to quantitatively assess the accuracy of PIV-based pressure estimation:
NRMSE = 1 N ∑N i=1 ( Pi m Pi e )2
Pmax, m Pmin, m , (17)
where Pim and Pie are the measured pressures using a pressure sensor and the estimated pressure from PIV data, respectively. Pmax, m and Pmin, m are the maximum and minimum measured pressures, respectively, and N denotes the number of estimated pressures. Fig. 10 shows the NRMSE computed at each pressure sensor with varying Δt for the experimental condition FW1-A. The NRMSE shows a decreasing tendency with increasing Δt from 0.004 to 0.020 s. With Δt > 0 020 s, the NRMSE nearly remains stable or slightly increases. Therefore, Δt = 0 020 s (Δt / Tzu = 0 018) was selected as the proper value to minimize the total error in the PIV-based pressure estimation in this study. Note that for all pressure sensors, the Eulerian approach produces fewer errors than the pseudo-Lagrangian approach. Additionally, the pressure sensor P5 experiences the largest error among all pressure sensors for both approaches. As the wave propagated along the underside of the deck, the wetted length continuously expanded and the length of the free surface captured by the PIV image decreased, bringing the starting point of the pressure integration (point A in Fig. 5) closer to the right-hand edge of the FOV, where the larger error distribution in the PIV data was larger, as shown in Fig. 8 This led to the larger error accumulated in the pressure gradient integration obtained at pressure sensor P5.
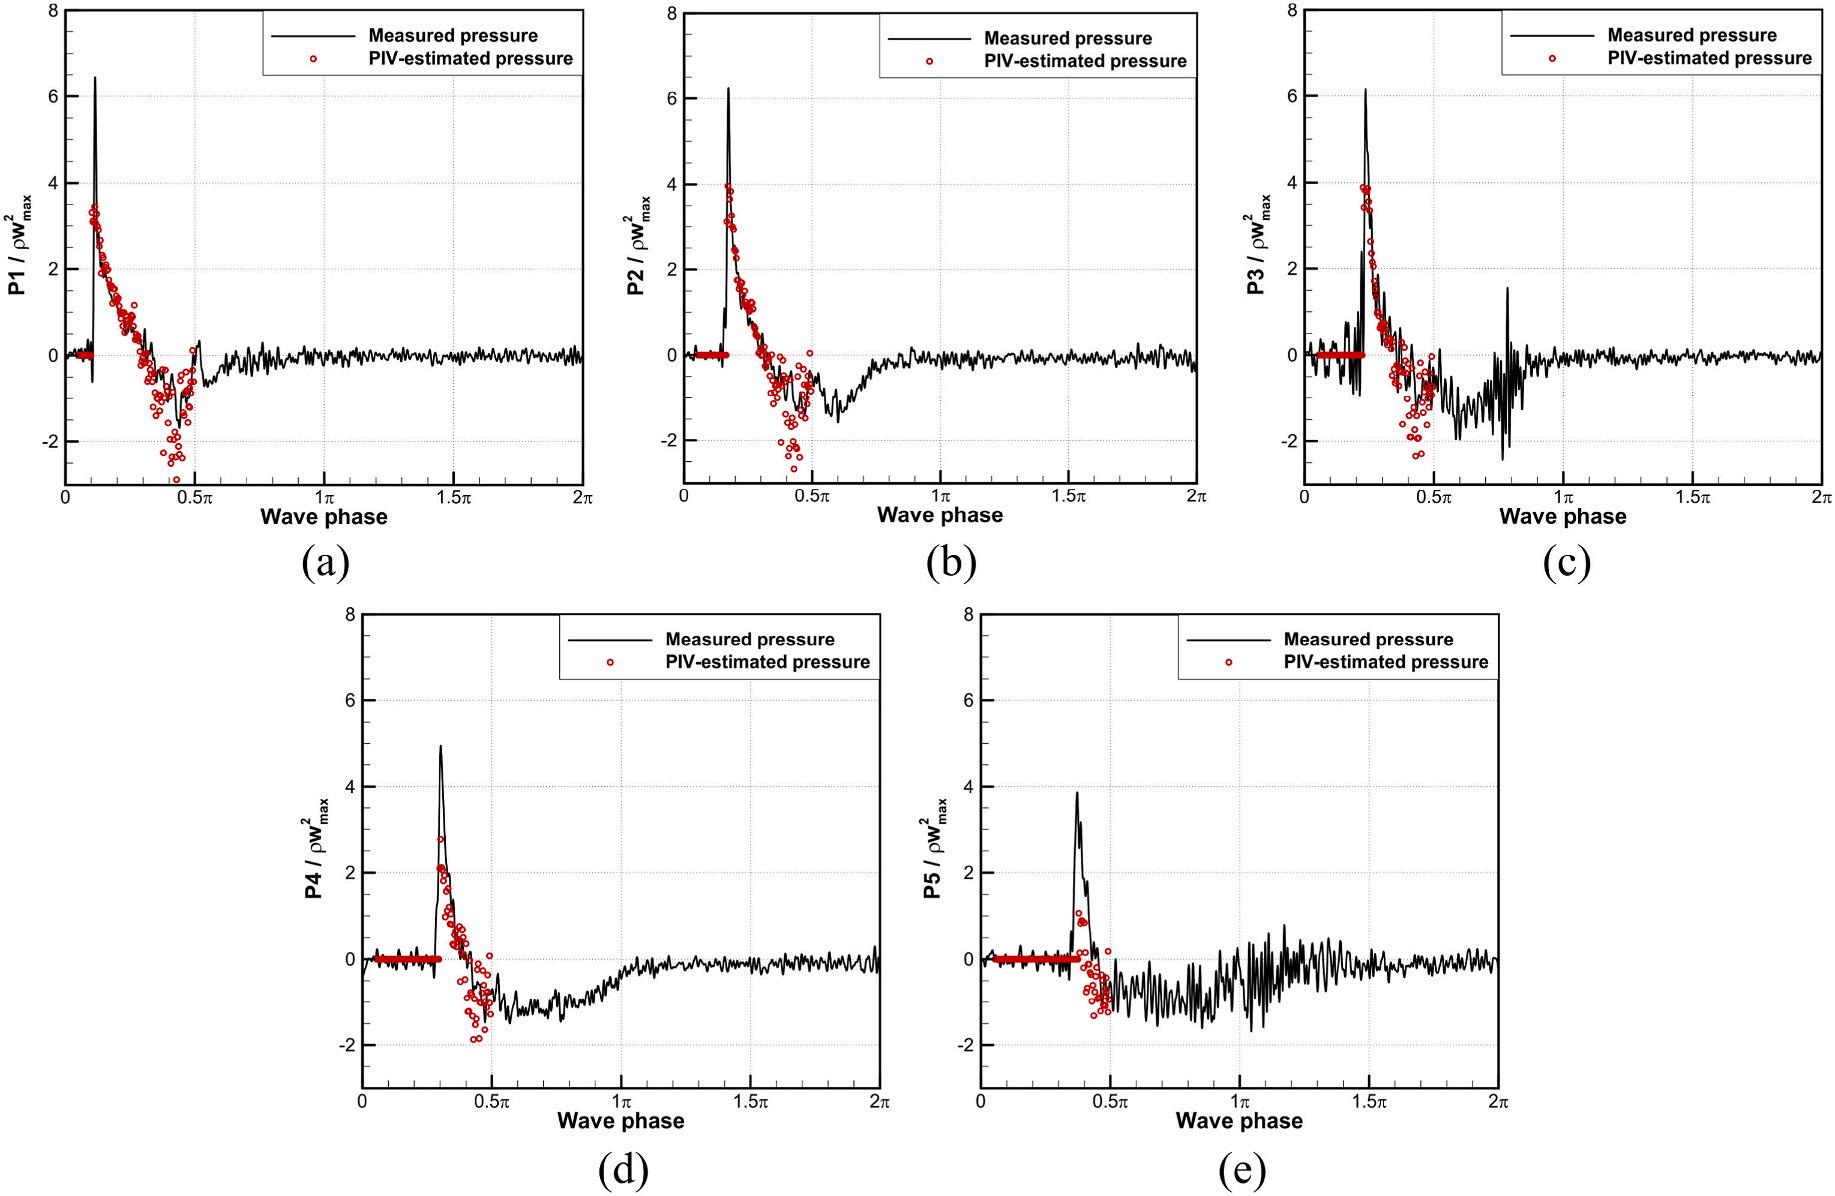
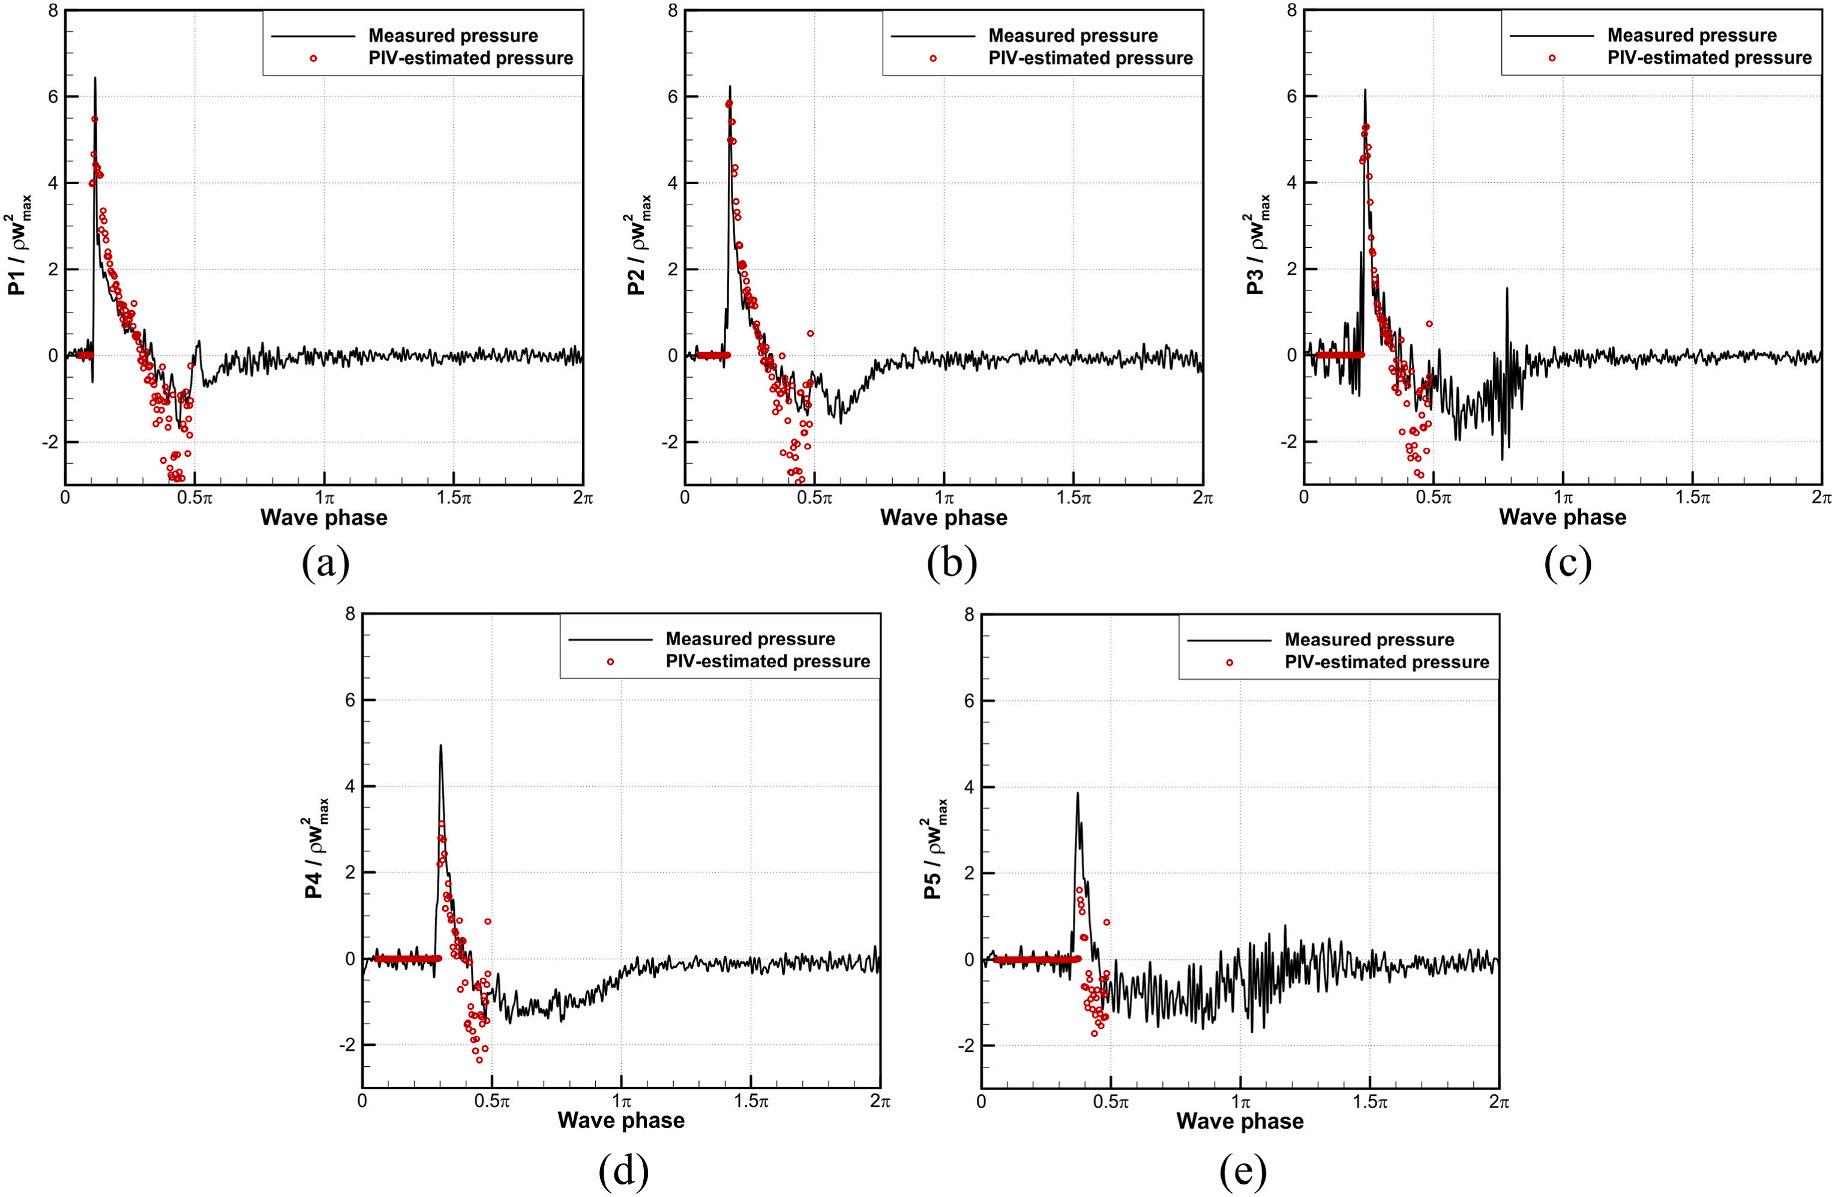
Figs. 11 and 12 show the time series of the estimated pressures from the Eulerian and pseudo-Lagrangian approaches, respectively, with Δ t = 0 02 s, for the experimental condition FW1-A. The PIV-estimated pressure was computed until reaching the phase 0 5π , and after this phase, the PIV measurement could not capture the entire fluid domain under the deck because of the falling water in the gaps between the deck and the glass walls of the wave tank. Generally, the estimated pressure matches well with the measured one obtained from the pressure sensors. The maximum pressure could not be accurately reconstructed because of
Table 4
MRE of maximum pressures
MRE Eulerian approach Pseudo-Lagrangian approach
the longer time interval Δt = 0 02 s compared with the rise time of the measured pressure using pressure sensors, which varied in the range of 0.005–0.02 s, as described in Duong et al. (2021)
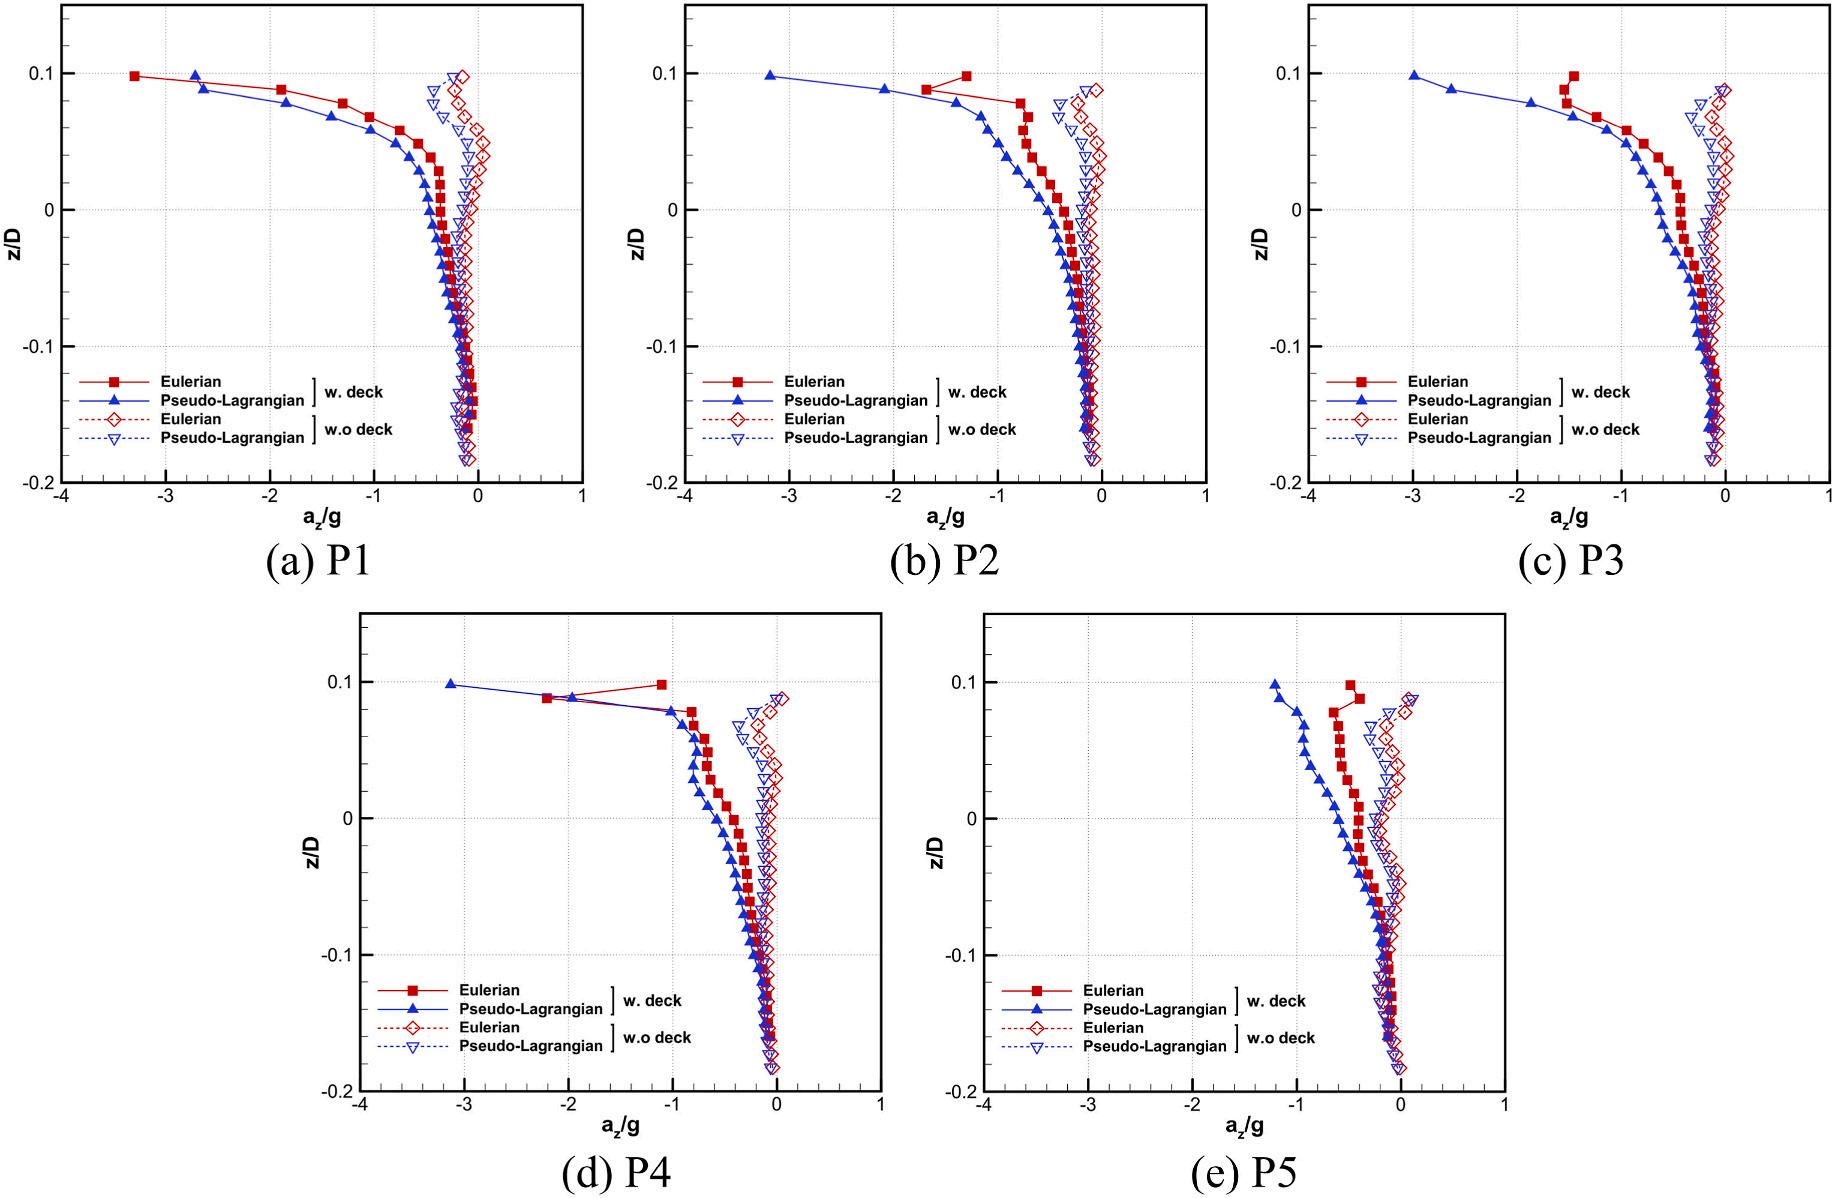
Figs. 13 and 14 present the instantaneous horizontal component (ax) and vertical component (az) of the material acceleration under each pressure sensor at the instants of the maximum pressures. The components of the material acceleration of the incident wave without the deck at the same positions were also computed to investigate the effect of the deck on fluid acceleration. The material acceleration and the vertical axis were nondimensionalized by gravitational acceleration g and water depth D, respectively. In Fig. 13, there was an insignificant difference in the horizontal acceleration computed from the Eulerian and pseudoLagrangian approaches, except for the fluid region slightly below the deck level. However, the pseudo-Lagrangian approach produced larger vertical acceleration than the Eulerian approach, as shown in Fig. 14. This would result in the higher maximum pressures estimated by the pseudo-Lagrangian approach compared to those estimated by the Eulerian approach. When the wave hit the deck at the position of the pressure sensor, the horizontal component significantly increased and could be up to 3 5g (Fig. 13a), whereas the vertical component dramatically decreased to the same extent as the horizontal one. At instants of the maximum pressures, the effect of the deck on material acceleration vanished below the SWL for the horizontal component and
Fig. 14. The vertical component az of the material acceleration under each pressure sensor at the instants of maximum pressure occurrence for the experimental condition FW1-A.
T.T. Duong et al.
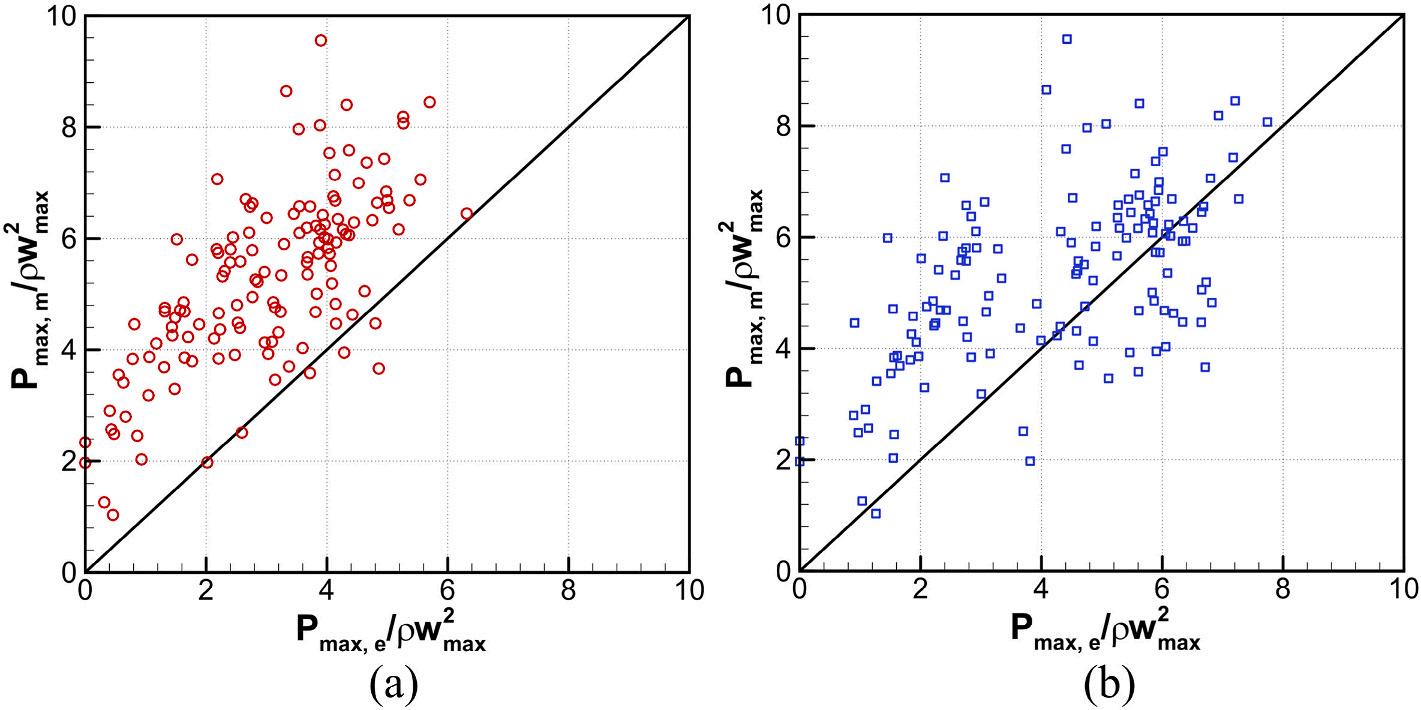
15. Comparison of the measured and estimated maximum pressures at all pressure sensors for all experimental conditions. (a) Eulerian approach, (b) pseudoLagrangian approach.
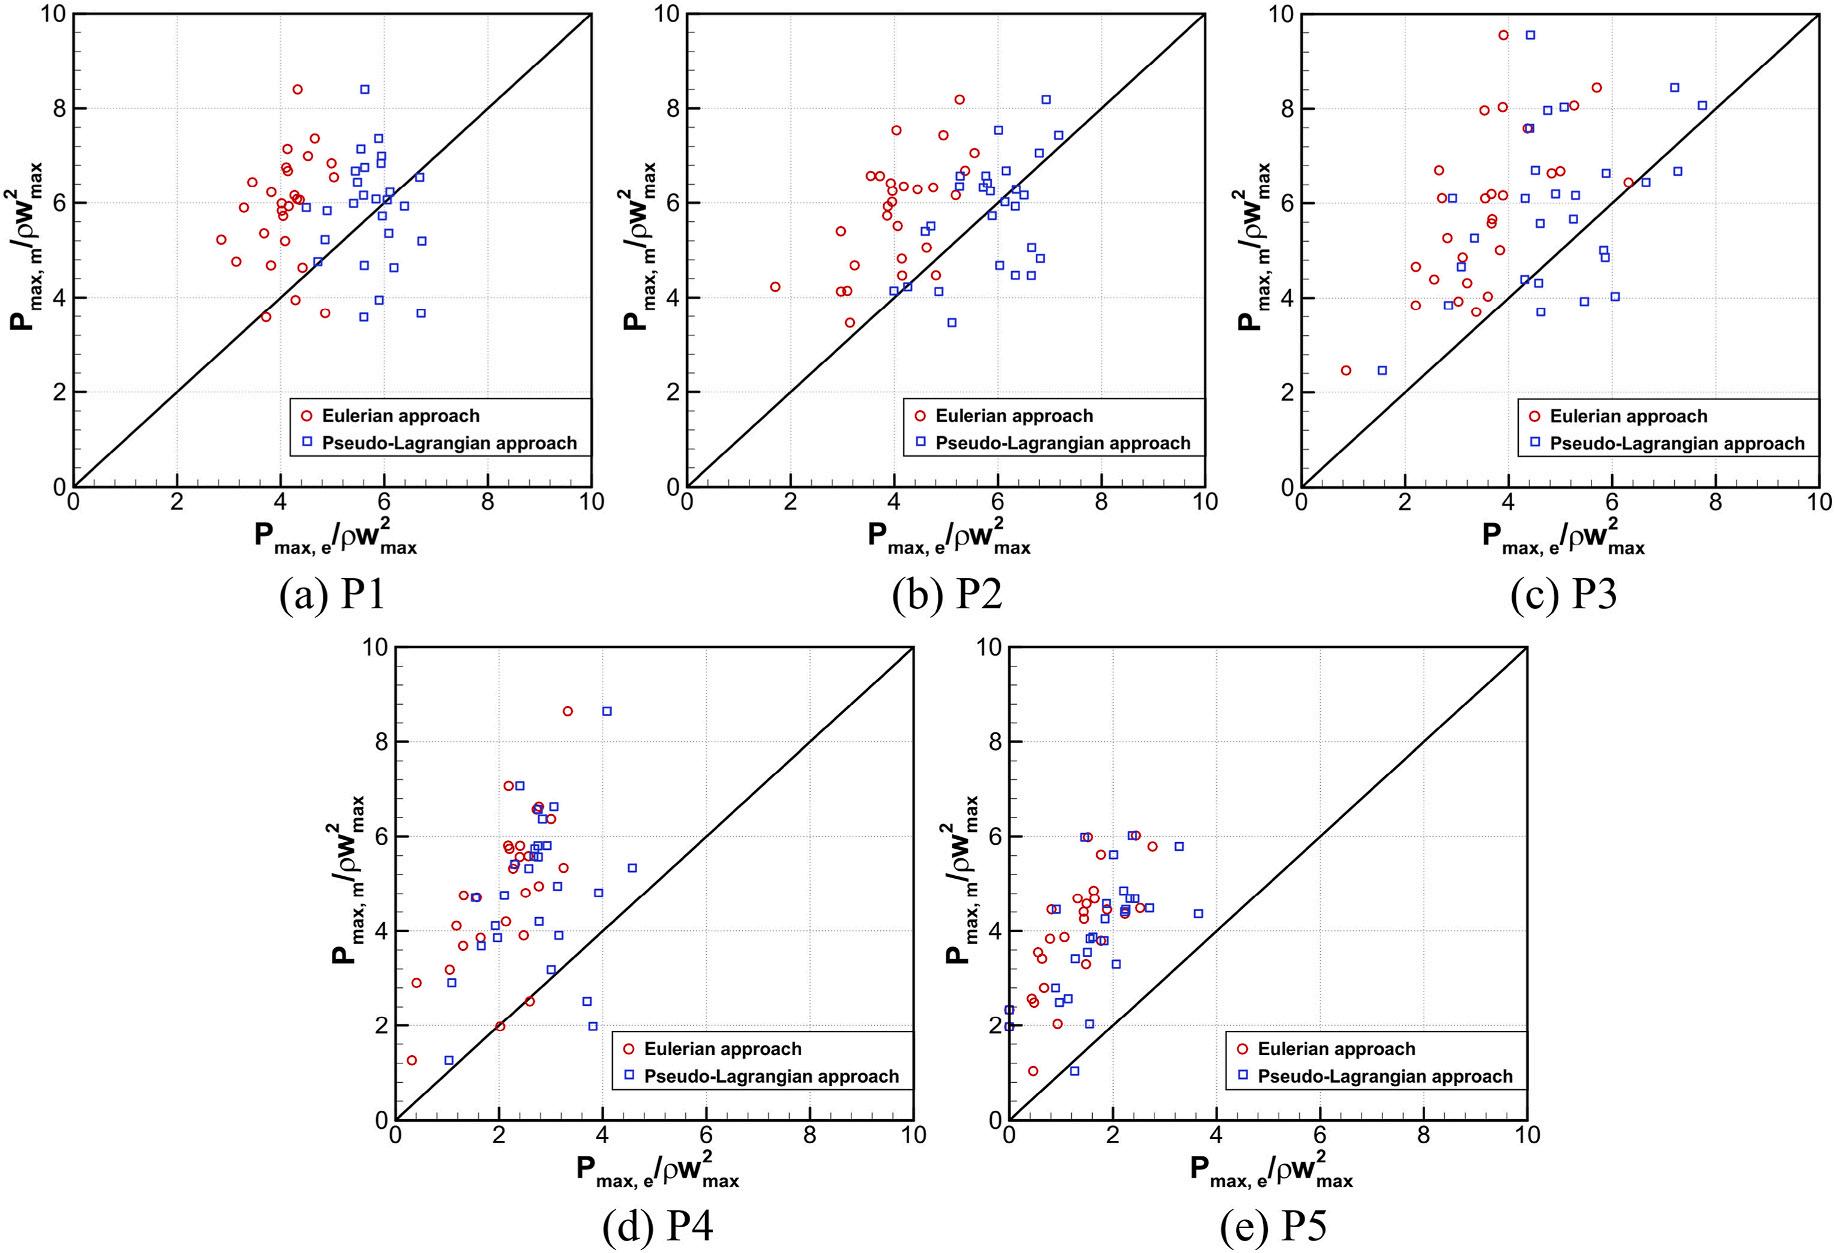
16. Comparison of the measured and estimated maximum pressures at each pressure sensor for all experimental conditions.
the level z/D = 0.1 for the vertical component. Additionally, the pressure sensor P5 experienced the smallest effect of the deck on acceleration, as shown in Figs. 13e and 14e.
The mean relative error (MRE) in Eq. (18) was calculated to assess the accuracy of the PIV-based method in the estimation of maximum pressures:
M j=1
where M represents the number of maximum pressures. Table 4 presents the MRE obtained from two approaches for each pressure sensor. Overall, the pseudo-Lagrangian approach produces fewer errors in
estimating maximum pressures than the Eulerian approach. Additionally, pressure sensors near the trailing edge experience larger errors than pressure sensors near the leading edge.
Figs. 15 and 16 compare maximum pressures estimated from PIV data with the measured pressure obtained from all and each pressure, respectively, for all experimental conditions. The scatter in maximum pressure estimation is large for both approaches. Most estimated values from the Eulerian approach fall within the upper part region in Figs. 15a and 16, indicating that the Eulerian approach underestimates the maximum pressure with an average MRE of 44.4%. By contrast, the pseudo-Lagrangian approach shows better maximum pressure estimation with estimated values falling around the straight line (Figs. 15b and 16a–c) and smaller average MRE values of 33.7%. This would be
Fig.
Fig.
4.3. Pressure fields and pressure distributions under the deck
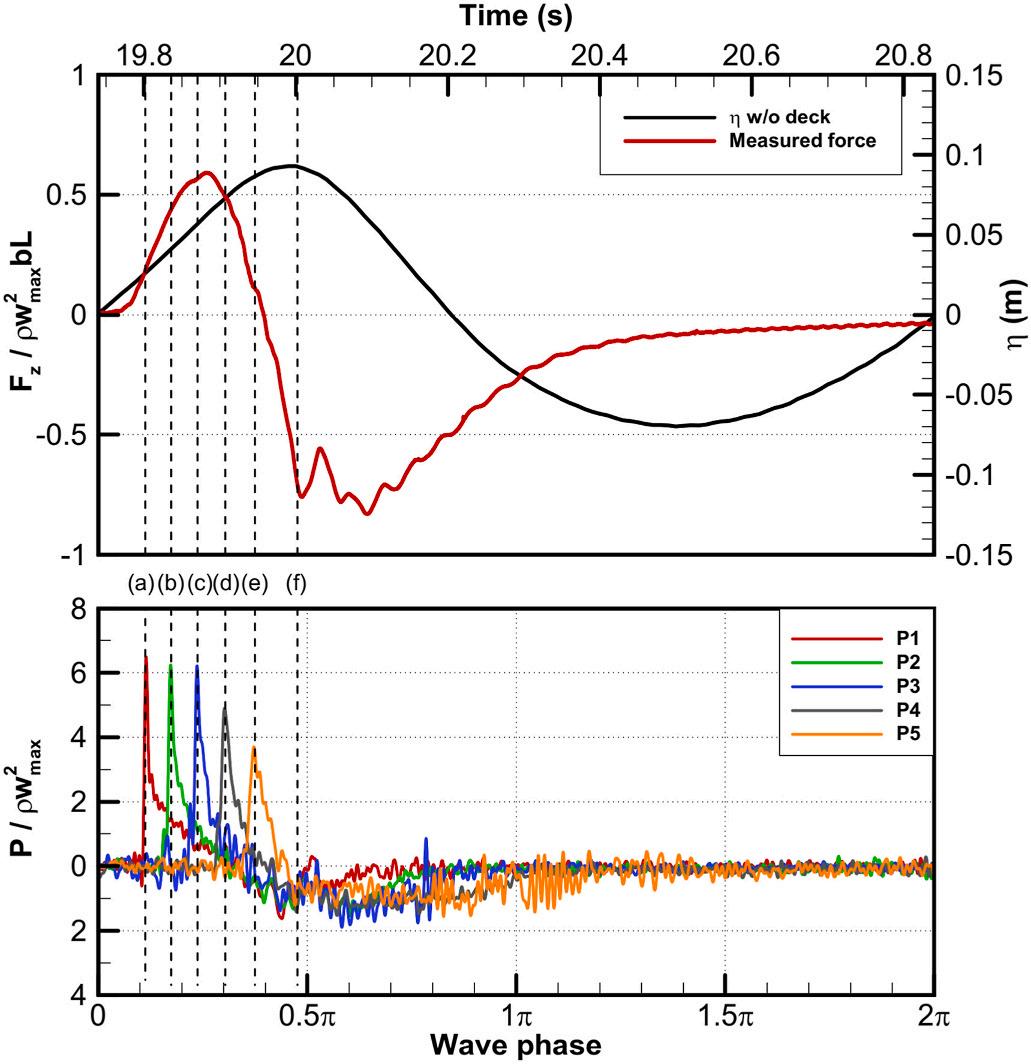
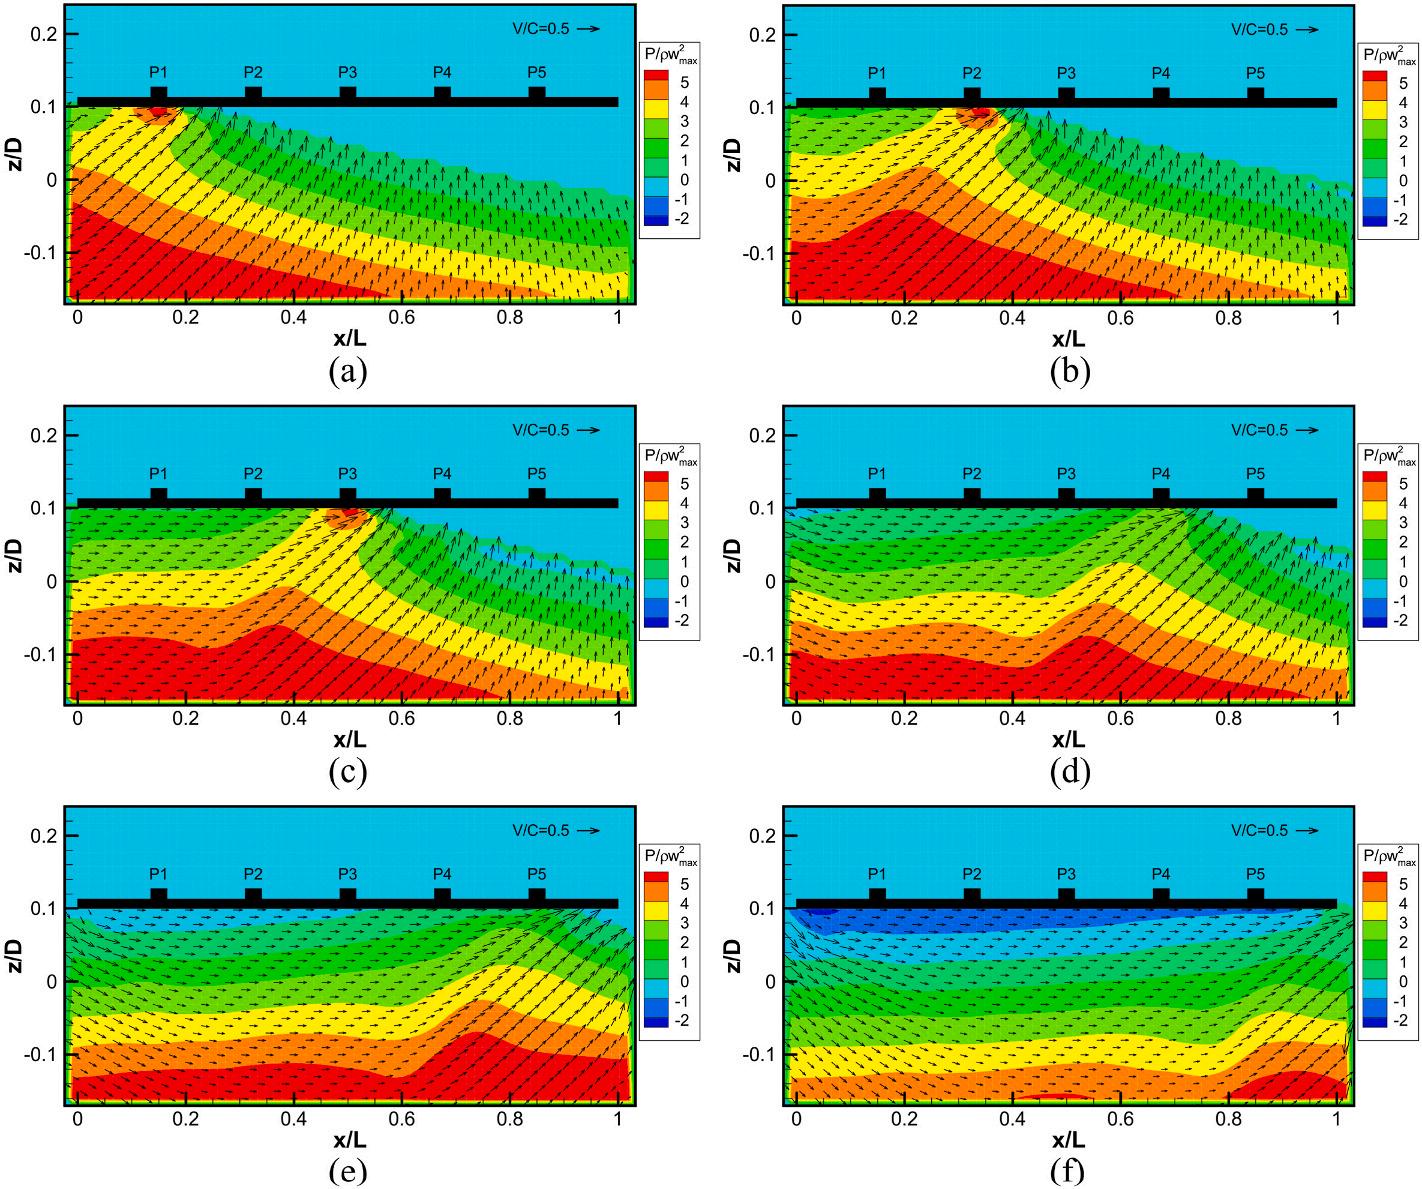
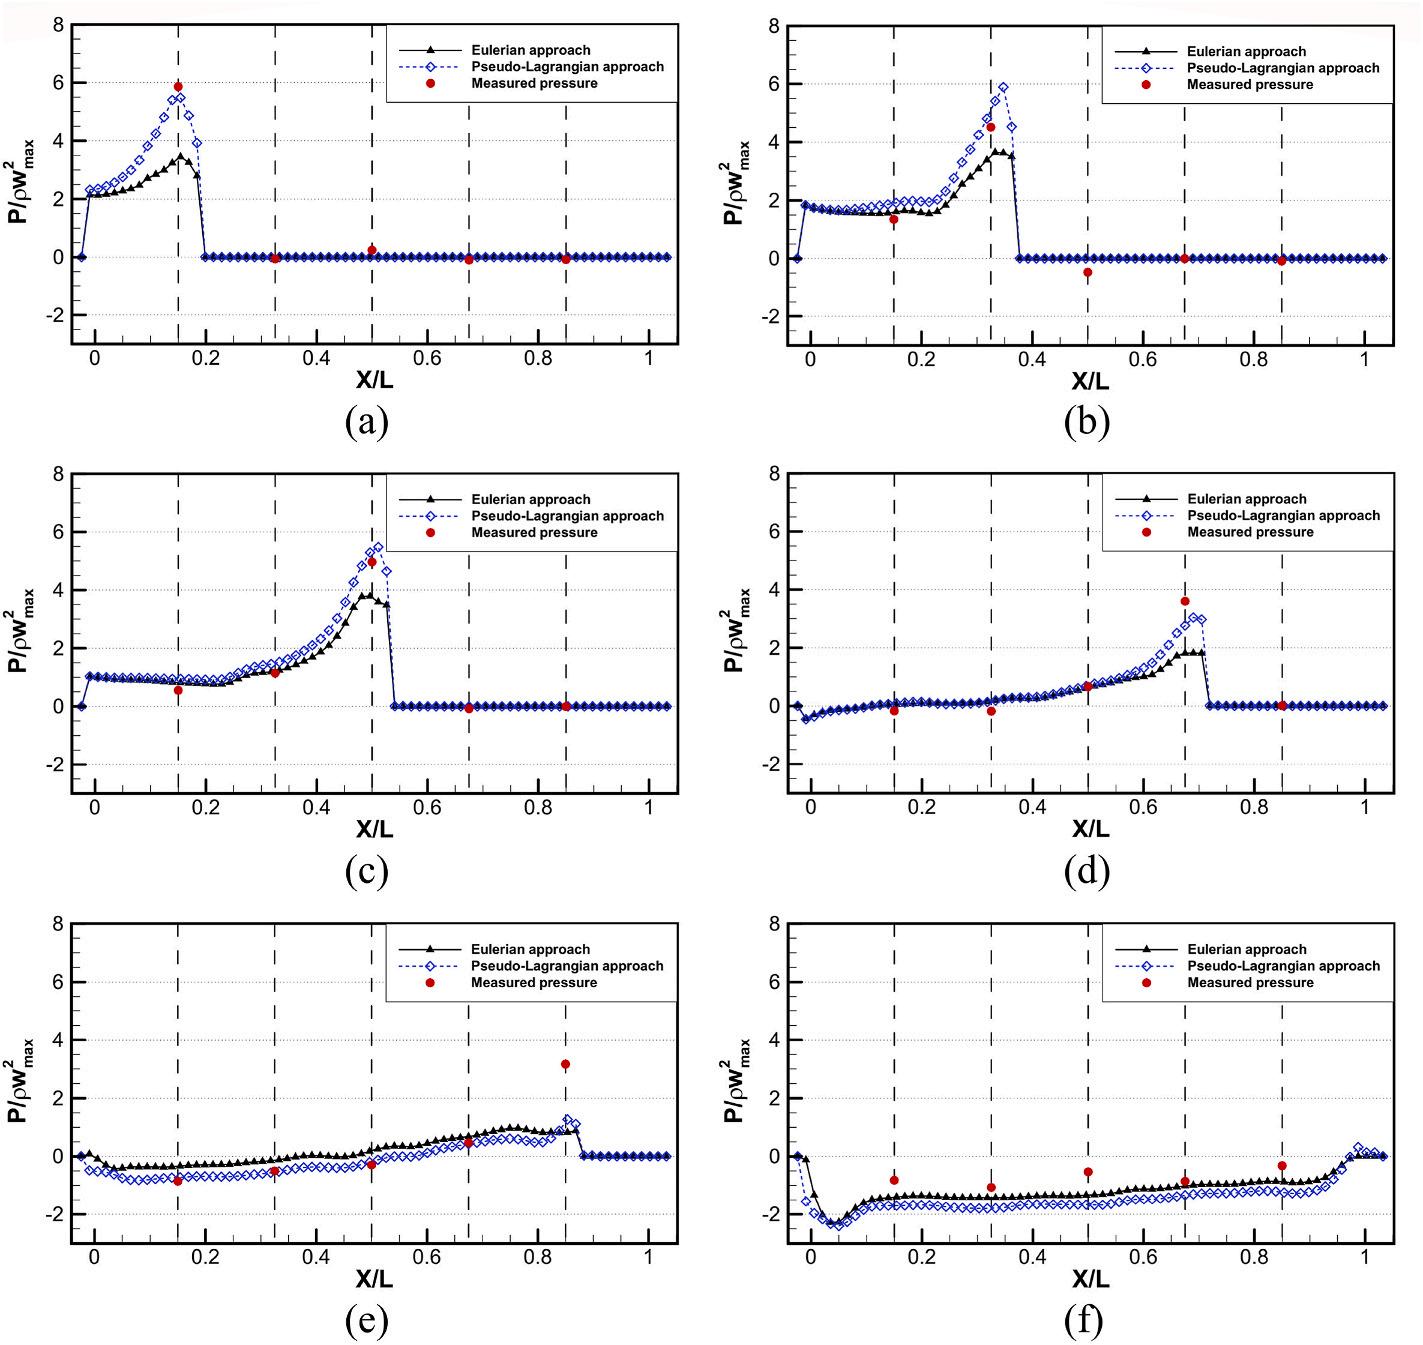
The instantaneous fluid pressure in the entire FOV could be reconstructed properly by the PIV-based pressure measurements, which would provide an insight into the nature of WID loading phenomena. Fig. 17 presents the time series of the measured vertical force, the measured pressures, and the elevation of the incident wave for experimental condition FW1-A. The vertical force was nondimensionalized by the term ρw2 max bL. Five vertical dashed lines (a)–(e) indicate five predominant phases corresponding to the maximum pressure that occurred at each pressure sensor, and the dashed line (f) represents the phase of the emergence of the leading edge. Fig. 18 shows the estimated pressure fields from the pseudo-Lagrangian approach and the corresponding velocity fields obtained at six phases in Fig. 17 The velocity vectors were nondimensionalized by the wave celerity C (1.663 m/s) estimated from the linear wave theory for the regular wave with a period of 1.1 s. Fig. 19 illustrates the distributions of the estimated pressure on the underside of the deck at six predominant phases, and the measured pressures are also plotted to reveal the accuracy of the pressure estimation. The pseudoLagrangian approach estimated the pressure distributions more accurately than the Eulerian approach at the position of the intersection point between the free surface and the deck.
attributed to the larger vertical material accelerations estimated by the pseudo-Lagrangian approach than those estimated by the Eulerian approach, as presented in Fig. 14
At phase (a), when the intersection point reached the position of the pressure sensor P1, the measured pressure rose quickly to a high peak value (Fig. 17), and a high-pressure region was created in the vicinity of the pressure sensor P1, as shown in Fig. 18a. Meanwhile, the distribution of the estimated pressure showed a peak at position P1 and reduced mildly toward the leading edge (Fig. 19a). The rapid rise in the fluid pressure was due to high material acceleration (Figs. 13a and 14a), which was caused by the sudden change in the water velocity direction from vertical to horizontal. Material acceleration components at this phase could be approximately 3 5g for the horizontal direction and 3 5g for the vertical direction, as presented in Figs. 13a and 14a, respectively. As shown in Fig. 18b–e and 19b–e, the behavior of the
Fig. 17. Time histories of wave elevation, vertical force, and pressures for the experimental condition FW1-A.
Fig. 18. Pressure fields and overlaid velocity vectors at six predominant phases estimated from the pseudo-Lagrangian approach for the experimental condition FW1-A.
pressure at the other phases was similar to that at phase (a). After the occurrence of the maximum pressure, the measured and estimated pressures decreased moderately to a negative value, creating a downward force acting under the deck at phase (f). The negative pressures at this phase distributed along the entire length of the deck as shown in Figs. 18f and 19f. This would attribute to the larger magnitude of the downward force compared to that of the upward force. Then, as the wave detached from the deck, the negative pressure increased steadily to the atmospheric pressure, and the magnitude of the downward force decreased.
The vertical force acting on the underside of the deck could be obtained by spatial integration of the estimated pressure distribution under the deck using Eq. (19): Fz (t ) =
(x, c, t)dx, (19)
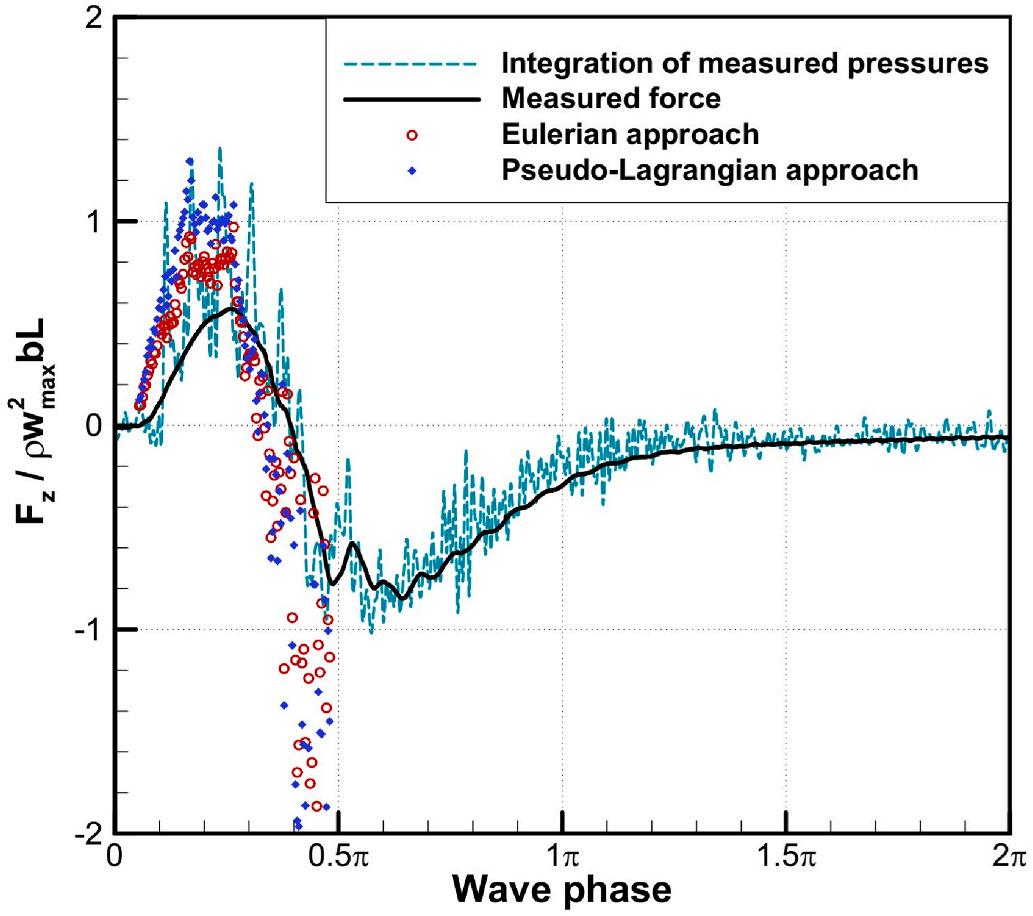
where Pe (x, c, t ) is the estimated pressures along the underside of the deck (at elevation c) at time instant t Additionally, the trapezoidal rule could be used to compute the vertical force from the measured pressures (Duong et al., 2021). Fig. 20 compares the time series of the measured force, the force obtained by the integration of the measured pressure, and the forces obtained using the PIV-based pressure estimation methods. In the water entry phase, which is indicated by the upward force, forces estimated using the PIV-based pressure estimation methods show a better agreement with the force obtained by integration of measured pressures, whereas the measured force is smaller than the forces obtained from the pressure integration because the weight of the water has overtopped the deck. In the water exit phase, the force obtained by integrating the measured pressures matches well with the measured force from the load cells, whereas the PIV-based pressure
Fig. 19. Pressure distributions along the underside of the deck at six predominant phases for the experimental condition FW1-A.
Fig. 20. Comparison between the measured, integrated, and estimated forces for the experimental condition FW1-A.
21. Time histories of the measured vertical force and pressures for the experimental condition FW3-A. (a) entire time series, (b) time series during the local maximums in downward force and negative pressure.
Fig. 22. Comparison between the measured and estimated pressures during the local maximum in the downward force.
Fig.
estimation methods overestimate the downward force. Note that in the water exit phase, the starting point A (Fig. 5) of the pressure gradient integration was near the trailing edge or/and the leading edge (Fig. 18f), with a larger error distribution, as shown in Fig. 8 Therefore, the PIV-based estimation methods overestimate the negative pressure (Fig. 19f) as well as the downward force acting on the underside of the deck.
4.4. Effect of the vortex beneath the leading edge on the downward force and pressure distributions
In the water exit process, a negative pressure region was created under the deck, called the suction effect (Sun et al., 2019), resulting in a downward force acting on the deck. The magnitude of this downward force could exceed the magnitude of the upward force developed in the water entry process, as shown in Fig. 20, and endanger the structural safety of the offshore platforms. A local maximum in the downward force was found in the experimental results proposed by Abdussamie
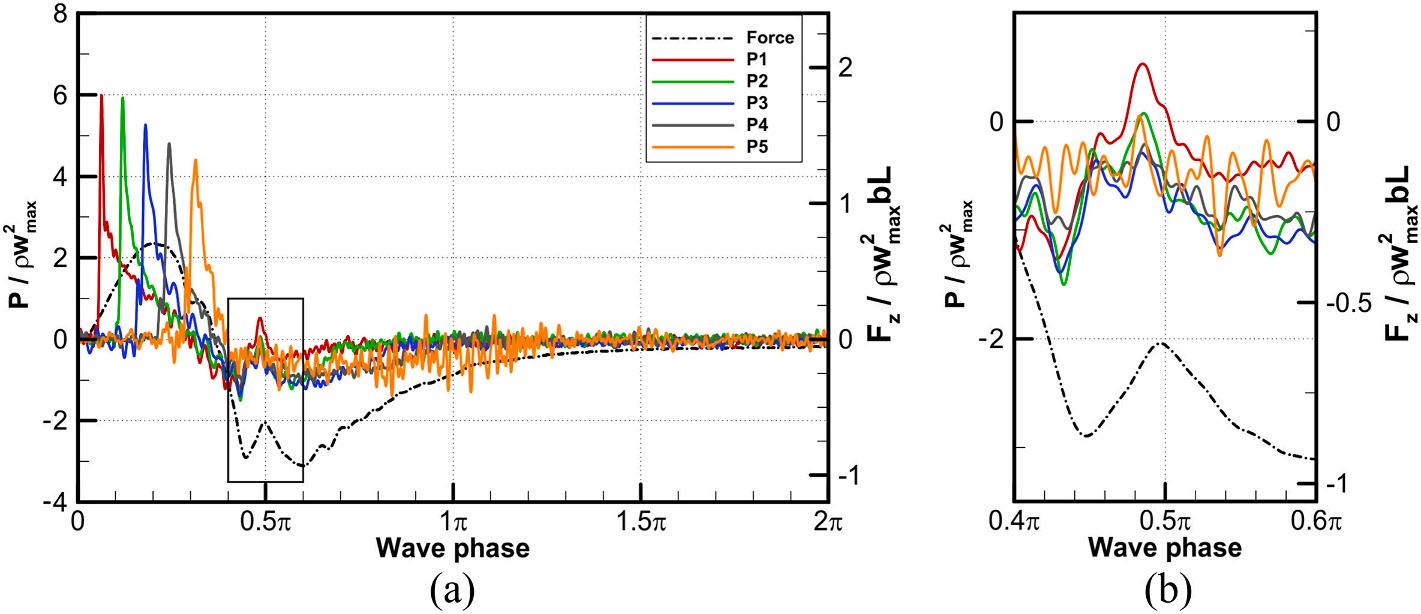
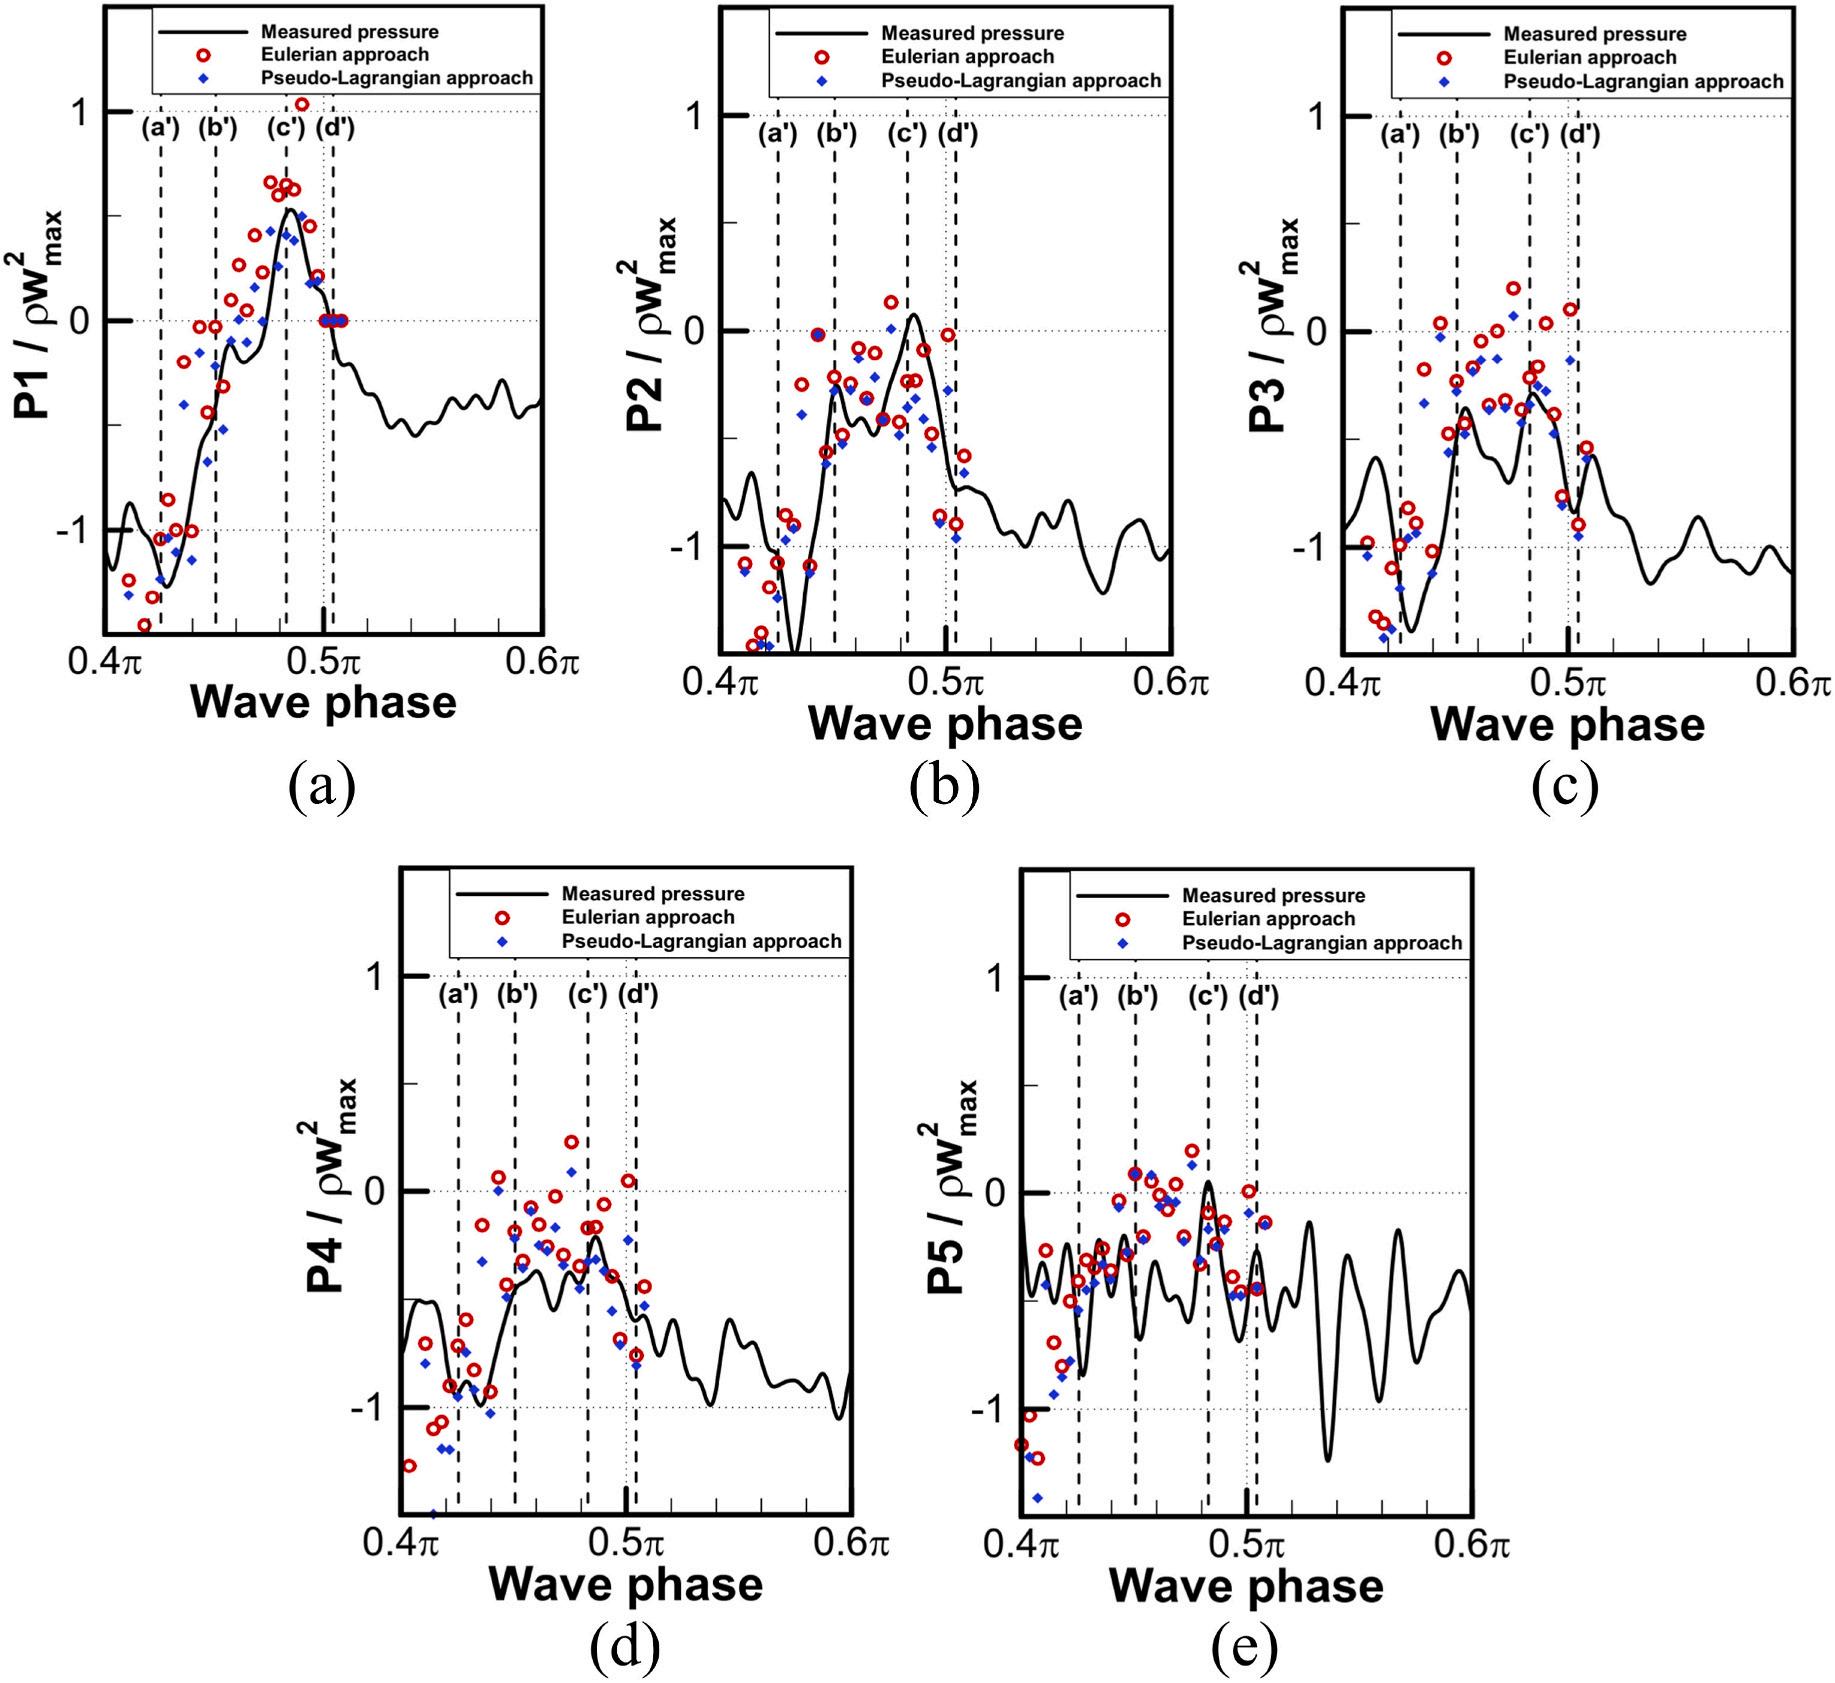
et al. (2014), Duong et al. (2019), and Santo et al. (2020), which was believed to be a common characteristic of the WID force (Santo et al., 2020). The same observation was obtained in our experiments. Fig. 21 presents the time series of the measured force and pressures for the experimental condition FW3-A (wmax = 0 53 m/s), and an enlarged view of the local maximums in the downward force and the measured pressures is shown in subfigure 21b. All pressures measured at the pressure sensors increased and reached a local peak at the same phase (0.4π), especially the pressure measured using the pressure sensor P1, which even increased significantly to a positive value. Then, all measured pressures decreased to negative values as the wave continued receding from the deck. Fig. 22 compares the estimated pressure from PIV data with the measured pressures at all pressure sensors during the local maximum duration. Both the Lagrangian and Eulerian approaches could accurately estimate the increasing trend in the pressure time series.
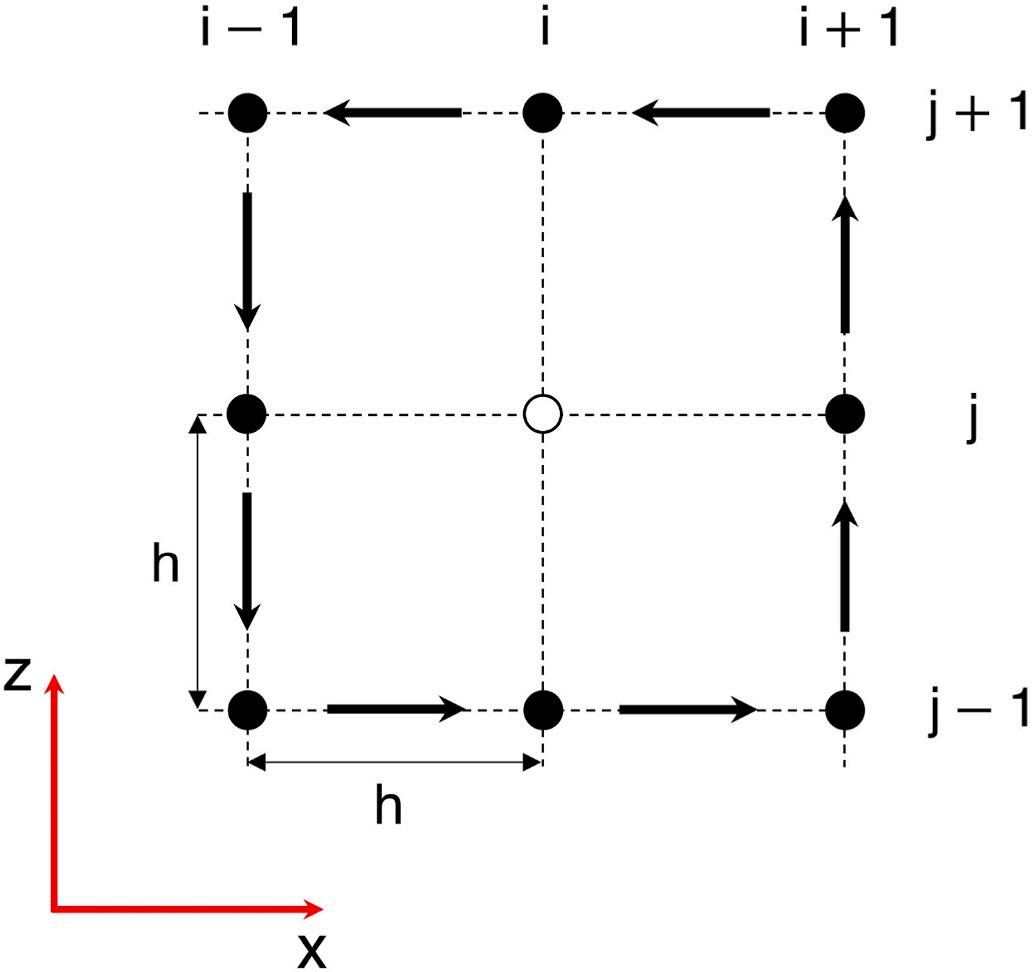
The vorticity Ω at a point (i, j) in Fig. 23 was computed from a circulation Γi,j estimated around the eight neighboring velocities obtained via the PIV measurement (Raffel et al., 2018):
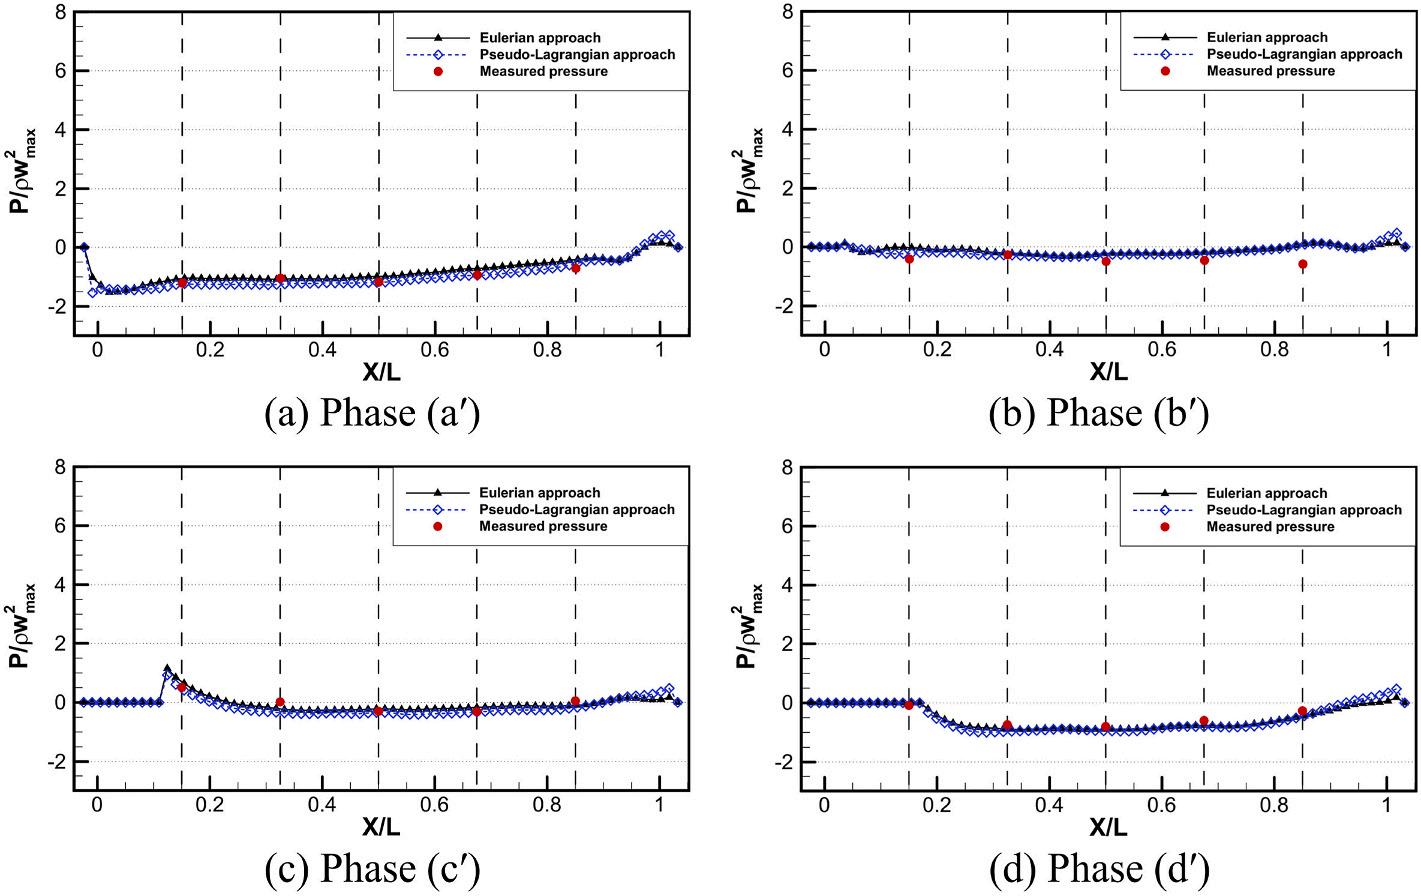
Figs. 24 and 25 show the vorticity fields and the pressure distribution under the deck, respectively, at four phases (a′ )–(d′ ), indicated by four vertical dashed lines in Fig. 22. At phase (a′ ), a strong positive vortex developed beneath the leading edge, as shown in Fig. 24a, and the negative pressures were distributed along the underside of the deck (Fig. 25a) and began to increase (Fig. 22). A strong vortex around the sharp corner of the deck was also obtained through SPH simulations by Sun et al. (2019) Then, the fluid pressure reached a local maximum at phase (c′ ) in Fig. 22, and the distribution of positive pressures near the pressure sensor P1 is seen in Fig. 25c. After phase (c′ ), the pressure under the deck decreased and became negative, as shown in Fig. 25d, and the vortex dissipated with flow separation around the corner of the deck, as shown in Fig. 24c and d. It could be concluded that the local maximums in the downward force, as well as the pressures time series, were the result of the vortex that occurred beneath the leading edge when the wave receded from the deck.
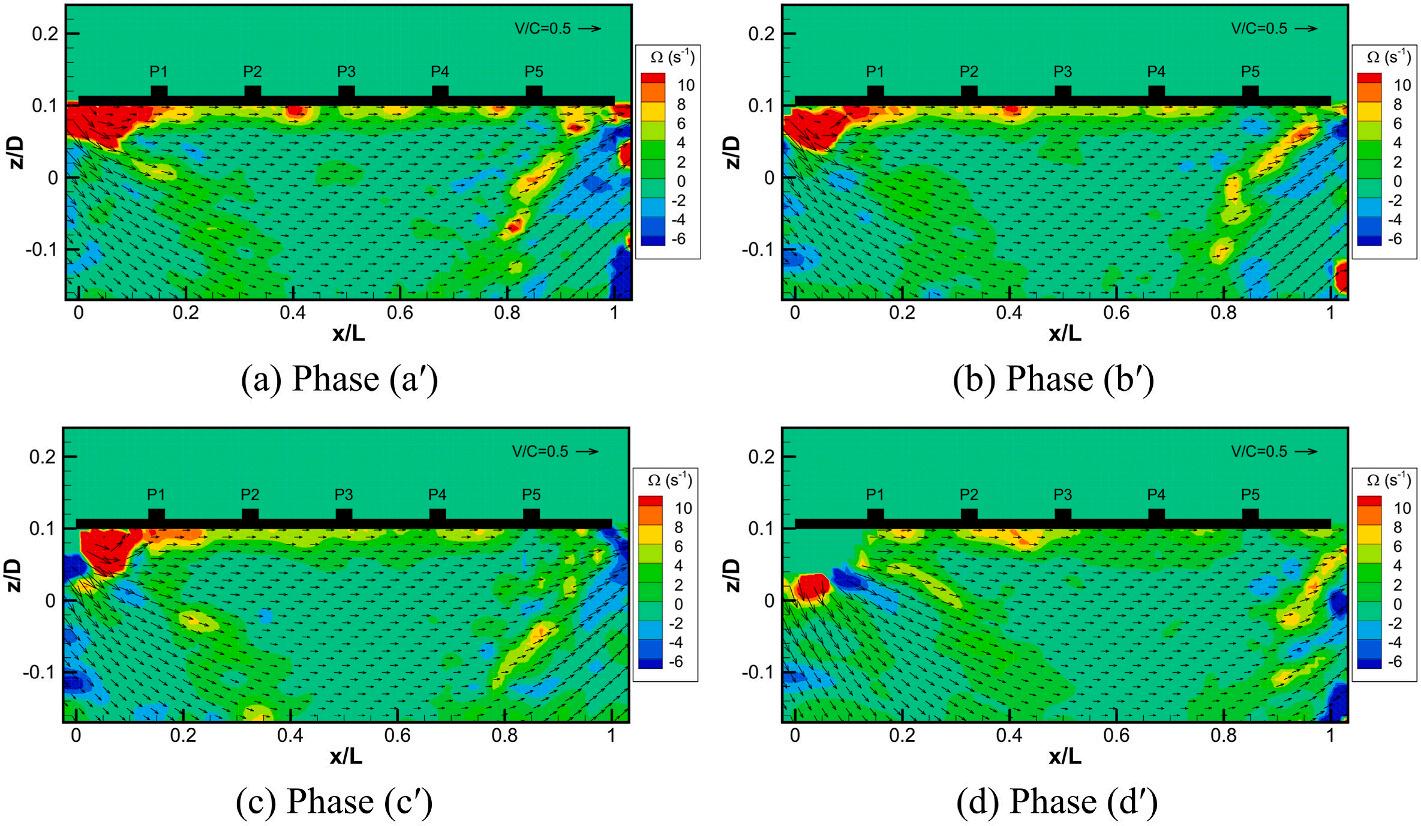
Fig. 23. Path integration for the vorticity calculation at point (i, j).
Fig. 24. Vorticity fields and overlaid velocity vectors at four phases (a′ )–(d′ ) during the local maximum in the downward force.
T.T.
5. Conclusions
In this study, PIV-based pressure estimation was used to obtain instantaneous fluid pressure fields of WID loading phenomena. Several experiments were conducted to measure the global force, local pressures, and PIV velocity maps under the deck subjected to focused waves. The Eulerian and pseudo-Lagrangian approaches were used to compute material acceleration and then pressure gradients from PIV data using Euler equation. Pressure gradients were subsequently integrated from a boundary condition set at the free surface to reconstruct the pressure in the entire FOV. Pressure gradient integration was performed with different integration paths, and resulting pressure fields were averaged to reduce the effect of the random error in the measured PIV data. The estimated pressures from PIV data were compared with the measured pressures using five pressure sensors to validate the accuracy of the pressure estimation method. The main conclusions are drawn as follows:
1. The error in pressure estimation was sensitive to the time interval Δt used in material acceleration determination. Through a proper selection of Δt , e.g., Δt = 0 02 s (Δt /Tzu = 0 018) in this study, an accurate estimation of pressure fields of WID loading could be achieved.
2. From the assessment of the NRMSE, the Eulerian approach produced a better estimation of the pressure time series than the pseudoLagrangian approach. However, the pseudo-Lagrangian approach produced fewer errors in the estimation of the maximum pressure as well as the distribution of high pressures along the underside of the deck.
3. The position of the starting point of pressure gradient integration significantly influenced the accuracy of pressure estimation. With the expansion of the wetted length along the deck, i.e., at the phase of submergence of the entire deck, the position of the starting point would be closer to the edges of the FOV, where more errors are distributed. This resulted in more errors being accumulated during pressure gradient integration. Therefore, the distribution of errors in the PIV data should be assessed, and the integration of pressure gradients across highly erroneous regions should be avoided.
4. The distributions of estimated pressures along the underside of the deck agreed well with the measured pressures. During the water entry process, a high-pressure region was created in the vicinity of the intersection point between the free surface and the deck, and the pressure was moderately reduced toward the leading edge.
5. The pressure estimation method could accurately predict the local maximums in the downward force and measured pressures during the water exit process. These local maximums would be the effect of the vortex beneath the leading edge on the fluid pressure.
The PIV-based pressure estimation method would be a reliable nonintrusive technique for determining instantaneous fluid pressures. With the advantage of determining pressure throughout the measurement field, this method could be applied to many aspects of fluid mechanics, especially in ocean engineering to estimate impulsive wave loads on offshore structures using PIV measurements with sufficiently high speed and high resolution. This method provides the ability to investigate the relation between the flow kinematics and the induced loads on the structures for a better insight in the nature of the loading. Additionally, the spatial distribution of the loads estimated from the PIV data could be used to improve the design of the offshore structures under hydrodynamic wave loads.
CRediT authorship contribution statement
Tien Trung Duong: Conceptualization, Methodology, Investigation, Visualization, Writing – original draft. Kwang Hyo Jung: Conceptualization, Methodology, Writing – review & editing, Supervision, Funding acquisition. Gang Nam Lee: Methodology, Investigation, Writing – review & editing. Hyung Joon Kim: Writing – review & editing. Sung Boo Park: Writing – review & editing. Seongyun Shin: Writing – review & editing. Jaeyong Lee: Writing – review & editing, Supervision. Sung Bu Suh: Writing – review & editing, Supervision.
Declaration of competing interest
The authors declare that they have no known competing financial interests or personal relationships that could have appeared to influence the work reported in this paper.
Acknowledgments
This work was supported by a 2-Year Research Grant of Pusan National University.
Fig. 25. Pressure distributions along the underside of the deck at four phases (a′ )–(d′ ) during the local maximum in the downward force.
Abdel Raheem, S.E., 2016. Nonlinear behavior of steel fixed offshore platform under environmental loads. Ships Offshore Struct. 11 (1), 1–15
Abdussamie, N., Thomas, G., Amin, W., Ojeda, R., 2014. Wave-in-deck forces on fixed horizontal decks of offshore platforms. In: Proceedings of the 33rd International Conference on Ocean, Offshore and Arctic Eng. ASME, San Francisco, California
Abdussamie, N.W., Ojeda, R., Thomas, G., Amin, 2017. Measurements of global and local effects of wave impact on a fixed platform deck. Proc. Inst. Mech. Eng. Part M - J Engineering for Marine Environment 231 (1), 212–233 API, 2014. API RP 2A-WSD–Planning, Designing, and Constructing Fixed Offshore Platforms Working Stress Design, twenty-second ed.
Baarholm, R., Faltinsen, O.M., 2004. Wave impact underneath horizontal decks. J. Mar. Sci. Technol. 9, 1–13
Baarholm, R., 2009. Experimental and theoretical study of three-dimensional effects on vertical wave-in-deck forces. In: Proceedings of the ASME 28th International Conference on Ocean, Offshore and Arctic Eng. ASME, Honolulu, Hawaii
Baur, T., Kongeter, J., 1999. PIV with high temporal resolution for the determination of local pressure reductions from coherent turbulent phenomena. In: Proceedings of the 3rd International Workshop on Particle Image Velocimetry. University of California, pp. 101–106. Santa Barbara, USA
Broughton, P., Horn, E., 1987. Ekofisk platform 2/4C: re-analysis due to subsidence. Proc. Inst. Civ. Eng. 1 (82), 949–979
Cuomo, G., Tirindelli, M., Allsop, W., 2007. Wave-in-deck loads on exposed jetties. Coast. Eng. 54 (9), 657–679.
Duong, T.T., Jung, K.H., Lee, G.N., Kim, D.S., Suh, S.B., Kim, M.S., 2019. Experimental study on wave impact under deck due to regular waves. J. Coast Res. 91 (sp1), 81–85
Duong, T.T., Jung, K.H., Lee, G.N., Park, H.J., Lee, J., Suh, S.B., 2021. Experimental study on wave-in-deck loading under focused wave conditions. Ocean. Eng. 242, 110416
Energo Engineering, 2010. Assessment of Damage and Failure Mechanisms for Offshore Structures and Pipelines in Hurricanes Gustav and Ike. Report to MMS by Energo Engineering, Inc. TAR No. 642
Fang, Q., Liu, J., Hong, R., Guo, A., Li, H., 2021. Experimental investigation of focused wave action on coastal bridges with box girder. Coast. Eng. 165, 103857
Isaacson, M., Bhat, S., 1996. Wave forces on a horizontal plate. Int. J. Offshore Polar Eng. 6, 19–26
Jacobi, G., Thill, C.H., van’t Veer, R., Huijsmans, R.H.M., 2019. Analysis of the influence of an interceptor on the transom flow of a fast ship by pressure reconstruction from stereoscopic scanning PIV. Ocean. Eng. 181, 281–292
Jensen, A., Pedersen, G.K., 2004. Optimization of acceleration measurements using PIV. Meas. Sci. Technol. 15, 2275–2283
Jeon, Y.J., Gomit, G., Earl, T., Chatellier, L., David, L., 2018. Sequential least-square reconstruction of instantaneous pressure field around a body from TR-PIV. Exp. Fluid 59, 27
Kaplan, P., 1992. Wave impact forces on offshore structures: reexamination and new interpretations. In: Proceedings of the 24th Offshore Technology Conference, pp. 79–86. Houston, Texas, paper 6814.
Kim, M., Jung, K.H., Park, S.B., Lee, G.N., Duong, T.T., Suh, S.B., Park, I.R., 2020. Experimental and numerical estimation on roll damping and pressure on a 2-D rectangular structure in free roll decay test. Ocean. Eng. 196, 106801
Lee, G.N., Duong, T.T., Jung, K.H., Suh, S.B., Lee, J.Y., 2020a. Study on PIV-based pressure estimation method of wave loading under a fixed deck. J. Ocean Eng. Technol. 34 (6), 419–427
Lee, G.N., Jung, K.H., Malenica, S., Chung, Y.S., Suh, S.B., Kim, M.S., Choi, Y.H., 2020b. Experimental study on flow kinematics and pressure distribution of green water on a rectangular structure. Ocean. Eng. 195 (1)
Liu, X., Katz, J., 2006. Instantaneous pressure and material acceleration measurements using a four-exposure PIV system. Exp. Fluid 41, 227–240
Myrhaug, D., Kjeldsen, S.P., 1986. Steepness and asymmetry of extreme waves and the highest waves in deep water. Ocean. Eng. 13 (6), 549–568
Murray, J.J., Winsor, F.N., Kaplan, P., 1997. Impact forces on a jacket deck in regular waves and irregular wave groups. In: Proceedings of the 24th Offshore Technology Conference, pp. 45–54. Houston, Texas, paper 8360
Nila, A., Vanlanduit, S., Vepa, S., Van Paepegen, W., 2013. A PIV-based method for estimating slamming loads during water entry of rigid bodies. Meas. Sci. Technol. 24, 045303
Novara, M., Scarano, F., 2013. A particle-tracking approach for accurate material derivative measurements with tomographic PIV. Exp. Fluid 54, 1584
Panciroli, R., Porfiri, M., 2013. Evaluation of the pressure field on a rigid body entering a quiescent fluid through particle image velocimetry. Exp. Fluid 54 (13), 1630
Press, W.H., Teukolsky, S.A., Vetterling, W.T., Flannery, B.P., 2007. Numerical Recipes in C: the Art of Scientific Computing, third ed. Cambridge University Press, New York, pp. 132–134
Qin, H., Tang, W., Xue, H., Hu, Z., 2017. Numerical study of nonlinear freak wave impact underneath a fixed horizontal deck in 2-D space. Appl. Ocean Res. 64, 155–168
Raffel, M., Willert, C.E., Scarano, F., Kahler, C.J., Wereley, S.T., Kompenhans, J., 2018. Particle Image Velocimetry: a Practical Guide, third ed. Springer, Berlin
Santo, H., Taylor, P.H., Dai, S.S., Day, A.H., Chan, E.S., 2020. Wave-in-deck experiments with focused waves into a solid deck. J. Fluid Struct. 98, 103139
Scharnke, J., Vestbøstad, T., de Wilde, J., Haver, S., 2014. Wave-in-deck impact load measurements on a fixed platform deck. In: Proceedings of the ASME 33rd International Conference on Ocean. Offshore and Arctic Eng. ASME, San Francisco, California
Schellin, T.E., Peri´ c, M., Moctar, O.e., 2011. Wave-in-deck load analysis for a jack-up platform. J. Offshore Mech. Arctic Eng. 133 (2), 021303.
Shams, A., Jalalisendi, M., Porfiri, M., 2015. Experiments on the water entry of asymmetric wedges using particle image velocimetry. Phys. Fluids 27, 027103
She, W., Zhou, G., Guo, C., Wu, T., Song, K., 2021. Experimental investigation on the water entry of a bulbous bow based on TR-PIV. Ocean. Eng. 229, 108977
Sun, P.N., Luo, M., Touze, D.L., Zhang, A.M., 2019. The suction effect during freak wave slamming on a fixed platform deck: smoothed particle hydrodynamics simulation and experimental study. Phys. Fluids 31, 117108
Theunissen, R., Scarano, F., Riethmuller, M.L., 2007. An adaptive sampling and windowing interrogation method in PIV. Meas. Sci. Technol. 18 (1), 275–287
van Oudheusden, B.W., 2013. PIV-based pressure measurement. Meas. Sci. Technol. 24 (3), 032001
Wen, B.H., Qu, K., Lan, G.Y., Sun, W.Y., Yao, Y., Deng, B., Jiang, C.B., 2021. Numerical study on hydrodynamic characteristics of coastal bridge deck under joint action of regular waves and wind. Ocean. Eng. 245, 110450
Westerweel, J., 1994. Efficient detection of spurious vectors in particle image velocimetry data. Exp. Fluid 16 (3–4), 236–247
Zhang, J., Bhattacharya, S., Vlachos, P.P., 2020. Using uncertainty to improve pressure field reconstruction from PIV/PTV flow measurements. Exp. Fluid 61, 131
Other documents randomly have different content
We also find philosophers now-a-days calmly discussing a question which most people considered settled very long ago, namely, whether blue and yellow together really make green.
It is of no use for the artist to lift up his eyes with astonishment at any one being so insane as to question so generally admitted a statement. In vain does he point to his pictures, in which his greens have been actually so produced. The strict photologist at once puts him down, by informing him that he knows little or nothing of the real state of the case: his (the artist’s) colours are negative, or hues of more or less complete darkness; whereas in nature, the colour question is to be decided by positive colours, or hues in which all the light used is of one kind. The meaning of this will be best understood by an example: When a ray of white light falls on a green leaf, part of the ray is absorbed and part reflected, and the object is therefore only seen with the part that is reflected. That which is absorbed consists of some of each of the colour rays, and the resulting reflected light is nothing more than a mixture of what remains after this partial absorption. The green we see consists of the original white light deprived of a portion of its rays. It is not a pure and absolute green, but only a residual group of coloured rays, and thus in so far the green colour is negative, or consists of rays not absorbed. It is therefore partial darkness, and not absolute light. If, however, on the other hand, a ray of white light is passed through a transparent medium (e. g. some chemical salt) which has the property of entirely absorbing all but one or more of the colour rays, and no part of the remainder, then all the light that passes through this medium is of the one colour, or a mixture of the several colours that pass: and if such light is thrown on a white ground, the reflected colour will be positive, and not negative, and is far purer as well as brighter than the colour obtained in the other way. It has been found by actual experiment, that when positive blue, thus obtained, is thrown on positive yellow, the resulting reflected colour bears no resemblance to green. Sir John Herschel considers, that whether green is a primitive colour—in other words, whether we really have three or four primitive colours—remains yet an open question.
It was necessary to explain these matters about colour before directly referring to the subject of this paper, namely, blindness to certain colour rays. It should also be clearly understood that the persons subject to this peculiar condition of vision have not necessarily any mechanical or optical defect in the eye as an optical instrument, which may be strong or weak, long-sighted or shortsighted, quite independently of it. Colour blindness does not in any way interfere with the ordinary requirements of vision, nor is there the smallest reason to imagine that it can get worse by neglect, or admit of any improvement by education or treatment.
Assuming that persons of ordinary vision see three simple colours, red, yellow, and blue, and that all the rest of the colours are mixtures of these with each other and with white light, let us try to picture to ourselves what must be the visual condition of a person who is unable to recognize certain rays; and as it appears that there is but one kind of colour-blindness known, we will assume that the person is unable to recognize those rays of white light which consist of pure red and nothing else. In other words, let us investigate the sensations of a person blind so far only as pure red is concerned.
All visible objects either reflect the same kind of light as that which falls on them, absorbing part and reflecting the rest, or else they absorb more of some colour rays than others, and reflect only a negative tint, made up of a mixture of all the colour-rays not absorbed. To a colour-blind person, the mixed light, as it proceeds from the sun, is probably white, as seen by those having perfect vision; for, as we have explained already, positive blue and yellow (the colour rays when red is excluded) do not make green, and the absence of the red ray is likely to produce only a slight darkening effect. So far, then, there is no difference. But how must it be with regard to colour.
Bearing in mind what has been said above, it is evident that in withdrawing the red rays from the spectrum, we affect all the colours. The orange is no longer red and yellow, but darkened yellow; the yellow is purer, the green is quite distinct, the blue purer, and the indigo and violet no longer red and blue, but blue mingled with more or less of darkness, the violet being the darkest, as containing least
blue in proportion to red, while the red part itself, though not seen as a colour, is not absolutely black, inasmuch as its part of the spectrum is faintly coloured with the few mixed rays of blue and yellow and white that escape from their proper place. The red then ought to be seen as a gray neutral tint, the orange a dingy yellow, the indigo a dirty indigo, and the violet a sickly, disagreeable tint of pale blue, darkened considerably with black and gray.
Next let us take the case of an intelligent person affected with colour blindness, but who is not yet aware of the fact. He has been taught from childhood that certain shades, some darker and some brighter, but all of neutral tint, and not really presenting to him colour at all, are to be called by various names—scarlet, crimson, pale red, dark red, bright red, dark green, dark purple, brown, and others. With all these he can only associate an idea of gray; nor can he possibly know that any one else sees more than he does. Having been taught the names they are called by, he remembers the names, with more or less accuracy, and thus passes muster. There is a real difference of tint, because each of these colours consists of more or less blue, yellow, and white, mixed with the red; and our friend is enabled to recognize and name them, more or less correctly, according to his acuteness of perception and accuracy of memory.
If we desire to experiment on such a person, we must ask no names whatever, but simply place before him a number of similar objects differently coloured. Taking, for example, skeins of coloured wools, let us select a complete series of shades of tint, from red, through yellow, green, and blue, to violet, and request him to arrange them as well as he is able, placing the darkest shades first, and putting those tints together that are most like each other It is curious then to watch the progress of the arrangement. In a case lately tried by the writer of this article, the colour-blind person first threw aside at once a particular shade of pale green as undoubted white, and then several dark blues, dark reds, dark greens, and browns, were put together as black. The yellows and pure blues were placed correctly, as far as name was concerned, by arranging several shades in order of brightness—but the order was very different from that which
another person would have selected. The greens were grouped, some with yellows, and some with blues.
The colours in this experiment were all negative and impure, but we may also obtain something like the same result with positive colour, transmitted by the aid of polarized light through plates of mica. In a case of this kind described by Sir J. Herschel, the only colours seen were blue and yellow, while pale pinks and greens were regarded as cloudy white, fine pink as very pale blue, and crimson as blue; white red, ruddy pink, and brick red were all yellows, and fine pink blue, with much yellow. Dark shades of red, blue, or brown, were considered as merely dark, no colour being recognized.
The account of Dr. Dalton’s own peculiarity of vision by himself, offers considerable interest. He says, speaking of flowers: “With respect to colours that were white, yellow, or green, I readily assented to the appropriate term; blue, purple, pink, and crimson appeared rather less distinguishable, being, according to my idea, all referable to blue. I have often seriously asked a person whether a flower was blue or pink, but was generally considered to be in jest.” He goes on further to say, as the result of his experience: “1st. In the solar spectrum three colours appear, yellow, blue, and purple. The two former make a contrast; the two latter seem to differ more in degree than in kind. 2nd. Pink appears by daylight to be sky-blue a little faded; by candlelight it assumes an orange or yellowish appearance, which forms a strong contrast to blue. 3rd. Crimson appears muddy blue by day, and crimson woollen yarn is much the same as dark blue. 4th. Red and scarlet have a more vivid and flaming appearance by candlelight than by daylight” (owing probably to the quantity of yellow light thrown upon them).
As anecdotes concerning this curious defect of colour vision, we may quote also the following: “All crimsons appeared to me (Dr. Dalton) to be chiefly of dark blue, but many of them have a strong tinge of dark brown. I have seen specimens of crimson claret and mud which were very nearly alike. Crimson has a grave appearance, being the reverse of every showy or splendid colour.” Again: “The colour of a florid complexion appears to me that of a dull, opaque,
blackish blue upon a white ground. Dilute black ink upon white paper gives a colour much resembling that of a florid complexion. It has no resemblance to the colour of blood.” We have a detailed account of the case of a young Swiss, who did not perceive any great difference between the colour of the leaf and that of the ripe fruit of the cherry, and who confounded the colour of a sea-green paper with the scarlet of a riband placed close to it. The flower of the rose seemed to him greenish blue, and the ash gray colour of quick-lime light green. On a very careful comparison of polarized light by the same individual, the blue, white, and yellow were seen correctly, but the purple, lilac, and brown were confounded with red and blue. There was in this case a remarkable difference noticed according to the nature and quantity of light employed; and as the lad seemed a remarkably favourable example of the defect, the following curious experiment was tried. A human head was painted, and shown to the colour-blind person, the hair and eyebrows being white, the flesh brownish, the lips and cheeks green. When asked what he thought of this head? the reply was, that it appeared natural, but that the hair was covered with a nearly white cap, and the carnation of the cheeks was that of a person heated by a long walk.
There is an interesting account in the Philosophical Transactions for 1859 (p. 325), which well illustrates the ideas entertained by persons in this condition with regard to their own state. The author, Mr. W. Pole, a well-known civil engineer, thus describes his case:—“I was about eight years old when the mistaking of a piece of red cloth for a green leaf betrayed the existence of some peculiarity in my ideas of colour; and as I grew older, continued errors of a similar kind led my friends to suspect that my eyesight was defective; but I myself could not comprehend this, insisting that I saw colours clearly enough, and only mistook their names.
“I was articled to a civil engineer, and had to go through many years’ practice in making drawings of the kind connected with this profession. These are frequently coloured, and I recollect often being obliged to ask in copying a drawing what colours I ought to use; but these difficulties left no permanent impression, and up to a mature age I had no suspicion that my vision was different from that of other
people. I frequently made mistakes, and noticed many circumstances in regard to colours, which temporarily perplexed me. I recollect, in particular, having wondered why the beautiful rose light of sunset on the Alps, which threw my friends into raptures, seemed all a delusion to me. I still, however, adhered to my first opinion, that I was only at fault in regard to the names of colours, and not as to the ideas of them; and this opinion was strengthened by observing that the persons who were attempting to point out my mistakes, often disputed among themselves as to what certain hues of colour ought to be called.” Mr Pole adds that he was nearly thirty years of age when a glaring blunder obliged him to investigate his case closely, and led to the conclusion that he was really colour-blind.
All colour-blind persons do not seem to make exactly the same mistakes, or see colours in the same way; and there are, no doubt, many minor defects in appreciating, remembering, or comparing colours which are sufficiently common, and which may be superadded to the true defect—that of the optic nerve being insensible to the stimulus of pure red light. It has been asserted by Dr. Wilson, the author of an elaborate work on the subject, that as large a proportion as one person in every eighteen is colour-blind in some marked degree, and that one in every fifty-five confounds red with green. Certainly the number is large, for every inquiry brings out several cases; but, as Sir John Herschel remarks, were the average anything like this, it seems inconceivable that the existence of the defect should not be one of vulgar notoriety, or that it should strike almost all uneducated persons, when told of it, as something approaching to absurdity. He also remarks, that if one soldier out of every fifty-five was unable to distinguish a scarlet coat from green grass, the result would involve grave inconveniences that must have attracted notice. Perhaps the fact that a difference of tint is recognized, although the eye of the colour-blind person does not appreciate any difference of colour, when red, green, and other colours are compared together, and that every one is educated to call certain things by certain names, whether he understands the true meaning of the name or not, may help to explain both the slowness of the defective sight to discover its own peculiarity, and
the unwillingness of the person of ordinary vision to admit that his neighbour really does not see as red what he agrees to call red.
There is, however, another consideration that this curious subject leads to. It is known that out of every 10,000 rays issuing from the sun, and penetrating space at the calculated rate of 200,000 miles in each second of time, about one-fifth part is altogether lost and absorbed in passing through the atmosphere, and never reaches the outer envelope of the human eye. It is also known that of the rays that proceed from the sun, some produce light, some heat, and some a peculiar kind of chemical action to which the marvels of photography are due. Of these only the light rays are appreciated specially by the eye, although the others are certainly quite as important in preserving life and carrying on the business of the world. Who can tell whether, in addition to the rays of coloured light that together form a beam of white light, four-fifths of which only pass through the atmosphere, there may not have emanated from the sun other rays altogether absorbed and lost? or whether in entering the human eye, or being received on the retina at the back of the eye, or made sensitive by the optic nerve, there may not have been losses and absorptions sufficient to shut out from us, who enjoy what we call perfect vision, some other sources of information. How, in a word, do we who see clearly only three or four colours, and their various combinations, together with their combined white light—how do we know that to beings otherwise organized, the heat, or chemical rays, or others we are not aware of, may not give distinct optical impressions? We may meet one person whose sense of hearing is sufficiently acute to enable him to hear plainly the shrill night-cry of the bat, often totally inaudible, while his friend and daily companion cannot perhaps distinguish the noise of the grasshopper, or the croaking of frogs, and yet neither of these differs sufficiently from the generality of mankind to attract attention, and both may pass through life without finding out their differences in organization, or knowing that the sense of hearing of either is peculiar. So undoubtedly it is with light. There may be some endowed with visual powers extraordinarily acute, seeing clearly what is generally altogether invisible; and this may have reference to light generally, or to any of the various parts of which a complete sunbeam is
composed. Such persons may habitually see what few others ever see, and yet be altogether unaware of their powers, as the rest of the world would be of their own deficiency.
The case of the colour-blind person is the converse. He sees, it is true, no green in the fields, or on the trees, no shade of pink mantling in the countenance, no brilliant scarlet in the geranium flower, but still he talks of these things as if he saw them, and he believes he does see them, until by a long process of investigation he finds out that the idea he receives from them is very different from that received by his fellows. He often, however, lives on for years, and many have certainly lived out their lives without guessing at their deficiency.
These results of physical defects of certain kinds remaining totally unknown, either to the subject of them or his friends, even when all are educated and intelligent, are certainly very curious; but it will readily be seen that they are inevitable in the present development of our faculties. In almost everything, whether moral or intellectual, we measure our fellows by our own standard. He whose faculties are powerful, and whose intellect is clear, looks over the cloud that hovers over lower natures, and wonders why they, too, will not see truth and right as he sees them. Those, on the other hand, who dwell below among the mists of error and the trammels of prejudice, will not believe that their neighbour, intellectually loftier, sees clearly over the fog and malaria of their daily atmosphere.
In taking leave of the question of colour blindness, it should be mentioned that hitherto no case has been recorded in which this defect extends to any other ray than the red.
There seems no reason for this, and possibly, if they were looked for, cases might be found in which the insensibility of the optic nerve had reference to the blue instead of the red ray—the least instead of the most refrangible part of the beam of light. It would also be well worth the trial if those who have any reason to suppose that they enjoy a superiority of vision would determine by actual experiment the extent of their unusual powers, and learn whether they refer to an optical appreciation of the chemical or heat rays, or show any modification of the solar spectrum by enlargement or otherwise.
