NumericalMethodsin EnvironmentalData Analysis
MosesEterighoEmetere
DepartmentofMechanicalEngineeringScience, UniversityofJohannesburg,SouthAfrica DepartmentofPhysics,CovenantUniversity,Ota,Ogun,Nigeria
Elsevier
Radarweg29,POBox211,1000AEAmsterdam,Netherlands TheBoulevard,LangfordLane,Kidlington,OxfordOX51GB,UnitedKingdom 50HampshireStreet,5thFloor,Cambridge,MA02139,UnitedStates
Copyright © 2022ElsevierInc.Allrightsreserved.
Nopartofthispublicationmaybereproducedortransmittedinanyformorbyany means,electronicormechanical,includingphotocopying,recording,oranyinformation storageandretrievalsystem,withoutpermissioninwritingfromthepublisher.Detailson howtoseekpermission,furtherinformationaboutthePublisher’spermissionspolicies andourarrangementswithorganizationssuchastheCopyrightClearanceCenterandthe CopyrightLicensingAgency,canbefoundatourwebsite: www.elsevier.com/permissions .
Thisbookandtheindividualcontributionscontainedinitareprotectedundercopyright bythePublisher(otherthanasmaybenotedherein).
Notices
Knowledgeandbestpracticeinthis fieldareconstantlychanging.Asnewresearchand experiencebroadenourunderstanding,changesinresearchmethods,professional practices,ormedicaltreatmentmaybecomenecessary.
Practitionersandresearchersmustalwaysrelyontheirownexperienceandknowledgein evaluatingandusinganyinformation,methods,compounds,orexperimentsdescribed herein.Inusingsuchinformationormethodstheyshouldbemindfuloftheirownsafety andthesafetyofothers,includingpartiesforwhomtheyhaveaprofessionalresponsibility.
Tothefullestextentofthelaw,neitherthePublishernortheauthors,contributors,or editors,assumeanyliabilityforanyinjuryand/ordamagetopersonsorpropertyasa matterofproductsliability,negligenceorotherwise,orfromanyuseoroperationofany methods,products,instructions,orideascontainedinthematerialherein.
ISBN:978-0-12-818971-9
ForinformationonallElsevierpublicationsvisitourwebsiteat https://www.elsevier.com/books-and-journals
Publisher: CandiceG.Janco
AcquisitionsEditor: PeterLlewellyn
EditorialProjectManager: AleksandraPackowska
ProductionProjectManager: SreejithViswanathan
CoverDesigner: MarkRogers
TypesetbyTNQTechnologies
CHAPTER1Overviewondatatreatment
1.1Mathematicaltechnique
1.3Statisticaldatatreatment... ...............................................7
CHAPTER2Casestudyinenvironmentalpollutionresearch
1.1Airpollution ................................................................14
1.2Landpollution.. ............................................................21
1.3Waterpollution.
1.4Noisepollution. ............................................................32
CHAPTER3Typicalenvironmentalchallenges...........................41
1 Introduction... ....................................................................41
1.1Thermalcomfortasasourceofenvironmentalconcern...
1.2Rainfallasasourceofenvironmentalconcern ...................44
1.3Recentenvironmentalcrisisandtheproblemofclimate change.. ......................................................................47
CHAPTER4Generatingenvironmentaldata:Progressand shortcoming...........................................................53
1 Methodofgeneratingenvironmentaldata:common challenges,safety,anderrors. ................................................53
1.1Dataqualityanderrors ..................................................55
1.2Satellitemeasurement.. ..................................................60
1.3Modelingprocedure ......................................................63
1.4Experimentalprocedure .................................................69
2 Commonerrorsinlaboratorypractice .....................................74 3 Maintaininglaboratoryapparatus ...........................................75
CHAPTER5Rootfindingtechniqueinenvironmentalresearch ...79
1 Applicationofrootfindingtechniquetoenvironmental data. .................................................................................79
1.1Therootfindingmethod.. ...............................................79
1.2Modificationoftherootfindingmethodtodata application ...................................................................82
1.3Computationalapplicationofrootfindingmethodto dataapplication... .......................................................103
CHAPTER6Numericaldifferentialanalysisinenvironmental research
1.1Eulermethod. ............................................................121
1.2ImprovedEulermethod.. .............................................122
1.3Runge Kuttamethod ..................................................123
1.4PredictorCorrectormethod... ........................................126
1.5Midpointmethod. .......................................................128
1.6Applicationofnumericalmethodsofsolving differentiationinenvironmentalresearch. ........................128
1.7Computationalprocessingofnumericalmethods forsolvingdifferentialequation... ..................................136
1.8Computationalapplicationofderivativesto environmentaldata ......................................................142
1.9Case1:derivativeofexperimentaldata... ........................142 References.. .........................................................................147 Furtherreading. ....................................................................148 CHAPTER7Numericalintegrationapplicationto
1.2Trapezoidalrule... .......................................................151
1.3Simpson’srule............................................................154
1.4Computationalapplicationofnumericalintegration. .........158 References.. .........................................................................168
4 Newtoninterpolation. ........................................................176
5 Splineinterpolation... ........................................................179
6 Computationalapplicationofinterpolation... .........................181 References... ........................................................................189
CHAPTER9Environmental/atmosphericnumericalmodels formulations:modelreview ..................................191
1 Introduction... ..................................................................191
1.1Globalforecastsystem ...............................................191
1.2NOGAPS-ALPHAmodel ...........................................192
1.3GlobalEnvironmentalMultiscaleModel(GEM). ............195
1.4EuropeanCenterforMediumRangeWeatherForecasts...196
1.5UnifiedModel(UKMO).. ...........................................197
1.6Frenchglobalatmosphericforecastmodel(ARPEGE).....199
1.7WeatherResearchandForecasting(WRF) .....................200
1.8JapanMeteorologicalAgencyNonhydrostaticModel (JMA-NHM).. ..........................................................203
1.9Thefifthgenerationmesoscalemodel ...........................205
1.10AdvancedRegionPredictionSystem(ARPS) .................206
1.11HighResolutionLimitedAreaModel(HIRLAM).... .......207
1.12GlobalEnvironmentalMultiscalelimitedareamodel ......208
1.13ALADINmodel... .....................................................210
1.14Etamodel. ...............................................................213
1.15Microscalemodel(MIMO)... ......................................215
1.16Regionalatmosphericmodelingsystem(RAMS) ............216 References... ........................................................................217 Furtherreading... ..................................................................221 Index.. .................................................................................................223
Thispageintentionallyleftblank
Preface
Environmentaldatamaybedescribedintermsofquantitative,qualitative,or geographicallyreferencedfactsthatrepresentthestateoftheenvironmentandits changes.Quantitativeenvironmentaldataconsistofdata,statisticsandindicators ofdatabases,spreadsheets,compendia,andyearbooktypeproducts.Qualitative environmentdataaredescriptions(e.g.,textual,pictorial)oftheenvironmentor itsconstituentpartsthatcannotbeadequatelyrepresentedbyaccuratequantitative orgeographicallyreferenceddescriptors.Geographicallyreferencedenvironmental dataaredescribedindigitalmaps,satelliteimagery,andothersourceslinkedtoa locationormapfeature.Summarily,itcanbepostulatedthatdatasetinenvironmentalstudiesislikebloodtothehumanbody.Alldecisionsinenvironmental studiesarebasedonobservablesthataremeasurable,reliable,realistic,andconsistentwiththeories.Environmentaltheoriesareformulatedfromobservables.Hence, afaultyobservablecanleadtoacolossalfailureinprocesses,prediction,model formulation,anddecision.
Theinevitableoutcomesofclimatechangehaveredefinedobservablessuchthat newtheoriesandmodelsarenecessaryduetodatainconsistency,noise,andspikes. Asidefromjustgettingdatasetandsimulating,itisnowexpedientthattheintegrity ofadatasetbethefirstlineofoperationindataanalytics.Thisfeatcanbeachieved throughtheguidanceofproventheories.Theknowledgeofthistheory,whento applyitonadataset,howtoapplyit,andwaystovalidateemergingresultsare salientinanyfieldofenvironmentalsciences.Hence,thefocusofthisbookisto educatebeginnersandprofessionalsontheabove.
Environmentalindicatorsareusuallytheenvironmentstatisticsthatareinneed offurtherprocessingandinterpretation.Basedonthis,thereistheneedoftheapplicationofnumericalmethodstovalidate,expatiate,predict,back-trace,andcreate newpossibilities.Validationtechniquethroughnumericalmethodsenablesthe researchertoascertainthepatterntrendofseriesofobservablesandtiethemto certainestablishedtheories.Expatiationtechniquethroughnumericalmethods enablestheresearchertotakeaninformednumericalguesstoreplacemissing data,noise,anddataanomalies.Missingdataiscommoninatmosphericresearch. Missingdatamakesthegenuityofthedatatobequestionableespeciallywhen theuserisabeginnerornovice.Assumeifthesatellitemeasurementofaparameter showsmissingvaluesfor7monthsinayearlydataset.Ignoringthemissingdatafor theremaining5monthswouldcertainlybeerroneoustoanalyzemonthlyorseasonally.Thesamescenarioappliestonoiseindataanddataanomalies.Thisbookseeks totrainbeginnersandprofessionalsontheaforementionedexpertise.
Thispageintentionallyleftblank
Overviewondata treatment 1
1. Introduction
Dataisusuallydefinedasraworunprocessedfactsorstatisticsthatwillneedtobe processedorinterpretedinordertogetinformation.Technically,therearethree typesofdatabasedontheirsourceandavailability:primary,secondary,andmosaic. Primarydataisdatathatiscollectedthroughfirsthandexperiences,studies,or research.Secondarydataisdataorinformationthathasbeencollectedfromother sources.Mosaicdatareferstodataandinformationthatiscollectedbyputting togetherbitsandpiecesofinformationthatarealreadypubliclyavailable.Environmentaldataarelargeamountsofunprocessedobservationsandmeasurementsabout theenvironment(oritscomponents)andrelatedprocesses.Datausedfortheproductionofenvironmentoutput,report,orstatisticsarecompiledbymanydifferent collectiontechniquesandinstitutionswhosedatasourcesarehostedprivatelyor publiclyatknownsites.Understandingandknowingtheprosandconsofeach sourceiskeyinenvironmentreportage.Datasourcesaretheinitiallocationswhere thecollecteddataoriginatesfromandrunspublicobjectfortheestablishmentand canbeaflatfile,database,scrapedwebdata,socialmedia,anddatabaseaccess whichprofuseacrosstheinternet.Datasourceisconsideredtohelpusersandapplicationstosecureandmovedatatowhereitneedstobe.Thepurposeofthedata sourceistobundleconnectioninformationthatiseasiertocomprehend.Inenvironmentalscience,datasourcecanbeclassifiedintotwo:theprimaryandsecondary data.Theprimarydataisoriginalandaccurateandiscollectedwiththeaimofgettingthesolutiontoaproblemathand,anditincludessurveys,observations,websites,questionnaires,etc.Itisreliable,objective,andauthentic.Thesecondary dataaredatathatarereadilyavailableandaremoreaccesibletothepublicthan theprimarydata(e.g.,industrysurveys,compilation).
Thetypeofdatathatcouldbeobtainedfromresearchcouldeitherbequalitative orquantitative.Qualitativedataresearchcentersaroundgettinginformationconcerningtheattribute,characteristics,orqualitiesofsample.Itdoesnotinvolve numbers.Whilequantitativedataresearchareresearchstudieswhosedataarequantifiablewiththeuseofnumbers,wheredataarecomputedthroughdiscretewhole numberintegersorcontinuousfloatingpointvalues.Therearealotofexamples ofnumericaldata;however,theyareallcategorizedintotwotypes:discreteand
continuousdata.Discretedataaredatathattakenumericalsymbolsastheyare countablelistofitems.Theytakevaluesthatcanbegroupedintocategoriesor list,wherethelistmayeitherbefiniteorinfinite.Discretedatatakesnumbercountingfrom1to10,or1toinfinity,butitalwaysoccursinarange.Continuousdataisa typeofnumericaldatawhichrepresentsmeasurements.Thesedataaredescribedas valuesthattakeintervalsuchasaverages,largestorsmallestnumber(among ranges),andcumulativegradepoint.
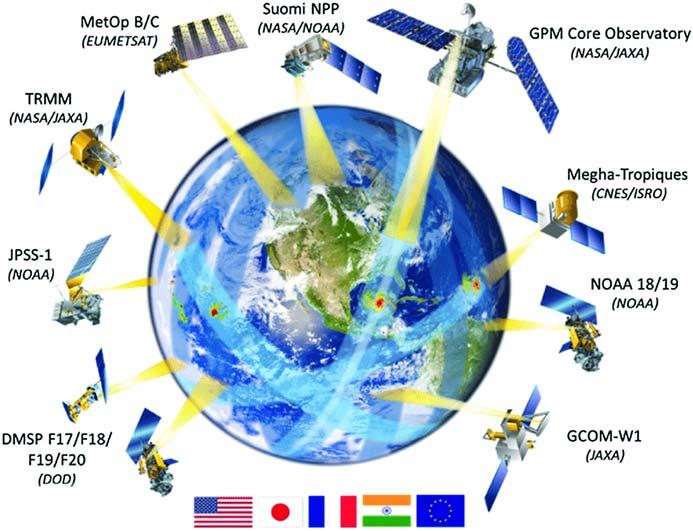
Therearedifferenttypesofdatasource.Flatfileisadatabasethatstoresdataina plaintextformatandteacheshowtoupload,prepare,andupdateyourcsvfilesto data-pines.Thisconsistsofasingletableofdatatypestableandcannotcontainmultipletablesofdatatypes,andithasnofoldersorpathsrelatedtothemandisusedto importdataandstoretableinformation.Examplesofflatfileincludeplaintext,binaryfile,delimitedfile,andflatfiledatabase.Anothertypeofdatasourceisdatabase.Databaseisoneoftheoldestdatasourcesandtherelationaldatabaseisone ofthecommondatabasesthatcaneasilybeconnectedtothedata-pines.Then eachdatabasewillthenberepresentedasanindividualdataconnection.Theysupportthemanipulationofdataandelectronicstorage.Thetypesofdatabaseare networkdatabase,hierarchicaldatabase,andobject-orienteddatabase.Atypical exampleofenvironmentalorganizationsthatmakeuseoftheflatfilesisthe NASA-associatedsatellitesextensionsuchasMERRAandGIOVANNI. Fig.1.1 showstheGlobalPrecipitationMeasurement(GPM)constellationsthathave someoftheirdatasetasflatfile.
WebServicesisatypeofdatasource.Itisasystemofcommunicationbetween twoelectronicdevicesoveranetworkandisalsoanassemblyofthesegmentthatthe softwaremakesavailableovertheinternet.Anditisformulatedtocommunicate withdifferentprogramsratherthantheusers.Inawebservicethewebtechnology knownasthe“Http”thisdatasourceisusedfortransmittingmachine-readablefile format(e.g.,theXML).Thetypesofwebservicesincludewebtemplate,webserviceflowlanguage,webserviceconversationlanguage,webservicemetadatalanguage,andwebservicedescriptionlanguage.Australiandepartmentof agriculture,water,andtheenvironmenthaveseveralwebserviceswherealistof environmentaldatacanbedownloaded.
Themostpopularformofdatasourceisdatabases.PopularenvironmentdatabasesincludeProquestNaturalSciencesDatabase,EngineeringVillage,GreenFILE,EnvironmentalImpactStatement(EIS)Database(EPA),Health & EnvironmentalResearchOnline,etc.Thereareseveraldifferenttypesofdatabases, andvariouscompaniesselldatabaseswithvariousplansandfeatures.MSAccess, Oracle,DB2,Informix,SQL,MySQL,AmazonSimpleDB,andavarietyofother databasesarewidelyusedtoday.Ingeneral,contingentdatabases thatis,databases thatdocumentacompany’sconsistenttransactions,suchasCRM,HRM,andERP arenotconsideredtobesuitableforbusinessrecords.Thisisattributabletoanumberofreasons,includingthefactthatdataisnotenhancedforitemizingandinspecting,andspecificallyqueryingthesedatabasesmayblockthelayoutandpreventthe databasesfromcorrectlytrackingtrades.OrganizationscanuseanETLtoolto
Flatfileuser:GlobalPrecipitationMeasurement(GPM)constellations(Laviolaetal., 2020).
obtaininformationfromtheirconstrainedservers,transformitintoBI-readyformat, andweighitintoadatastorageroomandperhapsanotherdatastore.Theoneflawin thistheoryisthatadatacirculationfocusisaperplexingandexpensiveplan,which iswhymanyorganizationswanttoreportexplicitlyagainsttheirstringentdatabases.
Onlinemediainformationisasourceofdata.ItisgatheredfromlongrangeinterpersonalcommunicationadministrationslikeFacebook,microbloggingstageslike twitter,mediasharingdestinationslikeYouTubeandInstagram,sites,conversation discussions,clientauditlocales,andnewlocales.Thisinformationcanbegathered fromthingshadbeenposted,as,acknowledgeorsearchaboutthroughyourgadgets.
Themethodofgeneratingprimarydataindisciplinesrelatedtoenvironmental sciencemaybethroughsurvey,experiment,andobservation.Surveyiscarried outbyquestioningindividualsbasedondifferenttopicsandreportingtheirresponses,andareusedtotestthedifferentconcepts,reflecttheattitudeofdifferent people,reportingcertainpersonalitiesofpeople,testinghypothesesofpeople’snatureofrelationshipsandpersonalities.Experimentisanorganizedstudywherethe analyzergetstounderstandtheeffects,causes,andprocessesinvolvedinaparticular processandinvolvesmanipulatingonevariabletodetermineiftherearechangesin theother.Thetypesofexperimentaldesignincludecompletelyrandomdesign,
FIGURE1.1
randomizedblockdesign,Latinsquaredesign,andfactorialdesignetc.Observation isamethodthatengagesvisionasitmainmeansofdatacollection,andisalsostudyingothers’behaviorswithouttakingcontrolofit.Thereareafewthingstokeepin mindwhencarrying-outexperimentinenvironmentalscience:
a. Measurementtechnique:Thistechniqueisrelevantbecauseithasanimpacton thesuccessofyourdata.Theconfigurationoftheequipmentaswellastheuse ofupdatedstandardsareessentialparametersbeforetakingmeasurement.Also, theproceduresforobtaininglivesamplesaresalientinexperimentaltechnique.
b. Multipletrials:Thisincludesgoingthroughtheinvestigationagainandagain. Themorepreliminaryworkyoudo,thehigheryouraveragevaluewouldbeand themoreaccurateandreliabletheresultswouldlooklike.
Themethodofgeneratingsecondarydatasetincludesinternetsources,external sources,satellitemeasurementetc.Internalsourcesaredatasetthatarewithinthe organizationandcanbeobtainedwithinashorteffort,aperiodoftimethanthe externalsourcesandtheyincludeinternalexperts,datamining,sales-forcereport, miscellaneousreport,accountingsourcesetc.Externalsourcesaredatasetthatare outsidetheorganizationandarequitedifficultbecausetheyhavemanycollections andthesourcesaremuchmorefrequent,andtheyincludesyndicateservice,governmentalpublications,nongovernmentalpublications,etc.
Datatreatmentisaveryessentialpartofanyexperimentalworkoranalysisofa secondarydataset.Itisessentialinallexperiments,spanningfromscientifictosocial tobusinesstomedicineetc.Datatreatmenthelpsresearchersidentifyerrors,spot trends,observecorrelationandrelationships,makeinferences,anddrawmeaning andconclusionsfromcollecteddata.Itinvolvesalltheactionsandprocessesin theinvestigationandcollectionofdataandtheadditionalprocessesperformedon datainordertoarriveatusefulinformation,soastomakedeductionsandinferences. Everyenvironmentalresearcher,regardlessoftheirfield,musthavethebasic conceptofdatatreatmentfortheirresearchortheirstudytobereliable.Datatreatmentisessentialandequallyimportant,aswellasdataorganization,todrawappropriateconclusionsinagivendataset.Datatreatmentisaprocesstoensureits reliabilityanduniquenessinexperimentsanddatacollectiondesigns.Thisprocess isvitaltoefficientlymakeuseofagivendataintherightway.Itisessentialto correctlytreatdatatomaintaintheresearch’sauthenticity,accuracy,andreliability. Awell-definedunderstandingisneededtoperformsuitableexperimentswiththe correctinformationobtainedfromanygivendataset.Datatreatmentcanbedescriptive,thatis,describingtherelationshipbetweenvariablesinapopulationsetsoasto distinguishbetweenanoise,spike,andtrend.Itcanalsobeinferential,thatis,testing agivenhypothesisbymakinginferencesfromacollecteddatasetoranestablishlaw ortheory.Toobtainthedesiredresult,datamustbeprocessedusingavarietyof methods.Allexperimentsrandomlyproduceerrorsornoise.Datanoisecaneither besystematicorrandomerrors.Itisadvisablethaterrorsandnoisebetakeninto considerationinthecourseoftheexperimentfortheresultoftheexperimentto makesense.
Regardlessofhowcautiousaresearchercanbewhilemeasuringorextracting samplesinanenvironment,allexperimentsarevulnerabletoinaccuraciescaused bythreeformsoferrors:systematic,random,andspontaneouserrors.Theseerrors aremosttimesspottedduringthetreatmentofdata,andthecorrectioncanthenbe reintegratedintheprocess.Spontaneouserrorsarewidelyreportedingeneticcode (Griffithsetal.,2000).Systematicerrorsareerrorsthatarecausedbyeitherthedata collectionequipmentorthemethodusedtocollectthedata.Internalerrorcan emergefrommeasuringorcharacterizinginstrumentswhichmostofthetime possessrandomerrorsthatoccuraccidentallyorunpredictablyintheexperimental configuration.Thistypeoferrorwillcontinuetooccurinallinstancesoftheexperimentuntilthesourceoftheerrorisaddressed.Someexamplesofthiskindoferror areanincorrectlycalibratedmeasuringdevice,awornoutinstrument,andamisconceptionontheobserver’send.Systematicerrorsareusuallyconsistentintheamount oferrorinthemeasuredvalue.Theseexperimentalerrorscanleadtotwodifferent kindsofconclusionerrors:type1andtype2errors.Atype1erroroccurswhena researcherrejectsatruenullhypothesis,resultinginafalsepositive.Atype2error, ontheotherhand,isafalsenegativecausedbyaresearcher’sinabilitytorejecta falsenullhypothesis.Inotherwords,themethodofdatatreatmentemployedin researchdependsonthefieldofresearchorkindofexperimentbeingconducted, asthiswouldaffectthekindofdatabeingcollected,andthedesiredformofthe datarequiredtoarriveataconclusion.Randomerrorsareerrorsthatarecaused byirregularandunpredictablevariationsintheexperiments.Thisvariationcould beasaresultofexternalenvironmentalconditionssurroundingtheexperiment;it couldalsobecausedbyafaultinthemeasuringinstrument.Thesetypesoferrors donotusuallyhavethesameerrorsinthesamedirectionforallinstancesofthe experiment.Randomerrorsoccurunknowinglyorunpredictablyintheexperimental configuration.Theyariseunknowinglyorunpredictablyintheexperimentalsetup. Datatreatmentisoneofthelastoperationsindataanalytics.Thereispreceding operationi.e.,datacollection,datapreparation,dataprocessing,datacleaning,etc., thatmustbedonebeforedatatreatment.Datacollectionisoneoftheinitialstagesof everyresearchendeavorthatinvolvesthecollectingofdatafromallavailableplatforms.Thiscouldbethroughsurveysandexperimentsinthelaboratoryorsites.Itis requiredthatthedatasourceberelevant,reliable,andauthentic.Datapreparationis theprocessthatoftenfollowsafterthedatacollectionstage.Thedatapreparation stageisoftenreferredtoaspre-processingstage.Thisisthestageatwhichdata isorganizedbeforeitisprocessedintotherequiredform.Dataprocessingisthe stageatwhichdataistranslatedintothereadable,relatable,andrequiredformat. Itmightinvolveplacingdataintorowsandcolumns,anditmightrequiretheuse ofacomputertoprocesstheinputdata.Itmayrequirecomplexprogramming,algorithms,etc.Themethodofprocessingofdatadependsonthetypeofdatatobeprocessed,processingtool/software,andsizeofdataset.Forexample,forasmallASCII datasetandMicrosoftexcelarecommonlyused.ForbigASCIIdata,structuredprogramminglanguageisusedtosavetimeandreduceerrors.Datacleaningistheprocesswherenoiseindataareremoved.Itissynonymoustodatatreatmentbutitisthe
preliminarystagebeforedatatreatment.Forexample,whendatasetsaredownloaded fromasatellitestationinASCIIformat,therecouldbemissingdata,whichmostof thetimeappearas“9.9999,”“***,”and“9999”orblank.Theremovalofthisanomaliesisdatacleaningnotdatatreatment.Also,inthedatacleaningstage,unnecessarydatacanberemovedsuchasduplicatesanderrors.Thedatacleaningprocess involvesdeduplication,matchingrecords,identifyingdatainconsistencies,checking theoveralldataquality,etc.Theemergingdatasetafterdatacleaningisexpectedto beintherequired,readableformat.Thisreadableformatcouldbeintheformofan equation,image,video,graph,theoryetc.Theinformationobtainedfromthisstage iswhatwillbeusedfordatatreatment.
Therearethreewaysofdatatreatmentinliterature.Theyare:
(a) Mathematicaltechnique(statisticaldatatreatment)
(b) Computationaltechnique(algorithmdataanalysis)
(c) Statisticaltechnique
1.1 Mathematicaltechnique
Thisisatechniquethatinvolvestheuseofmathematicaltheories,formulae,and mathematicalmanipulation.Someofthesemathematicalprocessesinclude:
I. Regressionanalysis:Thisisananalysisusedtoevaluatetherelationshipbetweentwoormoresetofnumericaldata.Whenusingthistechnique,welook foracorrelationbetweenthedependentnumericaldataandanynumberof independentvariablesthatmighthaveaneffectonthesenumericaldata.The aimofregressionanalysisistoestimatehowoneormorevariablesmight impactthedependentnumericaldata,inordertoidentifytrendsandpatterns. Thiswasusedspecificallyforpredictionandforecastingfuturetrends.Itisalso importanttonotethatregressionanalysisonlyhelpstodeterminewhetheror notthereisarelationshipbetweenasetofnumericalsetofdata,anditdoesnot sayanythingaboutthecauseoreffect.
II. Factoranalysis:Thisisatechniqueusedtoreducealargesetofvariablestoa smallernumberofvariables.Itworksontheideaofmultipleseparate, observablevariablescorrelatewitheachotherbecausetheyareallassociated withanunderlyingset.Thisisusefulnotonlybecauseitreducesvariableina particularsetofnumericaldataintosmallerunderstandablevariables,butit alsohelpstouncoverhiddenpatterns.
III. Timeseriesanalysis:Thisisastatisticaltechniqueusedtoidentifynumerical datausingtimeinterval.Itrecordsandseparatedataintogroupsbasedonthe datathathavesimilartimeintervalorthetimecreated.
Numericalanalysisismostlyneededtosolveengineeringproblemsthatresult intoequationsthatcannotbesolvedanalyticallywithsimpleformulas.Someapplicationsarelistedhere:
a. Modernapplicationsandcomputersoftware:Mostsophisticatednumerical analysissoftwareisembeddedinpopularsoftwarepackages,e.g.,spreadsheet programs.
b. Businessapplications:Modernbusinessesthesedaysmakemuchuseofoptimizationmethodsindecidingwhatorhowtoallocatearesourcemostefficiently,suchasinventorycontrol,scheduling,budgeting,andinvestment strategies.
1.2 Computationaltechnique
ThisisatechniquethatinvolvestheuseofAIsystemssuchasthecomputersystem. Thisinvolvesusingprogrammedcodes,encodedscriptsformulastoarrangeandpresentnumericaldatainanorganizedmannermeaningfultointerpretanduse.There arealotofprogrammingsoftwarecreatedtosolvethisproblem.Someofthebest onesincludethese:
I. Analytica:ThisisasoftwarecreatedanddevelopedbyLuminaDecisionSystemsforreceiving/retrieving,analyzing,andcommunicatingnumericaldata.It useshierarchicalinfluencediagramsforvisualcreationandviewofmodels, intelligentarraysforworkingonmultidimensionaldata.
II. MATLAB:MatrixLaboratoryisaproprietarymulti-paradigmprogramming languageandnumericcomputingworkingenvironmentdevelopedbyMathWorks.MATLABmakesitpossibleformatrixmanipulations,plottingof functionsanddata,implementationofalgorithms,creationofuserinterfaces, andinterfacingwithprogramswritteninotherlanguages.MATLABismade forthesourcepurposeofnumericaldatatreatment.
III. FlexPro:Thisisasoftwaredesignedfortheanalysisandpresentationofscientificandtechnicaldata.ThissoftwarewascreatedbytheWeisangGmbH team.ItwasdesignedtorunMicrosoftwindows.FlexProcananalyzelarge amountofdatawithhighsamplingrates.Alldatatobeanalyzedarestoredin anobjectdatabase.FlexProhasabuilt-inprogramminglanguage,FPScript, whichisoptimizedtocarryoutdataanalysisandsupportdirectoperationson non-scalarobjectssuchasvectorsandmatricesaswellascomposeddata structureslikesignalseries.
IV. FreeMat:Afreeopen-sourcenumericaldatatreatmentenvironmentandprogramminglanguage,similartoMATLAB.
V. jLab:ThisisanumericalcomputationalenvironmentcreatedwithaJava softwareandinterface.
1.3 Statisticaldatatreatment
Therearevariousmethodsinvolvedinthetreatmentofdata,andoneofthemost commonmethodsisthestatisticalmethodoftreatmentofdata.Whenyouapplya statisticalapproachtoadatasetinordertoturnitfromalistofmeaninglessnumbers intousefuloutput,thisisknownasthestatisticaltreatmentofdata.Statistical methodincludesbutnotlimitedto;mean,medianmode,range,standarddeviation, conditionalprobability,range,distributionrange,sampling,correlation,regression,
andprobability.Therearesomenotableerrorsindatatreatment,andusingstatistical techniquestoclassifypotentialoutliersanderrorsisanimportantaspectofdataprocessing.Statisticaldatatreatmentisoneoftheessentialaspectsofanyexperiment conductedtoday.Itcanbeseenusinganyknownstatisticalmethodtodrawmeaning fromasetofgivenmeaninglessdatasets.Statisticaldistributioncanbeclassified intotwogroups.Tobeginwith,oneofthemisconsideredtohavediscreterandom variables,whichmeansthateachwordincludesasinglenumericalvalue.Thesecondformofstatisticaldistribution,whichincludescontinuousrandomvariables,is calledacontinuousrandomvariabledistribution(thedataisknowntotakeinfinitely manyvalues).Statisticaldatatreatmentoftenentailsdefiningthedatacollection,and oneofthemosteffectivewaystodosoistousethemeasureofcoretendenciessuch asthemean,mode,andmedian.
Thecoretendenciesdescribedabovemakeitsimpleforanyresearcherto performanyresearchexperimentandunderstandhowthedatasetisconcentrated. Centraltendenciessuchasthestandarddeviation,range,anduncertaintyhelpthe researcherunderstandthedataset’sdistribution.Nevertheless,careshouldconsistentlybetakentoassumethatalldatasetsarethesameandevenlydistributed. Anyoftheabove-mentionedcentraltendenciescanbeusedtoensurethat.
Thismethodinvolvesusingsomestatisticalmethodstotransformagivenmeaninglessdataintomeaningfuldatasets.Itinvolvestheuseofsomestatistical methods:
➢ MEAN:Instatistics,thisisakeyidea.Itdescribesthecharacteristicsofastatisticaldistribution.Inasetofnumbers,itisthemostcommonvalue.
Tomeasureit,takeintoaccountthefiguresoftherelativemultitudeoftermsand thendividebythenumberofterms.Themeanofacollectionofdatacanbedeterminedinseveralways.Itcanbedeterminedusingthearithmeticmeanprocess, whichinvolvesdividingthetotalnumberofdatasetsbythesumofthetotalnumber ofdatasets.Tofindthemean,addallofthenumbersinasettogether,thendividethe totalbythetotalnumberofnumbers.Adataset’smeancanalsobecalculatedbya methodknownasthegeometricmean,whichisthe nthrootoftheproductofall numbersinthedataset.Itincludesthevolatilityandcompoundingeffectsofreturns. Thearithmeticmean,alsoknownasthemeanorstandard,isthesumofasetof valuesdividedbythenumberofvaluesinthegroup.
➢ MODE:Theestimateofthewordthatoccursoftenintheformofdissemination withadiscretearbitraryvariable.Themodeisthenumberthathappens frequentlyinsideabunchofnumbers.Itisfeasibletohavetwomodes (bimodal),threemodes(trimodal),ormoremodesinsidebiggerarrangements ofnumbers.Bimodalappropriationreferstotheappropriationthathastwo modes.Trimodalappropriationisathree-modeappropriation.Themostsevere
Mean ¼ Sumofalldatapoints
Numberofdatapoints
estimateofcapabilityistheformofdispersionwithaconstantirregularvariable.Similarly,discreteappropriationscanhavemorethanonemode.Inthis case,ittakesspecialexpertisetoidentifyerrorsornoiseinagivendataset.The advantagesofthemodeisitssimplicitytoidentifyanddetermineavalue.Its disadvantageofmodeisthepossibilitythatasetofvaluesmighthaveonlyone mode,ornomodeatall.Also,modeisnotstablewhenthestatisticshassmall numbers.
➢ RANGE:Therangeofyourdatainstatisticsistherangefromthelowesttothe highestvalueofthedistribution.Bysubtractingthelowestfromthehighest value,thespectrumisdetermined.Awidevarianceinadistributionimplies highvariability,whileasmallrangeindicateslowvariability.
➢ MEDIAN:Themiddlevalueindistributionisreferredtoasthearithmetic median,whichisapositionalaverage.Itdividesthesequenceintotwohalves bygroupingtheelementsinascendingordescendingorderofmagnitudebefore findingthemiddlevalueandisdenotedbythesymbolXorM.Itcanalsobe referredtoasthemiddlepositionorthemiddleclass,ormedianclass.For example,inasetofnumbers1,2,3,4,5,themedianofthesetofnumbers wouldbe3.Inthecasewheretwonumberareinthemiddleclass(e.g.,1,2,3,4, 5,6)themedianofthesetofnumbersistheaverageof3and4whichis3.5.
➢ STANDARDDEVIATION:Thestandarddeviationisacalculationofagroupof values’varianceordispersion.Alowstandarddeviationmeansthatthevalues aresimilartotheset’smean(alsoknownasthepredictedvalue),whileahigh standarddeviationindicatesthatthevaluesaredistributedoutacrossagreater spectrum.Thiscanbecalculatedwiththeformula
where
s ¼ standarddeviation
N ¼ sizeofthepopulation
xi ¼ eachvaluefromthepopulation
m ¼ populationmean
➢ SAMPLING:Datasamplingisapredictiveresearchmethodologythatinvolves selecting,manipulating,andanalyzingarepresentativesubsetofdatapointsin ordertouncovercorrelationsandtrendsinabroaderdatacollection.Thereare variousmethodsusedtosampledata:
• Simplerandomsampling
• Systematicsampling
• Stratifiedsampling
• Clustersampling
Samplingisamethodofstatisticalsurveyinginwhichapredeterminednumber ofobservationsaretakenfromalargergroupofindividuals.Themethodusedto collectdatafromalargergroupofindividualsvariesdependingonthetypeofstudy beingconducted,butitcanincludebasicdiscretionarysamplingorprecise sampling.
Samplingistheselectionofasampleofpatientsfromwithinameasurablepopulationtodeterminethepopulation’sattributes.Samplingisarealisticapproachthat isconcernedwiththeindividual’sinterpretationpreference.
➢ CONDITIONALPROBABILITY:Theprobabilityofoneoccurrencehappening inthecontextofoneormoreothereventsisknownasconditionalprobability. Conditionalprobabilitydenotesthelikelihoodofacertainoutcomeoccurringif anothereventhasalreadyhappened.Itisalwaysexpressedastheprobabilityof B givenan A,anditiswrittenas P(B|A),wheretheprobabilityof B isaninfinite supplyofevents.
➢ DISTRIBUTIONRANGE:Therangeofaspeciesisthegeographicalarea withinwhichthatspeciescanbefound.Withinthatrange,distributionisthe generalstructureofthespeciespopulation,whiledispersionisthevariationin itspopulationdensity.Therangeisthesmalleststretchthatincludesallthe detailsandhasatouchofmeasurabledisplacement.Itisratedinthesameunits asthedata.Itisgenerallyhelpfulincontributingtothedispersionofsmall instructionalassortments,andithasaninfinitesupplyofdiscernments.
➢ REGRESSION:Regressionisamathematicaltechniqueusedineconomics, investing,andotherfieldstoevaluatetheintensityandnatureofarelationship betweenonedependentvariable(usuallydenotedby Y)andasetofother variables(knownasindependentvariables):
Yi ¼ f ðXi ; bÞþ ei
where
Yi
¼ dependentvariable
f ¼ function
Xi
¼ independentvariable
b ¼ unknownparameters
ei
¼ errorterms
Threemajorusesofregressionanalysisare:
• Determiningthestrengthofpredictors
• Predictinganeffect
• Trendforecasting
Typesofregressioninclude:
• Linearregression
• Polynomialregression
• Ridgeregression
• Lassoregression
• Elasticnetregression
Thismethodincludesseveralvariationssuchaslinearandmultiplelinear. Regressionanalysisoffersnumerousapplicationsinvariousdisciplines,including finance.Linearregressionisbasedonsixfundamentalassumptions:thedependent andindependentvariablesshowalinearrelationshipbetweentheslopeandtheintercept;theindependentvariableisnotrandom;thevalueofresidualerroriszero;the valueoftheresidualerrorisconstantacrossallobservations;thevalueoftheresidualerrorisnotcorrelatedacrossallobservations;theresidualerrorvaluesfollowthe normaldistribution.Linearregressionisamodulethatassessesrelationshipbetween adependentvariableandanindependentvariable.
Multiplelinearregressionissimilartothesimplelinearregressioninaway,with theexceptionsofthemultipleindependentvariablesareuseinthemodel. Noncollinearity-multiplevariablesshouldshowaminimumofcorrelationwith eachother.Iftheindependentvariablesarehighlycorrelatedwitheachother,it willbedifficulttoaccessthetruerelationshipbetweenthedependentandindependentvariables.
➢ VARIANCE:Astatisticalcalculationofthespreadbetweennumbersinadata setisknownasavariance.Variancequantifieshowfareachnumberintheset deviatesfromthemean,andhencefromanyothernumberintheset.
References
Griffiths,A.J.F.,Miller,J.H.,Suzuki,D.T.,etal.,2000.AnIntroductiontoGeneticAnalysis, seventhed.W.H.Freeman,NewYork.Spontaneousmutations.Availablefrom: https:// www.ncbi.nlm.nih.gov/books/NBK21897/.
Laviola,S.,Monte,G.,Levizzani,V.,Ferraro,R.R.,Beauchamp,J.,2020.Anewmethodfor haildetectionfromtheGPMconstellation:aprospectforaglobalhailstormclimatology. Rem.Sens.12(21),3553. https://doi.org/10.3390/rs12213553
Thispageintentionallyleftblank
Casestudyin environmentalpollution research 2
1. Introduction
Pollutioncanbedefinedastheadditionofhazardousandtoxicmaterialstotheenvironment,therebycausingadverseeffects.Pollutioncanalsobedefinedastheintroductionofpollutantswhichcouldbeintheformofharmfulsubstancesorenergy intotheatmospherewhicheventuallybecomesdetrimentaltoit.Therearethree maintypesofpollution:
•Airpollution
•Waterpollution
•Landpollution
However,thereareotherequallyimportanttypesofpollutionsuchasnoise pollution,thermal(heat)pollution,plasticpollution,radioactivepollution,andlight pollution.Apollutantisanymaterialorsubstancethatcontainspropertiesthatare harmfultothebioticandabioticsystem.Pollutantscansimplybedefinedasconstituentsthatmakeuporareinvolvedinpollution.Theyarethemaincompositionof pollution.Pollutantscanbedividedintotwocategories:
1. Primarypollutants
2. Secondarypollutants
Primarypollutantsarethepollutantsatthefirstpointofintroductionintothe environment,whilethesecondarypollutantsarethepollutantsthatareformed fromtheseprimarypollutantsandtheadverseeffectsofotherexternalfactorson them.Pollutantscanbeofanyformwhethersolid,gaseousorliquid,orradioactive, soundandheatenergy.Pollutantsaremostlyanthropogenic(man-madepollutants), butinsomecases,pollutioncanbecausedbynaturaleventssuchaswildfires,where theairiscontaminated.
Pollutionisasoldasmankindsincetheancienttimesbeforecivilization from thefirestheycreatedtothewastetheyleftbehind.Althoughitwasnotamatterof greatconcernatthetime,withtheincreaseinpopulation,thequickspreadofindustrializationandcivilizationandestablishmentsoftownsandcities,pollutionisnow anissuethatproposesdangerintheyearsahead.Withtheincreaseofenvironmental CHAPTER
NumericalMethodsinEnvironmentalDataAnalysis. https://doi.org/10.1016/B978-0-12-818971-9.00003-X Copyright © 2022ElsevierInc.Allrightsreserved.
pollutionandpollutants,effortshavebeenmadetoprovideawarenesstocountries, states,andtowns,andlawshavebeenpassedtoreducepollutionandcontrolthe damagethathasalreadybeendonetotheenvironment.Someoftheselawsare
•TheAirPollutionControlActof1955,UnitedStates
•BiologicalDiversityActof2002,India
•OilPollutionofTheSea(CivilLiabilityandCompensation)(Amendment)Act of2003,Ireland
•Environmental(PreventionofPollutioninCoastalZoneandOtherSegmentsof TheEnvironment)Regulationof2003,Kenya
•CleanWaterActof1972,UnitedStates
•CleanAirActof1970,UnitedStates
•PollutionPreventionActof1990,UnitedStates
•EnvironmentalManagementActof1997,Netherlands
•PollutionControlActof1981,Norway
1.1 Airpollution
AccordingtoWorldHealthOrganization(WHO),9outof10peoplebreathehighly contaminatedair.Airpollutioncanbedefinedasthepresenceoradditionofharmful particulates(suchasaerosols)orgases(suchasgreenhousegases)totheatmosphere thataredetrimentaltothewell-beingofhumanbeingsandotherlivingorganisms andcausedamagetotheozoneandclimate.Someexamplesoftheseharmfulsubstancesincludechlorofluorocarbon(CFC),ammonia,nitrogenoxide(NOx),carbon monoxide(CO),exhaustfumes(soot)etc.Airpollutioncanbeclassifiedunderindoorandoutdoorairpollution.
Airpollutionisoneofthebiggestriskfactorsintheworldasitcausesupto5 milliondeathseachyearandisthecauseof9%ofdeathsaroundtheworld.In somedevelopedcountries,deathrateshavebeenonadeclineduetothecontrol andreductionmeasuresofindoorairpollutionsuchasimprovingproperventilation, reducingtheuseofafireplace.Also,thereductionofoutdoorpollutionthroughthe enactmentoflawsanddecreesthathasstrictimplicationsonindustrialemissions, anthropogenicemissions,andemissionsfromunconventionalsourcessuchas sewage.Theunconventionalsourcesarethenewareaofresearchasitisfoundto emitdangerousbioaerosolsintotheenvironment.Mostofthebioaerosolsarepathogenic.Theanthropogenicemissionsisthemostcommon,anditcanappearasone ofthefollowing.
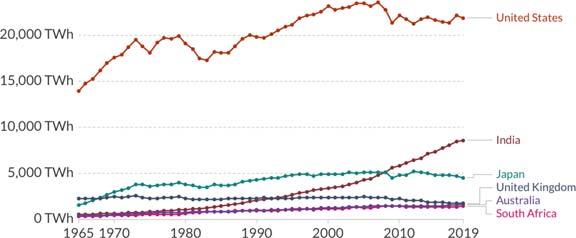
Burningoffossilfuels:Mostoftheairpollutiontakesplaceduetotheburningof fossilfuels.Overtheyears,theburningoffossilfuelshasbeenalmostinevitable becausefossilfuelshavebeenoneofthemajorsourcesofenergy,electricity,and powergeneration.IntheUnitedStates,fossilfuelconsumptionhasnearlytripled withinthelast50years.Whenthesefuelsareburnt,theyreleaseharmfulgases suchascarbonmonoxide,i.e.,agreenhousegaswhichisunhealthytolivingorganisms.Thoughthereisanewcrusadeundertheaegisofsustainabledevelopment
goalsforthepromotionofcleanenvironmentthroughtheadoptionofrenewableenergysources,theuseoffossilfuelisstillontheincreaseduetomanyfactorssuch internationalpolitics,governmentalinadequacies,corruption,andexistingemploymentsrelatingtofossilfuel(Fig.2.1).
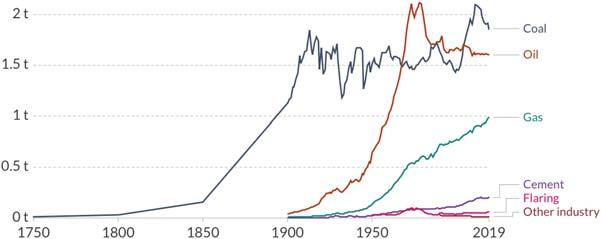
CombustionoffossilfuelsisconsideredamajorsourceoftheincreasedCO2. TheamountofCO2 producedperequivalentenergyunitvariesdependingonthe fuel-gasproduceslessthanoil,andoilproduceslessthancoal(Fig.2.2).There areothersourcesofCO2 productionasidefromfossilfuelaspresentedin Fig.2.2
Asidefromtheairpollutionfromfossilfuel,thepollutantsinfuelincludemercury,arsenic,andsulfurincoal;sulfur,vanadium,andnickelinoil;andsulfuringas. Thesepollutantsintheformofheavymetalsareanextendeddangeroffossilfuel burning.
Wildfire:Climatechangeiscausinganincreaseinforestwildfires.Thesewildfireshaveahighcontributioninpollution.Wildfirescouldalsobecausedbyburning offarmstubble.Whenthesefiresareignited,theycausesmogandthesesmogcould leadtodifficultyinbreathing(Fig.2.3).
FIGURE2.1
Fossilfuelconsumption(RitchieandRoser,2017).
FIGURE2.2
Carbondioxideemission(RitchieandRoser,2017).

