
https://ebookmass.com/product/learning-radiologyrecognizing-the-basics-3rd-edition-edition-herring/

Leah A. Cohn
https://ebookmass.com/product/clinical-veterinary-advisor-dogs-andcats-fourth-edition-leah-a-cohn/
ebookmass.com


https://ebookmass.com/product/learning-radiologyrecognizing-the-basics-3rd-edition-edition-herring/
Leah A. Cohn
https://ebookmass.com/product/clinical-veterinary-advisor-dogs-andcats-fourth-edition-leah-a-cohn/
ebookmass.com
William Herring, MD, FACR
Vice Chairman and Residency Program Director
Albert
Einstein Medical Center
Philadelphia, Pennsylvania
Daniel J. Kowal, MD
Computed Tomography Division Director
Radiology Elective Director
Department of Radiology
Saint Vincent Hospital
Worcester, Massachusetts
Chapter 22: Magnetic Resonance Imaging: Understanding the Principles and Recognizing the Basics
I’ve checked, and most prefaces to a third edition or later start out with something like, “It’s hard to believe that this is the third edition of…” Not this text. I know how much work it’s taken, so I definitely can believe it. But thank you if you have contributed in any way, including reading this preface, to the success of this book.
In the first edition, I asked you to suppose for a moment that your natural curiosity drove you to wonder what kind of bird with a red beak just landed on your window sill. You could get a book on birds that listed all of them alphabetically from albatross to woodpecker and spend time looking through hundreds of bird pictures. Or you could get a book that lists birds by the colors of their beaks and thumb through a much shorter list to find that your feathered visitor is a cardinal.
This book is a red beak book. Where possible, groups of diseases are first described by the way they look rather than by what they’re called. Imaging diagnoses frequently, but not always, rest on a recognition of a reproducible visual picture of that abnormality. That is called the pattern recognition approach to identifying abnormalities, and the more experience you have looking at imaging studies, the more comfortable and confident you’ll be with that approach.
Before diagnostic images can help you decide what disease the patient may have, you must first be able to differentiate between what is normal in appearance and what is not. That isn’t as easy as it may sound. Recognizing the difference between normal and abnormal probably takes as much practice, if not more, than deciding what disease a person has.
Radiologists spend their entire lives performing just such differentiations. You won’t be a radiologist after you’ve completed this book, but you should be able to recognize abnormalities and interpret images better and, by so doing, perhaps participate in the care of patients with more assurance and confidence.
When pattern recognition doesn’t work, this text will try wherever possible to give you a logical approach to reaching a diagnosis. By learning an approach, you’ll have a method you can apply to similar problems again and again. An analytic approach will enable you to apply a rational solution to diagnostic imaging problems.
This text was written to make complimentary use of the platform on which radiologic images are now almost universally viewed: the digital display. Although digital displays may be ideal for looking at images, some people do not want to read large volumes of text from their digital devices. So we’ve joined the text in the printed book with photos, videos, quizzes, and tutorials—many of them interactive—and made them available online at StudentConsult/Inkling.com in a series of web enhancements that accompany the book. I think you’ll really enjoy them.
This text is not intended to be encyclopedic. Many wonderful radiology reference texts are available, some of which contain thousands of pages and weigh slightly less than a Mini Cooper. This text is oriented more toward students, interns, residents, residentstobe, and other health care professionals who are just starting out.
This book emphasizes conventional radiography because that is the type of study most patients undergo first and because the same imaging principles that apply to reaching the diagnosis on conventional radiographs can frequently be applied to making the diagnosis on more complex modalities.
Let’s get started. Or, if you’re the kind of person (like I am) who reads the preface after you’ve read the book, I hope you enjoyed it.
William Herring, MD, FACR
CHAPTER 20
Recognizing Gastrointestinal, Hepatic, and Urinary Tract Abnormalities
Esophagus 183
Stomach and Duodenum 186
Duodenal Ulcer 186
Small and Large Bowel 186
Large Bowel 188
Pancreas 193
Hepatobiliary Abnormalities 194
Space-Occupying Lesions of the Liver 196
Biliary System 199
Urinary Tract 199
Pelvis 200
Urinary Bladder 201
Adenopathy 201
CHAPTER 21
Ultrasonography: Understanding the Principles and Recognizing Normal and Abnormal Findings
How It Works 204
Doppler Ultrasonography 205
Adverse Effects or Safety Issues 205
Medical Uses of Ultrasonography 205
CHAPTER 22
Magnetic Resonance Imaging: Understanding the Principles and Recognizing the Basics
Daniel J. Kowal, MD
How Magnetic Resonance Imaging Works 220
Hardware That Makes Up an MRI Scanner 220 What Happens Once Scanning Begins 220
How Can You Identify a T1-Weighted or T2-Weighted Image? 221
MRI Contrast Agents: General Considerations 223
MRI Safety Issues 225
Diagnostic Applications of MRI 226
CHAPTER 23
Recognizing Abnormalities of Bone Density
Normal Bone Anatomy 228
The Effect of Bone Physiology on Bone Anatomy 229
Recognizing a Generalized Increase in Bone Density 229
Recognizing a Focal Increase in Bone Density 230
Recognizing a Generalized Decrease in Bone Density 233
Recognizing a Focal Decrease in Bone Density 235
Pathologic Fractures 238
CHAPTER 24
Recognizing Fractures and Dislocations
Recognizing an Acute Fracture 240
Recognizing Dislocations and Subluxations 242
Describing Fractures 242
How Fractures are Described—by the Number of Fracture Fragments 242
How Fractures are Described—by the Direction of the Fracture Line 244
How Fractures are Described—by the Relationship of One Fracture Fragment to Another 244
How Fractures are Described—by the Relationship of the Fracture to the Atmosphere 245
Avulsion Fractures 245
Stress Fractures 246
Common Fracture Eponyms 247
Some Easily Missed Fractures or Dislocations 248
Fracture Healing 251
CHAPTER 25
Recognizing Joint Disease: An Approach to Arthritis
Anatomy of a Joint 254
Classification of Arthritis 255
Hypertrophic Arthritis 256
Erosive Arthritis 260
Infectious Arthritis 263
CHAPTER 26
Recognizing Some Common Causes of Neck and Back Pain
Conventional Radiography, Magnetic Resonance Imaging, and Computed Tomography 266
The Normal Spine 266
Back Pain 268
Malignancy Involving the Spine 272
MRI in Metastatic Spine Disease 273
Spinal Trauma 273
CHAPTER 27
Recognizing Some Common Causes of Intracranial Pathology
Normal Anatomy 279
MRI and the Brain 281
Head Trauma 282
Intracranial Hemorrhage 285
Diffuse Axonal Injury 286
Increased Intracranial Pressure 289
Stroke 290
Ruptured Aneurysms 292
Hydrocephalus 294
Cerebral Atrophy 296
Brain Tumors 296
Other Diseases 299
Neuroimaging Terminology 300
CHAPTER 28
Recognizing Pediatric Diseases
Conditions Discussed in This Chapter 303
Newborn Respiratory Distress 303
Childhood Lung Disease 306
Soft Tissues of the Neck 307
Ingested Foreign Bodies 309
Other Diseases 310

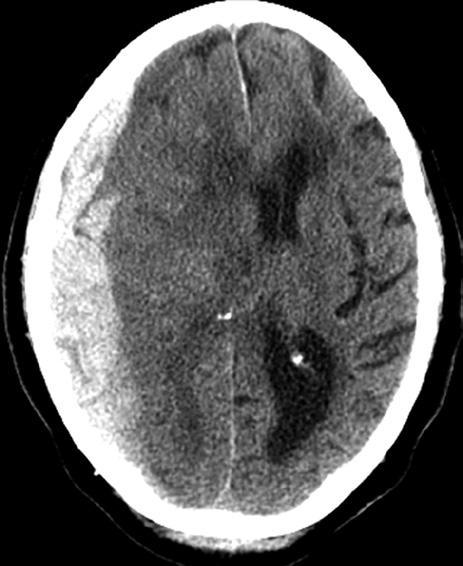
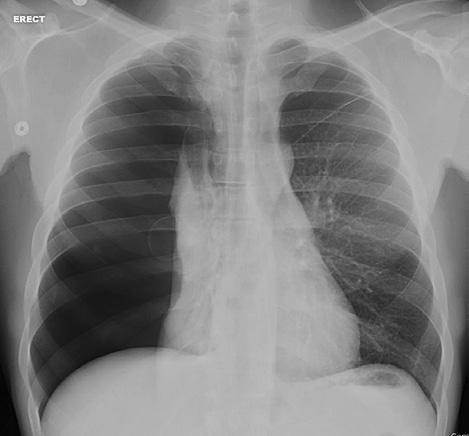
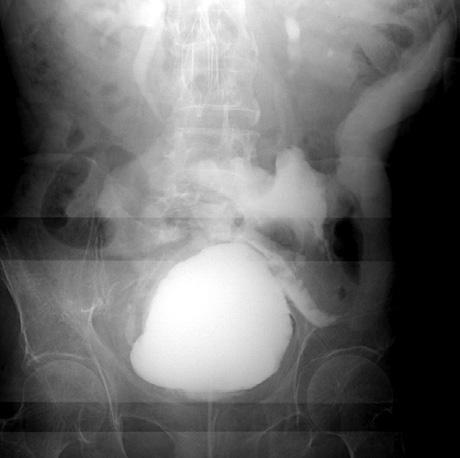
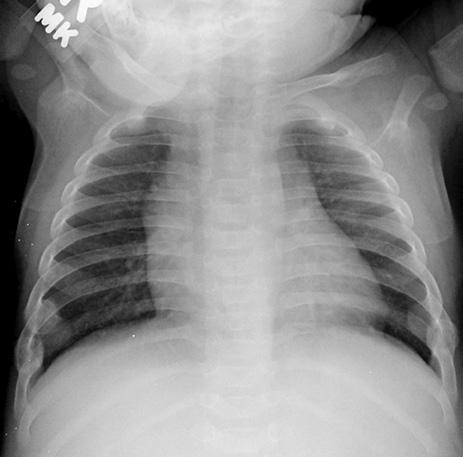
It’s always exciting when a class starts out with a surprise quiz. No pencils are necessary. Here are six images with brief histories presented as unknowns. Each is diagnostic. If you don’t know the answers, that is perfectly fine because that’s what you are here to learn. The answers are at the very end of this book (Figs. 1-1 to 1-6).
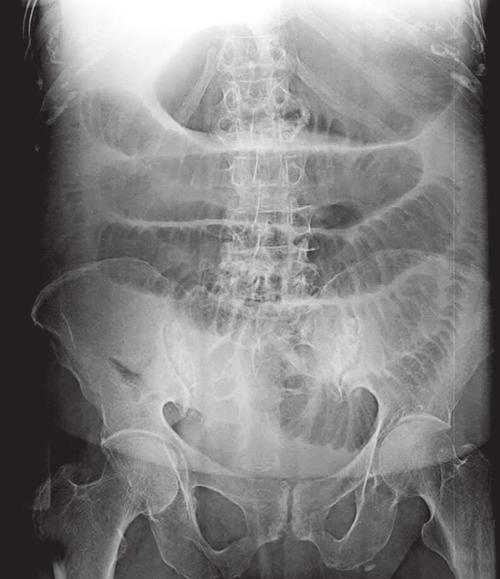
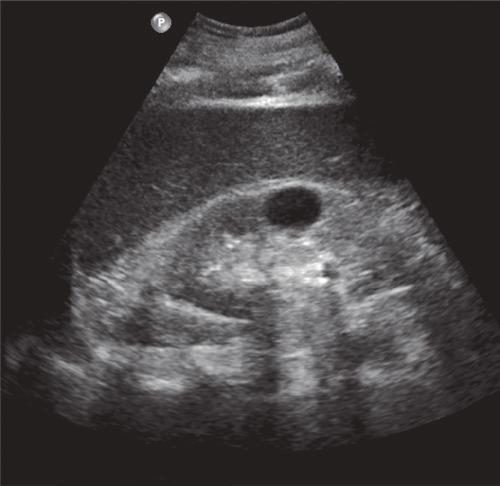
■ You are about to learn about each of the imaging modalities, about how to approach imaging studies, about the six diseases represented in the figures, and much more as you complete this text.
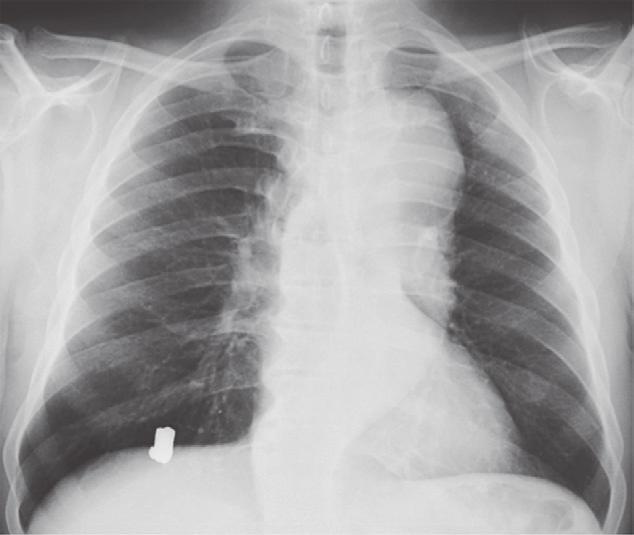
chest. A, The dense (white) metallic foreign body overlying the right
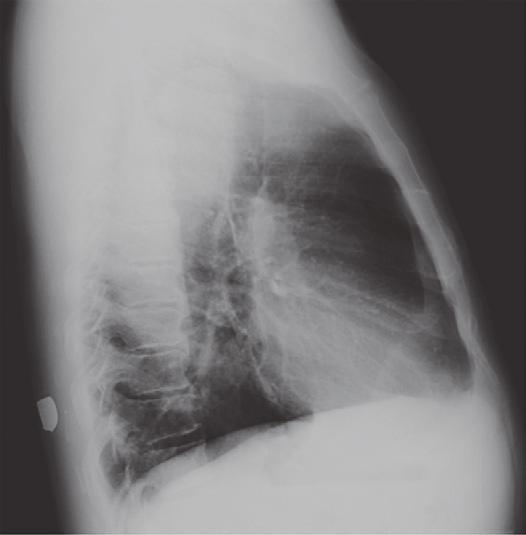
by the ribs, clavicles, and spine. Fluid (such as the blood in the heart) and soft-tissue density (such as the muscle of the heart) have the same density, which is why we cannot differentiate the two using conventional radiography. The air in the lungs is the least dense (blackest). B, Two views at 90° angles to each other, such as these frontal and lateral chest radiographs, are called orthogonal views. With only one view, it would be impossible to know the location of the bullet. On the lateral view, the bullet can be seen lying in the soft tissues of the back (black arrow). Orthogonal views are used throughout conventional radiography to localize structures in all parts of the body.
400 HU to 600 HU. Fat is 40 to 100 HU, water is 0, and soft tissue is 20 HU to 100 HU.
■ CT (or “CAT”) scanners, first introduced in the 1970s, brought a quantum leap to medical imaging.
■ Using a gantry with a rotating x-ray beam and multiple detectors in various arrays (which themselves rotate continuously around the patient), along with sophisticated computer algorithms to process the data, a large number of two-dimensional, slicelike images (each of which is millimeters in size) can be formatted in multiple imaging planes (Video 1-1).
■ A CT scanner is connected to a computer that processes the data though various algorithms to produce images of diagnostic quality.
■ A CT image is composed of a matrix of thousands of tiny squares called pixels, each of which is computer-assigned a CT number from 1000 to +1000 measured in Hounsfield units (HUs), named after Sir Godfrey Hounsfield, the man credited with developing the first CT scanner (for which he won the Nobel Prize in Medicine in 1979 with Allan Cormack).
♦ The CT number will vary according to the density of the tissue scanned and is a measure of how much of the x-ray beam is absorbed by the tissues at each point in the scan. By convention, air is assigned a Hounsfield number of 1000 HU and bone about
■ CT images are displayed or viewed using a range of Hounsfield numbers preselected to best demonstrate the tissues being studied (e.g., from 100 to +300), and anything within that range of CT numbers is displayed over the levels of density in the available gray scale. This range is called the window.
Denser substances that absorb more x-rays have high CT numbers, are said to demonstrate increased attenuation, and are displayed as whiter densities on CT scans.
♦ On conventional radiographs, these substances (e.g., metal and calcium) would also appear whiter and would be said to have increased density or to be more opaque.
■ Less dense substances that absorb fewer x-rays have low CT numbers, are said to demonstrate decreased attenuation, and are displayed as blacker densities on CT scans.
♦ On conventional radiographs, these substances (e.g., air and fat) would also appear as blacker densities and would be said to have decreased density (or increased lucency).
■ CT scans can also be windowed in a way that optimizes the visibility of different types of pathology after they are obtained, a benefit called postprocessing, which digital imaging, in general, markedly advanced. Postprocessing allows for additional manipulation of the raw data to best demonstrate the abnormality without repeating a study and without reexposing the patient to radiation (Fig. 1-8).
■ Traditionally, CT images were viewed mostly in the axial plane. Now, because of volumetric acquisition of data, CT to produce cell mutations, which could lead to many forms of cancer or anomalies. Public health data on lower levels of radiation vary with regard to assessment of risk, but it is generally held that only medically necessary diagnostic examinations should be performed and that imaging using x-rays should be avoided during potentially teratogenic times, such as pregnancy. (More information about radiation dose and safety is available at StudentConsult.com.)
■ In the modalities of conventional radiography, CT, and fluoroscopy, images are produced using ionizing radiation. Besides producing the image, this radiation can also have harmful effects if used in excess. All health care providers should understand the risks associated with radiation exposure and limit exposure when possible.
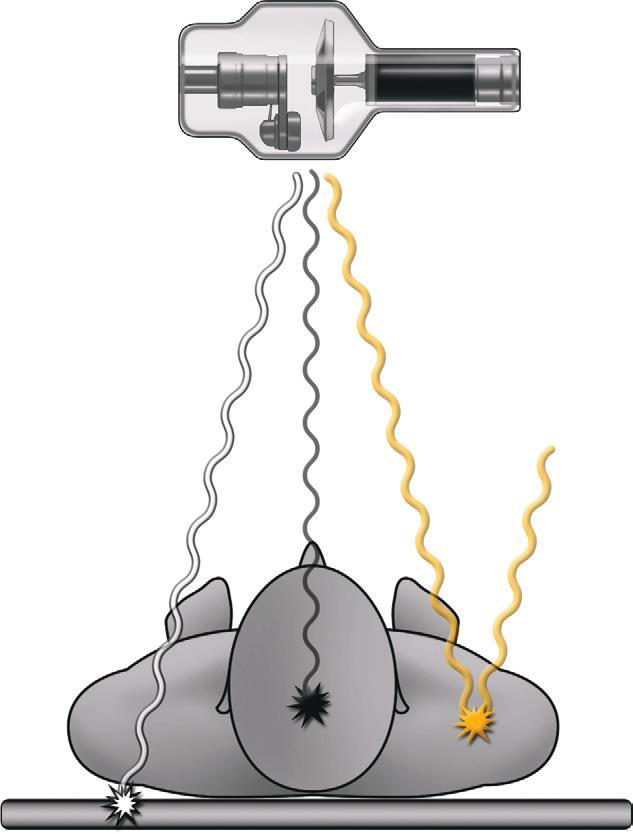
■ Transmitted radiation is the radiation that passes through the patient and interacts with the detector to create the image (wavy white line in eFig. 1-2). Unfortunately, only about 5% to 15% of the radiation produced by the source becomes transmitted radiation.
■ The majority of radiation produced by the source becomes either absorbed radiation or scatter radiation.
♦ Absorbed radiation is the radiation that interacts with the tissues of the patient, depositing its energy in those tissue; it is the source of the patient radiation exposure (wavy black line in eFig. 1-2).
♦ Scatter radiation is not transmitted or absorbed by the patient. As radiation passes through the patient, some of the radiation changes its original path, with the scatter leaving the patient along a different course. Scatter radiation can degrade the quality of the image and can be an exposure source to personnel (wavy yellow line in eFig. 1-2).
■ The absorbed radiation is measured by the absorbed dose. The unit for absorbed dose is the gray (Gy), which is the energy absorbed per unit of mass (kilogram). The older unit for absorbed dose is the rad, where 1 Gy = 100 rads. Absorbed dose does not take into account the biological effect of that radiation.
■ The equivalent and effective doses attempt to correlate the absorbed dose with the potential biological effects on different types of tissues. The unit for these doses is the Sievert (Sv) or rem, where 1 Sv = 100 rem.
Biological
■ Radiation causes biological effects on a cellular level either (1) by directly damaging molecules or (2) by indirectly creating free radicals to disrupt cellular metabolism.
■ Deterministic effects (nonrandom): This is damage that occurs when a threshold level is met. Both the probability and the severity of the effect are proportional to increasing dose, where the dose is usually given in one exposure or several exposures over a very short period of time. These effects occur when the level of radiation-induced cell damage exceeds the cell’s ability to repair the damage. Some examples of deterministic effects and threshold doses are shown in eTable 1-1
■ Stochastic effects (random): Damage that may occur at any level of exposure, without a threshold dose. These effects occur by chance, and while their probability increases with an increasing dose, their severity is independent of the dose. These effects are due to damage of cellular components, usually DNA, by free radicals, leading to abnormal cell function if repair is incomplete or incorrect. Stochastic effects are “invisible damage” and may not manifest until many years after exposure.
■ The probability of cell damage is due in part to the radiosensitivity of the type of tissue irradiated. In general, slowly dividing mature cells, such as bone cells, have a low sensitivity to radiation damage, whereas undifferentiated, rapidly dividing cells, such as intestinal epithelial cells, have a higher sensitivity. The most radiosensitive organs are bone marrow, colon, lung, female breast, stomach, and childhood thyroid.
■ Radiation-induced DNA mutations that occur in somatic cells can lead to the development of cancers. Mutations that occur in the germ cells may be passed on to the offspring, causing heritable genetic or chromosomal abnormalities, although none has ever been documented in humans.
■ Cancer development is a major concern associated with radiation exposure. Most of the information that is known about radiation-induced cancer comes from the Japanese atomic bomb survivors of Hiroshima and Nagasaki.
■ There is evidence that demonstrates a relationship between radiation-induced cancers at doses of 500 mSv. Although doses of 100 mSv are very infrequently obtained in most radiographic imaging procedures, it is believed that doses as low as 10 mSv may statistically increase the risk of developing radiation-induced cancer. To put this in perspective, though, a single chest radiograph exposes a person to an effective dose of about 0.04 mSv.
■ There can be a 10- to 20-year latent period, after which cancer develops due to radiation exposure, as shown in studies from Hiroshima and Nagasaki. Because of this latent period, older adult patients are generally at lower risk than other groups for developing cancer related to radiationinduced cellular changes.
■ In 2006, it was estimated that medical imaging tests accounted for half of the total annual radiation dose to humans.
■ The average yearly background radiation dose for a person living in the United States is about 3 mSv. This radiation dose comes from natural sources, including cosmic radiation, naturally occurring radioactive materials in soil, and radon gas. This background radiation dose does not include additional radiation exposure from diagnostic imaging procedures. Examples of radiation doses from natural background and common radiographic procedures can be seen in eTable 1-2
■ The American College of Radiology (ACR) has established the Appropriateness Criteria to aid physicians in selecting the appropriate imaging procedure. The ACR also provides information on the relative radiation levels associated with different modalities. Portions of the ACR Appropriateness Criteria can be found in the Appendix of this text.
■ Radiation doses can vary, depending on body habitus, age, and technical factors. Larger body parts, such as the pelvis, require more radiation than smaller body parts, such as the
hand, to produce an image. Also, a large dose of radiation can occur with modalities such as CT and fluoroscopy, whereas no ionizing radiation is used with ultrasonography and MRI.
■ Radiation safety uses the “as low as reasonably achievable” (or ALARA) principle: High-quality images should be obtained by using the lowest possible dose to limit the exposure of patients and health care workers. The goal is to prevent deterministic effects and limit stochastic effects.
■ There are three major radiation safety practices: time, distance, and shielding.
♦ Managing time of exposure: This means limiting exposure duration to a level needed to achieve a useful clinical examination.
♦ Increasing the distance from the source: The inverse square law states that the intensity of radiation from a source is inversely proportional to the squared distance from that source. One can reduce radiation exposure to 25% by standing twice as far from the source.
♦ Using appropriate shielding materials: The use of lead (e.g., a lead apron) or other materials can limit the amount of radiation exposure.
■ Dose reduction in CT: In 2000, it was estimated that CT accounts for 2% to 3% of all radiologic diagnostic examinations but contributes to 20% to 30% of patient radiation exposure from all radiologic procedures. CT may now be responsible for up to 50% of patient radiation exposure. This has led to a dose reduction effort in CT examinations, which includes monitoring the dose, increasing the speed of the tabletop movement to shorten the exposure, and adjusting parameters based on patient size and age.
■ Children: Children have a three to five times higher risk of mortality due to radiation-induced cancer than adults. In addition to increased organ sensitivity, pediatric patients have a longer life expectancy and thus a longer latent period to develop cancer. The use of ionizing radiation in pediatric populations should be monitored carefully and utilized only when necessary. Ultrasonography and MRI should be employed when possible.
■ Pregnant women: From Hiroshima and Nagasaki, we know that fetal radiation exposure can lead to mental retardation, organ malformation, childhood cancer, and/or loss of pregnancy. None of these adverse effects has been observed due to medical exposure. Fetal risk varies, depending on dose and gestational age, as demonstrated by the chart in eTable 1-3
■ Radiologic procedures outside the abdomen and pelvis can be done with minimal fetal exposure. Any examination of the abdomen and pelvis has the potential to deliver a dose to the fetus, with the highest doses coming from CT and fluoroscopy. It should be noted that a lone imaging procedure cannot deliver a dose that equals 100 mGy. Preparation for radiologic procedures in a woman of childbearing age must include inquiry about pregnancy status, and pregnancy testing should be performed if there is any doubt. If a woman is pregnant, radiation exposure should be limited and modalities that do not involve ionizing radiation should be employed when possible.
■ More information about radiation safety can be found on the ACR website (www.acr.org). eTABLE 1-2 RELATIVE RADIATION DOSES