Investigation of oil flow in a ball bearing using Bubble Image Velocimetry and CFD modeling
Ujjawal Arya a , Wyatt Peterson a , Farshid Sadeghi a, * , Andreas Meinel b , Hannes Grillenberger b
a Purdue University, School of Mechanical Engineering, West Lafayette, IN 47907, USA
b Schaeffler Technologies AG & Co. KG., 91074 Herzogenaurach, Germany
ARTICLE INFO
Keywords:
Angular contact ball bearing (ACBB)
Lubricant flow visualization
Particle Image Velocimetry (PIV)
Bubble Image Velocimetry (BIV)
Computational fluid dynamics (CFD)
ABSTRACT


The objectives of this investigation were to experimentally and analytically study the oil flow inside an angular contact ball bearing using Bubble Image Velocimetry (BIV). A counter-rotating angular contact ball bearing test rig (CRACTR) was designed and developed such that both bearing races can be rotated simultaneously in opposite directions, allowing for detailed observation of a single cage pocket in a stationary reference frame. Transparent acrylic cages were developed based on the original geometry of the cage and installed in the bearing. The oil flow inside the cage and bearing were analyzed using a high-speed camera. BIV was used to track bubbles in the oil and to understand the flow pattern inside the bearing. Ansys Fluent software was used to develop a computational fluid dynamics (CFD) model for the bearing. Results from the analytical model corroborate well with the experimentally observed oil flow streamlines and demonstrate the influence of operating conditions and cage designs on fluid flow. The CFD model provided details such as oil velocity at different locations in the bearing and fluid drag torque. The quantitative and qualitative validation of CFD results provides a basis for cage design for efficient lubricant flow inside a bearing.
1. Introduction
Rolling element bearings (REBs) are an integral part of rotating machinery. For high-speed applications such as automotive transmissions and drivetrains, angular contact ball bearings (ACBBs) are widely used as they offer long operating life [1], high energy efficiency, good reliability and easy handling [2] Sufficient lubrication is required to ensure the running performance of the bearings and to reduce the risk of starvation [3,4]. At high speeds, it becomes difficult for the oil to enter the contact area between the ball and race due to the formation of vortices around the ball, thus affecting the bearing lubrication [5] Studying the oil flow field helps identify such vortex regions and potential sources of kinetic energy losses inside the bearings [6]. Knowledge of complex flow behavior inside the bearing is therefore critical for understanding the lubrication mechanism and improving the heat dissipation performance [7], especially for high-speed rolling element bearings [5]
Many researchers have developed computational fluid dynamics (CFD) models to investigate oil flow for lubricated contacts. A few examples include the use of CFD to study the lubrication of aero-engine
* Corresponding author.
chambers [8–10] and splash-lubricated gearboxes [11,12] Wen and Oshima [13] used CFD modeling to investigate the agitation torque of ball bearings. The authors obtained oil flow for different cages and proposed a modified cage design for improving bearing efficiency. Peterson et al. [14] developed a full geometry CFD model of a deep groove ball bearing (DGBB) and provided relevant details about their model and the solution strategy. The authors presented results for velocity streamlines and pressure contours over the cage for various oil properties and operating conditions and realized that different cage designs can influence the lubricant flow characteristics. Deng et al. [15] presented a combined nonlinear-dynamic and CFD model for analyzing the oil-air flow and temperature distribution of high-speed ball bearings. The authors observed the formation of vortices near the inner and outer raceways which affected the ball lubrication, similar to the results by Yan et al. [5]. CFD modeling has also been utilized to investigate the drag and churning losses in DGBBs [16], radial needle roller bearings [16], tapered roller bearings (TRBs) [17] and cylindrical roller bearings (CRBs) [18]
Particle Image Velocimetry (PIV) has been used by many researchers for flow analysis [19–24] The history of PIV can be traced back to the 1500 s when Leonardo da Vinci [25] first observed and sketched flow
E-mail addresses: uarya@purdue.edu (U. Arya), peter496@purdue.edu (W. Peterson), sadeghi@purdue.edu (F. Sadeghi), meineand@schaeffler.com (A. Meinel), grillhnn@schaeffler.com (H. Grillenberger).
https://doi.org/10.1016/j.triboint.2022.107968
Received 19 July 2022; Received in revised form 31 August 2022; Accepted 28 September 2022
Availableonline30September2022 0301-679X/©2022ElsevierLtd.Allrightsreserved.
Nomenclature
dball Ball diameter (m).
de Bearing pitch diameter (m).
α Contact angle of bearing (◦ ).
ωIR Rotational speed of inner race (rad/s).
ωOR Rotational speed of outer race (rad/s).
ωball Rotational speed of the ball (rad/s).
Δmag Absolute difference in velocity magnitude from BIV and CFD results (m/s).
Δdir Absolute difference in velocity direction from BIV and CFD results (◦ ).
vmag ,CFD Velocity magnitude obtained from the CFD model (m/s).
vmag ,BIV Velocity magnitude obtained from the BIV measurement (m/s).
v◦ dir,CFD Velocity direction obtained from the CFD model (◦ ).
v◦ dir,BIV Velocity direction obtained from the BIV measurement (◦ ).
fields over a variety of objects. In 2009, Wang et al. [26] used micro-PIV to investigate the shear-driven fluid flow out of a microcavity and corroborated the results using the COMSOL Multiphysics CFD software. More recently, PIV has been used to study complicated fluid flow in bearings. Lin et al. [27] presented results for the velocity field of lubricant flow in a bearing system using a classical PIV system and found that the magnitude of the lubricant’s velocity field and the angle of the velocity vectors increased with the rotational speed. Yan et al. [5] used acrylic to fabricate bearing components and demonstrated the presence of vortices near the ball’s surface through PIV experiments and CFD modeling. The authors also determined that the intensity of these vortices increased with the inner race (IR) speed, indicating that the bearing speed had a notable effect on the flow field inside the bearing cavity. Richardson et al. [28] measured cavity flow in a pocketed thrust bearing and demonstrated that lubricant became trapped in a recirculation vortex after the reformation boundary for all operating conditions tested. Recently, Maccioni et al. [29] developed a vertical test rig to visualize the lubricant flow inside a TRB using PIV. The authors seeded the oil with fluorescent particles and used an outer race (OR) made of sapphire to have a good balance of rigidity and transparency. They corroborated their results with the CFD model [30] and concluded that aeration was the primary cause for the variation in velocity pattern at shaft speeds above 900 RPM. It is noted, though, that previous investigations of oil flow in bearings employing PIV had limited resolution of experimental flow fields, and were only able to provide qualitative confirmation of CFD results.
Flow measurement attempts have also been made by tracking the gaseous bubbles in simplified experiments using Bubble Image Velocimetry (BIV). This is a variation of the PIV technique, where bubbles are directly used as tracer particles for quantification of flow velocity [31]. Todd et al. [32] described an algorithm for analyzing a two-phase air-water flow system with variably sized water bubbles by tracking their centroid. The authors discussed important pre-processing steps required for accurately tracking the bubbles. Hassan and Canaan [33] obtained bubble path lines around a heated cylindrical conductor by creating a dispersed air bubbly flow inside a rectangular acrylic container. Bubble velocities were determined and the flow fields were compared using both PIV and BIV methods. However, the authors realized several challenges in tracking the bubbles using BIV, such as out-of-plane scattering and reflection from the bubbles, which influenced their bubble-tracking procedure. Similarly, Bung and Valero [34] also identified some difficulties in the BIV analysis and found that their results
underestimated the flow velocities. Other investigations [35–38] have also realized the importance of using BIV for tracking bubbly flow in aerated regions and obtained velocity fields for fundamental applications.
In this investigation, BIV was used to track the bubbles in the oil generated due to self-aeration and to visualize the oil flow streamlines inside an ACBB. A counter-rotating ACBB test rig was developed to analyze the oil flow inside the bearing and provide insights into the bearing lubrication for two different cage types. The test rig was equipped with a high-speed camera and the test bearing was operated in a counter-rotating configuration, which allowed visualization of the oil flow for a rotating ball inside the stationary transparent cage. A CFD model for this ACBB was also developed in Ansys Fluent to corroborate the experimental results. The BIV and CFD results were in good agreement and demonstrate the variation in oil flow with geometrical and operational parameters. The methodology of BIV and the validated CFD results from this investigation can be used for complex flow analysis inside REBs.
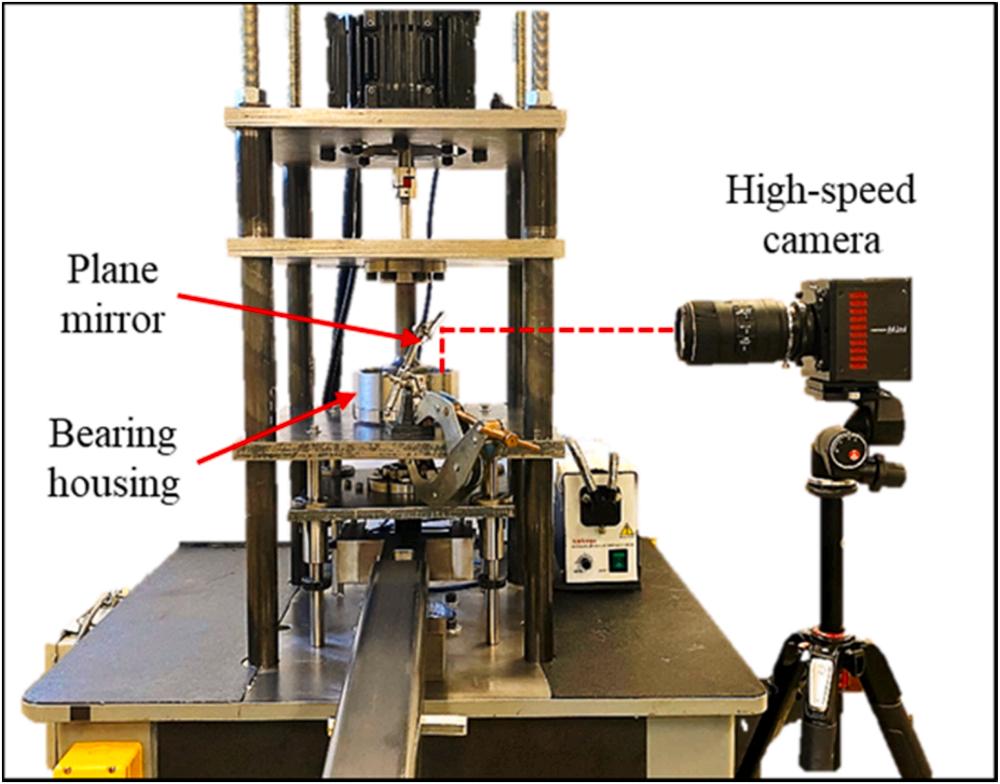
Fig. 1. Image of CRACTR equipped with the High-Speed camera.
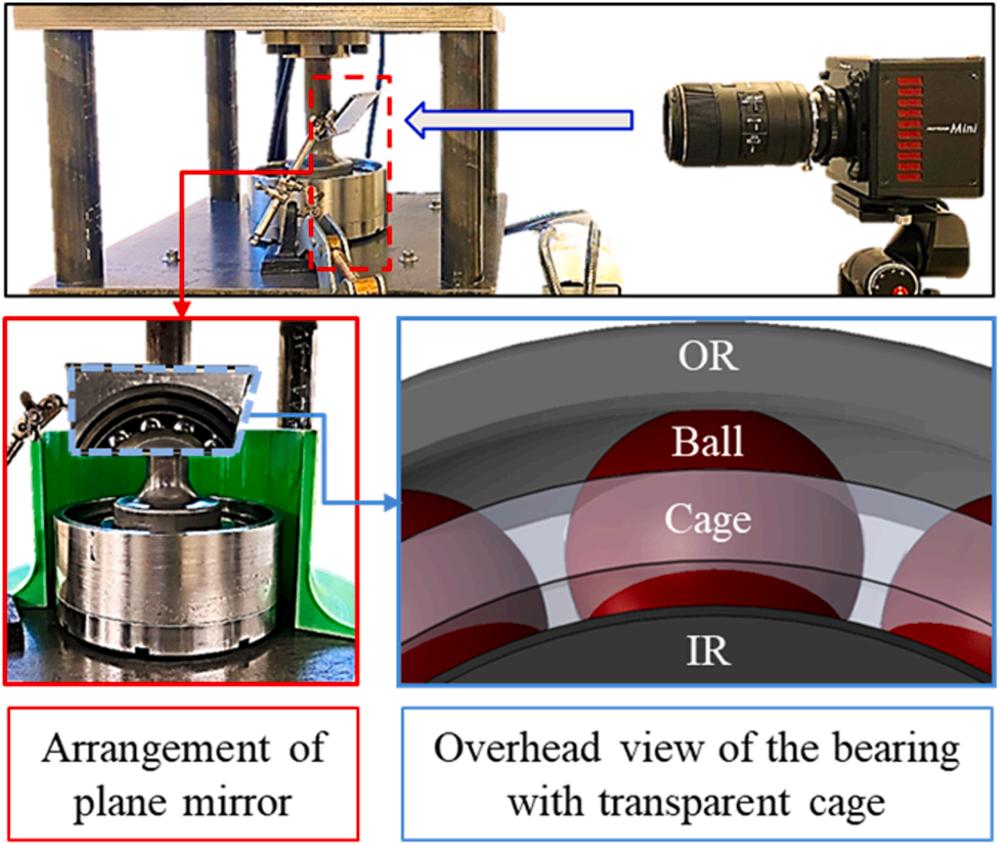
Fig. 2. Close-up view of the imaging setup with the CRACTR for oil flow visualization.
Table 1
Bearing geometry and cage parameters for the 7311 ACBB.
Bearing geometry parameters
Contact
Number
Bearing
Bearing
Bearing
Cage
2. Experimental investigation
2.1. Experimental setup
Fig. 1 depicts the image of the CRACTR that was designed and developed to visualize the oil flow through a bearing cage. Arya et al. [39] provided a detailed description of the test rig platform
development. The CRACTR was additionally equipped with a Photron Fastcam Mini AX-100 540 K High-Speed (HS) camera, capable of recording high-quality frames during the steady state operation of the bearing at up to 540,000 frames per second (fps). All the captured videos were analyzed to quantify the oil flow by tracking bubbles using PIVlab [40] A fiber optic light source was used to illuminate the bearing chamber and a circular polarizing filter was installed on the camera lens to remove unnecessary reflections. A plane mirror was placed just above the bearing housing at an angle of 45◦ within the line of sight of the camera to record an overhead view of the bearing. The setup was used to visualize the in-plane flow field through the transparent cage, as illustrated in Fig. 2 The temperature of the bearing cage was monitored through an infrared thermometer and a small fan was used to maintain constant bearing operating temperatures.
An important aspect of this investigation was the selection of oil that produced a sufficient number of trackable bubbles for performing BIV. It was critical that at all test speeds the size of these bubbles stabilized with time [41], creating a uniform bubble distribution. The formation of bubbles in common lubricating oils is due to the entrained air rising to the surface (known as aeration [30]), and it is influenced by the bearing speed [17,42] and the oil volume [42]. While the bubbles rise to the surface due to buoyancy, the velocity of this motion is in the plane normal to the viewing angle and thus does not affect the findings. This phenomenon was exploited to perform BIV by tracking the in-plane
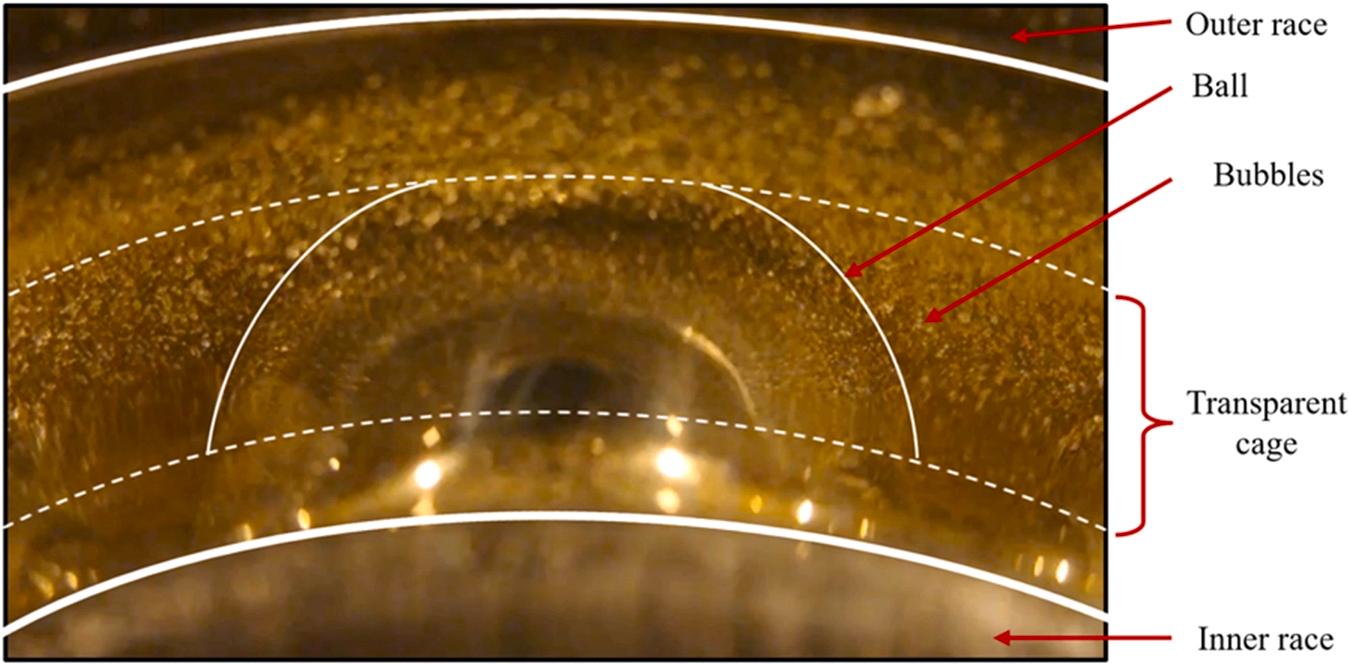
Fig. 3. Overhead snapshot from the High-Speed camera showing bubbles through the transparent cage in CRACTR.
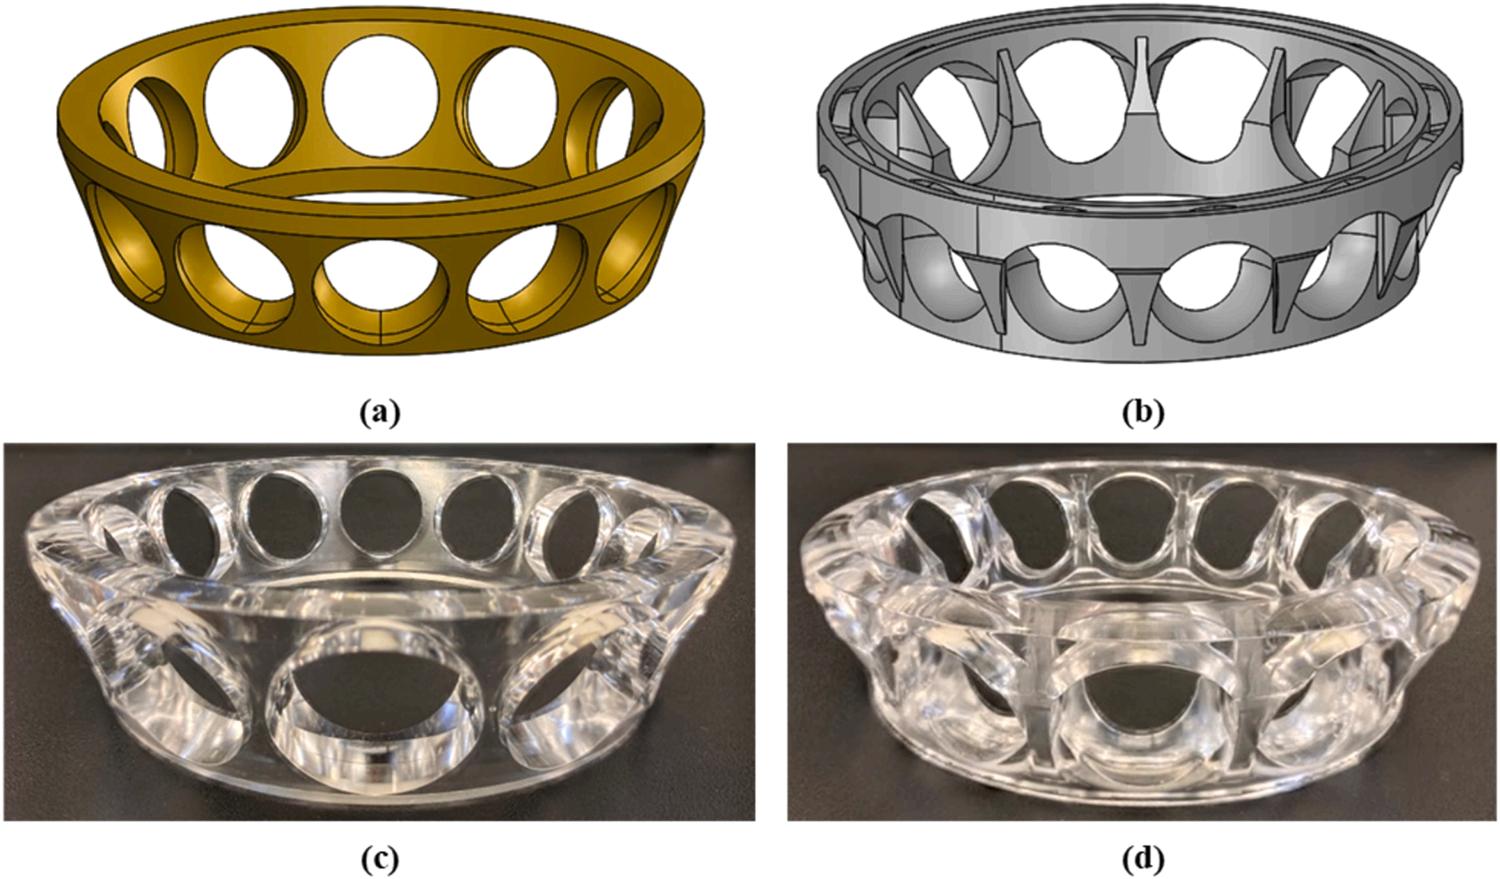
Fig. 4. CAD model for the (a) brass and (b) plastic cages used in the 7311 ACBB, and images of the transparent acrylic (c) cage
and (d) cage
Table 2 Operating conditions and
movement of these bubbles instead of seeding the oil with tracer particles. Fig. 3 indicates such bubbles near the top surface of the cage from a video captured using the HS camera (readers are also encouraged to watch a sample video included in the supplementary material). Moreover, the entrained bubbles were carried along with the oil velocity without deflecting the oil flow [43], making them appropriate for tracking using BIV. Thus, using BIV overcomes the common limitations of the PIV technique [44]
The test bearing used in this investigation is a 7311 ACBB which is commonly used in industrial gearboxes and transmission applications [39]. Relevant dimensions of the test bearing and cages used in this investigation are provided in Table 1. SAE 30 motor oil was used for lubrication and the oil fill level during the bearing operation was maintained such that the bearing was completely submerged for all the operating conditions. This bearing can be supplied with either a brass (cage-B) or plastic (cage-P) cage. Cage-B has smooth inner and outer walls while cage-P has angular protrusions on both walls. For better visualization of oil flow inside the bearing, replicas of common 7311 ACBB cages were fabricated from acrylic and installed in the bearing. It is to be noted that the cage pocket clearances listed in Table 1 are subjected to manufacturing tolerances for the acrylic cages. Fig. 4 illustrates the cross-section of these cages along with the images of actual clear acrylic cages. The combination of a clear cage and a counter-rotating bearing provides a unique opportunity to observe lubricant motion around a rotating ball inside a stationary cage pocket, which is challenging through a conventional bearing operation (for example, a rotating shaft with a fixed bearing housing).
2.2. Experimental procedure
The CRACTR was operated in a counter-rotating configuration such that the cage remained stationary during all tests conducted. Bearings typically operate with a fixed OR, resulting in cage rotation relative to the stationary reference frame. Previous research has shown that oil near the cage moves very close to the cage velocity, and fluid flow relative to the cage reference frame is typically observed to draw meaningful conclusions [14]. The counter-rotating configuration was chosen in the current investigation so that the cage and stationary reference frames are the same, allowing for detailed comparisons between experimental and analytical results.
Various combinations of race speeds were tested to observe the effect of operating parameters on the oil streamlines for both cages tested. The axial load on the ACBB was kept constant at 2 kN (~3.2% of the static load rating of the bearing). The operating speeds were limited to the 400 RPM IR speed to ensure a consistent oil fill level for the experiments. Table 2 lists the operating conditions and the camera settings selected for this investigation. The HS camera was used to capture 3 s long steady-state videos for each test condition. The frames from the recorded video were utilized to track the individual bubbles using BIV and were later compared with the CFD results. The differences in magnitude and
direction of the in-plane flow velocity vectors obtained from the BIV measurements and the CFD model were computed as:
For the BIV analysis, the video from the HS camera was imported into PIVlab [40], and the desired number of frames was selected. Enhanced local contrast, intensity capping and high pass filters were enabled to further remove the erroneous velocity vectors that may result from the overexposed bubbles or unnecessary reflections. Next, an approximate boundary was selected in these frames to outline the region of interest around a cage pocket. The surfaces of the ball, IR and OR were masked to analyze the oil flow in the region between the two balls. The algorithm employed in PIVlab was the Fast Fourier Transformation window deformation. Two passes with successive interrogation window sizes of 64 × 64 and 32 × 32 pixels were selected. The distance and time calibrations were done based on the ball diameter and the frame rate respectively. Finally, PIVlab tracked the movement of individual bubbles similar to tracking a tracer particle. Results were averaged over 500 frames, and flow streamlines were generated. This procedure was repeated for different operating conditions to obtain the oil flow streamlines in an ACBB for a variety of conditions.
3. CFD model setup
Single-phase steady-state oil flow in the 7311 ACBB chamber was modeled using Ansys Fluent software for various counter-rotating race speeds and for the two cage types tested experimentally. Although the actual ACBB operated in a mixture of oil and air, the current CFD model was developed to understand the oil flow behavior for a fully submerged bearing, analogous to the CRACTR. This approach was previously adopted by Peterson et al. [14] As such, the single-phase, steady-state model was found to be appropriate and computationally efficient for the current investigation. The cyclical symmetry of the bearing was used to reduce computation time, and only three ball and cage pocket sections were modeled with periodic boundary conditions at the cutting planes [16] The current model takes approximately 10 minutes to obtain the converged solution, using 4 processes on an Intel ® Xenon ® Processor ES-2660 V3 with 64 GB of RAM and a processor speed of 2.6 GHz. The following sections provide relevant details about the boundary conditions, lubricant properties, meshing and the solver parameters used to develop this CFD model.
Fig. 5. Rotation of bearing components demonstrated in the side and overhead views for the CFD model in Ansys Fluent
U.
3.1. Boundary conditions and mesh
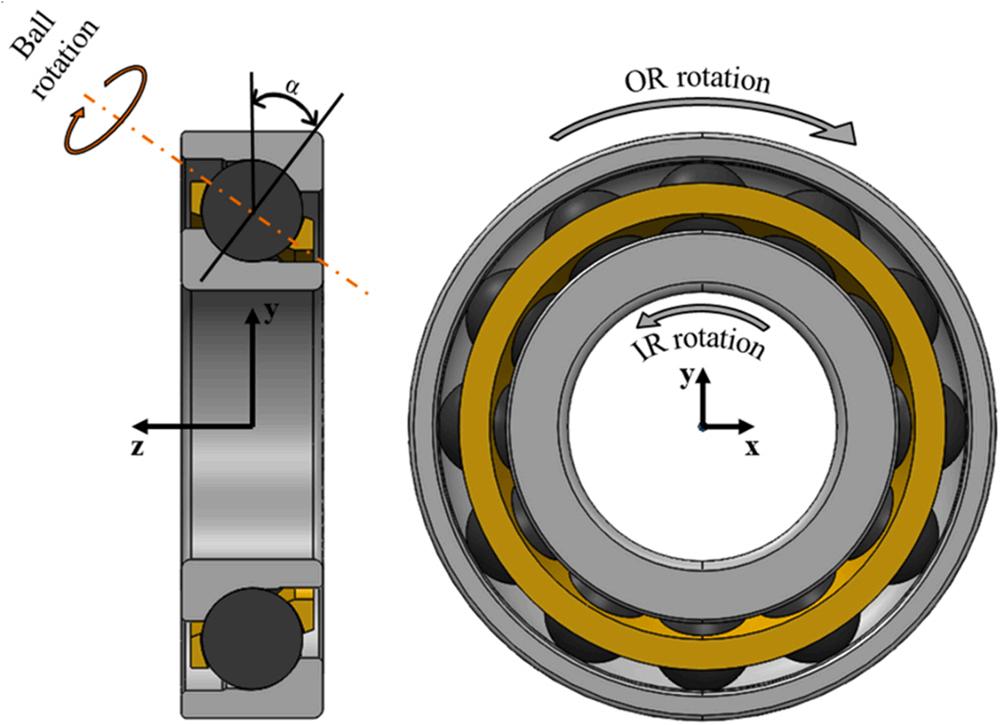
Bearing kinematics assuming no-slip boundary conditions were utilized to determine the relative motion of the bearing races and the balls. The effects of relative slip between the balls and raceways can be incorporated, though small amounts of slip are not expected to have a significant impact on the surrounding oil flow and were neglected in this investigation. The rotational velocities of the IR and OR were prescribed about the bearing’s center of rotation as represented in Fig. 5. The velocity of the ball can be expressed in terms of the IR and OR velocities [45]:
ωball = (ωOR ωIR 2 )( de dball dball de cos 2 (α)) (3)
where α is the contact angle of the bearing, dball is the ball diameter and de is the bearing pitch diameter. The rotational velocity for the ball calculated from Eq. (3) was assigned as a boundary condition to the walls of each ball in the CFD model. The direction of the rotational axis for each ball was determined using the contact angle of the ACBB, and
the rotation was prescribed about each ball’s local center of rotation as illustrated in Fig. 5. The cage was given a fixed-wall boundary condition since the race speeds were selected such that the cage remained stationary. Thus, the counter-rotating race velocities for zero cage velocity [45] are related as:
The top face of the bearing was specified as a pressure outlet with the gauge pressure set to zero to represent the submerged CRACTR bearing. Table 2 contains the lubricant properties of the SAE 30 motor oil used in the CFD model. The viscosity of SAE 30 motor oil at 37 ◦ C was used in the CFD model to match the experimental results obtained from CRACTR. The temperature was assumed to be constant in the CFD model and thus thermal effects were neglected. It is to be noted that the positions of bearing components were fixed, and all walls were considered rigid in the model. Elastohydrodynamic lubrication aspects of the ball bearing are beyond the scope of this investigation and were assumed to have a negligible impact on macro-scale oil flow.
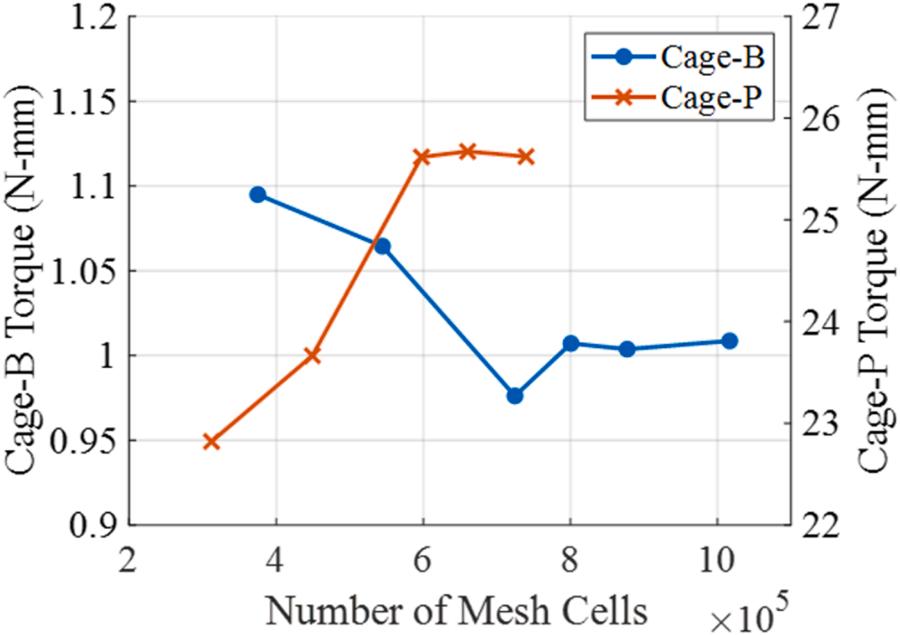
Ansys Mosaic Meshing software was used to develop an efficient polyhedral mesh. Inflation layers were used on the rolling element surface at the raceways and cage pockets to ensure that a minimum of six cells were present across each gap [14]. A mesh independence study was conducted for both cage geometries by observing the variation of torque on the cage about the axis of inner and outer race rotation for the counter-rotating case with 400 RPM IR speed and zero cage velocity with increasing mesh density. It was determined that approximately 700,000 and 600,000 cells were necessary to accurately model cage-B and cage-P, respectively. Fig. 6 depicts the mesh independence study results. Accurate geometric internal clearances for an unloaded condition were used, resulting in a gap of approximately 30 µm between the balls and raceways. The cage-B model geometry and mesh are presented in Fig. 7 to further illustrate the meshing strategy.
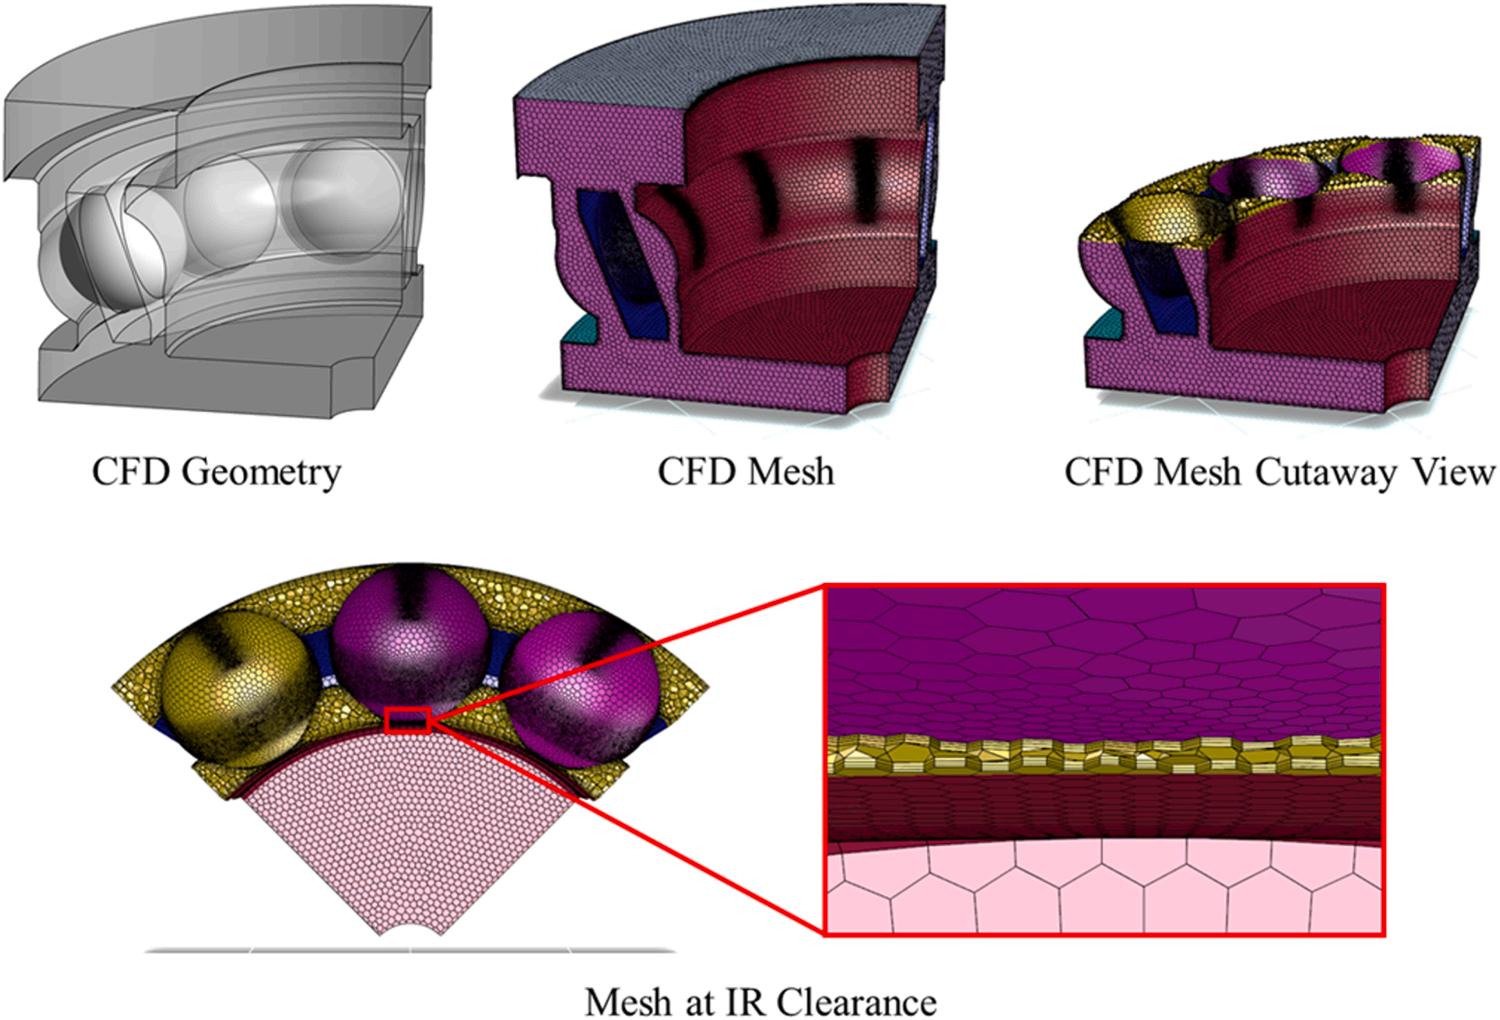
Fig. 6. CFD model mesh independence study for cage-B and cage-P geometries.
Fig. 7. Model geometry and Mosaic Mesh for the CFD model of the 7311 ACBB.
3.2. CFD solver settings
The SST k-ω turbulence model was used in the CFD model due to its ability to resolve low Reynolds number flows with complex geometries and high-pressure gradients [46–48] Mesh inflation layers were used on each wall in the CFD model to ensure y+ < 1 for proper consideration of near-wall flow at all operating conditions [49]. Additionally, the Coupled scheme was used for pressure-velocity coupling for fast convergence [50] PREssure Staggering Option (PRESTO!) and Quadratic Upstream Interpolation for Convective Kinetics (QUICK) were selected for the spatial discretization of pressure and momentum, respectively, to optimize computation for steep pressure gradients and rotating flows [50]. Under-relaxation factors were adjusted as necessary for the calculation of pressure, density, viscosity, momentum, k and ω to improve the convergence of scaled residuals [50] The model was
considered to be converged when all scaled residuals were less than 10 4 . All other settings in Ansys Fluent were left as default unless otherwise noted in the current work.
4. Results and discussion
4.1. Effect of cage geometry
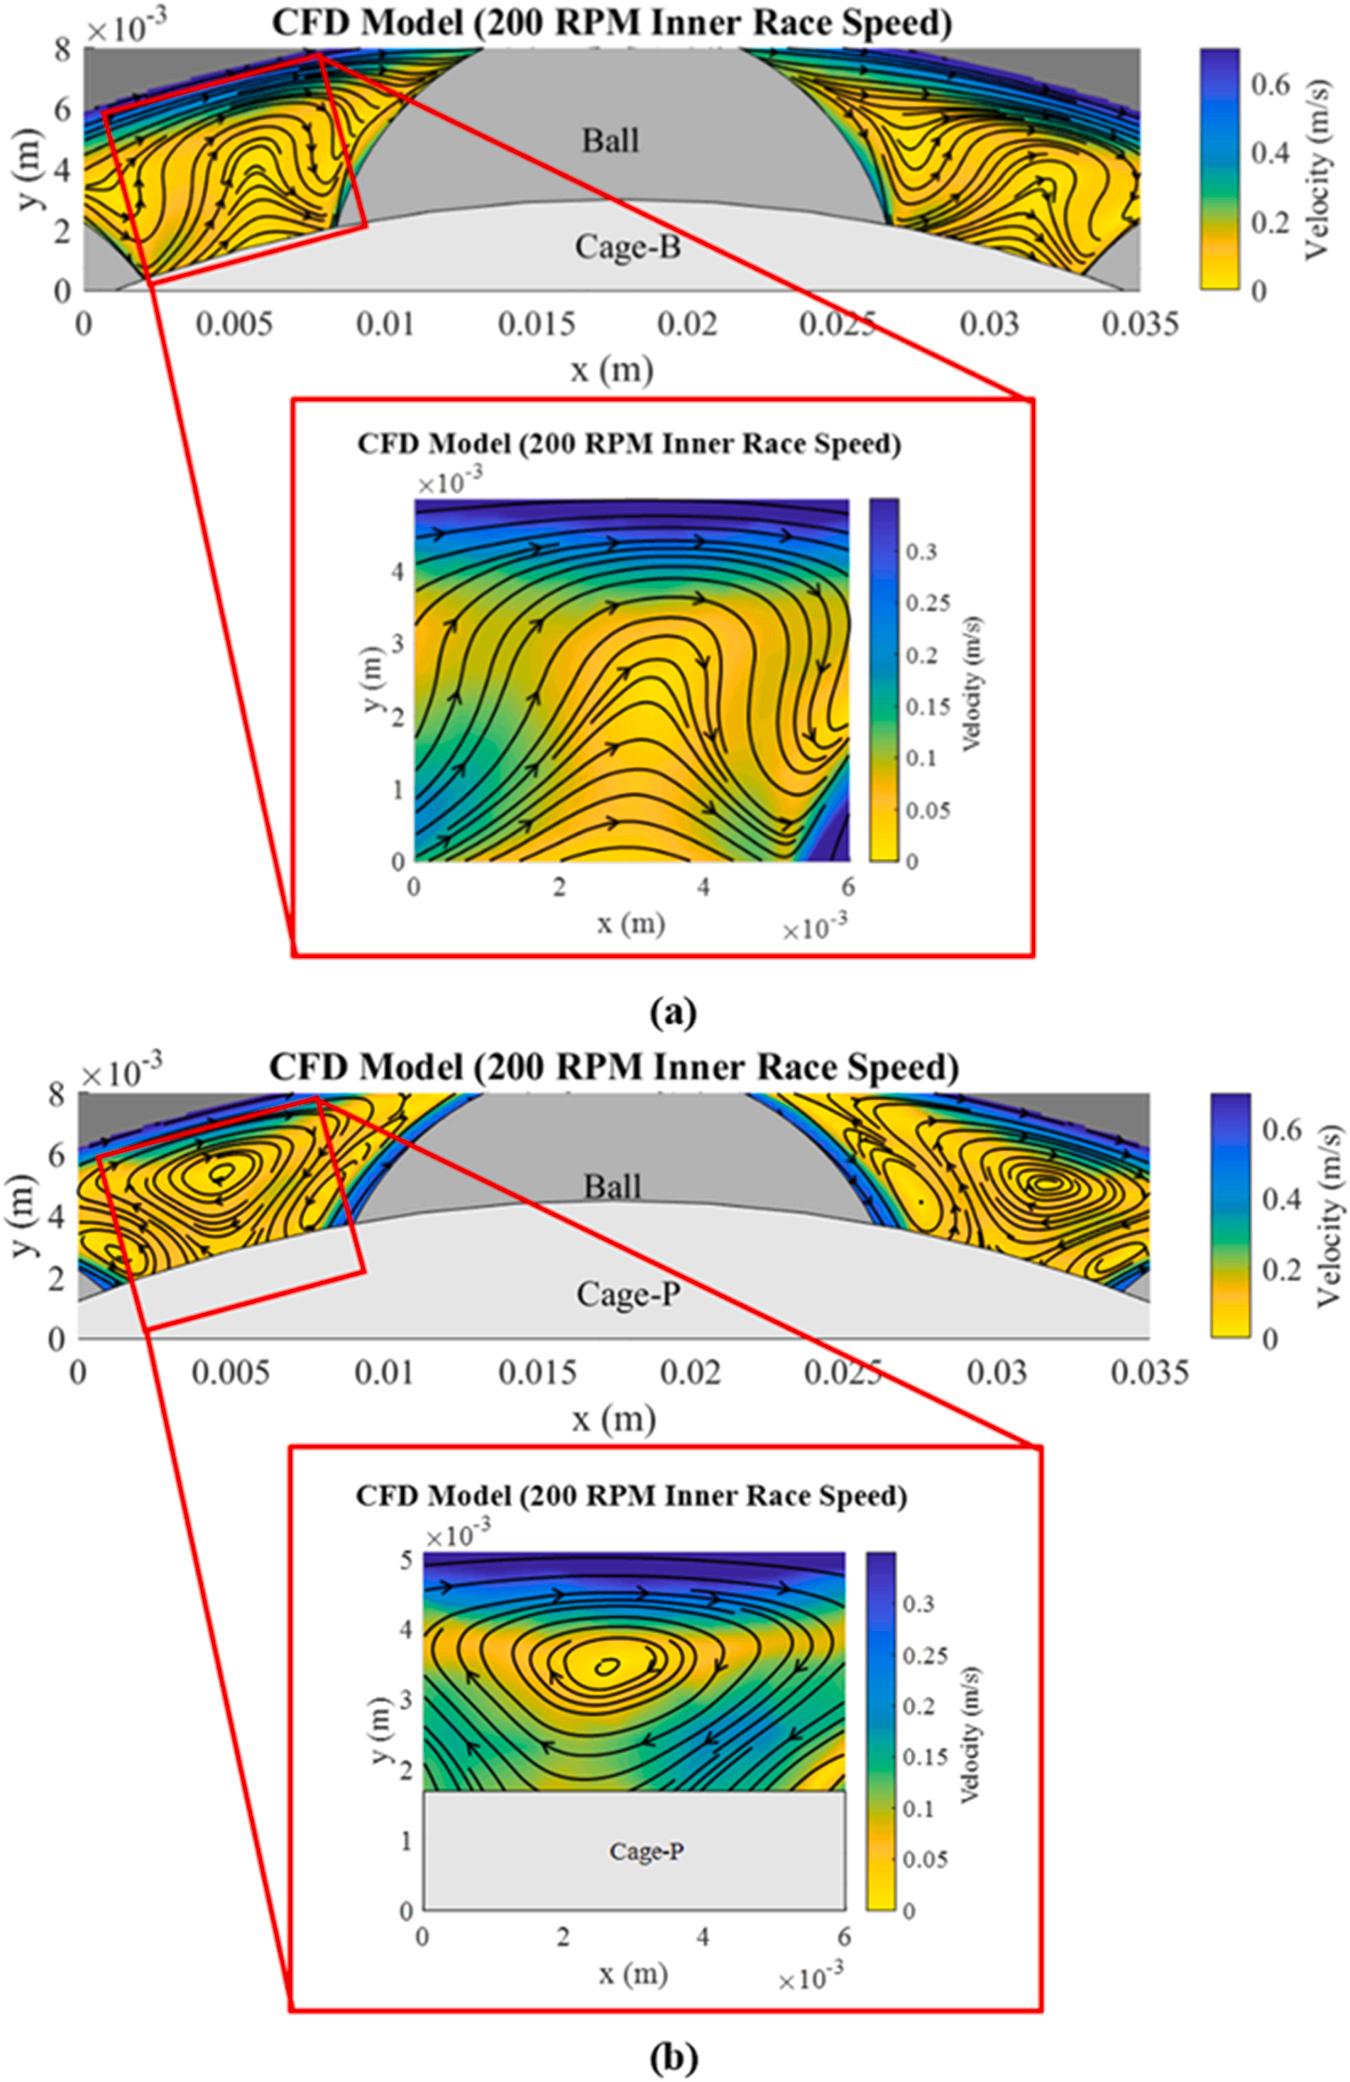
The CRACTR was used to visualize the oil flow for two different cage types to study the influence of cage pocket geometry on the oil flow streamlines in an ACBB. Apart from different cage pocket clearances, the two test cages also differ in their pocket shapes which influences the oil flow pattern inside the bearing. Fig. 8 shows an in-plane velocity magnitude contour and streamlines of oil in the region surrounding an ACBB ball between the cage and outer race, for an IR speed of 300 RPM
Fig. 8. Detail view of fluid velocity contours and streamlines in the region between cage, OR, and balls with (a) cage-B and (b) cage-P.
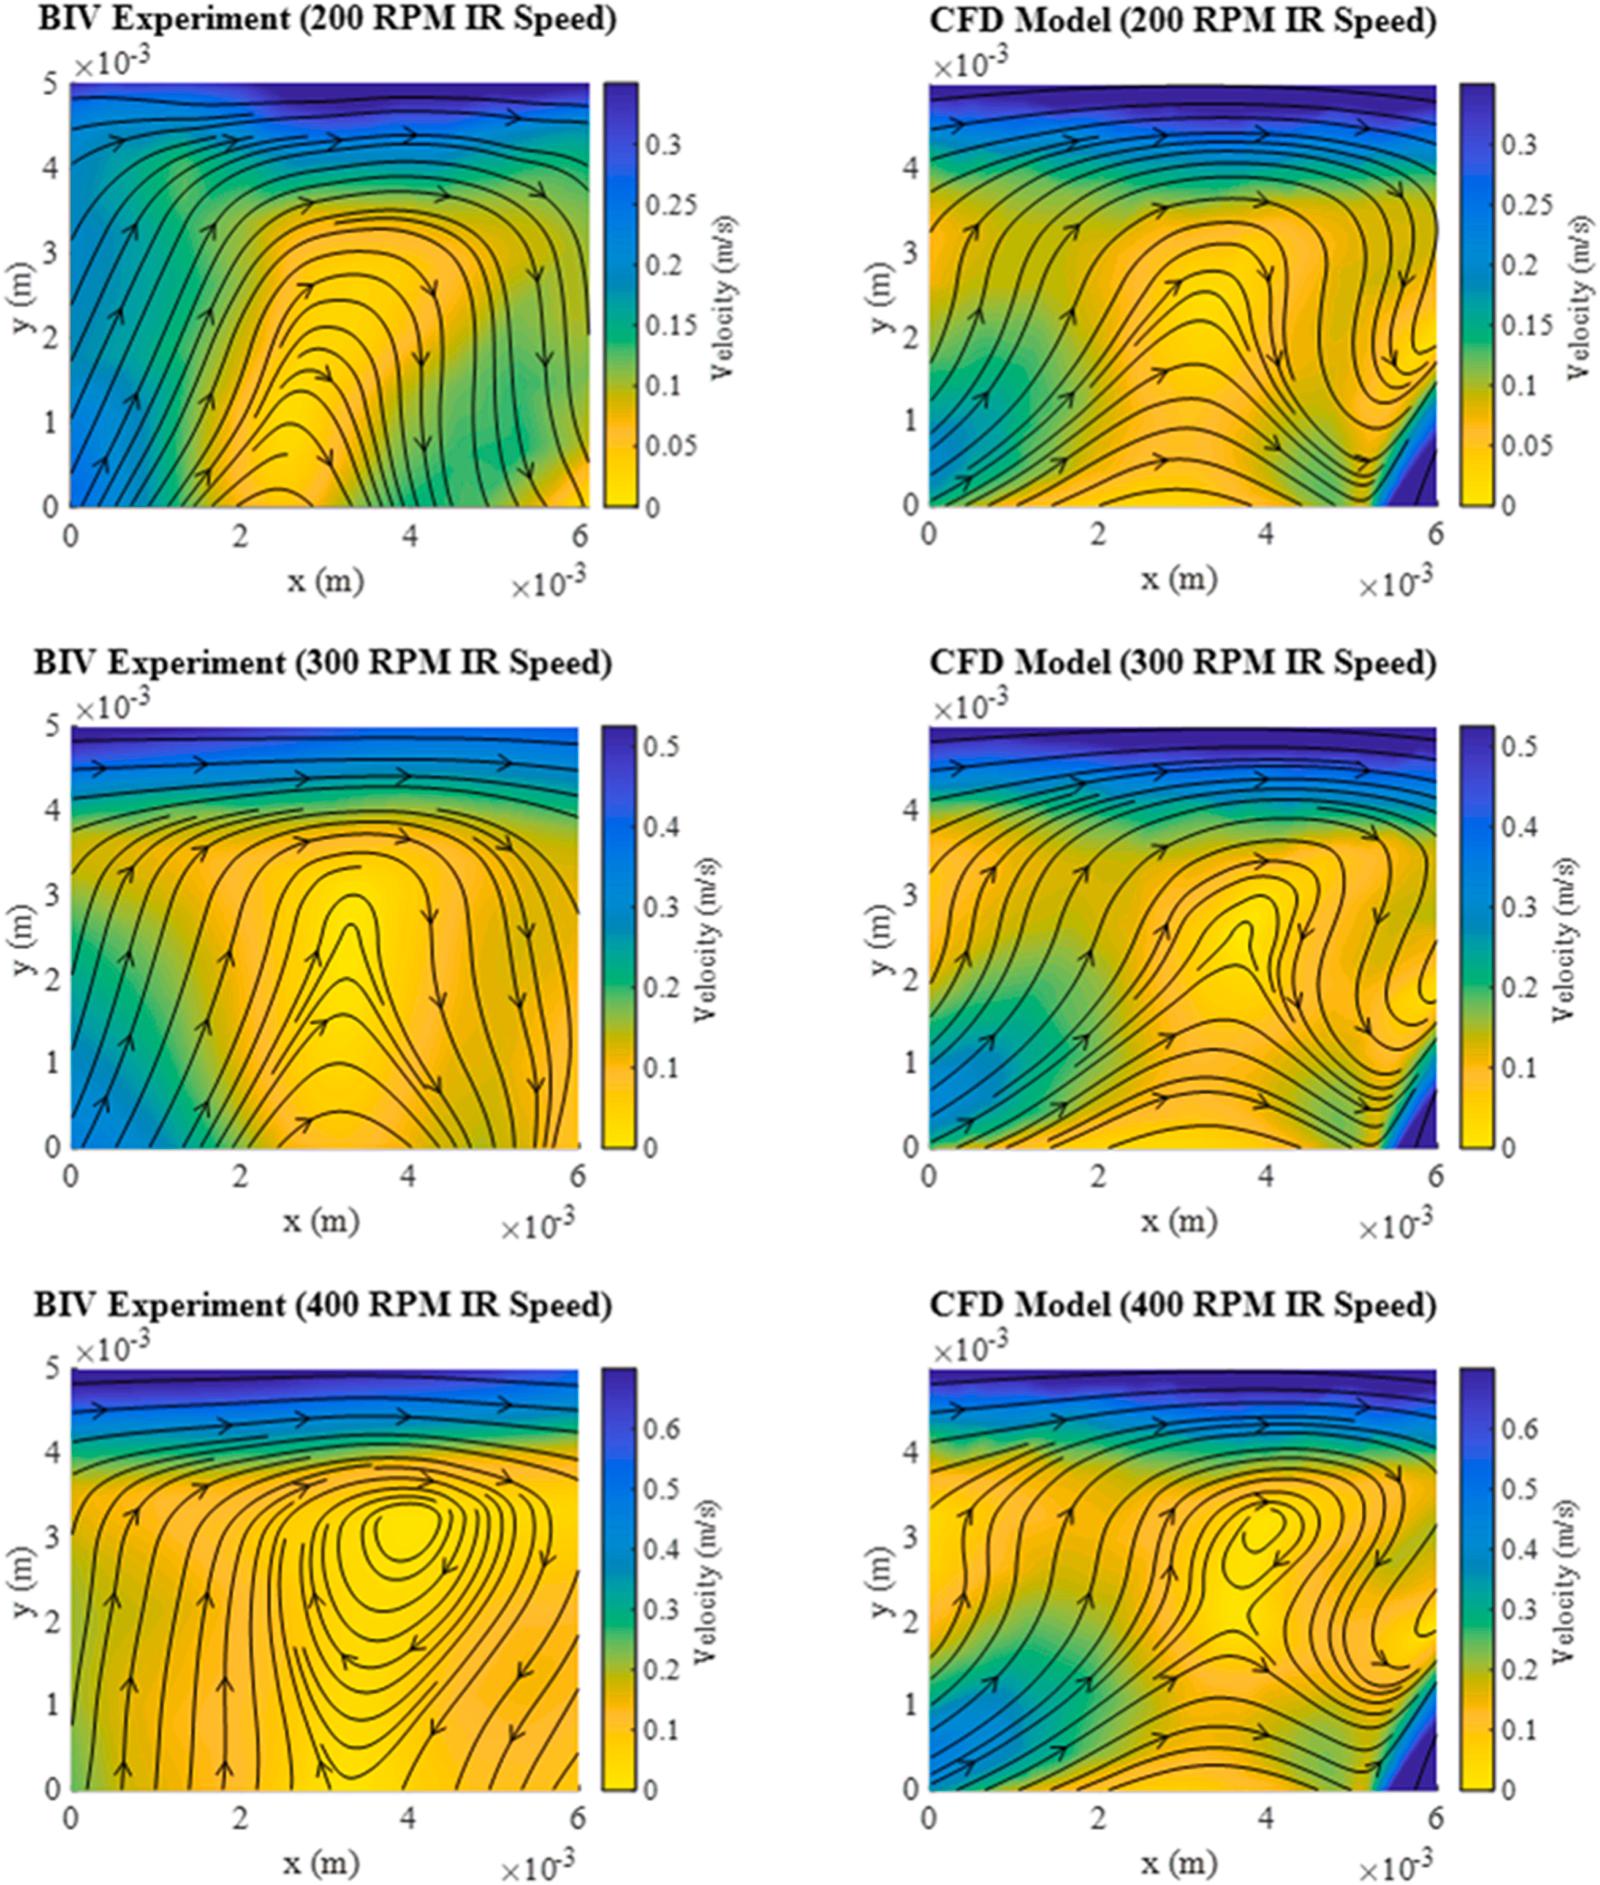
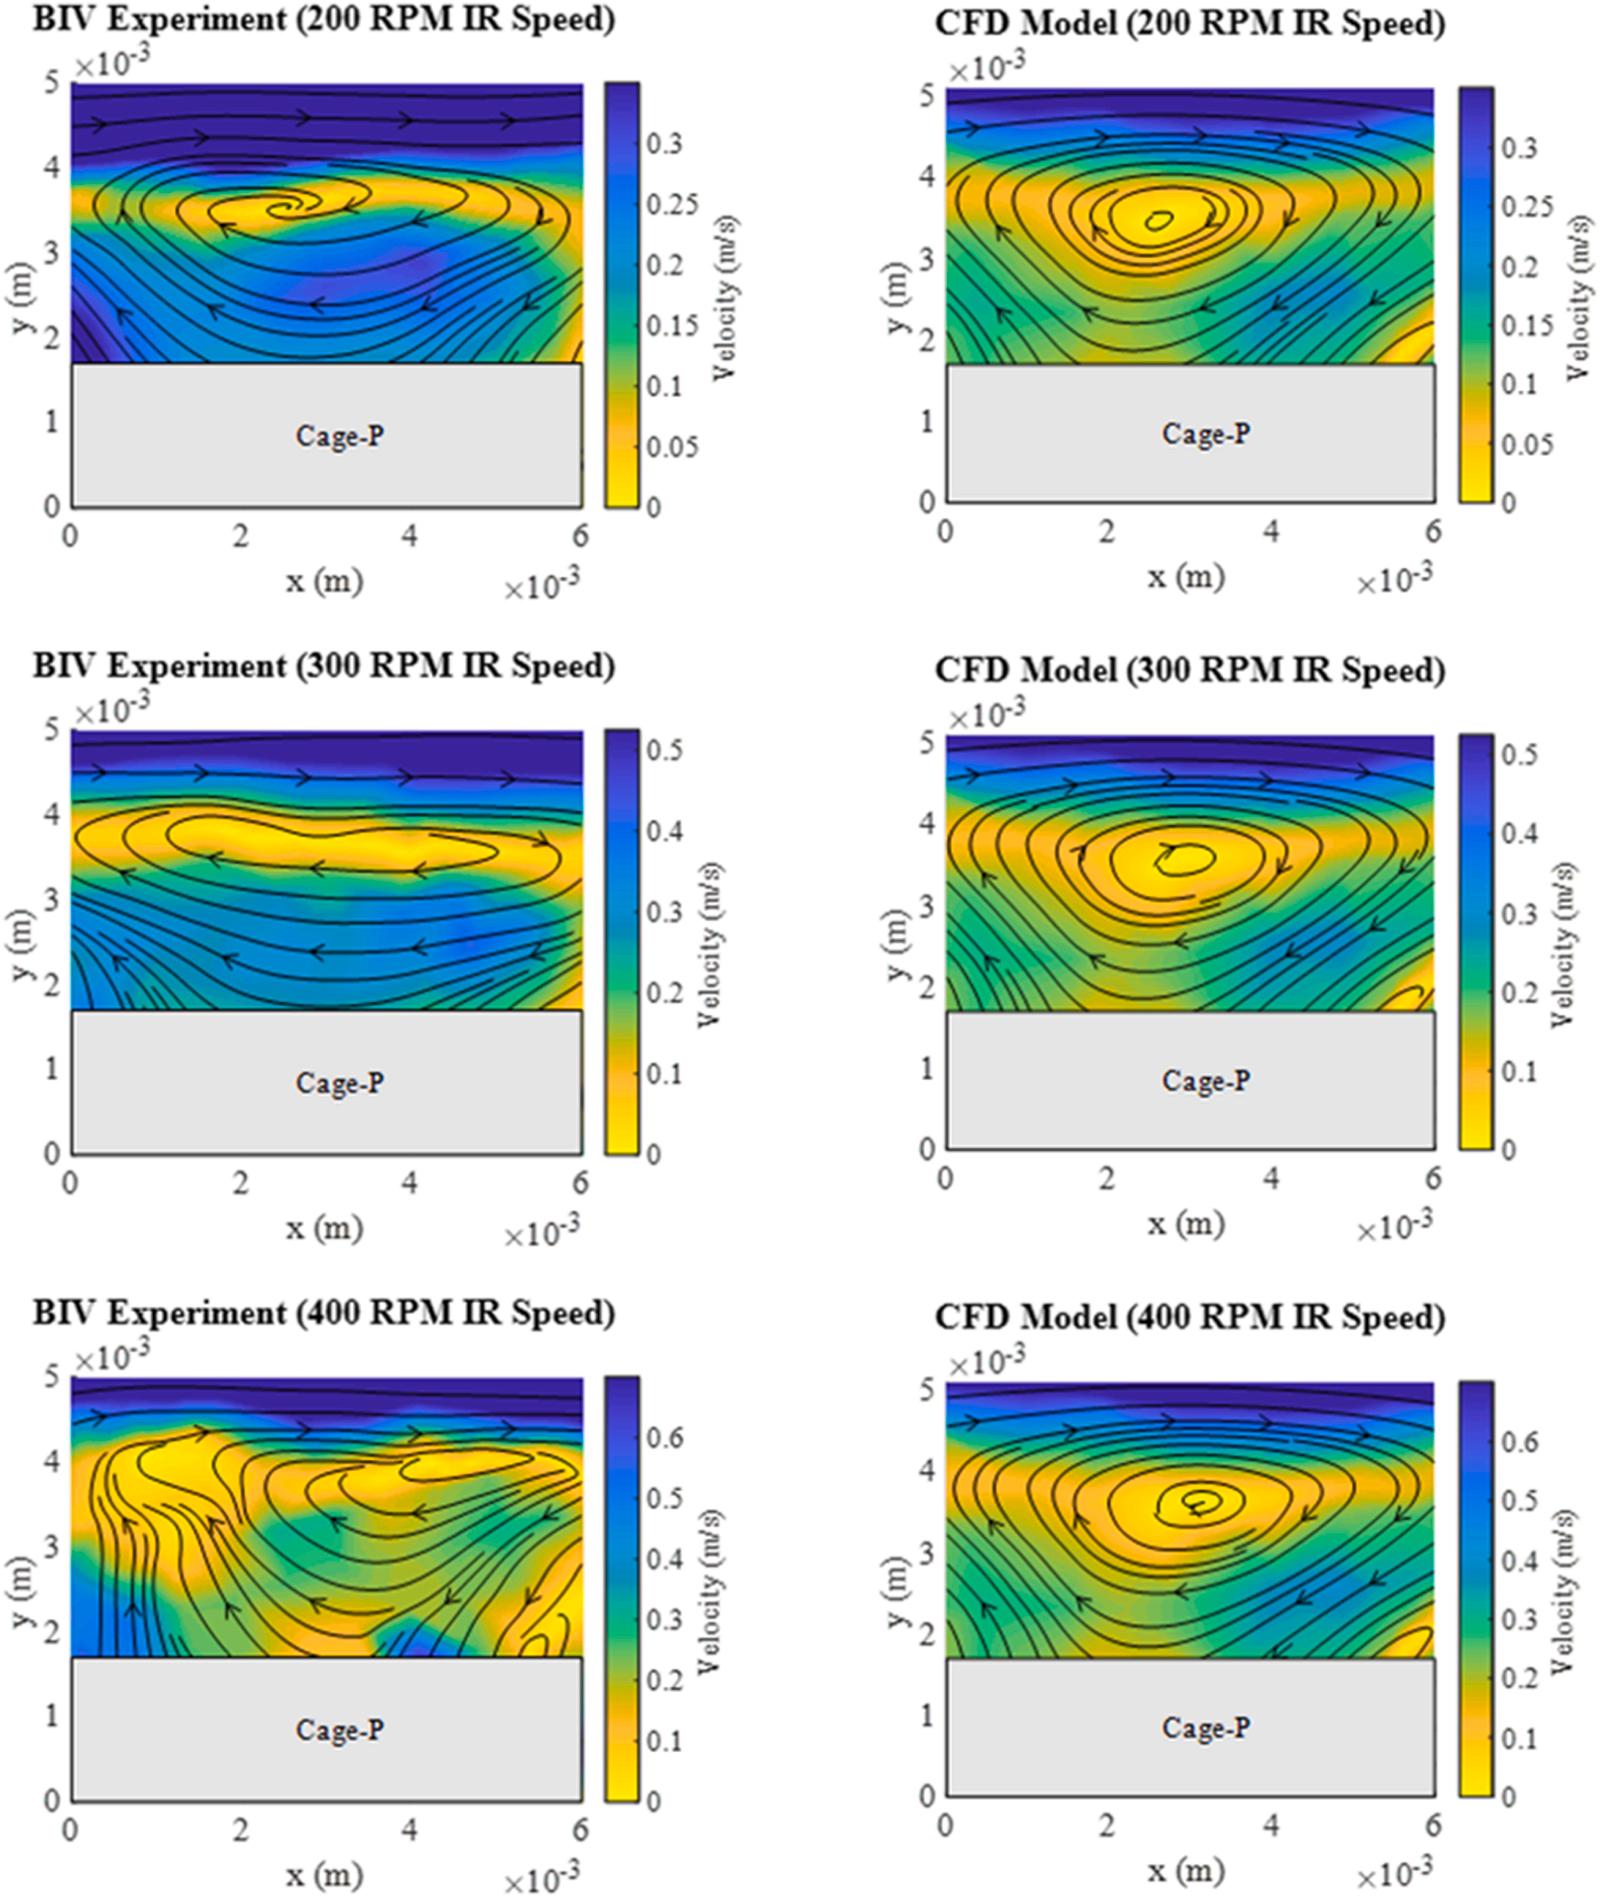
(counterclockwise) and OR speed of –207 RPM (clockwise). The region of interest between the two balls (which is visible on the CRACTR) has been magnified to further analyze the experimental and analytical results. Figs. 9 and 10 depict the oil flow streamline images for cage-B and cage-P, respectively, generated from the BIV analysis at an axial load of 2 kN and from the CFD model.
The flow streamlines in Fig. 9 with cage-B form a uniform Λ shaped pattern between each ball across all speeds tested. A growing region of recirculation was observed at the apex of the Λ shaped pattern with increasing inner race speed, consistent with the results by Yan et al. [5]. As illustrated in Fig. 4(a), cage-B has continuous inner and outer walls (parallel to the raceways) and a uniform, spherical cage pocket surface. This results in uninterrupted oil flow around this cage and produces smooth oil streamlines, similar to the observations by Peterson et al. [14] In the region between the balls, cage wall and OR (marked in Fig. 8), the velocity of the left ball directs oil toward the cage, where it is deflected toward the OR. The OR directs oil in the clockwise direction, and the right ball acts as an obstacle, directing oil back toward the cage. This results in the formation of Λ shaped oil flow pattern near the free
surface visible in the BIV experiments and from the CFD model.
On the other hand, cage-P has a non-uniform cage surface adjacent to the raceways, as shown in Fig. 4(b). The wall protrusions combined with a larger cage pocket clearance (Table 1) and higher conformity with the ball prevent lubricant from moving throughout the bearing as observed with cage-B. This results in an irregular flow between the cage pockets, as depicted in the oil flow analysis from the BIV measurement and the CFD model in Fig. 10 This cage also has a slightly larger diameter than cage-B (Table 1), which results in a smaller space between the cage wall and the OR. The protrusions on the walls of cage-P adjacent to the OR obstruct the streamlined flow leaving the ball’s surface, creating local recirculation regions between each ball. These factors result in the formation of vortices in the region between two balls as represented in Fig. 10 With increasing speeds, the recirculation pattern remained nearly the same as observed by both the BIV analysis and the CFD model for cage-P. However, higher speeds lead to more chaotic fluid motion between the two balls, leading to the interaction of these recirculating patterns, and the formation of secondary vortices, as evident in the bottom right corner of the 400 RPM IR speed case for this cage.
Fig. 9. Comparison of fluid velocity contours and streamlines detail view between experimental BIV measurements and CFD modeling results using cage-B for increasing race speeds. U.
Fig. 10. Comparison of fluid velocity contours and streamlines detail view between experimental BIV measurements and CFD modeling results using cage-P for increasing race speeds.
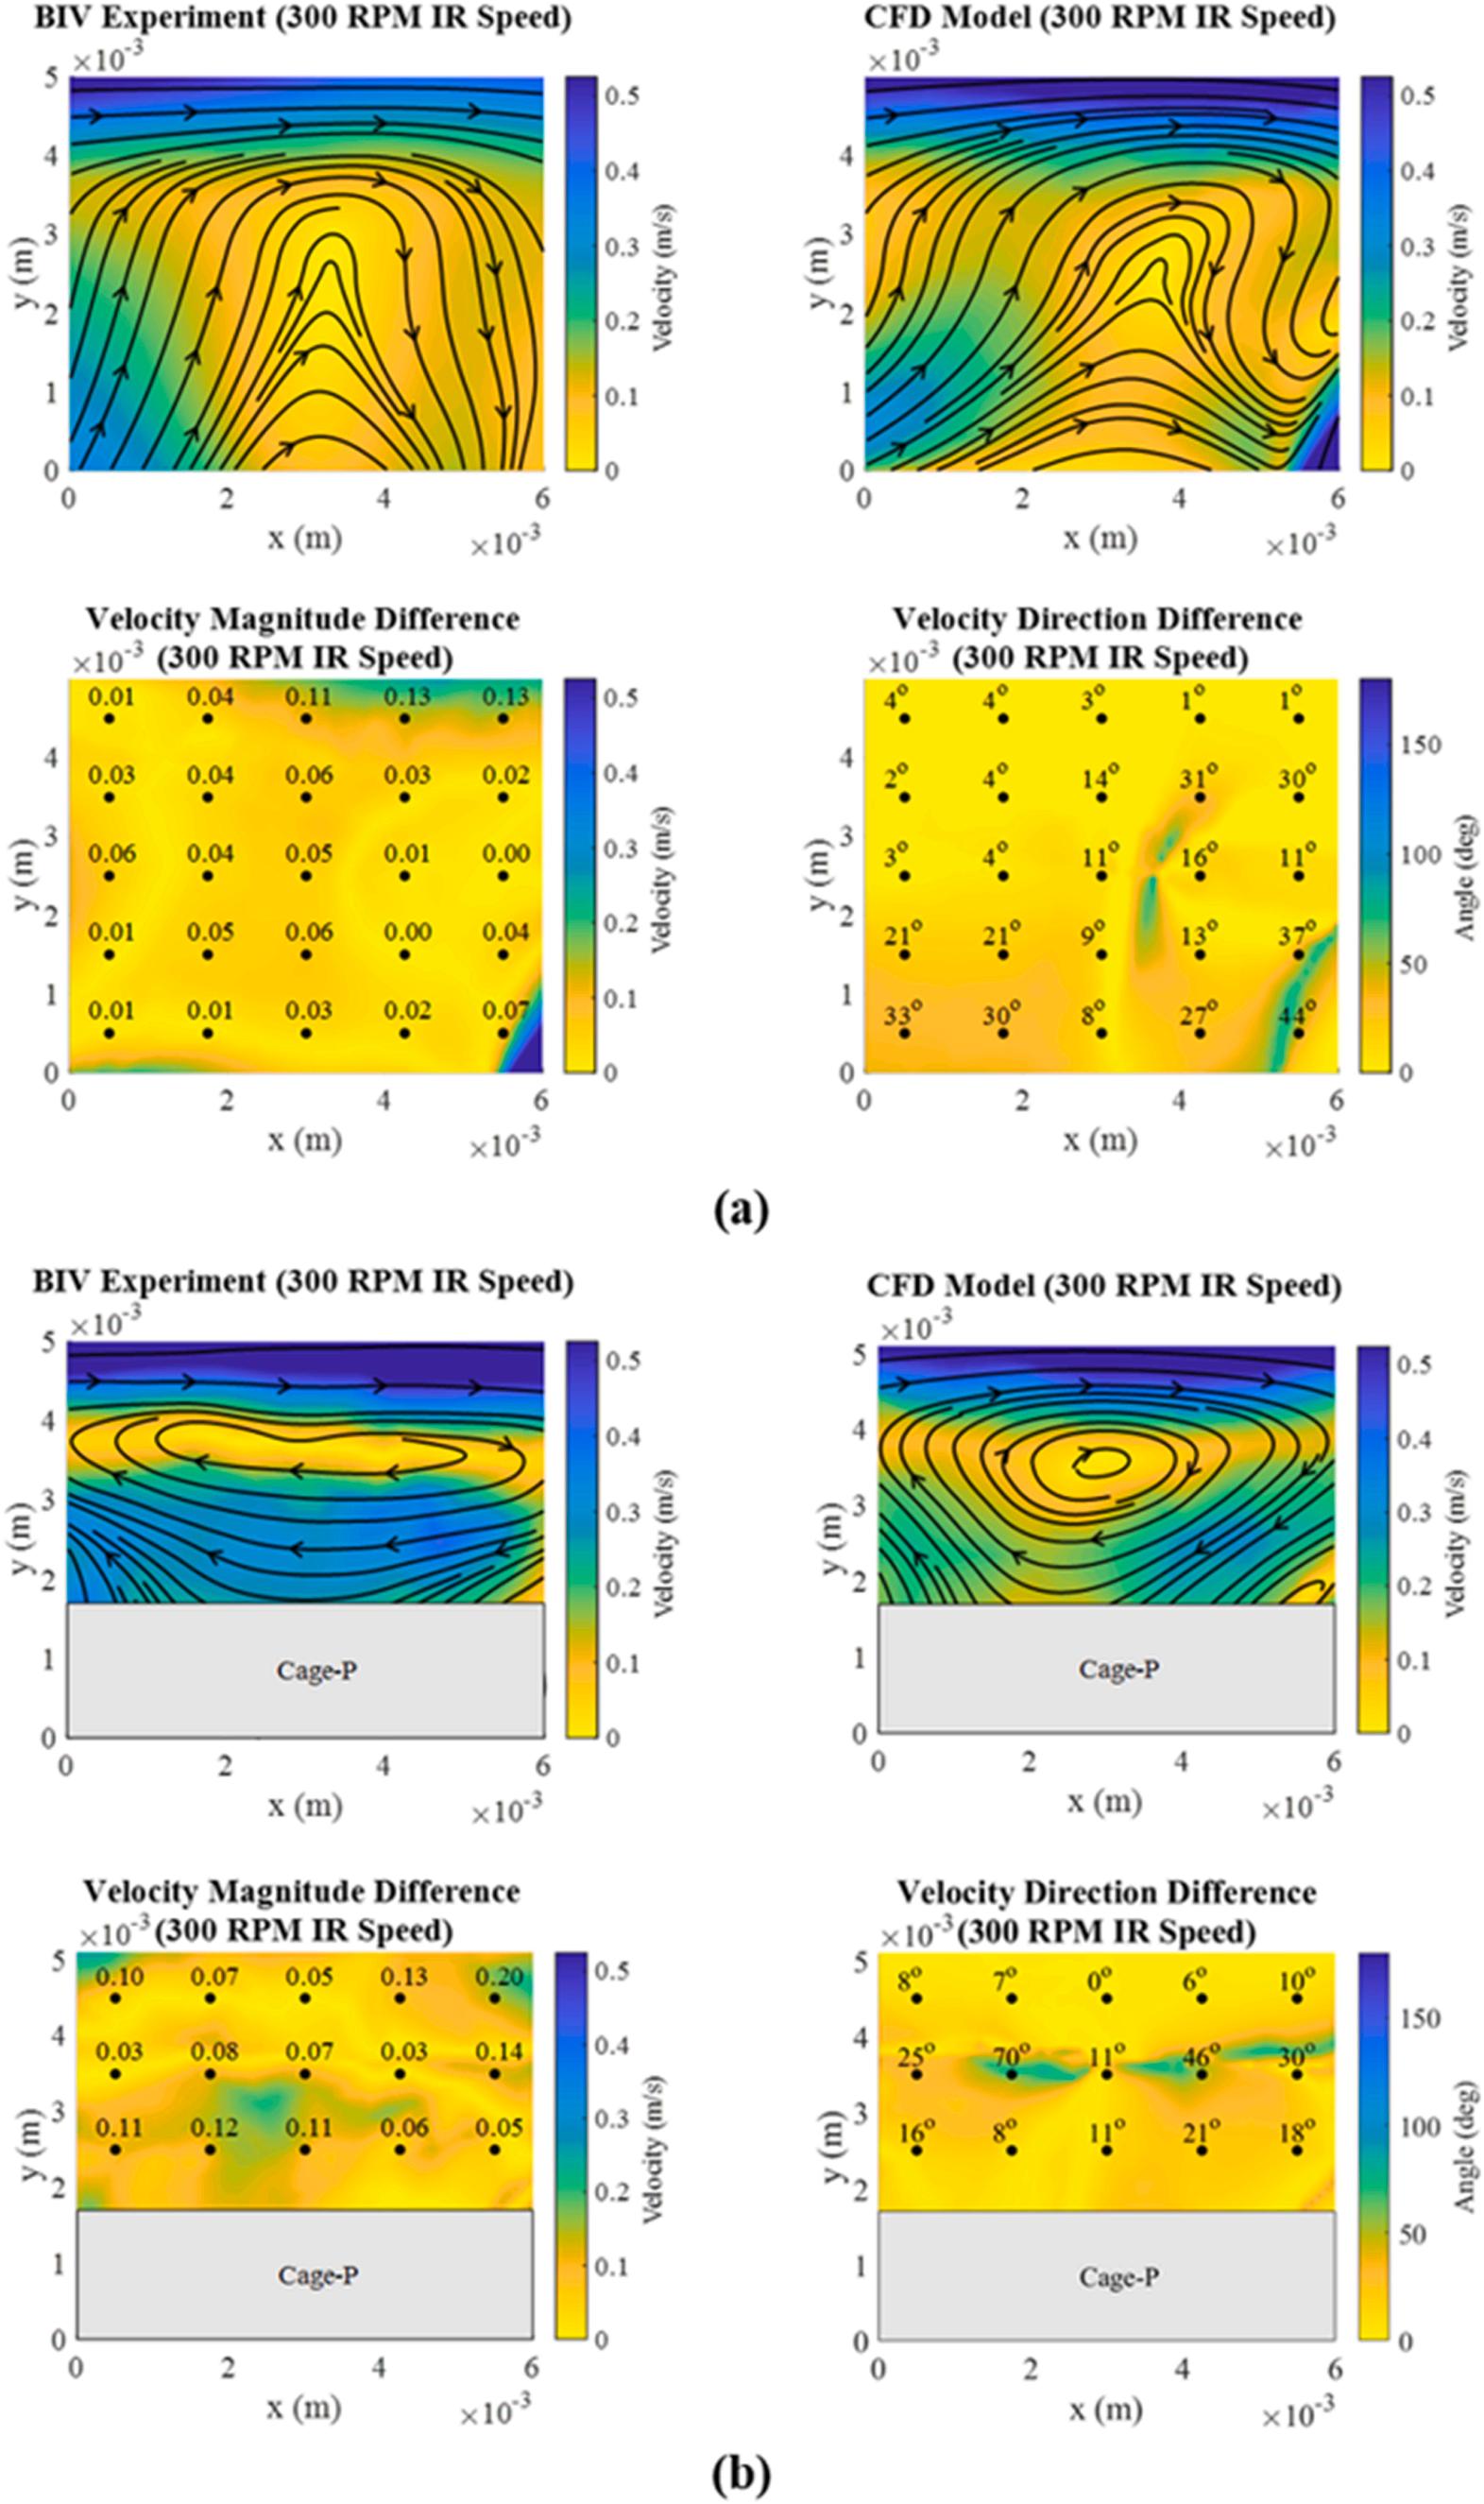
Fig. 11. Visualization of error between experimental BIV measurements and CFD modeling results for race speeds of IR: 300 RPM and OR: –207 RPM using (a) cage-B and (b) cage-P.
Table 3
Average magnitude and direction difference between BIV and CFD results.
300
400
4.2. CFD validation
The developed CFD model was used to simulate the same conditions as the experimental results obtained from CRACTR. The results obtained from the CFD model are in good agreement with the BIV measurements. Fig. 11 shows the differences in magnitude and direction of the in-plane velocity vectors obtained from the BIV measurement and the CFD model for both cages for the case of 300 RPM IR speed. A selection of points in Fig. 11 was used to compute the absolute velocity magnitude difference between BIV and CFD results according to Eq. (1) and the direction difference according to Eq. (2) Table 3 summarizes the average difference in the magnitude and direction of these velocity vectors for the different speeds. Velocity vector direction between experimental and analytical results was observed to have a good correlation across the range of speeds tested for both cages. Velocity magnitudes were found to agree well between experimental and analytical results with cage-B, and fair agreement was observed with cage-P. It is also noted that cage-B velocity magnitudes suffered higher deviation between experimental and analytical results with increasing speed. This can be attributed to higher aeration in the oil at higher speeds affecting the bulk oil properties which were not captured by the single-phase CFD model [17,30] Overall, the validated CFD model can be used to run a variety of test conditions in a reasonable time including higher bearing operating speeds, though results at higher speeds should be considered with caution.
4.3. CFD analysis
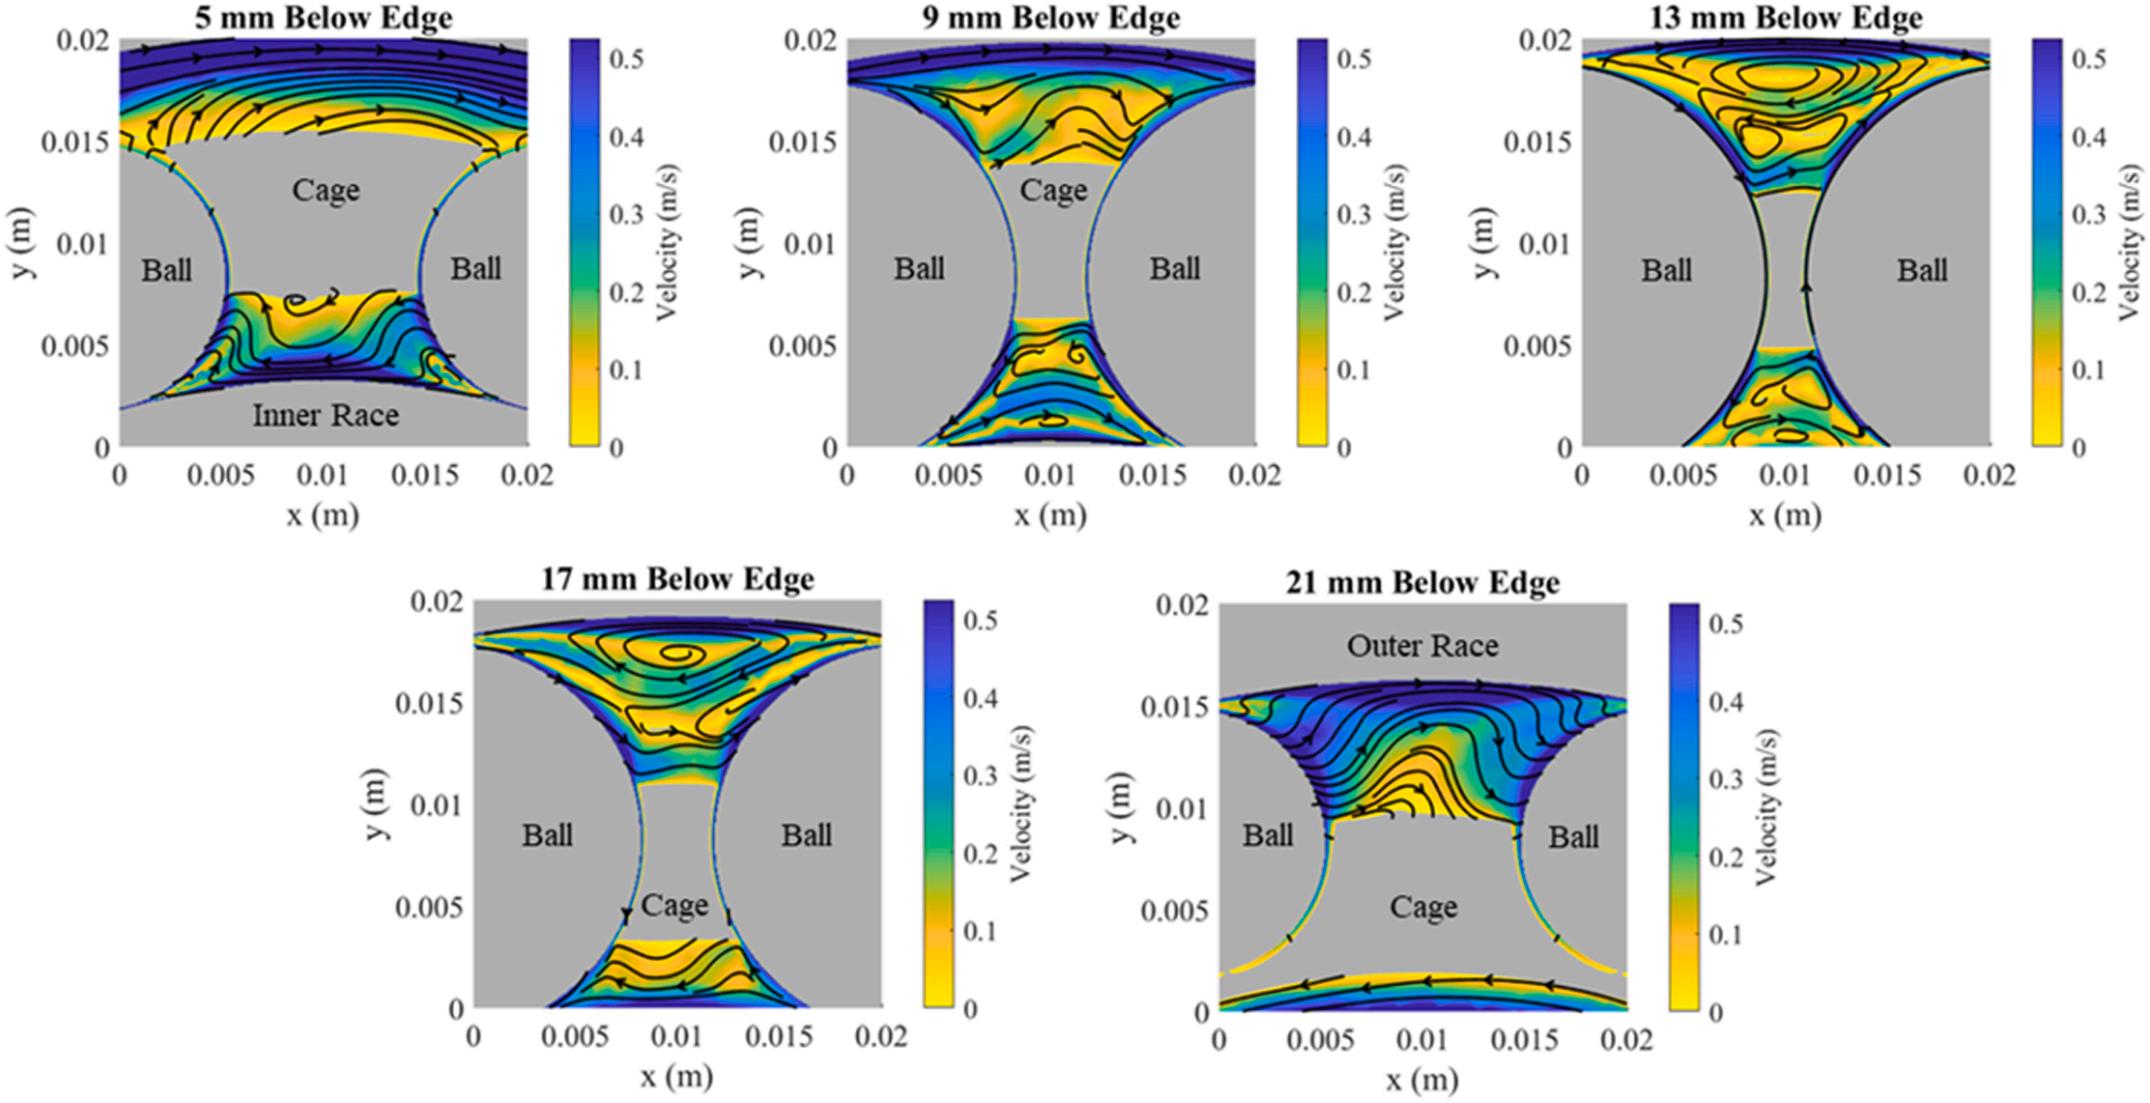
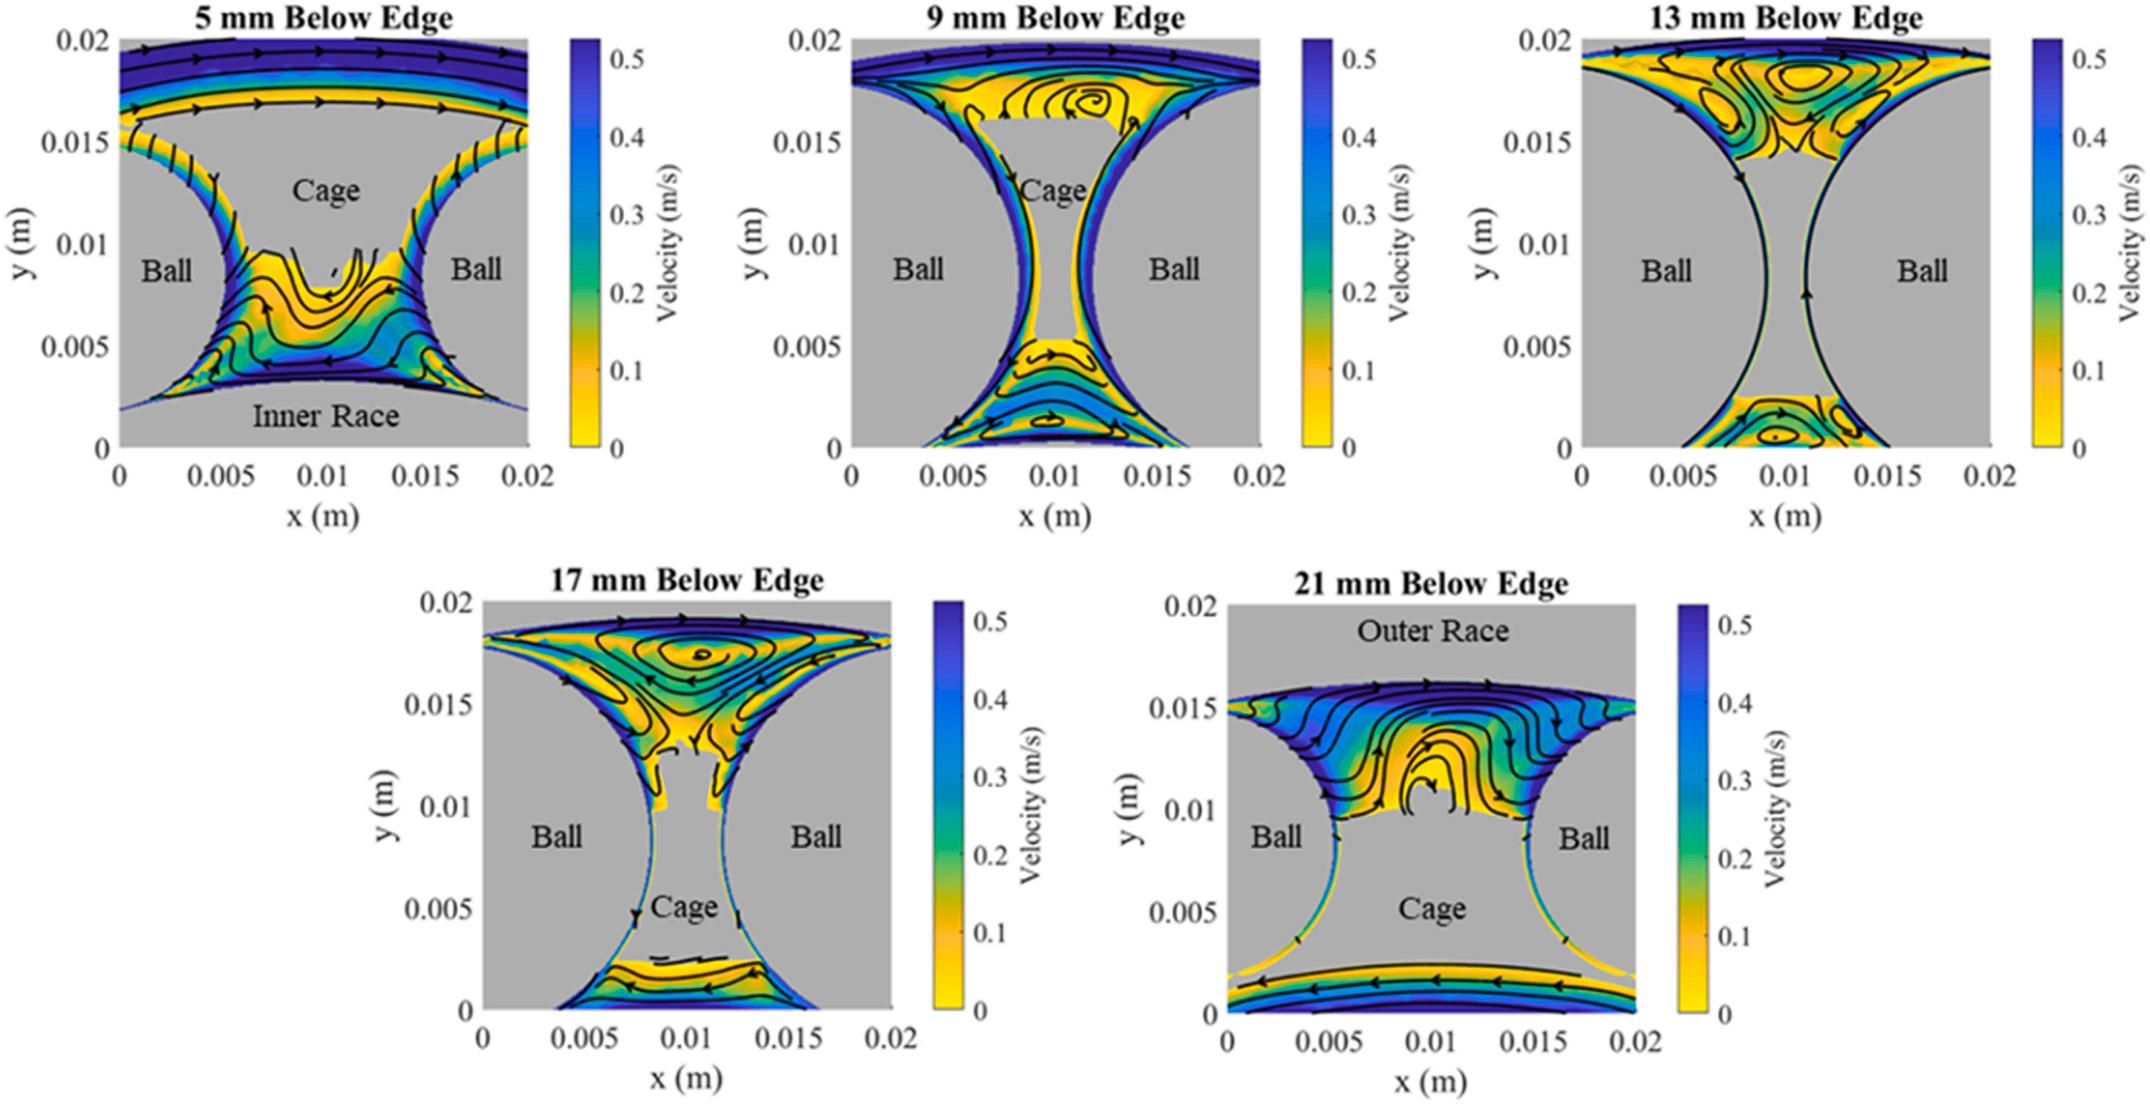
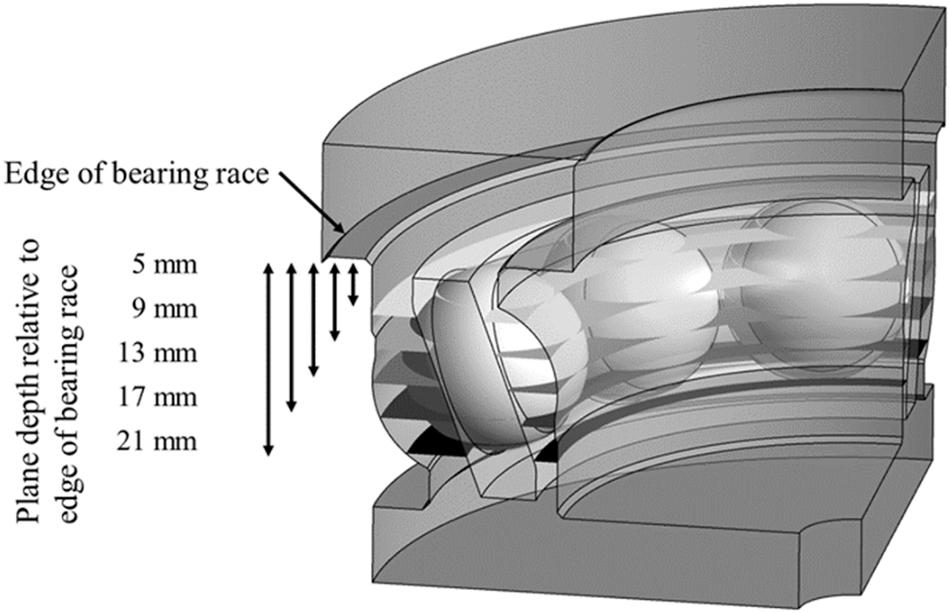
Based on the validation of the CFD model with experimental BIV measurements, the CFD model was used to further analyze the flow characteristics of the ACBB at various planes within the bearing. Fig. 12 illustrates the cutting planes used for visualization. Figs. 13 and 14 depict in-plane oil flow velocity magnitude contours and streamlines at the cutting planes for cage-B and cage-P, respectively. Both cage geometries produced strong recirculation patterns between rolling elements near the centerline of the bearing, between 13 mm and 17 mm below the top edge of the outer race in the current orientation. This is due to the rolling elements having very small clearances with the raceways at these planes, creating nearly sealed regions of oil. The recirculation and low fluid velocity at this range of depths within the bearing suggest that oil is trapped in this region, making it readily available for cage pocket lubrication. At planes further from the center of the bearing, such as 5 mm and 21 mm below the edge of the outer race, there is a larger clearance between the balls and the raceway. This provides less obstruction to the flow of oil and recirculation patterns were not observed. The visible protrusions of cage-P at the planes 5 mm and 21 mm below the edge of the outer race appeared to reduce oil velocity when compared to cage-B, helping retain oil near the cage. This further substantiates the effect of the shape of the cage wall on the oil flow
inside the bearing chamber. While the current investigation considers a stationary cage reference frame for convenience, it is to be noted that similar fluid flow is expected relative to the rotating cage reference frame in a conventional bearing configuration where the OR is fixed, and the IR rotates.
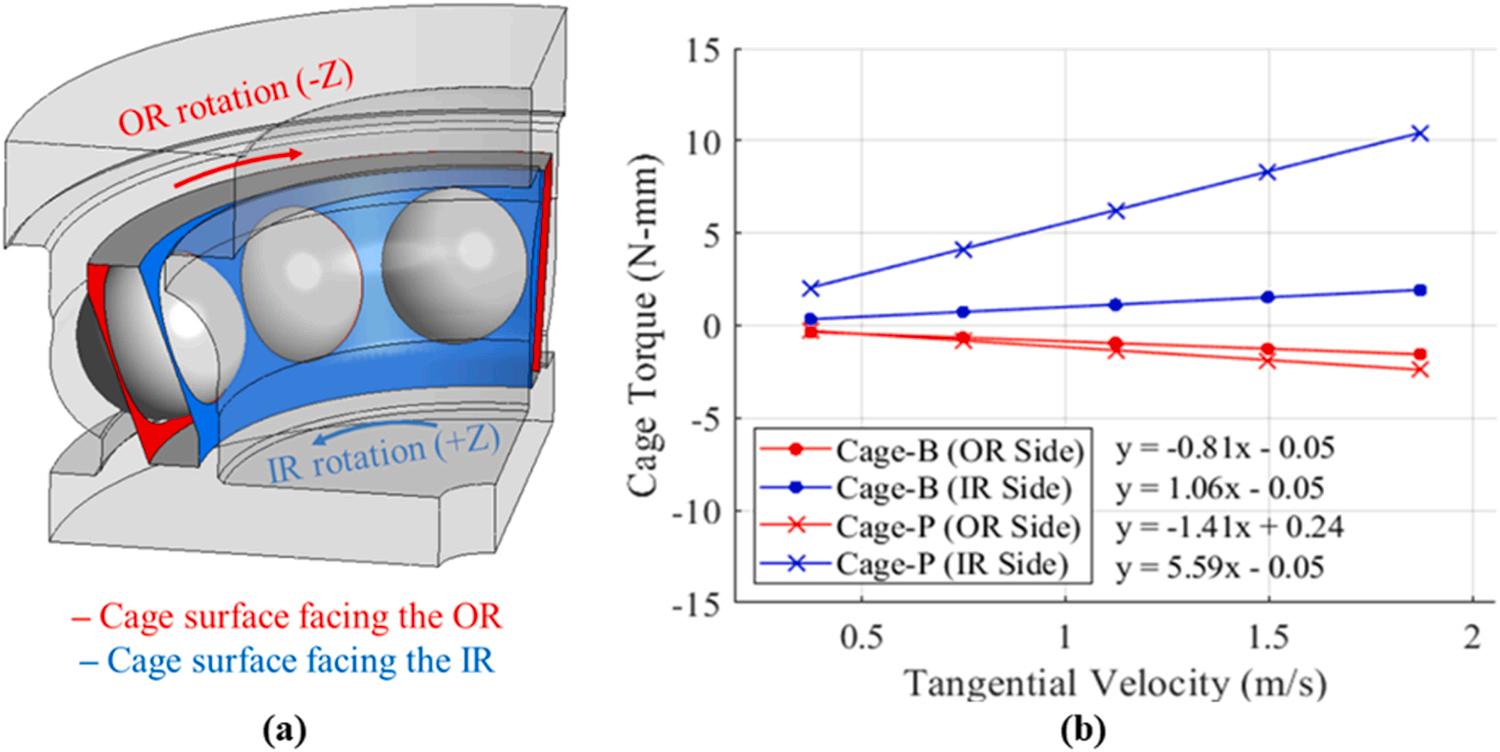
The CFD model was also utilized to compare the fluid drag torque for both the cage types by integrating the wall shear stress and pressure acting perpendicular to the axis of rotation on the faces of the cage that align with the raceways (neglecting the cage pockets). Fig. 15 presents the variation in drag torque with the tangential velocity of the oil flow for both cages from the CFD model in the counter-rotating configuration. The fluid drag torque in Fig. 15 is split into contributions from the IR side of the cage (highlighted blue) and the OR side of the cage (highlighted red). The magnitude of fluid drag torque was observed to increase linearly with increasing fluid flow velocity for both cages. It is to be noted that the torque acting on the OR side of both cage designs is negative (in the direction of OR rotation), while the torque on the IR side is positive (in the direction of IR rotation). Cage-B had nearly equal contributions of IR-driven and OR-driven fluid drag torque due to the similarity in the cage’s smooth surfaces facing the raceways. Conversely, cage-P was found to have a higher value of drag torque compared to cage-B and also a much higher contribution of IR-driven drag torque compared to OR-driven drag torque. This indicates that fluid drag for cage-P was more strongly influenced by the inner race than the outer race.
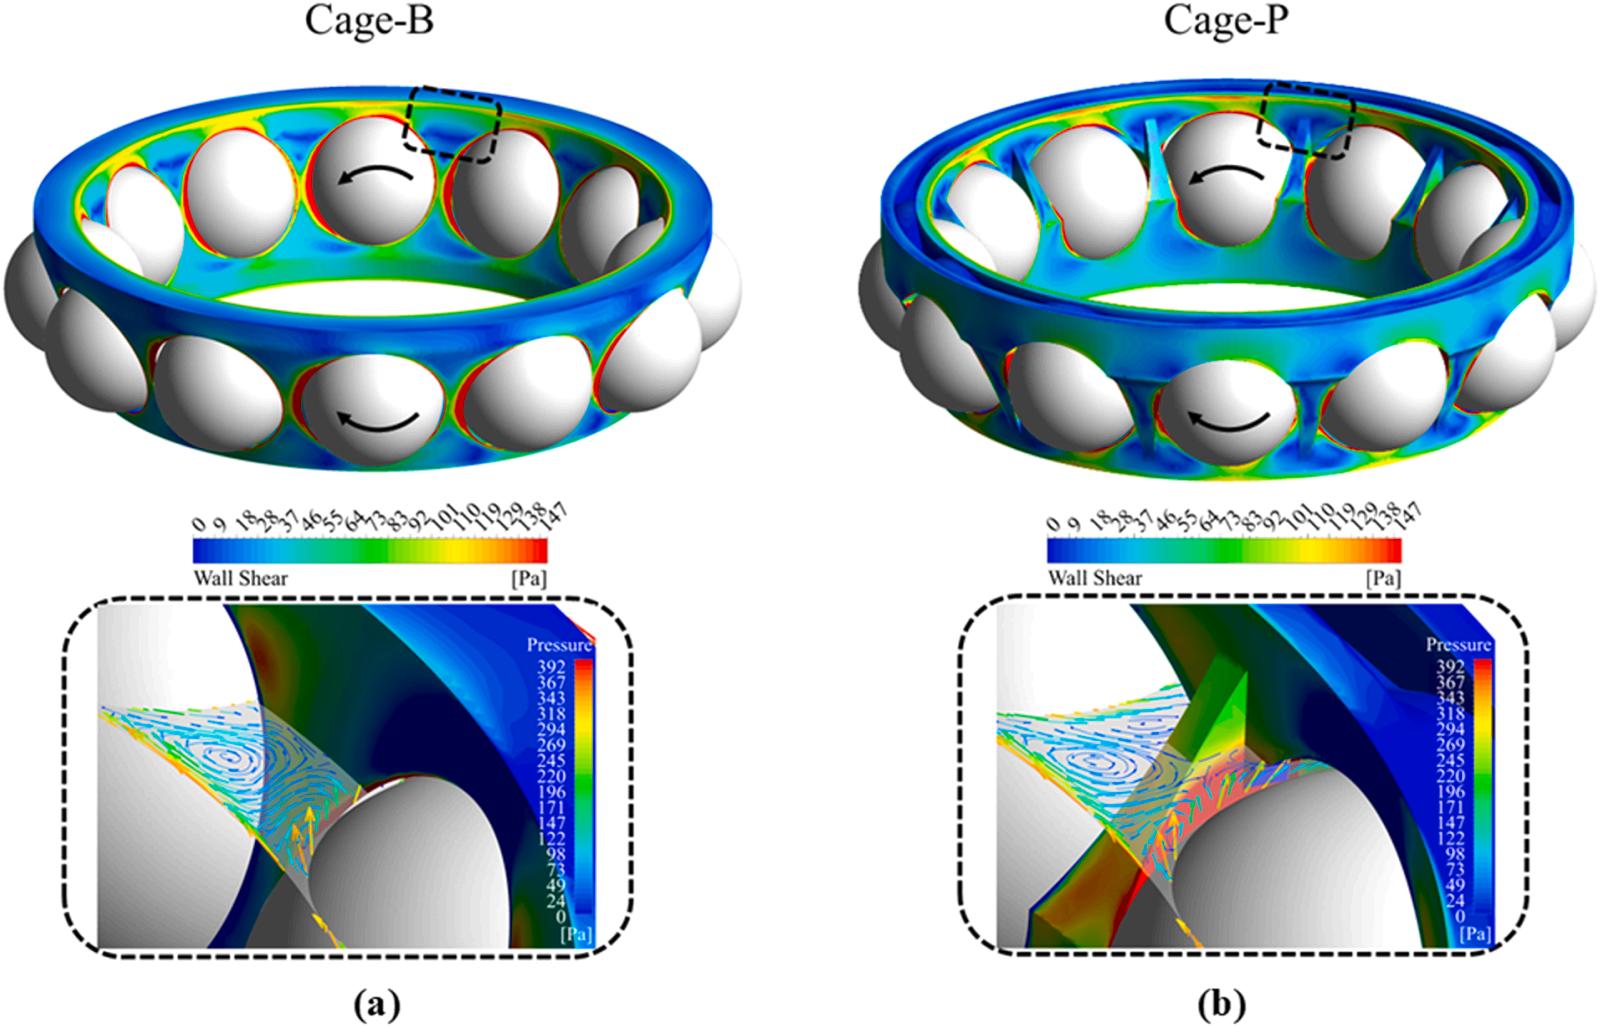
Wall shear and pressure contours over the cage surface are presented in Fig. 16 A post-processing technique was used to visualize the entire bearing geometry by repeating the results from the CFD model with periodic boundary conditions. Wall shear concentrations were observed on the protrusions of cage-P near the IR and OR, appearing to be more prominent near the IR. This observation was consistent with the low oil velocity observed near the same protrusions in Fig. 10 While it may appear that cage-P is less efficient than cage-B due to its angular geometry, it is to be noted that bearing fluid drag is complex and can produce secondary effects that influence bearing operation. For example, in a conventional fixed OR configuration, the higher influence of the IR rotation on the fluid drag of cage-P is expected to push the cage against the balls in the direction of IR rotation. This could subsequently affect cage dynamics and the expected cage whirl as investigated previously [39] It is therefore recommended that the presented CFD modeling techniques are considered in future cage design optimization. CFD can be used to help prioritize desired outcomes such as cage stability, reduced fluid drag or direction of oil flow in the design process while minimizing adverse effects.
Fig. 12. Planes used to visualize oil flow at different depths of the ACBB chamber from the CFD model.
U. Arya et al.
13. CFD modeling in-plane velocity contours and streamlines at different planes for counter-rotating case with race speeds of IR: 300 RPM and OR: –207 RPM using cage-B.
14. CFD modeling in-plane velocity contours and streamlines at different planes for counter-rotating case with race speeds of IR: 300 RPM and OR: –207 RPM using cage-P.
Fig.
Fig.
5. Summary and conclusion
This paper presents an experimental test rig and an innovative measurement technique using Bubble Image Velocimetry (BIV) for studying the complex oil flow inside the REBs. The bubbles generated due to self-aeration during the bearing operation were captured using high-speed videography and were used to track the oil flow inside an ACBB. Results from the BIV measurements were used to study oil flow and validate a CFD model of the experimental setup. The following conclusions have been drawn from this investigation:
(i) Experimental and analytical results showed Λ shaped oil flow patterns between rolling elements with the brass cage geometry (cage-B) due to smooth cage walls, while recirculating oil vortices formed in the same region with the plastic cage geometry (cage-
P) due to obstruction from the wall protrusions across all operating speeds.
(ii) Results from the single-phase, steady-state CFD models developed in Ansys Fluent corroborated well with the experimental results and were able to predict the oil flow streamlines between the balls for various race speeds. The oil flow streamlines became less uniform with increasing race speeds due to the increase in recirculation, particularly for cage-B.
(iii) The CFD model was also used to analyze the flow patterns at different depths into the bearing and highlight the relative fluid drag torques between the two cage types. It was determined that protrusions from cage-P perpendicular to the raceways trapped oil near the cage. Additionally, cage-P drag torque was dominated by the inner race motion while cage-B drag torque was more evenly influenced by inner and outer race motion relative to the cage.
Fig. 16. Wall shear (top) and pressure contours (bottom) for the counter-rotating case with 500 RPM IR speed, computed from the CFD model on (a) cage-B and (b) cage-P.
Fig. 15. (a) Faces highlighted on the cage to analyze the OR (red) and IR (blue) contributions of fluid torque, and (b) variation of fluid drag torque on cage-B and cage-P for various flow tangential speeds relative to the stationary cage from the CFD model.
The BIV analysis presented in this paper demonstrates the simplicity and accuracy of studying the oil flow inside a bearing by tracking the bubbles in the oil, compared to the conventional PIV techniques. Future investigations will focus on further implementation of BIV to perform oil flow analysis for different REBs.
CRediT authorship contribution statement
Ujjawal Arya: Conceptualization, Methodology, Software, Validation, Formal analysis, Investigation, Data curation, Visualization, Writing – original draft. Wyatt Peterson: Conceptualization, Methodology, Software, Validation, Formal analysis, Data curation, Visualization, Writing – original draft. Farshid Sadeghi: Conceptualization, Resources, Supervision, Project administration, Funding acquisition, Writing – review & editing. Andreas Meinel: Resources, Supervision, Writing – review & editing. Hannes Grillenberger: Resources, Supervision, Writing – review & editing.
Acknowledgements
The authors would like to express their appreciation to Schaeffler for their support of this project. Part of this paper was presented at the conference, "IndiaTrib-2022".
Declaration of Competing Interest
The author(s) declared no potential conflicts of interest with respect to the research, authorship, and/or publication of this article.
Appendix A. Supporting information
Supplementary data associated with this article can be found in the online version at doi:10.1016/j.triboint.2022.107968
References
[1] Lee S. Bearing life evaluation for automotive wheel bearings using design of experiments. Brake Colloquium & Exhibition - 36th Annual, SAE International; 2018. https://doi.org/10.4271/2018–01-1903.
[2] Numata T. Technical trends of automotive wheel bearings. Koyo Eng J E 2003;162: 32–6
[3] Fischer D, von Goeldel S, Jacobs G, Stratmann A. Numerical investigation of effects on replenishment in rolling point contacts using CFD simulations. Tribol Int 2021; 157:106858. https://doi.org/10.1016/J.TRIBOINT.2021.106858
[4] Russell T, Sadeghi F. The effects of lubricant starvation on ball bearing cage pocket friction. Tribol Int 2022;173:107630. https://doi.org/10.1016/j. triboint.2022.107630
[5] Yan K, Dong L, Zheng J, Li B, Wang D, Sun Y. Flow performance analysis of different air supply methods for high speed and low friction ball bearing. Tribol Int 2018;121:94–107. https://doi.org/10.1016/J.TRIBOINT.2018.01.035
[6] Zhang W, Paik BG, Jang YG, Lee SJ, Lee SE, Kim JH. Particle image velocimetry measurements of the three-dimensional flow in an exhaust hood model of a lowpressure steam turbine. J Eng Gas Turbine Power 2007;129:411–9. https://doi. org/10.1115/1.2431387
[7] Vasques J, Ibrahim A, Hann D, Simmons K, Walsh M. The effect of surface tension on bubble generation in gas-sheared liquid films. Proceedings of the ASME Turbo Expo 2019;5A-2019. https://doi.org/10.1115/GT2019–91303.
[8] Lee CW, Palma PC, Simmons K, Pickering SJ. Comparison of computational fluid dynamics and particle image velocimetry data for the airflow in an aeroengine bearing chamber. J Eng Gas Turbine Power 2005;127:697–703. https://doi.org/ 10.1115/1.1924635
[9] Aidarinis J, Missirlis D, Yakinthos K, Goulas A. CFD modeling and LDA measurements for the air-flow in an aero engine front bearing chamber. J Eng Gas Turbine Power 2011;133:1201–8. https://doi.org/10.1115/1.4002830
[10] Adeniyi AA, Morvan H, Simmons K. A computational fluid dynamics simulation of oil-air flow between the cage and inner race of an aero-engine bearing. J Eng Gas Turbine Power 2017:139. https://doi.org/10.1115/1.4034210/374363.
[11] Mastrone MN, Hartono EA, Chernoray V, Concli F. Oil distribution and churning losses of gearboxes: experimental and numerical analysis. Tribol Int 2020;151: 106496. https://doi.org/10.1016/J.TRIBOINT.2020.106496
[12] Lu F, Wang M, Pan W, Bao H, Ge W. CFD-based investigation of lubrication and temperature characteristics of an intermediate gearbox with splash lubrication. Appl Sci 2021;11:1–20. https://doi.org/10.3390/APP11010352
[13] Wen Y, Oshima S. Oil flow simulation based on CFD for reducing agitation torque of ball bearings. SAE Int J Passeng Cars Mech Syst 2014;7:1385–91. https://doi. org/10.4271/2014-01-2850
[14] Peterson W, Russell T, Sadeghi F, Berhan MT, Stacke L-E, Ståhl J. A CFD investigation of lubricant flow in deep groove ball bearings. Tribol Int 2021;154: 106735. https://doi.org/10.1016/j.triboint.2020.106735
[15] Deng S, Zhao G, Qian D, Jiang S, Hua L. Investigation of oil–air flow and temperature for high-speed ball bearings by combining nonlinear dynamic and computational fluid dynamics models. J Tribol 2022:144. https://doi.org/ 10.1115/1.4052965
[16] Peterson W, Russell T, Sadeghi F, Berhan MT. Experimental and analytical investigation of fluid drag losses in rolling element bearings. Tribol Int 2021;161: 107106. https://doi.org/10.1016/J.TRIBOINT.2021.107106
[17] Liebrecht J, Si X, Sauer B, Schwarze H. Investigation of drag and churning losses on tapered roller bearings. Stroj Vestn/J Mech Eng 2015;61:399–408. https://doi.org/ 10.5545/SV-JME.2015.2490
[18] Feldermann A, Fischer D, Neumann S, Jacobs G. Determination of hydraulic losses in radial cylindrical roller bearings using CFD simulations. Tribol Int 2017;113: 245–51. https://doi.org/10.1016/J.TRIBOINT.2017.03.020
[19] Raffel M, Willert CE, Wereley ST, Kompenhans J. Particle image velocimetry, vol. 2. Berlin, Heidelberg: Springer Berlin Heidelberg; 2007. https://doi.org/10.1007/ 978-3-540-72308-0
[20] Adrian RJ. Twenty years of particle image velocimetry. Exp Fluids 2005;39: 159–69. https://doi.org/10.1007/S00348-005-0991-7/FIGURES/9
[21] Wereley ST, Meinhart CD. Recent advances in micro-particle image velocimetry. Annu Rev Fluid Mech 2010;42:557–76. https://doi.org/10.1146/annurev-fluid121108-145427
[22] Grant I. Particle image velocimetry: a review. Proc Inst Mech Eng C J Mech Eng Sci 1997;211:55–76. https://doi.org/10.1243/0954406971521665
[23] Ji Z, Stanic M, Hartono EA, Chernoray V. Numerical simulations of oil flow inside a gearbox by Smoothed Particle Hydrodynamics (SPH) method. Tribol Int 2018;127: 47–58. https://doi.org/10.1016/J.TRIBOINT.2018.05.034
[24] Uzol O, Chow YC, Katz J, Meneveau C. Unobstructed particle image velocimetry measurements within an axial turbo-pump using liquid and blades with matched refractive indices. 2002 33:6 Exp Fluids 2002;33:909–19. https://doi.org/ 10.1007/S00348-002-0494-8
[25] Marusic I, Broomhall S. Leonardo da Vinci and fluid mechanics. Annu Rev Fluid Mech 2021;53:1–25. https://doi.org/10.1146/ANNUREV-FLUID-022620-122816.
[26] Wang C-P, Sadeghi F, Wereley ST, Chuang H-S. Investigation of fluid flow out of a microcavity using μ PIV. Tribol Trans 2009;52:817–32. https://doi.org/10.1080/ 10402000903125352
[27] Lin Q, Wei Z, Wang N, Ma S, Chen W. Visualisation study on flow field of bearing lubrication. Lubr Sci 2015;27:127–34. https://doi.org/10.1002/LS.1256
[28] Richardson D, Sadeghi F, Rateick RG, Rowan S. Using µPIV to investigate fluid flow in a pocketed thrust bearing. Tribol Trans 2019;62:350–61. https://doi.org/ 10.1080/10402004.2018.1556370
[29] Maccioni L, Chernoray VG, Bohnert C, Concli F. Particle Image Velocimetry measurements inside a tapered roller bearing with an outer ring made of sapphire: design and operation of an innovative test rig. Tribol Int 2022;165:107313. https://doi.org/10.1016/J.TRIBOINT.2021.107313
[30] Maccioni L, Chernoray VG, Mastrone MN, Bohnert C, Concli F. Study of the impact of aeration on the lubricant behavior in a tapered roller bearing: innovative numerical modelling and validation via particle image velocimetry. Tribol Int 2022;165:107301. https://doi.org/10.1016/J.TRIBOINT.2021.107301
[31] Ryu Y, Chang K-A, Lim H-J. Use of bubble image velocimetry for measurement of plunging wave impinging on structure and associated greenwater. Meas Sci Technol 2005;16:1945–53. https://doi.org/10.1088/0957-0233/16/10/009
[32] Todd DR, Ortiz-Villafuerte J, Schmidl WD. Analysis of bubbly flow using particle image velocimetry. 9th International Conference on Nuclear Engineering, France; 2001.
[33] Hassan YA, Canaan RE. Full-field bubbly flow velocity measurements using a multiframe particle tracking technique. Exp Fluids 1991;12–12:49–60. https://doi. org/10.1007/BF00226565.
[34] Bung D, Valero D. Image processing for Bubble Image Velocimetry in self-aerated flows. E-proceedings of the 36th IAHR World Congress, The Hague, Netherlands; 2015, p. 6594–601.
[35] Bodaghkhani A, Dowdell JR, Colbourne B, Muzychka YS, Naterer GF. Measurement of spray-cloud characteristics with bubble image velocimetry for braking wave impact. Cold Reg Sci Technol 2018;145:52–64. https://doi.org/10.1016/J. COLDREGIONS.2017.10.001
[36] Chen RC, Fan LS. Particle image velocimetry for characterizing the flow structure in three-dimensional gas-liquid-solid fluidized beds. Chem Eng Sci 1992;47: 3615–22. https://doi.org/10.1016/0009-2509(92)85077-O
[37] Emadzadeh A, Chiew YM. Bubble dynamics and PIV measurements in a hydraulic jump. The 37th IAHR World Congress August 13–18, Kuala Lumpur, Malaysia; 2017.
[38] Hassan YA, Blanchat TK, Seeley CH, Canaan RE. Simultaneous velocity measurements of both components of a two-phase flow using particle image velocimetry. Int J Multiph Flow 1992;18:371–95. https://doi.org/10.1016/03019322(92)90023-A
[39] Arya U, Sadeghi F, Conley B, Russell T, Peterson W, Meinel A. Experimental investigation of cage dynamics and ball-cage contact forces in an angular contact ball bearing. 135065012210777 Proc Inst Mech Eng, Part J: J Eng Tribol 2022. https://doi.org/10.1177/13506501221077768
[40] Thielicke W, Sonntag R. Particle Image Velocimetry for MATLAB: accuracy and enhanced algorithms in PIVlab. J Open Res Softw 2021;9:12. https://doi.org/ 10.5334/jors.334
[41] Wang F, Wang L, Chen G, Zhu D. Numerical simulation of the oil droplet size distribution considering coalescence and breakup in aero-engine bearing chamber. Appl Sci 2020;10:5648. https://doi.org/10.3390/app10165648
[42] Haas A, Geiger U, Maaben F. Oil aeration in high speed combustion engines. SAE Tech Pap 1994. https://doi.org/10.4271/940792
[43] Smith EH. The influence of surface tension on bearings lubricated with bubbly liquids. J Lubr Technol 1980;102:91–6. https://doi.org/10.1115/1.3251446
[44] S´ anchez-Gonz´ alez R, North SW. Nitric oxide laser-induced fluorescence imaging methods and their application to study high-speed flows. Frontiers and advances in
molecular spectroscopy. Elsevier; 2018. p. 599–630. https://doi.org/10.1016/ B978-0-12-811220-5.00019-8
[45] Harris TA, Kotzalas MN. Essential concepts of bearing technology. 5th ed. Boca Raton, FL: CRC Press; 2006. https://doi.org/10.1201/9781420006599
[46] Bardina JE, Huang PG, Coakley TJ. Turbulence modeling validation, testing, and development. NASA Tech Memo 1997;110446
[47] Menter FR. Two-equation eddy-viscosity turbulence models for engineering applications. AIAA J 1994;32:1598–605. https://doi.org/10.2514/3.12149
[48] Launder BE, Morse A, Rodi W, Spalding DB. Prediction of free shear flows: a comparison of the performance of six turbulence models. Nasa Langley Res Cent Free Turbul Shear Flows 1973;vol. 1
[49] ANSYS I. ANSYS Fluent Theory Guide (15.0). Canonsburg, PA 2013.
[50] ANSYS I. ANSYS Fluent User’s Guide (15.0). Canonsburg, PA 2013.
THE CLASS OF THE HONEY-BEE.
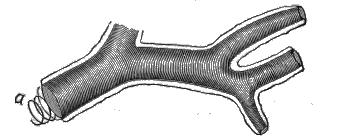
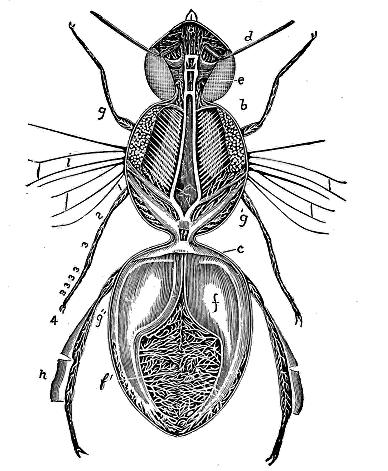
Our subject belongs to the class Insecta, which is mainly characterized by breathing air usually through a very complicated system of air-tubes. These tubes (Fig, 1), which are constantly branching, and almost infinite in number, are very peculiar in their structure. They are formed of a spiral thread, and thus resemble a hollow cylinder formed by closely winding a fine wire spirally about a pipe-stem, so as to cover it, and then withdrawing the latter, leaving the wire unmoved. Nothing is more surprising and interesting, than this labyrinth of beautiful tubes, as seen in dissecting a bee under the microscope. I have frequently detected myself taking long pauses, in making dissections of the honey-bee, as my attention would be fixed in admiration of this beautiful breathing apparatus. In the bee these tubes expand into large lung-like sacks (Fig, 2, f), one each side of the body.
Respiratory Apparatus of Bee, magnified.— After Duncan.
Doubtless some of my readers have associated the quick movements and surprising activity of birds and most mammals with their well-developed lungs, so, too, in such animals as the bees, we see the relation between this intricate system of air-tubes—their lungs—and the quick, busy life which has been proverbial of them since the earliest time. The class Insecta also includes the spiders, scorpions, with their caudal sting so venomous, and mites, which have in lieu of the tubes, lung-like sacks, and the myriapods, or thousand-legged worms—those dreadful creatures, whose bite, in case of the tropical centipedes or flat species, have a well-earned reputation of being poisonous and deadly.
The class Insecta does not include the water-breathing Crustacea, with their branchiæ or gills, nor the worms, which have 110 lungs or gills but their skin, if we except some marine forms, which have simple dermal appendages, which, answer to branchiæ.
ORDER OF THE HONEY-BEE.
The honey-bee belongs to the order Hexapods, or true Insects. The first term is appropriate, as all have in the imago or last stage, six legs. Nor is the second term less applicable, as the word insect comes from the Latin and means to cut in, and in no other articulates does the ring structure appear 80 marked upon merely a superficial examination. More than this, the true insects when fully developed have, unlike all other articulates, three well-marked divisions of the body (Fig, 2), namely: the head (Fig, 2, a), which contains the antennæ (Fig. 2, d), the horn-like appendages common to all insects; eyes (Fig. 2, e) and mouth organs; the thorax (Fig. 2, b), which bears the legs (Fig. 2, g), and wings, when they are present; and lastly, the abdomen (Fig. 2, c), which, though usually memberless, contains the ovipositor, and when present, the sting. Insects, too, undergo a more striking metamorphosis than do most animals. When first hatched they are worm-like and called larvæ (Fig, 12), which means masked; afterward they are frequently quiescent, and would hardly be supposed to be animals at all. They are then known as pupæ, or as in case of bees as nymphs (Fig, 13). At last there comes forth the imago with compound eyes, antennæ and wings. In some insects the transformations are said to be incomplete, that is the larva, pupa and imago differ little except in size, and that the latter possesses wings. We see in our bugs, lice, locusts and grasshoppers, illustrations of insects with incomplete transformations. In such cases there is a marked resemblance from the egg to the adult.
As will be seen by the above description the spiders, which have only two divisions to their bodies, only simple eyes, no antennæ, eight legs, and no transformations (if we except the partial transformations of the mites), as also the myriapods, which have no marked divisions of the body, and no compound eyes—which are
always present in the mature insect—many legs and no transformations, do not belong to the order Insects.
SUB-ORDER OF THE HONEY BEE.
The honey bee belongs to the sub-order Hymenoptera (from two Greek words meaning membrane and wings), which also includes the wasps, ants, ichneumon-flies and saw-flies. This group contains insects which possess a tongue by which they may suck (Fig, 20, a), and strong jaws (Fig, 21) for biting. Thus the bees can sip the honeyed sweets of flowers, and also gnaw away mutilated comb. They have, besides, four wings, and undergo complete transformations.
There are among insects strange resemblances. Insects of one sub-order will show a marked likeness to those of another. This is known as mimicry, and sometimes is wonderfully striking between very distant groups. Darwin and Wallace suppose it is a developed peculiarity, not always possessed by the species, and comes through the laws of variation, and natural selection to serve the purpose of protection. Now, right here we have a fine illustration of this mimicry. Just the other day I received through Mr. A. I. Root, an insect which he and the person sending it to him supposed to be a bee, and desired to know whether it was a mal-formed honey-bee or some other species. Now, this insect, though looking in a general way much like a bee, had only two wings, had no jaws, while its antennæ were closer together in front and mere stubs. In fact, it was no bee at all, but belonged to the sub-order Diptera, or two-wing flies. I have received several similar insects, with like inquiries. Among Diptera there are several families, as the Œstridæ or botflies, the Syrphidæ—a very useful family, as the larvæ or maggots live on plant-lice—whose members are often seen sipping sweets from flowers, or trying to rob honey and other bees—the one referred to above belonged to this family—and the Bombyliidæ, which in color, form and hairy covering are strikingly like wild and domesticated bees. The maggots of these feed on the larvæ of various of our wild bees, and of course the mother fly must steal into
the nests of the latter to lay her eggs. So in these cases, there is seeming evidence that the mimicry may serve to protect these flytramps, as they steal in to pilfer the coveted sweets or lay the fatal eggs. Possibly, too, they may have a protective scent, as I have seen them enter a hive in safety, though a bumble-bee essaying to do the same, found the way barricaded with myriad cimeters each with a poisoned tip.
Some authors have placed Coleoptera or beetles as the highest of insects, others claim for Lepidoptera or butterflies and moths a first place, while others, and with the best of reasons, claim for Hymenoptera the highest position. The moth is admired for the glory of its coloring and elegance of its form, the beetle for the luster and brilliancy of its elytra or wing-covers; but these insects only revel in nature's wealth, and live and die without labor or purpose. Hymenoptera usually less gaudy, generally quite plain and unattractive in color, are yet the most highly endowed among insects. They live with a purpose in view, and are the best models of industry to be found among animals. Our bees practice a division of labor the ants are still better political economists, as they have a specially endowed class in the community who are the soldiers, and thus are the defenders of each ant-kingdom. Ants also conquer other communities, take their inhabitants captive and reduce them to abject slavery—requiring them to perform a large portion, and sometimes the whole labor of the community. Ants tunnel streams, and in the tropics some leaf-eating species have been observed to show no mean order of intelligence, as some ascend trees to cut off the leafy twigs, while others remain below, and carry these branches through their tunnels to their under-ground homes.
The parasitic Hymenoptera, are so called because they lay their eggs in other insects, that their offspring may have fresh meat not only at birth, but so long as they need food, as the insect fed upon generally lives till the young parasite, which is working to disembowel it, is full-grown. Thus this steak is ever fresh as life itself. These parasitic insects show wondrous intelligence, or sense development, in discovering this prey. I have caught ichneumon-flies —a family of these parasites—boring through an eighth or quarter-
inch of solid beech or maple wood, and upon examination I found the prospective victim further on in direct line with the insect auger, which was to intrude the fatal egg. I have also watched ichneumonflies depositing eggs in leaf-rolling caterpillars, so surrounded with tough hickory leaves that the fly had to pierce several thicknesses to place the egg in its snugly-ensconced victim. Upon putting these leaf-rolling caterpillars in a box, I reared, of course, the ichneumonfly and not the moth. And is it instinct or reason that enables these flies to gauge the number of their eggs to the size of the larva which is to receive them, so that there may be no danger of famine and starvation, for true it is that while small caterpillars will receive but one egg, large ones may receive several. How strange, too, the habits of the saw-fly, with its wondrous instruments more perfect than any saws of human workmanship, and the gall-flies, whose poisonous sting as they fasten their eggs to the oak, willow or other leaves, causes the abnormal growth of food for the still unhatched young. The providing and caring for their young, which are at first helpless, is peculiar among insects, with slight exception, to the Hymenoptera, and among all animals is considered a mark of high rank. Such marvels of instinct, if we may not call it intelligence, such acumen of sense perception, such habits—that must go hand-inhand with the most harmonious of communities known among animals, of whatever branch—all these, no less than the compact structure, small size and specialized organs of nicest finish, more than warrant that grand trio of American naturalists, Agassiz, Dana and Packard, in placing Hymenoptera as first in rank among insects. As we shall detail the structure and habits of the highest of the high —the bees—in the following pages, I am sure no one will think to degrade the rank of these wonders of the animal kingdom.
FAMILY OF THE HONEY-BEE.
The honey-bee belongs to the family Apidæ, of Leach, which includes not only the hive bee, but all insects which feed their helpless young, or larvæ, entirely on pollen, or honey and pollen.
The insects of this family have broad heads, elbowed antennæ (Fig, 2, d) which are usually thirteen-jointed in the males, and only twelve-jointed in the females. The jaws or mandibles (Fig, 21) are very strong, and often toothed; the tongue or ligula (Fig, 20, a), as also the second jaws or maxillæ (Fig. 20, c), one each side the tongue, are long, though in some cases much shorter than in others, and frequently the tongue when not in use is folded back, once or more, under the head. All the insects of this family have a stiff spine on all four of the anterior legs, at the end of the tibia, or the third joint from the body, called the tibial spur, and all, except the genus Apis, which includes the honey-bee, in which the posterior legs have no tibial spurs, have two tibial spurs on the posterior legs. All of this family except one parasitic genus, have the first joint or tarsus of the posterior foot, much widened, and this together with the broad tibia (Fig, 2, h) is hollowed out (Fig, 22, p), forming quite a basin or basket on the outer side, in nearly all the species; and generally, this basket is made deeper by a rim of stiff hairs. These receptacles or pollen baskets are only found of course on such individuals of each community as gather pollen. A few of the Apidæ—thieves by nature —cuckoo-like, steal unbidden into the nests of others, usually bumble-bees, and here lay their eggs. As their young are fed and fostered by another, they gather no pollen, and hence like drone bees need not, and have not pollen baskets. The young of these lazy tramps, starve out the real insect babies of these homes, by eating their food, and in some cases, it is said, being unable like the young cuckoos to hurl these rightful children from the nest, they show an equal if not greater depravity by eating them, not waiting for starvation to get them out of the way. These parasites illustrate mimicry, already described, as they look so like the foster mothers of their own young, that unscientific eyes would often fail to distinguish them. Probably the bumble-bees are no sharper, or they would refuse ingress to these merciless vagrants.
The larvæ (Fig, 12) of all insects of this family are maggot-like— wrinkled, footless, tapering at both ends, and, as before stated, feed upon pollen and honey They are helpless, and thus, all during their babyhood—the larvæ state—the time when all insects are most ravenous, and the only time when many insects take food, the time
