Fragility-based seismic performance assessment of modular underground arch bridges
Van-Toan Nguyen a , Jin-Hee Ahn b , Achintya Haldar c , Jungwon Huh a, *
a Department of Architecture and Civil Engineering, Chonnam National University, Gwangju 61186, South Korea
b Department of Civil and Infrastructure Engineering, Gyeongsang National University, Jinju 52725, South Korea
c Department of Civil Engineering and Engineering Mechanics, University of Arizona, Tucson, AZ 85721, USA
ARTICLE INFO
Keywords:
Modular underground arch bridge
Seismic performance
Stratum-uncertainty characteristics
Damage states
Fragility-based analysis
ABSTRACT
Seismic performance assessment of modular underground arch bridges (MUABs) can help mitigate structural damage to MUABs during earthquakes. This study proposed an efficient procedure to evaluate the seismic performance of a three-hinge MUAB by using fragility-based analysis. Firstly, a novel proposal for damage states was presented using the relationship between the crack depth and thickness of the arch component. The relationship between ground motion intensity and structural failure probability was then described using stratumuncertainty characteristics. The multiple stripe analysis approach with the maximum likelihood function was introduced to detail the uncertainty characteristics of strata by allowing various ground motions at distinct seismic intensity levels. Finally, the collapse probability considering stratum-uncertainty characteristics was specified for seismic intensity and probability levels. The results revealed that the proposed procedure to randomly select ground motions from the strong-motion database of the Pacific Earthquake Engineering Research Center is feasible for evaluating the seismic vulnerability of MUABs. Therefore, the seismic performance of MUABs can be reasonably predicted under earthquakes.
1. Introduction
Globally, sophisticated construction projects both underground and aboveground are increasingly being undertaken. Therefore, the seismic performance assessment of multistory buildings, bridges, dams, and underground structures is a critical research topic [1–19]
Underground structures have been widely used to precast segmental components to incorporate salient technical and construction features [20–22] The precast arch bridge with modular components, namely modular underground arch bridges (MUABs), is a typical example of advanced construction [23]. Many cross-section shapes of the arch and numerous hinges have been used. A novel design of the multi-hinged type has been investigated and applied in Korea [24–26] Two-hinge and three-hinge types are widely used in Japan, with more than 200 sets constructed along arterial roads [22].
Although underground structures are less vulnerable to earthquakeinduced damage compared with aboveground structures [27–29], earthquake damage to underground facilities is still necessary [28,30–32] because of reported damage to many MUABs because of earthquakes [20,22,33–36] Seismic analysis and design procedures
* Corresponding author.
E-mail address: jwonhuh@chonnam.ac.kr (J. Huh).
https://doi.org/10.1016/j.istruc.2022.04.005
have been investigated for such structural constructions [29,37–40] Thus, accurate evaluation of the seismic performance of MUABs is critical for the risk mitigation of MUABs.
MUABs subjected to ground motions have been investigated using experimental [41–44] and numerical approaches [23,45,46]. The results have revealed that the seismic behavior of MUABs differs under distinct excitation directions because of the difference in the seismic capacity between the longitudinal and transverse directions of MUABs [22,23,46] Furthermore, the seismic behavior of MUABs is dependent on the peak ground accelerations (PGAs) and ground motion directions and is sensitive to the variance in arch length and stiffness of prestressed rebar [23] Although these studies have evaluated seismic behaviors of MUABs, limited studies have been conducted on the vulnerability assessment of MUABs.
The surrounding soil plays a role in the stability of MUABs. Homaei and Yazdani [47] pointed out that the soil–structure interaction affects the confidence level of bridge safety; therefore, the soil–structure interaction should be adopted to estimate arch bridge capacity. Miyazaki et al. investigated the effect of embankment shape patterns on the seismic behavior of MUABs [41], and Nguyen et al. investigated the
Received 7 January 2022; Received in revised form 30 March 2022; Accepted 1 April 2022
2352-0124/©2022InstitutionofStructuralEngineers.PublishedbyElsevierLtd.Allrightsreserved.
influence of soil–structure interaction on the seismic responses of MUABs [23]. The static loads on the arch bridge increased approximately linearly with the depth of cover, whereas the loads were only mildly affected by the cover depth under earthquake loadings [45] because phasing occurred between the motion of the side fill and the cover. Studies conducted on MUABs have considered limited ground motions. In some studies, MUABs have been subjected to one ground motion with no change in the intensity level [46]. Nguyen et al. [23] provided considerable insights on the seismic behavior examination for MUABs by using the three-dimensional (3D) finite element analysis (FEA) model. However, limited number of ground motions have been investigated. Nguyen et al. [23] indicated that further study is necessary for investigating the seismic vulnerability of MUABs.
This study proposed a feasible and efficient fragility-based procedure to assess the seismic performance of MUABs. First, previous literature is discussed, and a sophisticated 3D finite element modeling of three-hinge MUABs was simulated considering contact interactions and prestressed rebar. The concrete damaged plasticity model was used to investigate the micro-damage-cracking behavior of concrete by using the dissipated fracture energy. A methodology of fragility-based analysis for MUABs was subsequently derived. Next, we described a random selection procedure of ground motions for the 3D FEA model of MUABs. An extensive database of ground motions was inputted in the FEA model, and the uncertainty in the ground motion time history was assessed. Next, we discussed critical findings from seismic fragility analysis, followed by crucial conclusions drawn from this research.
2. 3D finite element model of MUAB
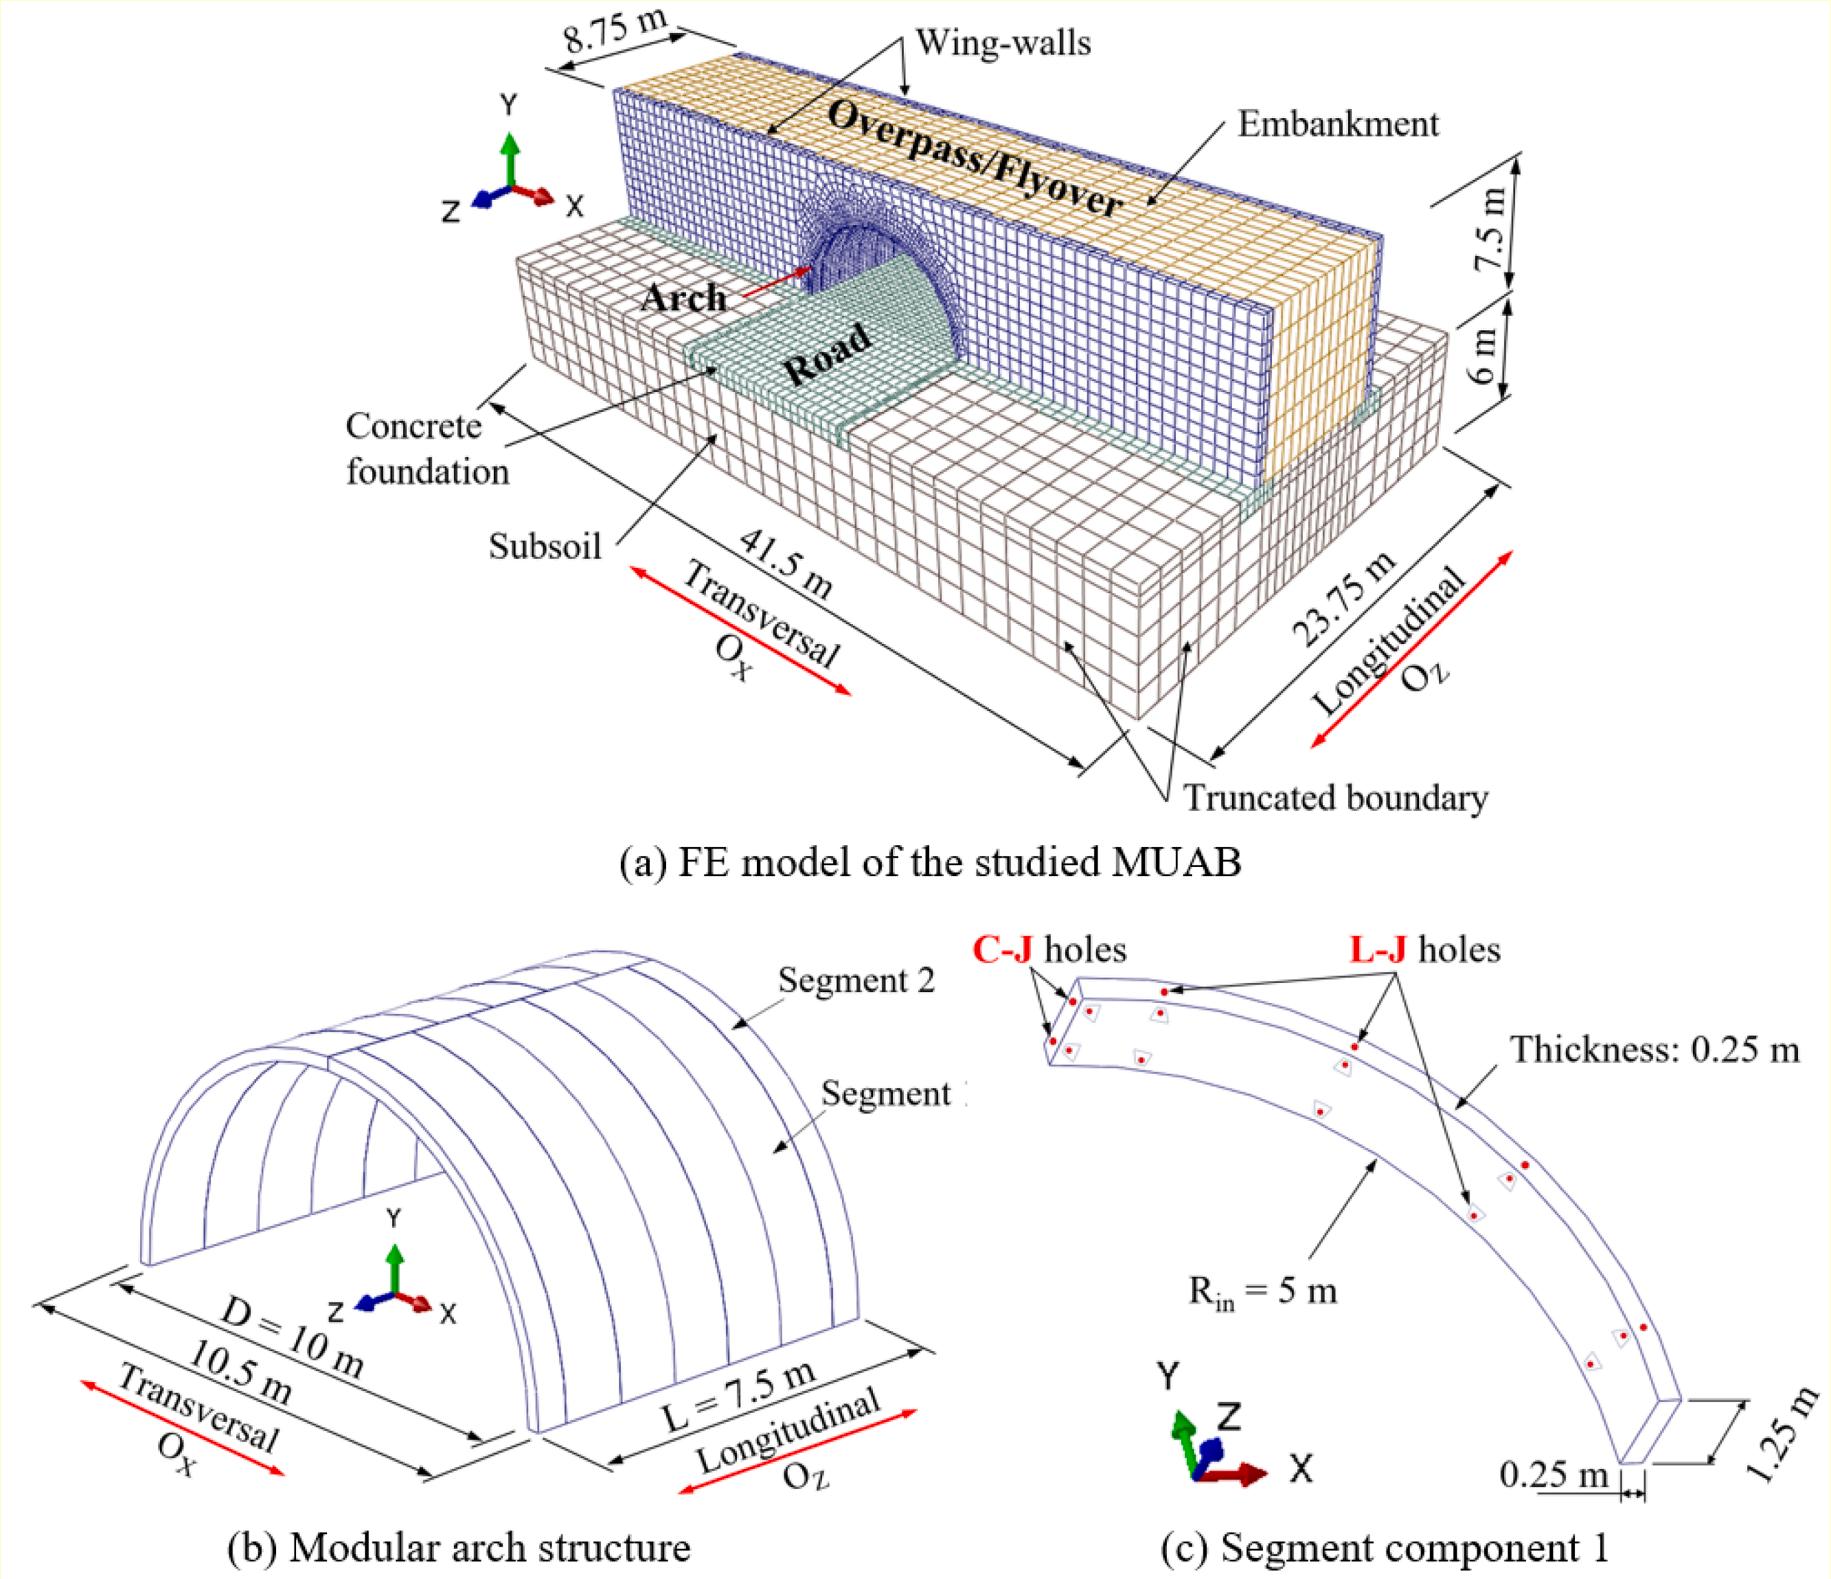
A 3D FEA model of three-hinge MUAB was constructed based on the previous study, as illustrated in Fig. 1 Numerical simulation was performed according to Nguyen et al. [23]
In the FEA model, incompatible-mode eight-node brick elements from ABAQUS [48] were used to represent the arch-foundationwingwall-soil system of the MUAB. The most optimal meshing of MUAB was obtained through numerous trial analyses. The arch was finely discretized for seismic damage analysis of concrete. Boundaries of the FEA model were truncated with an approximate ratio of 1.5 from the center of the arch to reduce computational cost. The truncated boundaries were based on the viscous-spring artificial boundary model [49] applied in ABAQUS [12,50]. A viscous-spring artificial boundary was imposed by installing springs and dampers on the truncated boundaries of the surrounding soil corresponding to excitation directions [23] Springs and viscous dampers are installed in the normal and tangential directions on each node of the truncated boundaries. Consequently, the FEA model closely reproduced the actual response of far-field soil because of the truncated boundaries; the seismic waves were absorbed on reaching the boundary.
The concrete damaged plasticity (CDP) model [51,52] was used for concrete material considering its nonlinearity [53] Two damage variables, namely failure mode and tensile cracking and compression crushing, were adopted for the concrete model. Detailed can be further referred to Nguyen et al. [23] and Yazdani and Habibi [54] The CDP
Fig. 1. Schematic of the studied MUAB [23] V.-T. Nguyen
model represents the damage-cracking behavior with the formation of micro-cracks. M40 grade concrete was used for the segmented arch and the wingwall, whereas M30 grade concrete used in ABAQUS was used for invert foundation [23] The concrete of segmented arch has the following properties: initial elastic modulus of 30,000 MPa, Poisson’s ratio of 0.2, the mass density of 2450 kg/m3, compressive strength of 40 MPa, the tensile strength of 4 MPa, the maximum compressive strain of 0.00363, and maximum tensile strain of 0.00133. The dynamic properties of concrete were used in nonlinear seismic analysis. The structural damping of MUABs was incorporated using Rayleigh damping and 5% damping ratio in the fundamental vibration modes to investigate massand stiffness-proportional damping factors.
The damaged plasticity parameters were considered in the numerical simulation of the CDP model in ABAQUS [23,48]. The dilation angle considerably affected the entire model because it was the ratio between volume strain and shear strain. The dilation angle depended on two parameters, namely plastic strain and confining pressure. An increase in plastic strain and confined pressure resulted in a decrease in the dilation angle. Thus, concrete was assumed to exhibit a constant dilation angle of 31◦ for numerous pressure stresses used for the confinement of concrete. The default flow potential eccentricity was 0.1. The default value of fb0/ fc0 was 1.16, representing the ratio of initial equibiaxial compressive yield stress to starting uniaxial compressive yield stress. The ratio of the second stress invariant on the tensile meridian to the compressive meridian was 0.67. A null default viscosity parameter was used so that viscoplastic regularization did not occur [48] This parameter value enhanced the convergence rate of the model when the softening process occurred, and it provided excellent results in the seismic analysis [23,55]
3. Methodology of fragility-based analysis for MUABs
The fragility curve is a potent tool for identifying the potential seismic risk and consequences of MUABs during and after an earthquake [56,57]. This study involved defining damage states of MUABs, fragility curve function, and random ground motions compatible with the seismic hazard used as input excitations. An overview of the methodology of fragility-based analysis for MUABs is presented in this section.
3.1. Damage states of MUABs
In the fragility-based approach, seismic fragility curves corresponding to the variance in the damage index with an increase in the intensity measurement for various levels of damage states (DSi) are plotted. Thus, the damage states represent the damage condition of MUABs associated with a limit state of the structural response.
DSi and corresponding indices have not been identified for underground structures like MUABs. Numerous methods have been proposed to indicate the damage levels of underground structures [58,59]. For underground box bridges (UBBs), the number of plastic hinges could represent damage levels [59] Furthermore, the damage index (DI) could be assumed to be the ratio of the elastic moment demand to the yield moment (also known as the capacity bending moment) [58–60]. An assumption for this definition is that the seismic behavior of UBBs is approximated to that of an elastic beam subjected to deformations imposed by surrounding soil because of seismic waves propagating perpendicular to the longitudinal direction of UBBs.
For underground arch bridges (UABs), Argyroudis et al. [61] used the same method with UBBs. However, the studies mentioned above are based on two-dimensional (2D) FEA models of underground bridges [58–61] Hence, ground motions in all horizontal directions have not been considered. The seismic resistance of MUABs between the longitude and transversal direction differs considerably [23,46] The ratio of the maximum bending moment on the arch to its capacity is widely used to determine damage states. The arch structure cannot withstand a loading combination of static and dynamic loads at a single bending
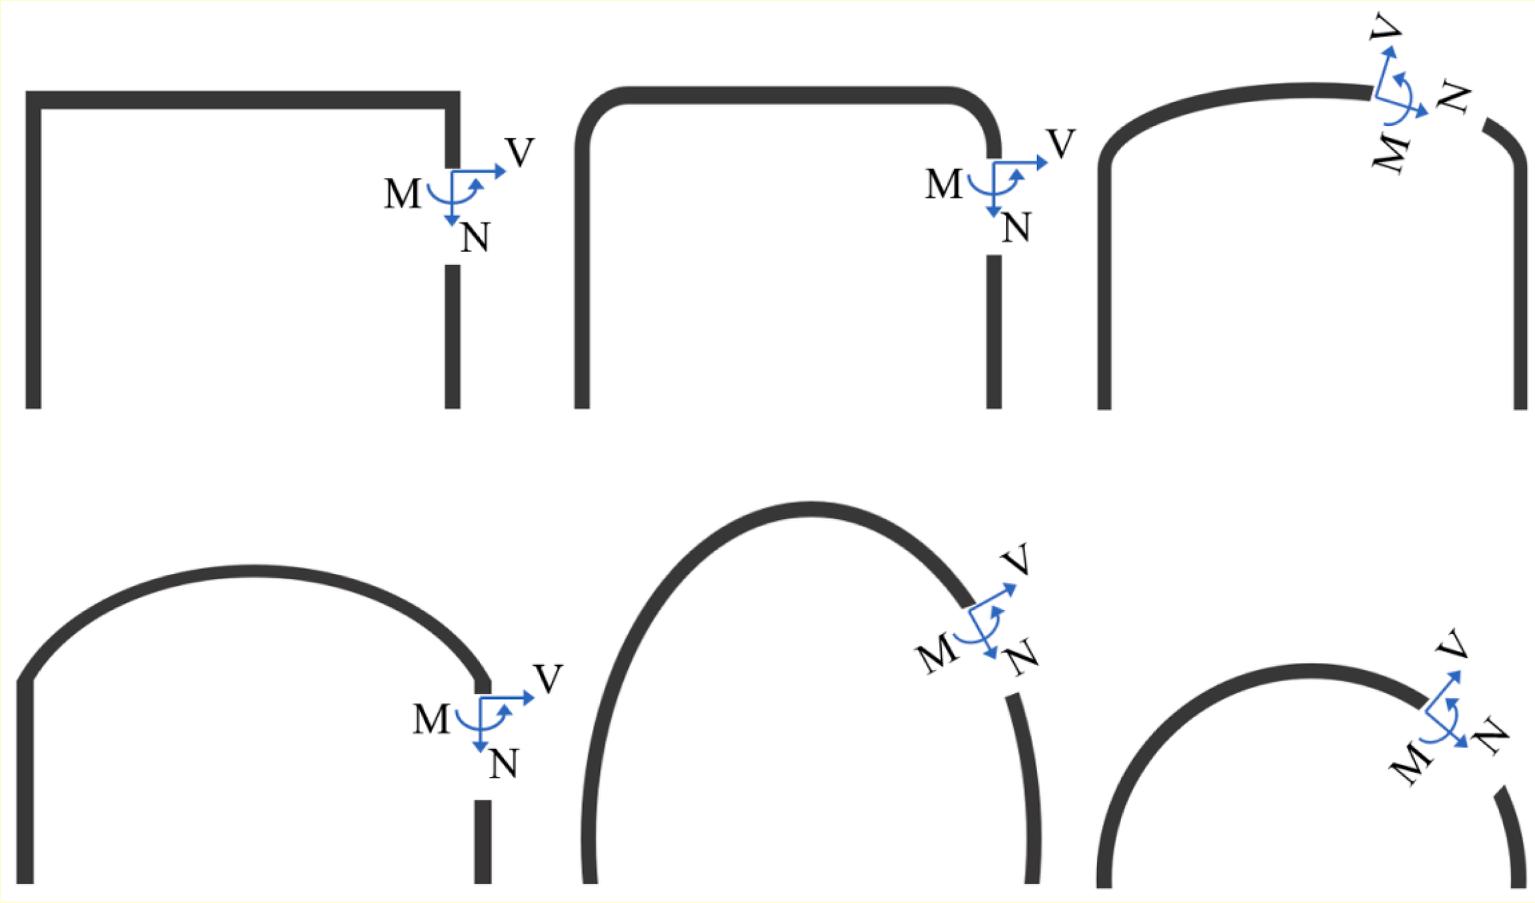
moment. A load scenario can be a combination of axis force (N), shear force (V), and moment (M) (Fig. 2). Thus, limited studies have been conducted on the DI of MUABs because the criterion for the probabilistic seismic analysis of MUABs does not exist.
Furthermore, recent efforts delved into investigating the seismic resistance of masonry arch bridges (MABs) [5,6,18,47,54] The MAB is the sibling structure of MUABs due to forming from modular concrete arch structures and using the soil-arching effect in the overall structural stability. The maximum displacement of the arch (aka the crown) was considered as the structural engineering demand parameter or represented the damage state of MABs [6,47] instead of other structural responses because of similarity and accessibility with the well-known drift [62]. The probability of damage state presented by the maximum displacement was adopted using the incremental dynamic analysis [6]. Yazdani and Habibi [54] proposed and employed the extended finite element method, which is efficient for quantitative crack growth patterns and failure of MABs. Therefore, the crack is a manifestation of the failure state that can be quantified using estimation to evaluate the loss of the structure. The quantities of the structural response (i.e., moment, displacement, stress, crack) could use to represent the damage condition of different soil–arch structure systems.
The crack depth can reflect the damage level of the concrete arch. At every cross-section of each strip of the arch, tensile and compressive stresses resulting from thrust and/or shear force and/or moments are combined; the internal-force combination depends on the geometric shapes of the arch and the external-force combination (Fig. 2). The equivalent plastic strain (PEEQ) results from stress on the cross-section. Crack propagation with crack depth corresponds to PEEQ because the macrocracks propagate through the arch when the PEEQ value exceeds a threshold value [23].
In this study, the DI is assumed to be based on the classification but not on the definition of Pitilakis [63] and Argyroudis and Pitilakis [60] The DI is the ratio between the crack depth (DCrk) and the thickness of the arch component (DThks), as expressed in Eq. (1), followed by a suit of damage, as presented in Table 1. The DI, ranging from 0 to 1, is not dependent on loading directions. Furthermore, the DI is not dependent on the loading combination of N-V-M scenarios. The damage state classifications of MUABs, from DS1 to DS3, corresponded to the wellknown three performance levels [immediately occupancy (IO), life safety (LS), and collapse prevention (CP)] [64,65] Therefore, in approximation theory, the minor, moderate, and extensive damage can be considered serviceability performance, repairable level, and collapse prevention. Definitions in studies have been subjective, resulting in high uncertainty of qualification in a particular damaged state. The definitions presented in this study can be used for analytical analysis.
DI = crack depth thickness of arch component = DCrk DThks (1)
The probabilistic seismic demand model could be based on regression analysis [56,66–70] in accordance with adaptable and sufficient data regarding the demands and/or capacities of MUABs. Thus, the relationship between the structural engineering demand parameter (EDP) and the ground motion parameter (IM) in the study could be expressed as follows:
EDP = a × IM b (2)
where IM is the intensity measure of ground motions; a and b are unknown regression coefficients obtained from linear regression analysis.
For a database of EDP, the median value (EDPmedian) of the EDP-data set is well-known as a special parameter. EDPmedian is a value separating the higher half from the lower half of the EDP-data set. The relationship between EDPmedian and IM can be expressed as follows:
EDPmedian = a × IM b (3)
Using a two-sided logarithm, Eq. (3) becomes a new form similar to a
V.-T. Nguyen
Table 1
Definition of damages states for MUABs.
Damage state level
Meaning Range of damage index (DI or EDP)
Median value of damage index (DImedian or EDPmedian)
Performance level [64,65]
DS0 None DI ≤ 0.05 – –
DS1 Minor/ slight 0.05 < DI ≤ 0.2 0.125 IO
DS2 Moderate 0.2 < DI ≤ 0.45 0.325 LS
DS3 Extensive 0.45 < DI ≤ 0.8 0.625 CP
DS4 Collapse DI > 0.8 – –
power model [66]
ln(EDPmedian ) = ln(a) + b × ln(IM ) (4)
3.2. Fragility curve development
The seismic fragility curve of MUABs can represent the conditional probability of a seismic demand (EDP) exceeding the structural seismic capacity of MUAB (C), defined by damage states, given a specific level of ground motion IM [62,71–75], as expressed in Eq. (5) When MUAB is subjected to ground motion having a specific seismic intensity level, the possibility of MUAB P(DSi|IM) being damaged corresponds with the probability of being equal to or exceeding a specific damage state (DSi) presented in Table 1
Pfragility = P(EDP⩾C |IM ) (5)
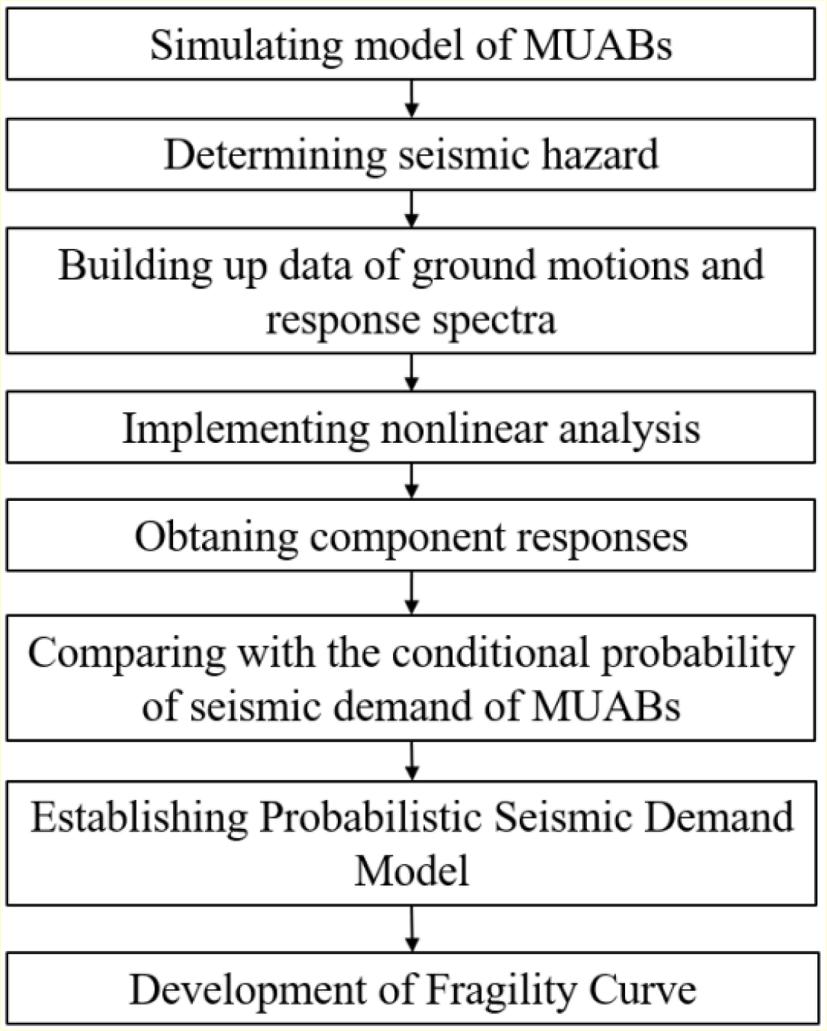
The fragility curves can be obtained using various methodologies, such as expert-based, empirical, analytical, and hybrid methods. Many researchers developed fragility curves to evaluate the seismic performance of different structures [76–81]. These studies prove that the fragility-based curve could be a powerful approach to estimate the seismic probability risk of structures, including underground structures. The fragility curve in this study was based on the analytical fragility approach developed via dynamic structural analysis (Fig. 3). The analytical method used for developing vulnerability curves exhibited considerable advantages and disadvantages. The analytical method is the most accurate and considers all uncertainties. However, this
analytical method incurs considerable computational costs. Furthermore, developing adaptive numerical modeling with high sensitivity is challenging. Nevertheless, the analytical method is more suitable than the empirical method for seismic vulnerability assessment of MUABs [82] because observation data of seismic damage cannot be used to develop MUABs.
The fragility function is defined using the lognormal cumulative distribution function [4,56,60,61] as expressed in Eq. (6) The lognormal distribution of the seismic intensity of earthquakes resulting in the collapse of MUABs can be expressed as follows:
Pfragility = P(C |IM = x) = Φ[ln(x/θ) β ] (6)
where P(C|IM = x) is the probability that the ground motion with
Fig. 2. Various cross-section shapes of MUABs correspond with their internal-force combination from thrust (N) and/or shear force (V) and/or moment (M).
Fig. 3. Methodology of fragility curve based on the analytical approach.
seismic intensity IM = x will cause MUAB to collapse, Φ[ ] is the standard normal cumulative distribution function, θ is the median of fragility function (the IM level with 50% probability of collapse), and β is the standard deviation of ln(IM) Therefore, θ and β are fragility parameters of the distribution function.
A multiple stripe analysis was conducted using seismic IM levels. Structural analyses of collapses were conducted for numerous ground motions at intensity levels IM = xj. Assuming that the observation of collapse or no-collapse from each ground motion is independent of the observations from other ground motions, the probability mass function of observing zj collapses or no collapses out of nj ground motions with IM = xj can be calculated by the binomial distribution. The probability pj that a ground motion with IM = xj causes the collapse of MUABs is expressed as follows:
P( zj collapse in nj ground motions) = ( nj zj )pzj j ( 1 pj )nj zj (7)
The maximum likelihood function was obtained by considering the product of the binomial probabilities at each IM level to obtain the likelihood for the entire data set as Eq. (8). Therefore, the fragility function provided the highest probability of collapse data based on the maximum likelihood approach. The observation data of collapse was obtained from the dynamic structural analysis, which was conducted using various IM levels (m is the number of various IM levels).
Likelihood = ∏ m j=1 ( nj zj )p z j ( 1 pj )nj zj (8)
The fragility parameters (θ and β) are explicit in the substitution likelihood function, as expressed in Eq. (9). Estimates of the fragility function parameters are obtained by maximizing the logarithm of the likelihood function as follows: Likelihood = ∏ m j=1 ( nj zj )Φ(ln(x/θ) β )zj [1 Φ(ln(x/θ ) β ) ]nj zj (9)
θ , β } = argmax
3.3. Input ground motions and intensity measurements
A database of ground motion records is required for seismic fragility analysis. Therefore, random selections of ground motions are critical for estimating seismic demands because the selections must ensure an adequate number of ground motions to satisfy site characteristics [23].
Many scholars have evaluated the influence of different types of seismic IM in earthquake performance assessment for underground and semi-underground structures [83–87] Nguyen et al. [85] revealed that the PGA might not be the best option for seismic response analysis in the high-frequency seismic regions for nuclear power plants. However, for shallow UBBs, the PGA is an efficient and appropriate IM of the ground motions in constructing seismic fragility curves [83] Zhang et al. [84] concluded that the optimal IM depends on stratum characteristics in the fragility analysis of UBBs. The PGA is more adaptable for the stratum having high equivalent shear wave velocity, while the velocity spectrum intensity is a priority for low equivalent shear wave velocity. However, the peak ground velocity is better correlated with seismic damage to deep underground structures [86,87] Therefore, the PGA was adopted as seismic IM to assess the seismic performance of MUABs without loss of generality because the MUABs were designed as shallow underground structures.
A range from 10 to 20 records is sufficient to provide high accuracy in the seismic demand analysis for mid-rise buildings [88] Regarding
underground structures, Huh et al. [4] considered 23 seismic PGA levels ranging from 0.02 to 1.3 g and 50 artificial acceleration time histories for each PGA level according to the Korean design spectrum codes [89,90] Huh et al. [4] recommended that the number of ground motions per PGA was equal to or greater than 20, which reasonably satisfies the fragility curves of UBBs. Consequently, 1,150 ground motion time histories were applied to derive vulnerability curves of a two-story UBB based on the ground response acceleration method [4]. The 1D linear site response analysis was adopted to perform the free-field soil response for each soil profile [4,86]
Hu et al. [91] selected fifteen-actual ground motions with ten intensities up-and-down scaled to acquire the internal forces of UABs. Bao et al. [2] used a dataset of 10 earthquakes with a large magnitude of 6.5 to 6.9 from the Pacific Earthquake Engineering Research Center (PEER) database to perform a seismic vulnerability analysis of buildings. The selected earthquakes were then scaled according to their intensity indexes to generate 200 ground motion samples. Notably, Chen et al. [92] used 42 near-fault pulse-like ground motions records. The 42-real ground motions having PGA from 0.13 to 1.34 g were applied to capture seismic hazard levels for pier bridges.
In particular, the prior techniques to build up ground motion samplings are dissimilar in terms of selecting criteria, earthquake characteristics, the number of ground motions, and generating/calculating methods for accelerograms [2,4,88,91,92]. These studies made suitable choices to solve the research objectives following degrees of an acceptable level. The artificial accelerograms can be useful when the approach using real accelerograms is challenging or inappropriate. The use of real records could be a potential selection when there is an increase in the availability of strong-motion accelerograms. Therefore, using real records and spectrum matching techniques was recommended for deriving suits of records for use in nonlinear dynamic analysis of structures [93] No specific guidance or reference exists for the number of random ground motions selected from the current earthquake database as the PEER for MUABs. Thus, this study proposed the following procedure to select ground motions from the strong-motion database of PEER randomly:
(1) Each earthquake candidate has distinct characteristics. First, the Richter magnitude (Mw) is equal to or greater than 4.0 [94] Second, the epicentral distance is greater than 10 km to reduce the influence of near-field effects. Third, the travel-time averaged near-surface shear wave velocity corresponding to 30 m depth of Vs30 is smaller than 1500 m/s to cover most classification of subsoil classes [95–97]
(2) In the NGA databases [98,99], only the RotD50 component [100] is available. Initially, the record component of the RotD50 measure was adopted to perform searches for records based on the median value of the distribution of each IM.
(3) For each seismic event, only horizontal seismic waves should be selected for each station to avoid the effect of the same focal mechanism. Next, the seismic waves are selected for greater PGA priority [91].
(4) Kohrangi et al. [101] noted that when analyzing 3D structural models subjected to ground motions in the two horizontal directions, alternative components definitions, such as GeoMean or SRSS, should be considered. Thus, the spectral ordinate of SRSS with a damping ratio of 5% was adopted for selecting control.
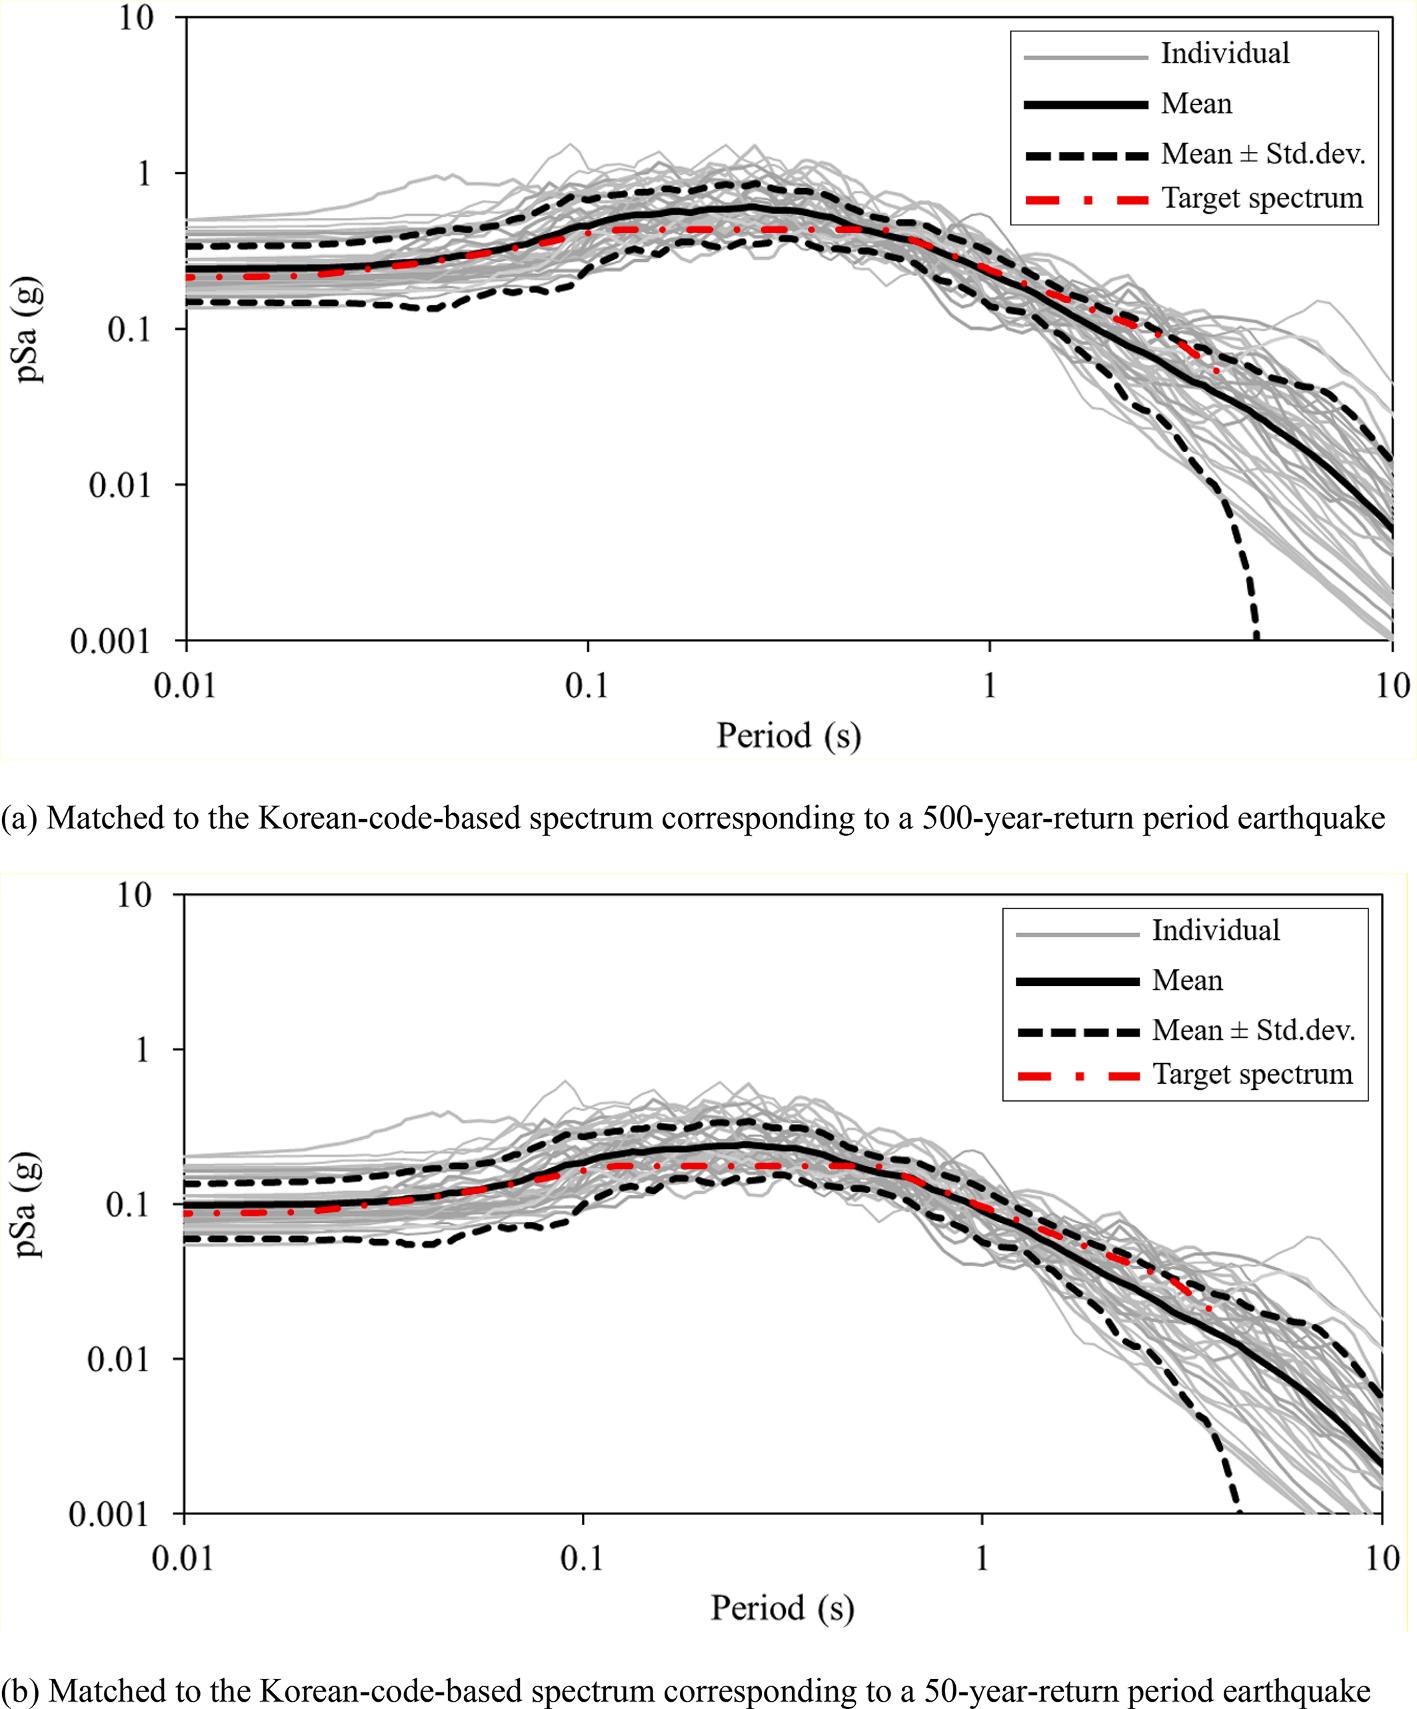
(5) To define the target spectral ordinate, the record selections should match the Korean code-based spectrum [89,90]. This study was first based on a return period of 500 years, alongside seismic zone 1.
(6) At least 40 best-fit records were selected to be ground motions.
A set of selected ground motion records is listed in Table 2, which matched the Korean design spectrum. The selections are scattered in an approximately 50-year period. The selected records were scaled into 12
V.-T. Nguyen
Table 2
intensity levels (0.03, 0.09, 0.15, 0.3, 0.45, 0.6, 0.75, 0.9, 1.05, 1.2, 1.35, and 1.5 g) according to their intensity indexes. Therefore, a dataset of 480-time history samples can represent random input ground motion for the fragility analysis of MUAB.
The response spectrum of the 40 selected ground motion records is displayed in Fig. 4 A deconvolution procedure was adopted for matching the earthquakes [23] The average response spectrum was similar to the design response spectrum, which could play a critical role in seismic behavior and response of MUABs. Each acceleration time history from the data set of time history samples was separately applied to the 3D FEA model at the bottom face.
Differences in seismic resistance and seismic response of MUABs resulting from the horizontal ground motion effects and/or the vertical ground motion effects are available in the literature [23,45] The maximum thrust in the arch was significantly affected by the depth of cover during the vertical seismic loading. In contrast, the effect of the horizontal seismic loadings on the arch was more detrimental due to the combination of thrust and moment in the arch structure. The maximum moment was caused by the horizontal seismic motions rather than the ones in the vertical direction [45] The detrimental force acting on the arch with shallow cover depth was influenced mainly by the effect of the horizontal ground motions compared to the ones in the vertical direction [23] Therefore, this seismic fragility analysis focused on the combined effects of the vertical and horizontal ground motion components. In every application, the PGA of ground motion was assumed to be identical in both the longitudinal and transverse directions and two-thirds in the vertical direction. The assumption is similar to the hypothesis for the seismic performance assessment of arch dams [12].
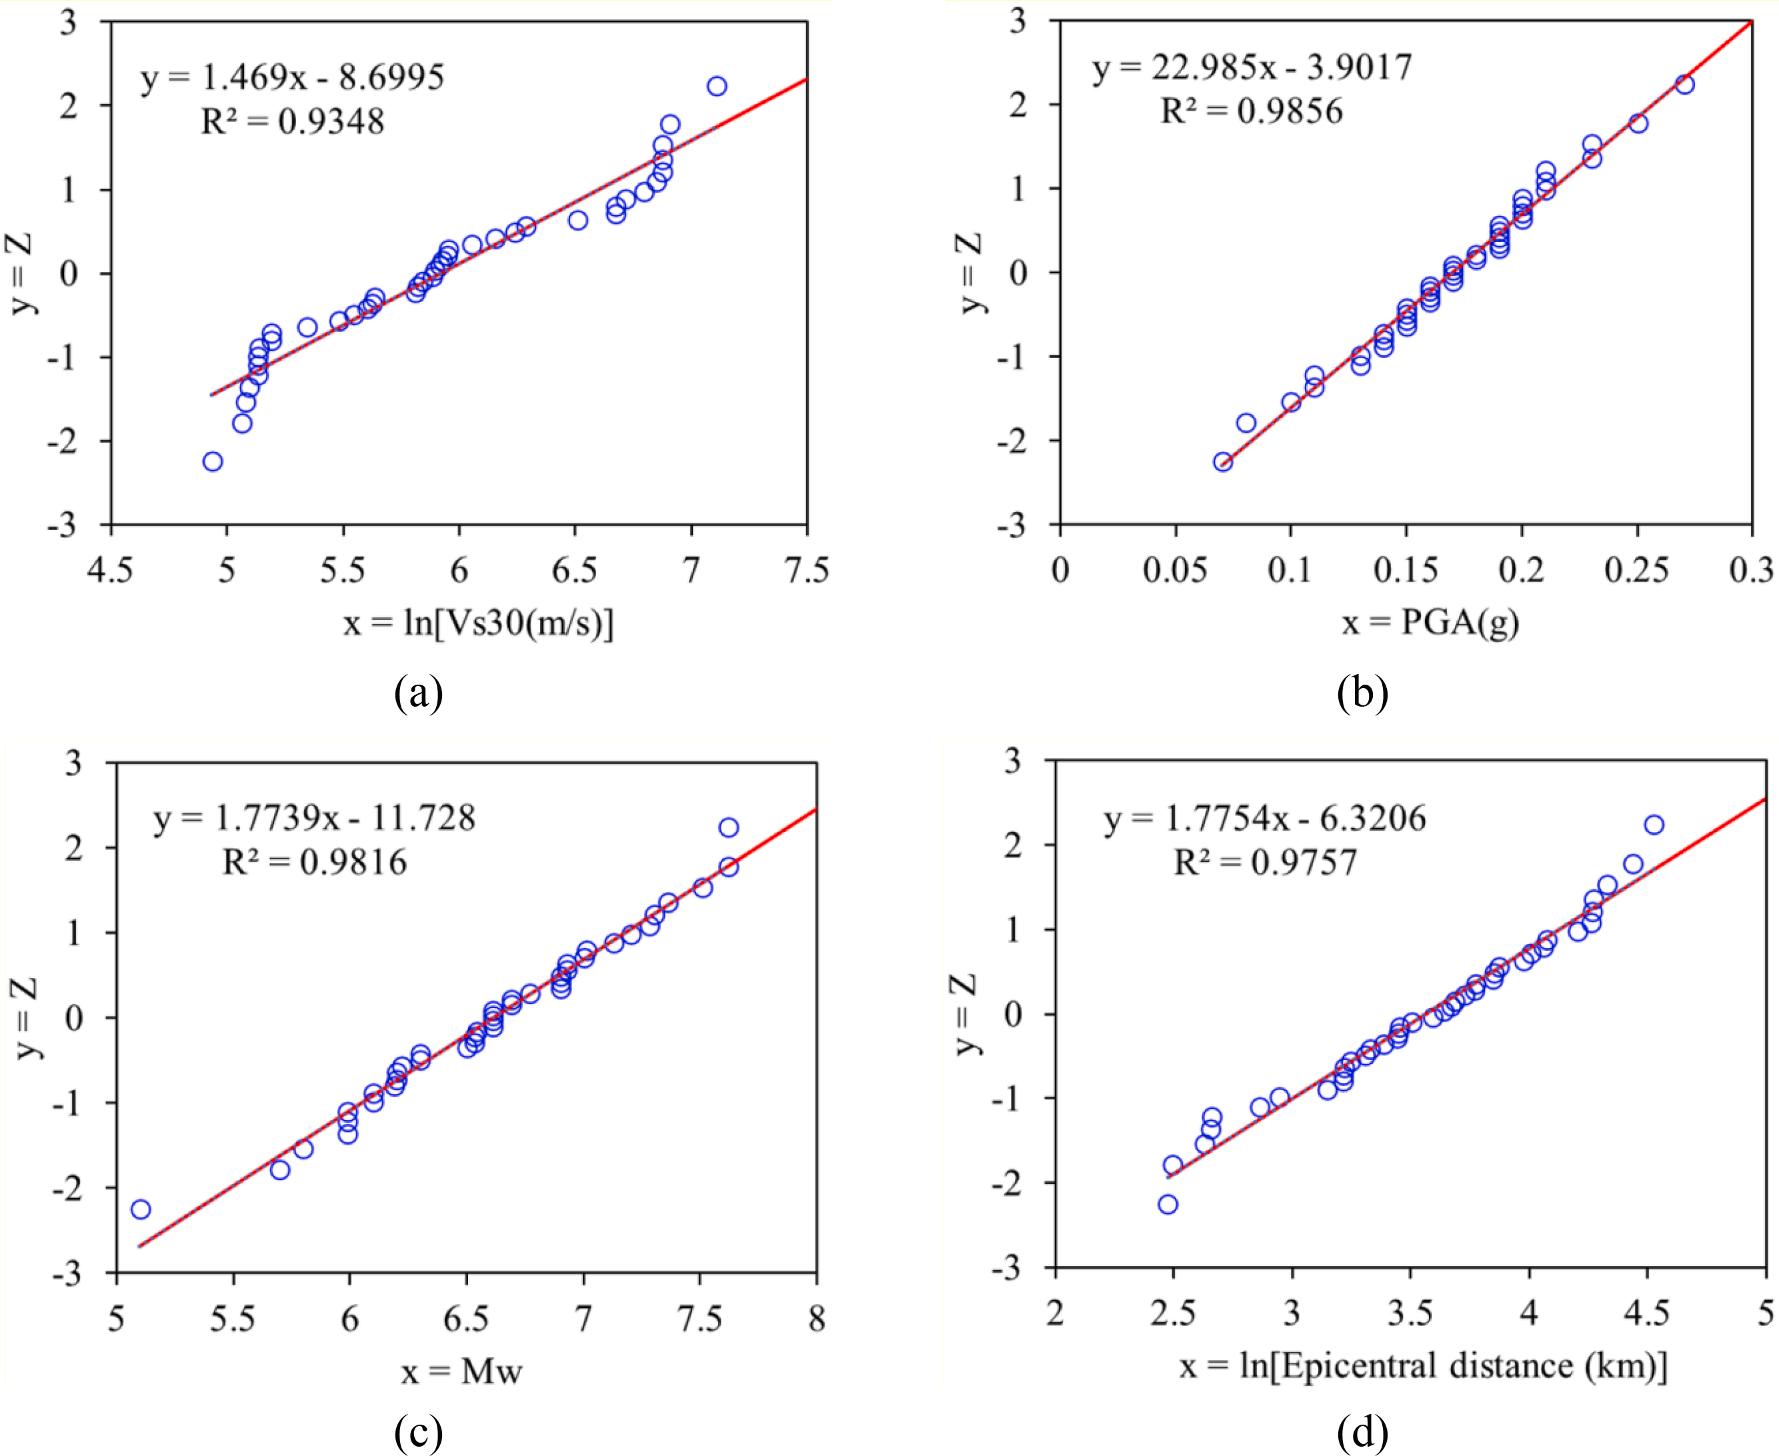
The types of distribution in the data of earthquake characteristics are displayed in Fig. 5 Linear regression results from the least-squares analyses revealed that Vs30 data fits with lognormal distribution, whereas PGA is distributed in the normal distribution. Similarly, moment magnitude Mw and the epicentral distance of the earthquakes are represented in normal and lognormal distributions, respectively. Although the selection was random from the PEER to eliminate stratumuncertainty characteristics, the analyses indicated that earthquake characteristics have correlations between earthquake quantities and uncertainty of stratum in their distribution (i.e., Vs30, PGA, Mw, and epicentral distance). There is a similarity in the distribution shape of PGA and Mw, which represents the earthquake magnitude. Furthermore, there is a prominent correspondence of the convergence degree in distribution between Vs30 and the epicentral distance. The lognormal distribution is more consistent with the geological properties, and hence Vs30 and epicentral distance can be used to estimate geological structure. Therefore, the data on earthquake characteristics can range between the upper and lower bound of the probabilistic seismic hazard curve. In comparison with previous studies [102,103], this proposal of ground motion selection provided accurate results because uncertainties of the parameter of the soil deposit structures were considered without any random modeling by random parameters. These random selections covered uncertainties of the soil parameters. Therefore, seismic hazards defined in terms of acceleration spectra of a set of 40-earthquake records represented the seismic environment.
4. Results and discussion
4.1. Probabilistic seismic demand model
Many seismic standards are used; therefore, site classification criteria for the seismic response of soil profile differ for countries and continents, as presented in Table 3. This study clarified the selection of criteria. Specifically, the EUROCODE-8 standard [104] was used to classify the ground with the average shear wave velocity of the upper 30 m soil layer in the same approach as NBCC [105] and ASCE-7-16 [106] However, in Japan and Mexico, the site period is applied as a ground classification method because the amplification of seismic motion by the ground occurs in the site period and increases the seismic load of structures similar to the site period. The average shear wave velocity of the upper 30 m soil layer and the site period are mixed according to Australia, New Zealand, and China standards. Most classification standards are based on shear wave velocity. Therefore, the shear wave velocity was adopted in this study to classify the seismic site responses of soil deposit profiles.
Uncertainties in soil deposits were considered according to set standards [89,104–106,112] The soil deposits were classified into four groups based on their shear wave velocities Vs30 and corresponded to a decrease in soil stiffness, as listed in Table 4 This classification revealed that it was in accordance with various standards. Therefore, the classification can represent the variation of shear wave velocities of the soil
deposits and uncertainties in soil properties. Multiple stripe analysis [56] by loading a data set of ground motion covering all types of strata can comprehensively assess the seismic performance of MUABs.
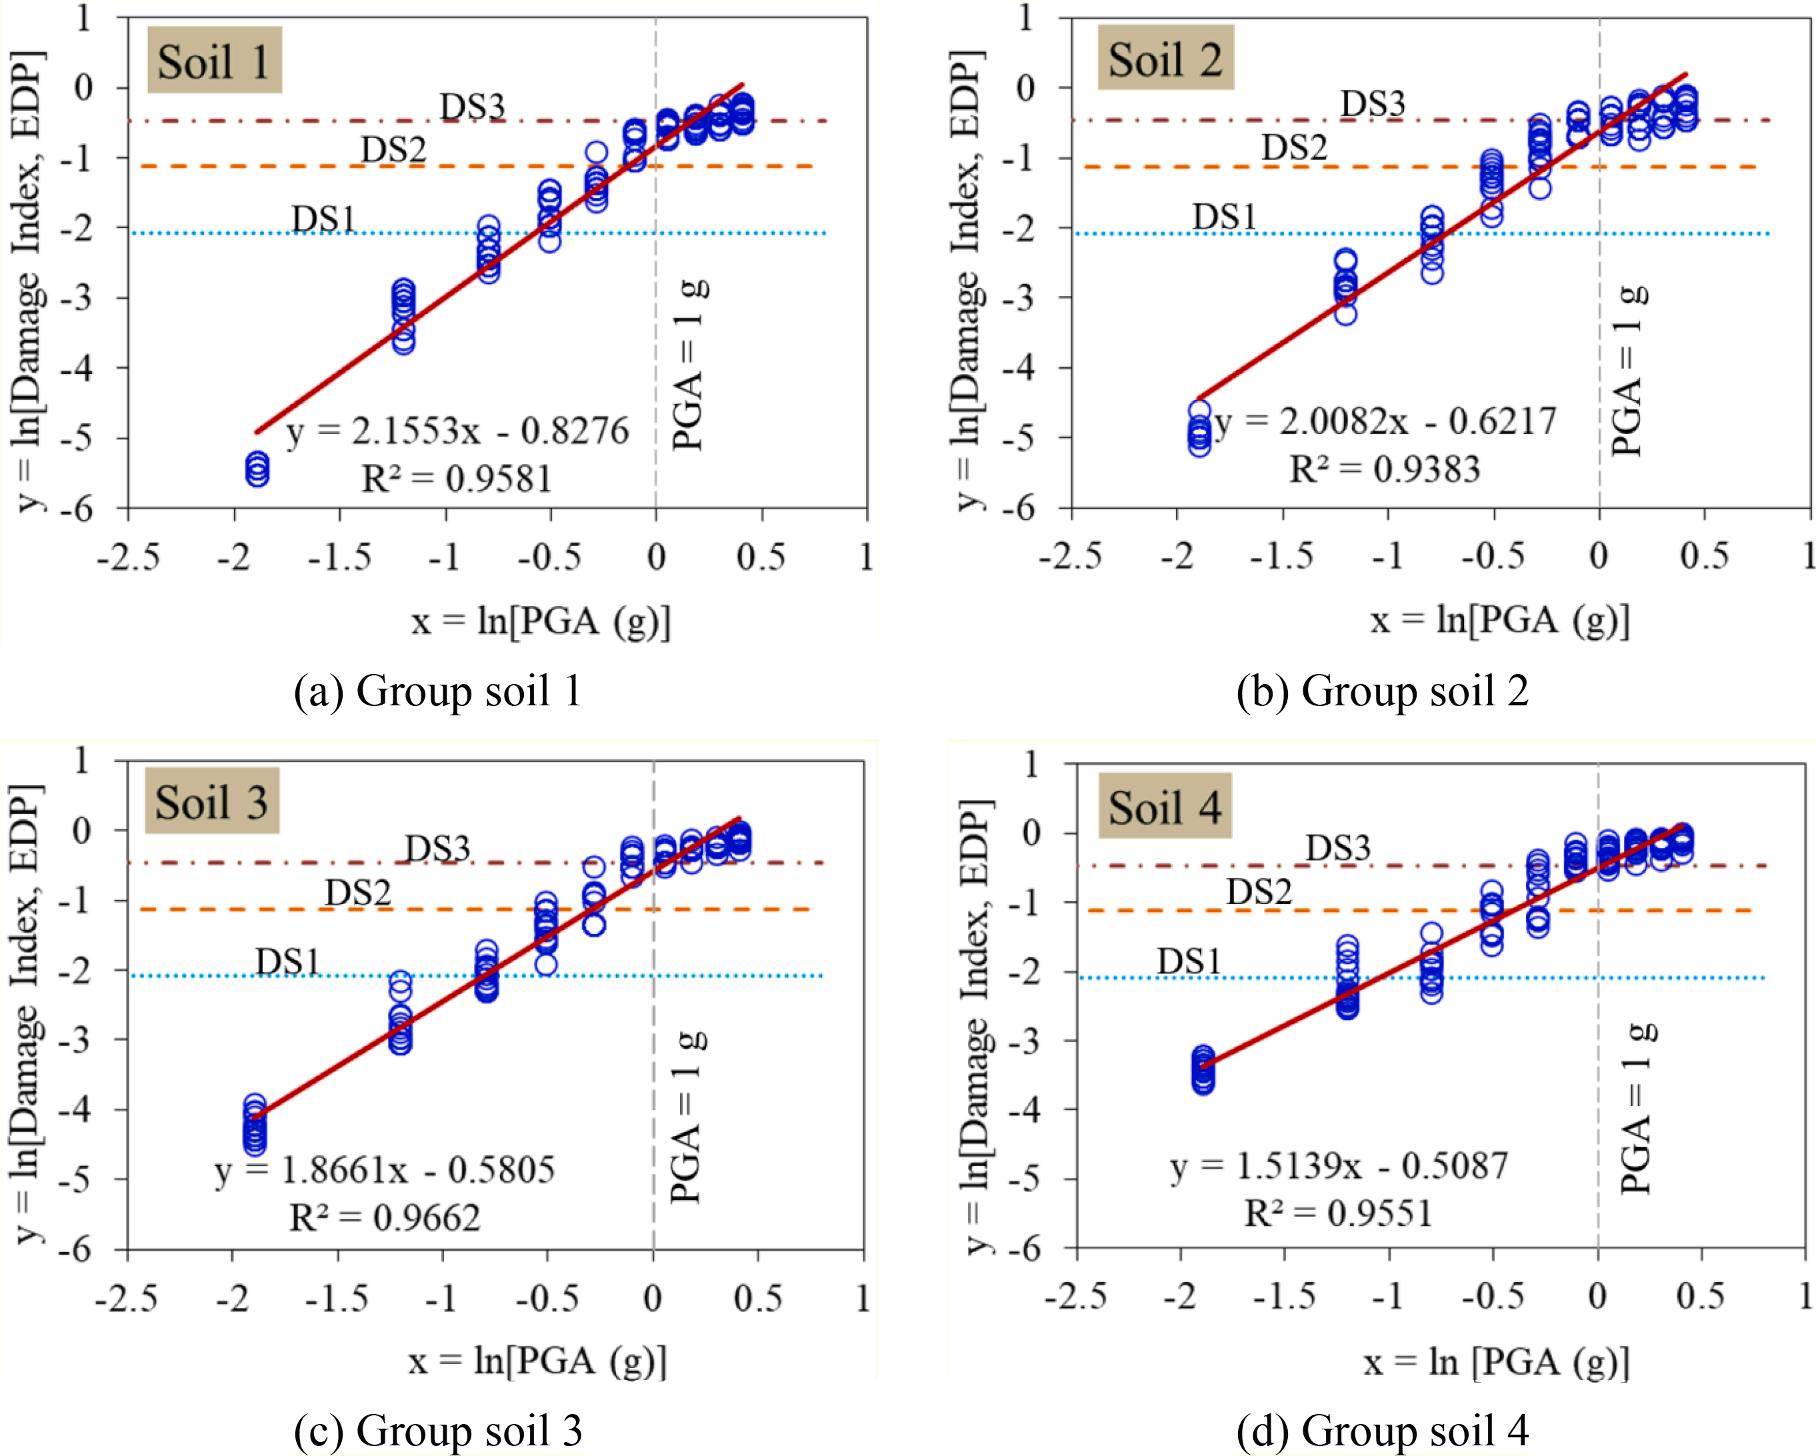
The results of linear regression analysis between DI and PGA with various soil deposits are presented in Fig. 6 The goodness-of-fit (R2) of all analyses is more significant than 0.9. Thus, the discreteness of regression results is small, and these fitting results are satisfactory. This analysis revealed that the correlation between the seismic intensity of ground motions and the DI of MUAB is the lognormal distribution. However, the increase in PGA did not rapidly increase the crack depth when the crack depth was extensive. As mentioned before, the damage index is the ratio of the crack depth and the thickness of the arch component. Crack propagated in the arch depth depends on the ground motion intensity level (i.e., PGA) [23] Generally, the crack occurs at specific intensity then progresses with increments in the PGA. Interestingly, the relationship between the crack depth and the PGA was not perfect linearity from the initial crack to the completed crack. An increase in crack depth propagation slowed down when the concrete reached nearly complete plasticity [23] As a result, the increase in ln (DI) significantly decreased when the PGA increased over a threshold value (PGA = 1 g). Therefore, the relationship between ln(PGA) and ln (DI) is linear for each PGA interval, although the confidence level of the fitting is high.
The higher the Vs30 value is, the lower vulnerability in the MUABs is;
Fig. 4. The response spectrum of the selected ground motion records.
Fig. 5. Distribution function in data of earthquake record characteristics: (a) Travel-time averaged near-surface shear wave velocity Vs30; (b) Peak ground acceleration PGA; (c) Moment magnitude Mw; and (d) Epicentral distance.
Table 3
Site classification criteria for the seismic site response of soil profile corresponding to various standards.
Continent Representative territory Standard Classification criteria
Asia Japan BCJ 1997 [107] Site period
Korea KDS 17 10 00 [89] Shear wave velocity
China GB-50011-2010 [108] Shear wave velocity and site period
Europe EU EUROCODE-8 [104] Shear wave velocity
Oceania Australia
AS-1170.4-2007 [109] Shear wave velocity and site period
New Zealand NZS 1170.5-2004 [110] Shear wave velocity and site period
America Canada NBCC [105] Shear wave velocity
USA ASCE-7-16 [106] Shear wave velocity
Mexico MOC-2008 [111] Site period
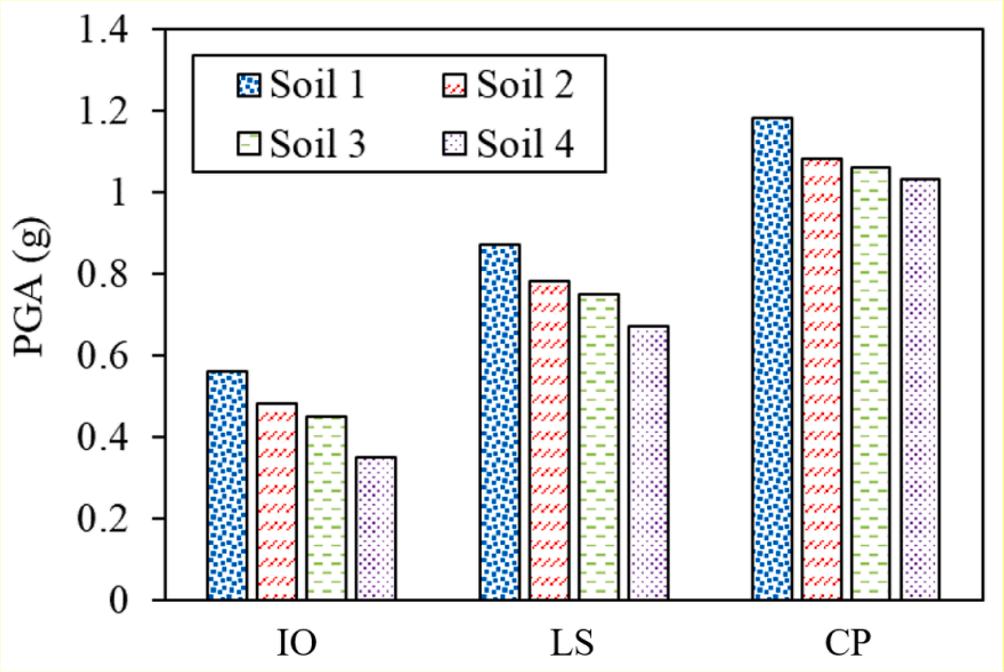
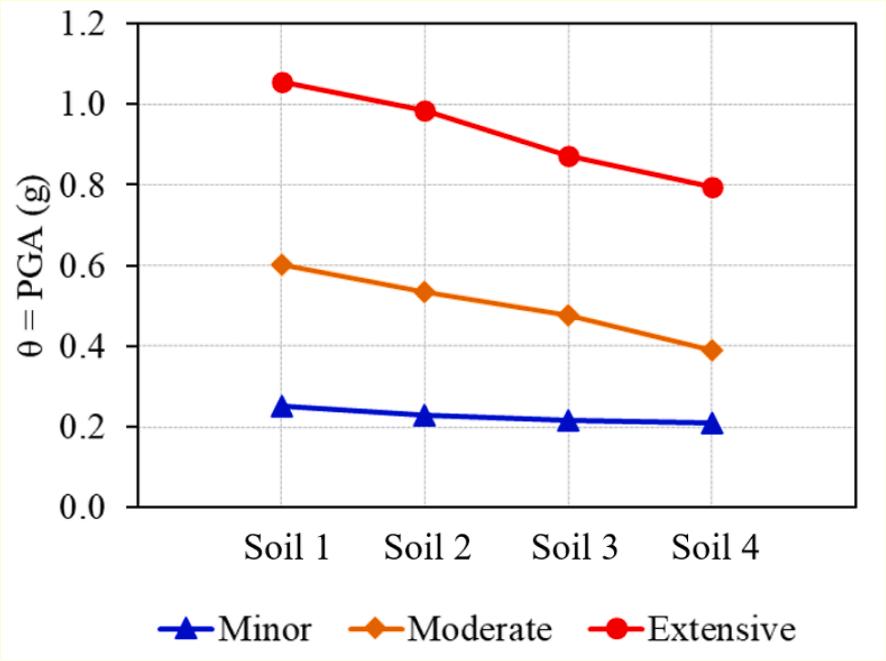
which is consistent with critical findings for buried circular structures [86] because the Vs30 value decreases with the decrease in the hardness in soil properties from group soil 1 to 4, resulting in the reduction of the resistance of the ground to the effects of earthquakes. This result is consistent with that displayed in Fig. 7, in which a correlative comparison exists in the median values of PGA, causing each damage state level to MUAB for various soil deposits. The MUAB exhibited superior results in the stiff soil deposit group because of a higher value of PGA to reach damage state levels.
Table 4
Variation of shear wave velocities of the soil deposits corresponding to earthquake standards.
Group soil Vs30 (m/ s)
Mean Equivalent site class
EUROCODE-8 [104], ASCE-7-16 [106], NEHRP [112], and NBCC [105]
Equivalent site class in KDS 17 10 00 [89]
4.2. Fragility curve
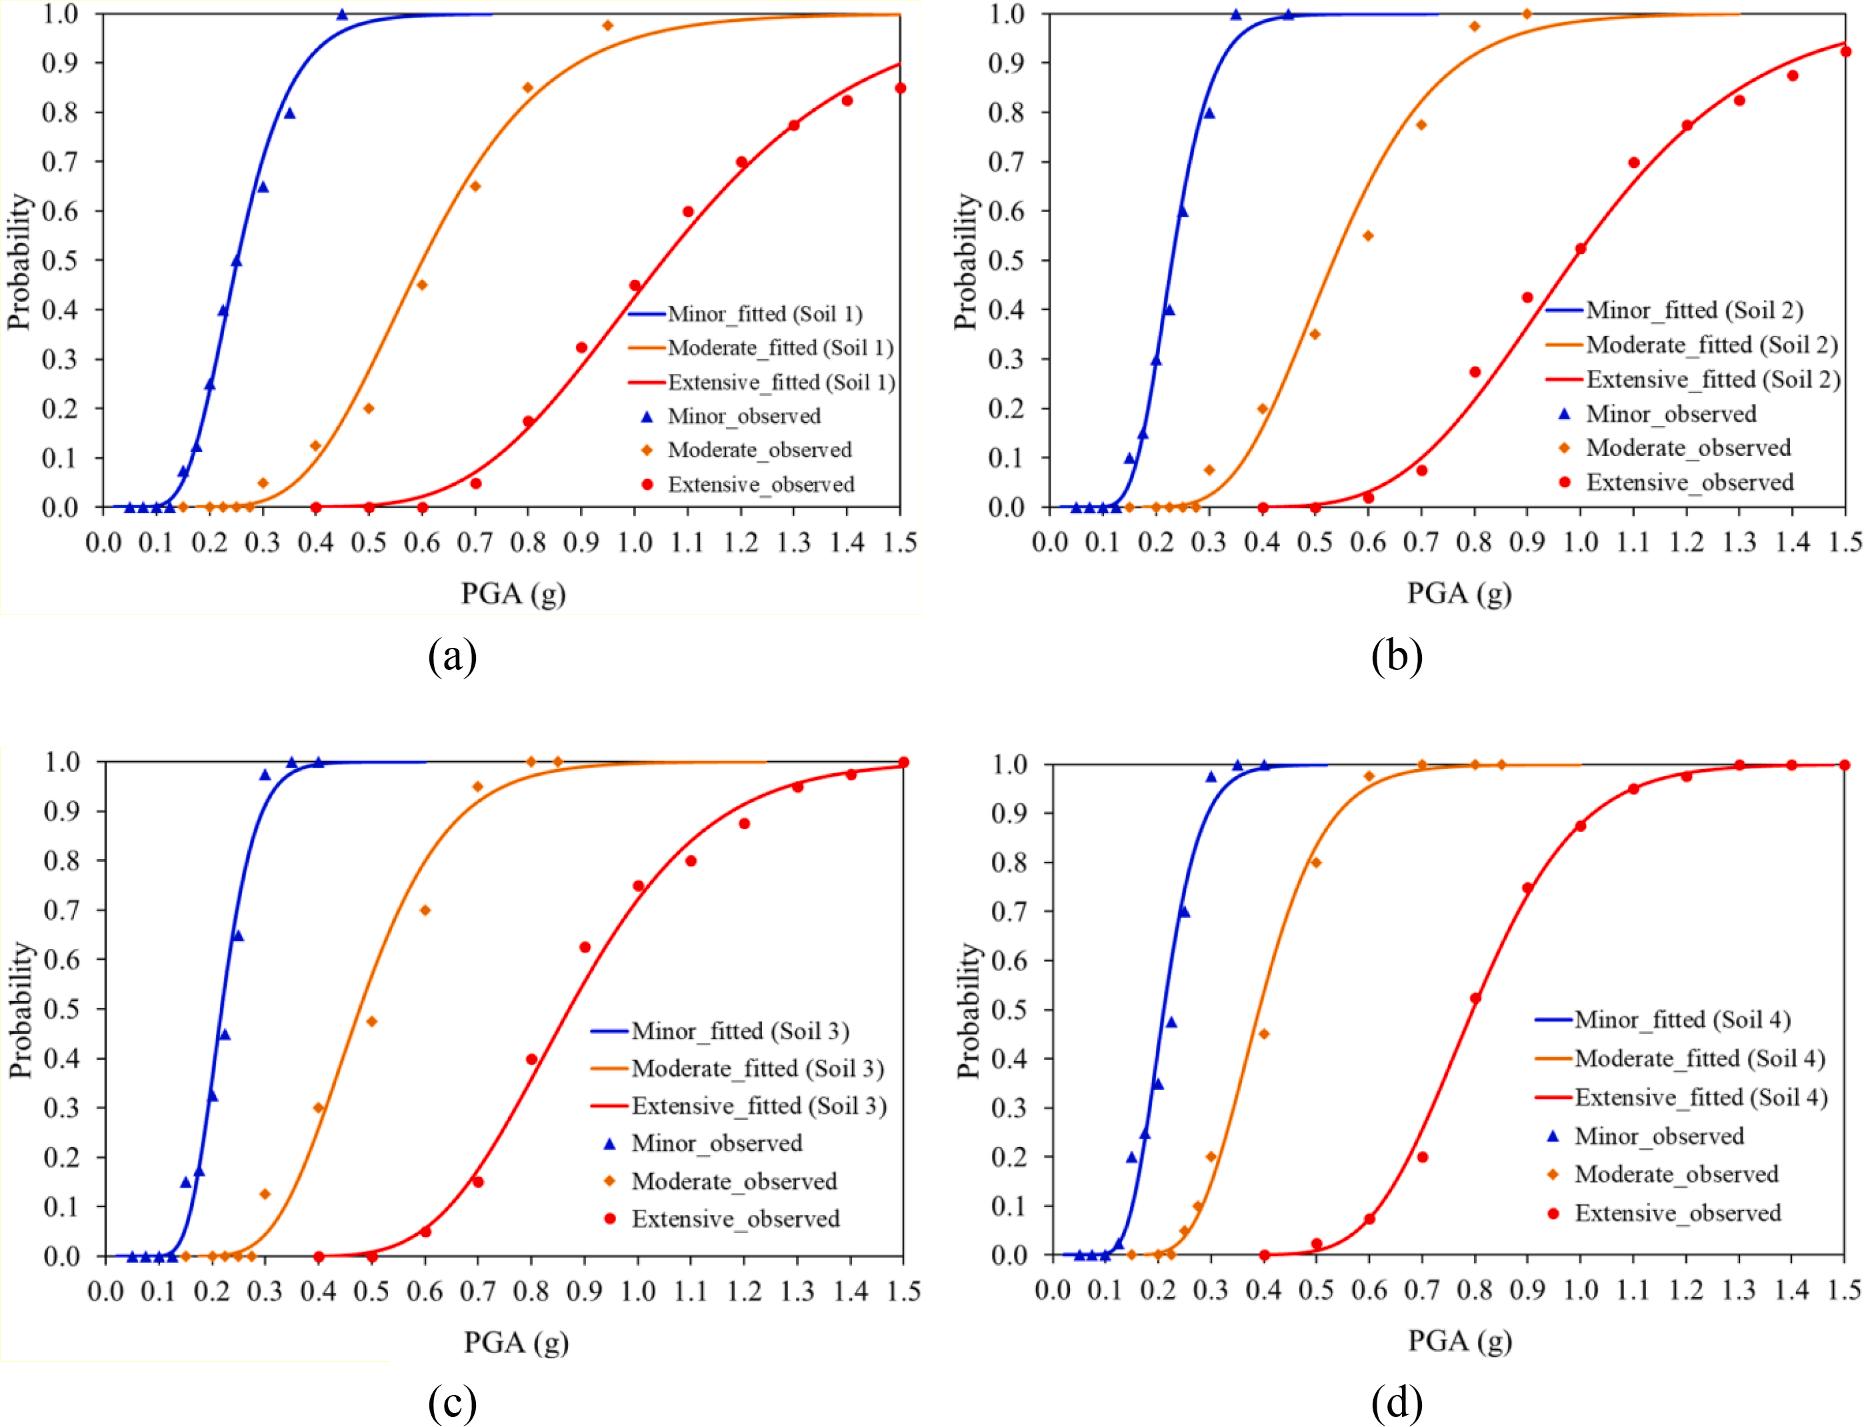
The maximum likelihood method is the most appropriate fitting technique [73,113,114]. Seismic fragility curves represent the conditional probability of exceeding a predefined damage state for various soil types. The validation of the MUAB seismic performance distribution model was performed through the hypothesis testing of good-of-fit for determining the correlation between IM and EDP, as displayed in Fig. 6 Although a limited number of IM levels exist, the fragility fitting using multiple stripe analysis provides considerable advantages in evaluating MUAB because of an effective strategy [56,115]
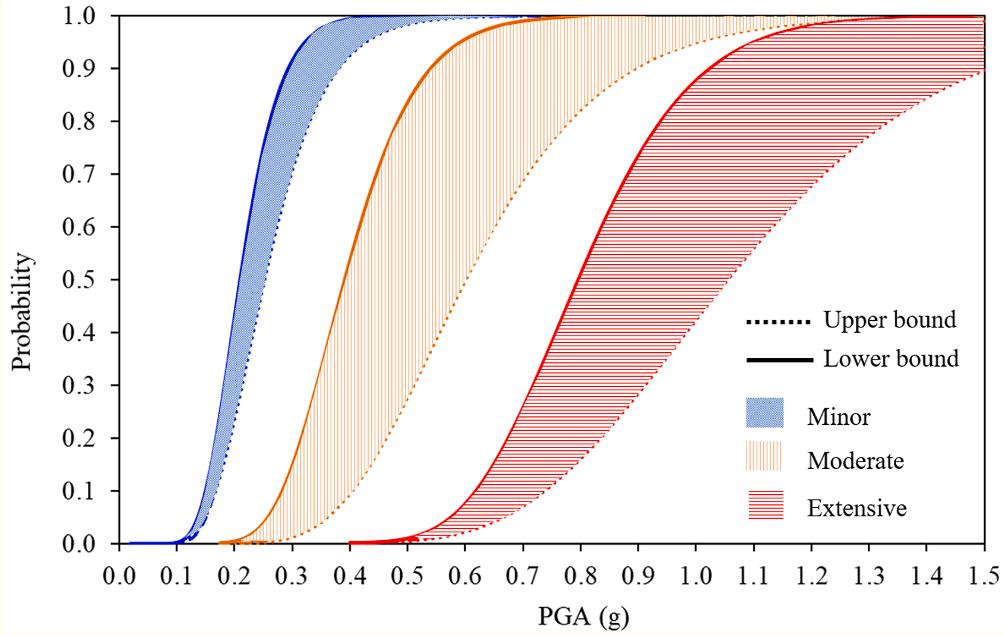
Figs. 8 and 9 depict the fragility curves of the seismic performance of MUAB under the three damage levels for various soil deposits. The
vulnerability curve of the MUAB indicates the probability that the seismic demand of MUAB exceeds a specific failure state under the loading of array IM of earthquakes. The abscissa (horizontal axis) indicates the PGAs representing the magnitude of randomly seismic ground motions. As the intensity of ground motion increases, the collapse probability of MUAB increases. However, the curves differed considerably in various types of soil deposits. The higher performance level progresses from the minor to extensive levels; the curve slope is
gentler. Notably, the better the soil deposit, the smoother the curve. The fragility curve of the minor level is the steepest, which revealed the probability of MUAB surpassing the regular use performance level subjected to the earthquake effect.
Fig. 9 displays each seismic performance level’s probability thresholds (upper and lower thresholds). These probability-bounded regions determine the variation degree of collapse probability for the damage state levels. Furthermore, the variation degree of collapse probability covering uncertainties in soil deposit was dependent on both PGAs and probability levels.
The estimated fragility parameters are listed in Table 5 The estimation is appropriate and reasonable because of the accurate fragility function obtained from structural analyses. The fragility function parameters were calculated by using the maximizing the likelihood function. Results of the estimation revealed that the standard deviation parameter (β) and the median parameter (θ) decreased with a decrease in the soil property of Vs30 (soil 1 to soil 4). Variation of the median parameter is displayed in Fig. 10 The median of the fragility function corresponded with the IM level with a 50% probability of collapse, and β reflected the standard deviation of ln(IM). The effective IM values are approximately centered around the median of the fragility function.
Analysis of the seismic behavior of MUAB [23] revealed that the segment components of MUAB are repairable (corresponding to the crack depth ratio of 20%) when PGA was below 0.47 g for Vs30 = 620 m/ s with individually longitudinal/transverse ground motion. This performance level of MUAB can be equal to the minor damage state (IO). However, the analyzed results revealed that the MUAB could reach the IO level (50% probability) with combined ground motions having PGA
Fig. 6. DI (EDP) versus various IMs for four soil profile classes in accordance with the Korean standard to consider the effects of local soil conditions, geological conditions, and surface and subterranean topography on the seismic demand of the MUAB corresponding to the classification of soil deposits as presented in Table 4
Fig. 7. Relationship between the damage state levels of MUAB for various soil deposits and intensity levels of ground motions.
V.-T.
Fig. 8. Multiple stripe analysis results for observed fractions of collapse, fragility curves based on fragility-estimated function according to maximum likelihood method: (a) Soil 1; (b) Soil 2; (c) Soil 3; (d) Soil 4.
Fig. 9. Probability thresholds for each seismic performance level considering stratum-uncertainty characteristics.
Table 5
Fragility function-related parameters for the soil deposit classification corresponding with the damage state levels.
Damage state level Soil 1 Soil 2 Soil 3 Soil 4
Fig. 10. Variation in the IM level with a 50% probability of collapse for soil classification.
ranging from 0.21 to 0.25 g, regardless of soil deposit profiles.
The level design of earthquake ground motion corresponds with the seismic performance level of MUABs. The probabilistic ground motion in modern earthquake-resistant design standards [89] was used for the expected performance of MUABs displayed in Fig. 11. Three basicdesign earthquake levels are serviceability earthquake (SE) 10% probability of exceedance in 10 years (100-year return period), design basis earthquake (DBE) 10% probability of exceedance in 50 years (500-year return period), and maximum considered earthquake
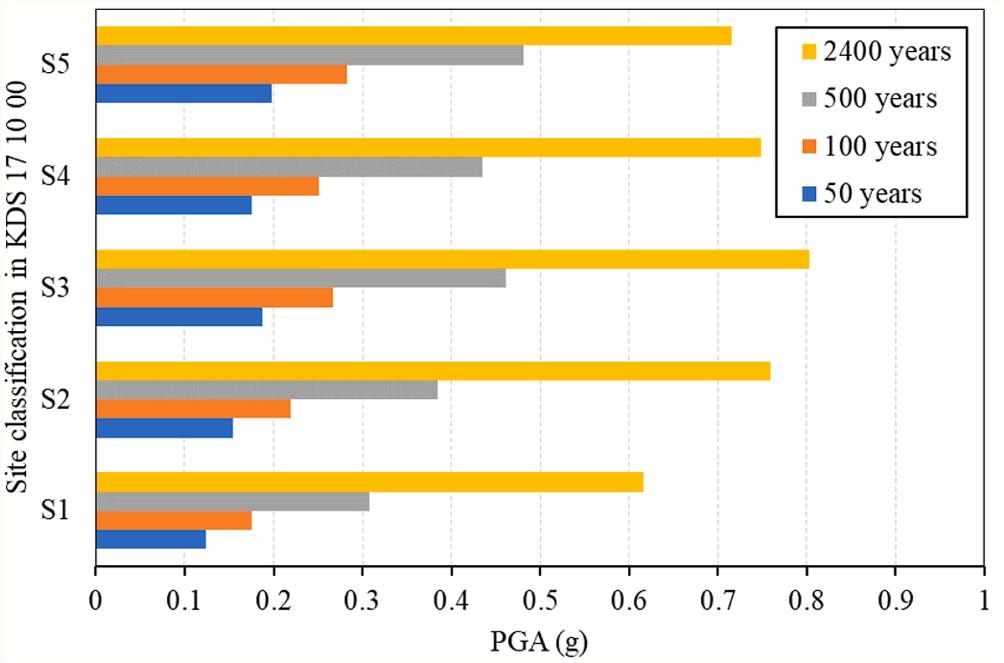
(MCE) 10% probability of exceedance in 250 years (2400-year return period). The seismic performance of MUABs was classified as MUABs that can resist SE without damage, resist DBE with damage that may or may not be economically repaired but without causing extensive loss of life, and resist the most vigorous earthquake expected MCE without collapse, but potentially with extreme damage. Therefore, the MUAB can satisfy the seismic design philosophy [89] The MUAB can resist random SEs with a PGA of 0.3 g and random DBEs with a PGA of 0.5 g.
5. Conclusions
This study proposed an efficient procedure to evaluate the seismic performance of a three-hinge MUAB using multiple stripes analysis to develop fragility curves with 3D finite element models. The MUAB (having geometrical properties of segment arch: inner radius of 5 m, the identical thickness of 0.25 m, widths of each segmental component 1.25 and 0.625 m, length of arch 7.5 m) was used to assess the seismic performance of the arch. As a result, we obtained the following conclusions:
This study indicates that the proposed procedure to select ground motions from the strong-motion database of PEER randomly is feasible to evaluate the seismic vulnerability of MUABs. Damage states can be investigated using the relationship between the crack depth and thickness of the arch component. The multiple stripe analysis approach with the maximum likelihood function can consider the uncertainty characteristics of soil deposits by allowing various ground motions at varying seismic intensity levels. A dataset of ground motions was developed to represent random input ground motion for the fragility analysis of MUABs. Thus, the vulnerability assessment of MUABs to random ground motions was performed.
The likelihood of MUAB collapsing increased with the increase in ground motion intensity. However, the fragility curves in various types of soil deposits differed considerably. The curve slope became gentle as the performance level moved from minor to extensive. The better the soil deposit is, the smoother the curve. The fragility curve of the minor level was the steepest, which revealed the probability of MUAB surpassing the regular use performance level subjected to the earthquake effect. The varying degrees of collapse probability that covered uncertainties in a soil deposit were dependent on both PGAs and probability levels.
The standard deviation and median parameters of the fragility curve decreased with a decrease in the soil property of Vs30. The MUAB could reach the IO level (50% probability) with combined ground motions having PGA ranging from 0.21 to 0.25 g, regardless of soil deposit profiles. The level design of earthquake ground motion corresponds with the seismic performance level of MUABs. The probabilistic ground motion should be used for predicting the performance of MUABs. The
MUAB can satisfy the seismic design philosophy; the MUAB can resist random SEs with a PGA of 0.3 g and random DBEs with a PGA of 0.5 g. Future research should consider the potential effects of the geometrical arch properties, such as arch cross-section shapes, because arch geometry considerably affects MUAB stability.
Declaration of Competing Interest
The authors declare that they have no known competing financial interests or personal relationships that could have appeared to influence the work reported in this paper.
Acknowledgments
The authors acknowledge the support by the Korea Agency for Infrastructure Technology Advancement grant funded by the Ministry of Land, Infrastructure and Transport (20CTAP-C151892-02). The authors also thank PEER for the databases of ground motion records used in this study.
References
[1] Argyroudis SA, Mitoulis SA. Vulnerability of bridges to individual and multiple hazards-floods and earthquakes. Reliability Eng Systm Safety 2021;210:107564. https://doi.org/10.1016/j.ress.2021.107564.
[2] Bao C, Xu F, Chen G, Ma X, Mao M, Zhang S. Seismic vulnerability analysis of structure subjected to uneven foundation settlement. Appl Sci 2019;9:3507. https://doi.org/10.3390/app9173507
[3] Huh J, Haldar A. Stochastic finite-element-based seismic risk of nonlinear structures. J Struct Eng 2001;127:323–9. https://doi.org/10.1061/(ASCE)07339445(2001)127:3(323)
[4] Huh J, Tran QH, Haldar A, Park I, Ahn J-H. Seismic vulnerability assessment of a shallow two-story underground RC box structure. Appl Sci 2017;7:735. https:// doi.org/10.3390/app7070735
[5] Jahangiri V, Yazdani M, Marefat MS. Intensity measures for the seismic response assessment of plain concrete arch bridges. Bull Earthq Eng 2018;16:4225–48. https://doi.org/10.1007/s10518-018-0334-8
[6] Jahangiri V, Yazdani M. Seismic reliability and limit state risk evaluation of plain concrete arch bridges. Struct Infrastruct Eng 2021;17:170–90. https://doi.org/ 10.1080/15732479.2020.1733030
[7] Kabtamu HG, Peng G, Chen D. Dynamic analysis of soil structure interaction effect on multi story RC frame. Open J Civil Eng 2018;08(04):426–46
[8] Katona MG. Seismic design and analysis of buried culverts and structures. J Pipeline Syst Eng Practice 2010;1:111–9. https://doi.org/10.1061/(ASCE) PS.1949-1204.0000057
[9] Kang J, Im H, Park JS. The effect of load reduction on underground concrete arch structures in embedded trench installations. Tunnell Underground Space Technol 2020;98:103240. https://doi.org/10.1016/j.tust.2019.103240.
[10] Lanzano G, Salzano E, de Magistris FS, Fabbrocino G. Seismic vulnerability of natural gas pipelines. Reliab Eng Syst Saf 2013;117:73–80. https://doi.org/ 10.1016/j.ress.2013.03.019
[11] Mangalathu S, Jeon JS, DesRoches R. Critical uncertainty parameters influencing seismic performance of bridges using Lasso regression. Earthquake Eng Struct Dynam 2018;47:784–801. https://doi.org/10.1002/eqe.2991
[12] Pan J, Xu Y, Jin F. Seismic performance assessment of arch dams using incremental nonlinear dynamic analysis. Eur J Environ Civil Eng 2015;19: 305–26. https://doi.org/10.1080/19648189.2014.960950
[13] Perdomo C, Monteiro R, Sucuoglu H. Development of fragility curves for singlecolumn RC Italian bridges using nonlinear static analysis. J Earthquake Eng 2020: 1–25. https://doi.org/10.1080/13632469.2020.1760153
[14] Sevieri G, De Falco A, Andreini M, Matthies HG. Hierarchical Bayesian framework for uncertainty reduction in the seismic fragility analysis of concrete gravity dams. Eng Struct 2021;246:113001. https://doi.org/10.1016/j. engstruct.2021.113001
[15] Seo J, Linzell DG. Horizontally curved steel bridge seismic vulnerability assessment. Eng Struct 2012;34:21–32. https://doi.org/10.1016/j. engstruct.2011.09.008
[16] Seo J, Rogers LP. Comparison of curved prestressed concrete bridge population response between area and spine modeling approaches toward efficient seismic vulnerability analysis. Eng Struct 2017;150:176–89. https://doi.org/10.1016/j. engstruct.2017.07.033
[17] Tsinidis G. Response characteristics of rectangular tunnels in soft soil subjected to transversal ground shaking. Tunnelling Underground Space Technol 2017;62: 1–22. https://doi.org/10.1016/j.tust.2016.11.003
[18] Yazdani M, Jahangiri V. Intensity measure-based probabilistic seismic evaluation and vulnerability assessment of ageing bridges. Earthq Struct 2020;19:379–93. 10.12989/eas.2020.19.5.379.
[19] Ren L, He S, Yuan H, Zhu Z. Seismic fragility analysis of bridge system based on fuzzy failure criteria. Adv Civil Eng 2019;2019:1–13
Fig. 11. PGAs of the probabilistic ground motion in modern earthquakeresistant design standard [89] V.-T. Nguyen
[20] Abe T, Nakamura M. The use of and the caution in the application of the culvert constructed by large pre-cast element in the expressway construction. Found Eng Equip 2014;42:8–11
[21] Fairless G, Kirkaldie D. Earthquake performance of long-span arch culverts. New Zealand Transport Agency Research Report 2008.
[22] Miyazaki Y. Fundamental study on seismic behavior of hinge types of precast arch culverts in culvert longitudinal direction [Doctoral dissertation]: Kyoto University; 2019. 10.14989/doctor.k21736.
[23] Nguyen V-T, Seo J, Ahn J-H, Haldar A, Huh J. Finite element analysis-aided seismic behavior examination of modular underground arch bridge. Tunnell Underground Space Technol 2021;118:104166. https://doi.org/10.1016/j. tust.2021.104166
[24] Jeon SH, Cho K-I, Huh J, Ahn J-H. The performance assessment of a precast, panel-segmented arch bridge with outriggers. Appl Sci 2019;9:4646. https://doi. org/10.3390/app9214646.
[25] Jeon SH, Cho K-I, Lee W-H, Huh J, Ahn J-H. Lifting test and analysis of a segmented arch system with outrigger ribs and flexural loading tests of precast panels. KSCE J Civ Eng 2021;25:4285–303. https://doi.org/10.1007/s12205021-1553-0
[26] Jeon SH, Moon HD, Sim C, Ahn J-H. Construction stage analysis of a precast concrete buried arch bridge with steel outriggers from full-scale field test. Structures 2021;29:1671–89. https://doi.org/10.1016/j.istruc.2020.12.050
[27] Anderson DG, Martin GR, Lam IP, Wang JNJ. NCHRP REPORT 611: Seismic analysis and design of retaining walls, buried structures, slopes, and embankments: Transportation Research Board U; 2008.
[28] Dowding CH, Rozan A. Damage to rock tunnels from earthquake shaking. J Geotech Eng Division 1978;104:175–91. https://doi.org/10.1061/ AJGEB6.0000580
[29] Hashash YM, Hook JJ, Schmidt B, John I, Yao C. Seismic design and analysis of underground structures. Tunnelling Underground Space Technol 2001;16: 247–93. https://doi.org/10.1016/S0886-7798(01)00051-7
[30] ASCE. Earthquake damage evaluation and design considera-tions for underground structures, February. American Society of Civil Engineers, Los Angeles Section 1974.
[31] JSCE. Earthquake resistant design for civil engineering structures in Japan. Tokyo: Japanese Society of Civil Engineers; 1988
[32] Kaneshiro J, Power M, Rosidi D. Empirical correlations of tunnel performance during earthquakes and aseismic aspects of tunnel design. Proceedings of Proceedings of the conference on lessons learned from recent earthquakes On earthquakes in Turkey. 1999
[33] Jing-Ming W, Litehiser Jr JJ. The distribution of earthquake damage to underground facilities during the 1976 Tang-Shan earthquake. Earthquake Spectra 1985;1:741–57. https://doi.org/10.1193/1.1585291
[34] Yu H, Chen J, Bobet A, Yuan Y. Damage observation and assessment of the Longxi tunnel during the Wenchuan earthquake. Tunnelling Underground Space Technol 2016;54:102–16. https://doi.org/10.1016/j.tust.2016.02.008
[35] Wang W, Wang T, Su J, Lin C, Seng C, Huang T. Assessment of damage in mountain tunnels due to the Taiwan Chi-Chi earthquake. Tunnelling Underground Space Technol 2001;16:133–50. https://doi.org/10.1016/S08867798(01)00047-5
[36] Wang Z, Zhang Z. Seismic damage classification and risk assessment of mountain tunnels with a validation for the 2008 Wenchuan earthquake. Soil Dyn Earthquake Eng 2013;45:45–55. https://doi.org/10.1016/j.soildyn.2012.11.002
[37] Huh J, Haldar A. Uncertainty in seismic analysis and design. J Struct Eng 2002; 29:1–7
[38] Tyrtaiou M, Papaleonidas A, Elenas A, Iliadis L. Accomplished reliability level for seismic structural damage prediction using artificial neural networks. Proceedings of international conference on engineering applications of neural networks. Springer; 2020. 10.1007/978-3-030-48791-1_6
[39] Seo J, Hatlestad AJ, Kimn J-H, Hu JW. Application of mathematical functions for seismic increment fragility determination. Eur J Environ Civil Eng 2022;26(2): 473–80.
[40] Wang J. Seismic design of tunnels: a state-of-the-art approach, monograph, monograph 7. New York: Parsons, Brinckerhoff, Quade Douglas Inc; 1993
[41] Miyazaki Y, Sawamura Y, Kishida K, Kimura M. Dynamic centrifuge model tests on seismic performance in culvert longitudinal direction of hinge-type arch culverts due to patterns of embankment shape. J Japan Soc Civil Eng, Ser C (Geosphere Eng) 2017;73(4):429–41
[42] Miyazaki Y, Sawamura Y, Kishida K, Kimura M. Dynamic behaviour of threehinge-type precast arch culverts with various patterns of overburden in culvert longitudinal direction. Physical modelling in geotechnics, Volume 2: CRC Press; 2018. p. 915–20. 10.1201/9780429438646.
[43] Sawamura Y, Ishihara H, Kishida K, Kimura M. Experimental study on damage morphology and critical state of three-hinge precast arch culvert through shaking table tests. Proc Eng, Adv Transport Geotechnics 2016;III(143):522–9. https:// doi.org/10.1016/j.proeng.2016.06.066
[44] Sawamura Y, Kishida K, Kimura M. Centrifuge model test and FEM analysis of dynamic interactive behavior between embankments and installed culverts in multiarch culvert embankments. Int J Geomech 2015;15:04014050. https://doi. org/10.1061/(ASCE)GM.1943-5622.0000361
[45] Byrne PM, Anderson DL, Jitno H. Seismic analysis of large buried culvert structures. Transp Res Rec 1996;1541:133–9. https://doi.org/10.1177/ 0361198196154100117
[46] Miyazaki Y, Sawamura Y, Kishida K, Kimura M. Elasto-plastic 3D FE analysis of the seismic behavior in culvert longitudinal direction of three-hinge type of
precast arch culverts. In: Advances in Computer Methods and Geomechanics. Springer; 2020. p. 223–35. 10.1007/978-981-15-0886-8_18
[47] Homaei F, Yazdani M. The probabilistic seismic assessment of aged concrete arch bridges: the role of soil-structure interaction. Structures 2020;28:894–904. https://doi.org/10.1016/j.istruc.2020.09.038
[48] Abaqus V. 6.14 Documentation. Dassault Systemes Simulia Corporation; 2014
[49] Liu J, Du Y, Du X, Wang Z, Wu J. 3D viscous-spring artificial boundary in time domain. Earthquake Eng Eng Vibr 2006;5:93–102. 10.1007/s11803-006-0585-2
[50] Zhang W, Seylabi EE, Taciroglu E. An ABAQUS toolbox for soil-structure interaction analysis. Computers Geotechnics 2019;114:103143. https://doi.org/ 10.1016/j.compgeo.2019.103143
[51] Lee J, Fenves GL. A plastic-damage concrete model for earthquake analysis of dams. Earthquake Eng Struct Dyn 1998;27:937–56. https://doi.org/10.1002/ (SICI)1096-9845(199809)27:9<937::AID-EQE764>3.0.CO;2-5.
[52] Lee J, Fenves GL. Plastic-damage model for cyclic loading of concrete structures. J Eng Mech 1998;124:892–900. https://doi.org/10.1061/(ASCE)0733-9399 (1998)124:8(892)
[53] Hognestad E. Study of combined bending and axial load in reinforced concrete members1951. http://hdl.handle.net/2142/4360.
[54] Yazdani M, Habibi H. Residual capacity evaluation of masonry arch bridges by extended finite element method. Struct Eng Int 2021:1–12. https://doi.org/ 10.1080/10168664.2021.1944454
[55] Zhang S, Wang G, Sa W. Damage evaluation of concrete gravity dams under mainshock–aftershock seismic sequences. Soil Dyn Earthquake Eng 2013;50: 16–27. https://doi.org/10.1016/j.soildyn.2013.02.021
[56] Baker JW. Efficient analytical fragility function fitting using dynamic structural analysis. Earthquake Spectra 2015;31:579–99. https://doi.org/10.1193/ 021113EQS025M
[57] Muntasir Billah A, Shahria AM. Seismic fragility assessment of multi-span concrete highway bridges in British Columbia considering soil–structure interaction. Can J Civ Eng 2020;48:39–51. https://doi.org/10.1139/cjce-20180667
[58] Le TS, Huh J, Park J-H. Earthquake fragility assessment of the underground tunnel using an efficient SSI analysis approach. J Appl Mathem Phys 2014;2: 1073. https://doi.org/10.4236/jamp.2014.212123
[59] Lee T-H, Park D, Nguyen DD, Park J-S. Damage analysis of cut-and-cover tunnel structures under seismic loading. Bull Earthq Eng 2016;14:413–31. https://doi. org/10.1007/s10518-015-9835-x.
[60] Argyroudis S, Pitilakis K. Seismic fragility curves of shallow tunnels in alluvial deposits. Soil Dyn Earthquake Eng 2012;35:1–12. https://doi.org/10.1016/j. soildyn.2011.11.004
[61] Argyroudis S, Tsinidis G, Gatti F, Pitilakis K. Effects of SSI and lining corrosion on the seismic vulnerability of shallow circular tunnels. Soil Dyn Earthquake Eng 2017;98:244–56. https://doi.org/10.1016/j.soildyn.2017.04.016
[62] HAZUS-MH. Technical Manuals. Federal Emergency Management Agency and National Institute of Building Science: Washington, DC, USA 2004.
[63] Pitilakis K. Fragility Function for Roadway System Elements. SYNER-G; 1995.
[64] ATC-40. Seismic Evaluation and Retrofit of Reinforced Concrete Buildings. Applied Technology Council 1996.
[65] FEMA-356. Prestandard and Commentary for the Seismic Rehabilitation of Buildings. Washington (DC)2000.
[66] Cornell CA, Jalayer F, Hamburger RO, Foutch DA. Probabilistic basis for 2000 SAC federal emergency management agency steel moment frame guidelines. J Struct Eng 2002;128:526–33. https://doi.org/10.1061/(ASCE)0733-9445 (2002)128:4(526)
[67] Dutta A, Mander J. Seismic fragility analysis of highway bridges. Proceedings of Proceedings of the INCEDE-MCEER center-to-center project workshop on earthquake engineering Frontiers in transportation systems1998.
[68] Jernigan J, Hwang H. Development of bridge fragility curves. Proceedings of 7th US National Conference on Earthquake Engineering. MA: EERI Boston; 2002
[69] Kunnath SK, Larson L, Miranda E. Modelling considerations in probabilistic performance-based seismic evaluation: case study of the I-880 viaduct. Earthquake Eng Struct Dynmics 2006;35:57–75. https://doi.org/10.1002/ eqe.531
[70] Muntasir Billah A, Shahria AM. Seismic fragility assessment of concrete bridge pier reinforced with superelastic shape memory alloy. Earthquake Spectra 2015; 31:1515–41. https://doi.org/10.1193/112512EQS337M
[71] Kappos AJ, Panagopoulos G, Panagiotopoulos C, Penelis G. A hybrid method for the vulnerability assessment of R/C and URM buildings. Bull Earthq Eng 2006;4: 391–413. https://doi.org/10.1007/s10518-006-9023-0
[72] Padgett JE, DesRoches R. Methodology for the development of analytical fragility curves for retrofitted bridges. Earthquake Eng Struct Dyn 2008;37:1157–74. https://doi.org/10.1002/eqe.801
[73] Shinozuka M, Feng MQ, Lee J, Naganuma T. Statistical analysis of fragility curves. J Eng Mech 2000;126:1224–31. https://doi.org/10.1061/(ASCE)0733-9399 (2000)126:12(1224)
[74] Salmon M, Wang J, Jones D, Wu C. Fragility formulations for the BART system. Advancing mitigation technologies and disaster response for lifeline systems; 2003. p. 183–92. 10.1061/40687(2003)19.
[75] Tekie PB, Ellingwood BR. Seismic fragility assessment of concrete gravity dams. Earthquake Eng Struct Dyn 2003;32:2221–40. https://doi.org/10.1002/eqe.325
[76] Lee Y-J, Moon D-S. A new methodology of the development of seismic fragility curves. Smart Struct Syst 2014;14(5):847–67
[77] Zhao C, Yu N, Peng T. Probabilistic seismic fragility assessment of isolated nuclear power plant structure using IDA and MSA methods. Structures 2021;34: 1300–11. https://doi.org/10.1016/j.istruc.2021.08.034.
V.-T. Nguyen
[78] Pang R, Xu B, Zhou Y, Zhang X, Wang X. Fragility analysis of high CFRDs subjected to mainshock-aftershock sequences based on plastic failure. Eng Struct 2020;206:110152. https://doi.org/10.1016/j.engstruct.2019.110152
[79] Zhao C, Yu N, Peng T, Gautam A, Mo YL. Vulnerability assessment of AP1000 NPP under mainshock-aftershock sequences. Eng Struct 2020;208:110348. https:// doi.org/10.1016/j.engstruct.2020.110348
[80] Xu B, Pang R, Zhou Y. Verification of stochastic seismic analysis method and seismic performance evaluation based on multi-indices for high CFRDs. Eng Geol 2020;264:105412. https://doi.org/10.1016/j.enggeo.2019.105412
[81] Pang R, Xu B, Zhou Y, Song L. Seismic time-history response and system reliability analysis of slopes considering uncertainty of multi-parameters and earthquake excitations. Comput Geotech 2021;136:104245. https://doi.org/ 10.1016/j.compgeo.2021.104245
[82] Kassem MM, Nazri FM, Farsangi EN. The seismic vulnerability assessment methodologies: A state-of-the-art review. Ain Shams Eng J 2020;11:849–64. https://doi.org/10.1016/j.asej.2020.04.001
[83] Zhong Z, Shen Y, Zhao M, Li L, Du X, Hao H. Seismic fragility assessment of the Daikai subway station in layered soil. Soil Dyn Earthquake Eng 2020;132:106044. https://doi.org/10.1016/j.soildyn.2020.106044
[84] Zhang C, Zhao M, Zhong Z, Du X. Seismic intensity measures and fragility analysis for subway stations subjected to near-fault ground motions with velocity pulses. J Earthquake Eng 2021:1–27. https://doi.org/10.1080/ 13632469.2021.1994056
[85] Nguyen D-D, Thusa B, Han T-S, Lee T-H. Identifying significant earthquake intensity measures for evaluating seismic damage and fragility of nuclear power plant structures. Nucl Eng Technol 2020;52:192–205. https://doi.org/10.1016/j. net.2019.06.013
[86] Zhang WA. Quantitative seismic behavior assessment of buried structures [Doctoral dissertation]. Los Angeles: University of California; 2019
[87] Corigliano M, Lai CG, Barla G. Seismic vulnerability of rock tunnels using fragility curves. Proceedings of Congress of the International Society for Rock Mechanics: OnePetro. 2007
[88] Shome N. Probabilistic seismic demand analysis of nonlinear structures. Stanford University; 1999
[89] KDS. KDS 17 10 00:2018 Earthquake-resistant design. Korea Construction Standards Center; 2018
[90] KDS. KDS 41 17 00:2019 Building Seismic Design Code. Korea Construction Standards Center; 2019.
[91] Hu X, Zhou Z, Chen H, Ren Y. Seismic fragility analysis of tunnels with different buried depths in a soft soil. Sustainability 2020;12:892. https://doi.org/10.3390/ su12030892
[92] Chen Xu, Xiang N, Li J, Guan Z. Influence of near-fault pulse-like motion characteristics on seismic performance of tall pier bridges with fragility analysis. J Earthquake Eng 2022;26(4):2001–22
[93] Bommer JJ, Acevedo AB. The use of real accelerograms as input to dynamic analysis. J Earthquake Eng 2004;8:43–91. https://doi.org/10.1080/ 13632460409350521
[94] Richter CF. An instrumental earthquake magnitude scale. Bull Seismol Soc Am 1935;25:1–32. https://doi.org/10.1785/BSSA0250010001
[95] Borcherdt RD. Estimates of site-dependent response spectra for design (methodology and justification). Earthquake spectra 1994;10:617–53. https:// doi.org/10.1193/1.1585791
[96] Hollender F, Cornou C, Dechamp A, Oghalaei K, Renalier F, Maufroy E, et al. Characterization of site conditions (soil class, V S30, velocity profiles) for 33 stations from the French permanent accelerometric network (RAP) using surfacewave methods. Bull Earthq Eng 2018;16(6):2337–65
[97] Wang HY, Wang SY. A new method for estimating VS(30) from a shallow shearwave velocity profile (depth < 30 m). Bull Seismol Soc Am 2015;105:1359–70. https://doi.org/10.1785/0120140103
[98] Ancheta TD, Darragh RB, Stewart JP, Seyhan E, Silva WJ, Chiou B-J, et al. NGAWest2 database. Earthquake Spectra Bull Seismol Soc Am 2014;30(3):989–1005
[99] Goulet CA, Kishida T, Ancheta TD, Cramer CH, Darragh RB, Silva WJ, et al. PEER NGA-East database. Earthquake Spectra 2021;37(1_suppl):1331–53
[100] Boore DM. Orientation-independent, nongeometric-mean measures of seismic intensity from two horizontal components of motion. Bull Seismol Soc Am 2010; 100:1830–5. https://doi.org/10.1785/0120090400.
[101] Kohrangi M, Bazzurro P, Vamvatsikos D. Conditional spectrum bidirectional record selection for risk assessment of 3D structures using scalar and vector IMs. Earthquake Eng Struct Dyn 2019;48:1066–82. https://doi.org/10.1002/ eqe.3177
[102] Pehlivan M, Rathje EM, Gilbert RB. Factors influencing soil surface seismic hazard curves. Soil Dyn Earthquake Eng 2016;83:180–90. https://doi.org/10.1016/j. soildyn.2016.01.009
[103] Trevlopoulos K, Zentner I. Seismic fragility curve assessment based on synthetic ground motions with conditional spectra. Pure Appl Geophys 2020;177:2375–90. https://doi.org/10.1007/s00024-019-02245-w
[104] EUROCODE-8. Design of structures for earthquake resistance. 1998-1:2004. European Committee for Standardiztion; c2004 299 p 2004.
[105] NBCC. National Building Code of Canada. National Research Council of Canada, Ottawa, Ontario 2005.
[106] ASCE-7-16. Minimum Design Loads and Associated Critera for Buildings and Other Structures. 7-16. USA. American Society of Civil Engineers; c2016 2016.
[107] BCJ-1997. Structural provisions for building structures. 1997 edition Tokyo: Building Center of Japan. Japan 1997.
[108] GB-50011-2010. Code for Seismic Design of Buildings, Beijing. Ministry of Housing and Urban-Rural Development of the People’s Republic of China; c2010 2010.
[109] AS-1170.4-2007. Structural design actions, part 4: Earthquake actions in Australia. American Society of Civil Engineers, Los Angeles Section 2007.
[110] NZS-1170.5:2004. Structural design actions - Part 5: Earthquake actions - New Zealand. New Zealand 2004.
[111] MOC-2008. Manual of Civil Structures. Mexico 2008.
[112] NEHRP. National Earthquake Hazard Reduction Program, (1994). Recommended provisions for seismic regulations of new buildings: Part I, Provisions. FEMA 222A, Federal Emergency Management Agency, Washington, DC 1994.
[113] Baker JW, Cornell AC. A vector-valued ground motion intensity measure consisting of spectral acceleration and epsilon. Earthquake Eng Struct Dyn 2005; 34:1193–217. https://doi.org/10.1002/eqe.474
[114] Straub D, Kiureghian AD. Improved seismic fragility modeling from empirical data. Struct Saf 2008;30:320–36. https://doi.org/10.1016/j. strusafe.2007.05.004
[115] Eads L, Miranda E, Krawinkler H, Lignos DG. An efficient method for estimating the collapse risk of structures in seismic regions. Earthquake Eng Struct Dyn 2013; 42:25–41. https://doi.org/10.1002/eqe.2191
Other documents randomly have different content
In addition to the food, clear sunshine is essential and an individual idiosyncrasy. All animals, though equally exposed are not equally attacked.
Symptoms. These do not differ materially from those of the white face and foot disease already described. There are intense redness and tumefaction of the white skin or the white portions, showing prominently in the delicate parts (ears, eyelids, lips), with violent itching, rubbing and sometimes vesicles with yellowish contents, followed by sores and scabs. In the winter season there may be itching and rubbing only. In summer it may become erysipelatoid and extend to the mucosæ, of the respiratory and digestive organs, with hyperthermia, nervous excitement, vertigo, turning in a circle and even spasms and convulsions.
Treatment. This is essentially the same as for the white face and foot disease with this additional that the buckwheat or other offensive ingredient must be withdrawn from the ration, and what remains in the bowels must be expelled by saline or other laxative. Cooling diuretics must follow to eliminate irritant matters that may have been absorbed.
ERYTHEMA FROM IRRITANTS.
Irritant agents of all kinds, even if caustic or pustulant in concentrated forms, may be so diluted as to cause simple erythema. Among chemical agents we have ammonia, lye, caustic acids and salts, iodine, carbolic acid, the various tar products, kerosene, aniline, chloroform, ether, formaline, etc. Of thermic irritants may be named solar heat, fire heat, steam, hot water, hot air, and congelation (chillblains, freezing) the latter being especially common in the digital region when salt has been applied to snow or ice. Vegetable irritants include mustard, capsicum, moulds, euphorbium, rhus, milkwort, the volatile oils, etc. Among animal irritants must be named cantharides, mylabris, potato beetle, insect stings, venom of the irritated toad, liquid discharges from the kidneys or bowels, and discharges from open sores. Even the escape of tears upon the face will cause erythema.
The symptoms in all such cases will vary with the potency of the factor and the susceptibility of the skin. Beside the common symptoms the color and odor of the skin will often yield valuable diagnostic indications. There is the white of muriatic acid, carbolic acid or zinc chloride, the black of silver salts or sulphuric acid, the yellow of iodine, chromium compounds and nitric acid, the well known odors of ammonia, iodine, chlorine, carbolic acid, tar, essential oils, chloroform, ether, formaline, kerosene, mustard, etc.
Treatment is that of simple erythema after one has applied the appropriate antidote to the particular irritant. For the alkalies and carbolic acid use vinegar, for the acids oxide or carbonate of magnesia, chalk or lime water, for iodine and chlorine weak alkaline solutions, for rhus, ammonia or other alkali, or potassium permanganate, and for insect stings and animal venoms, alkalies or permanganates. The caustic salts may demand milk, white of egg, or
some other albuminous solution. When no chemical antidote is available, the first step is to wash off the offending agent, and then treat the erythema.
DERMATITIS.
Under this head may be included a class of inflammations of the skin, due mainly or entirely to external causes, not essentially parasitic, and attended by distinct eruptions (papular, vesicular, pustular, etc.). Many of these are but an advance beyond the simple erythematous inflammation, and coincide with it, the one condition being present at one part of the diseased area, and the more advanced and severe lesions at another part. Bearing in mind the frequency of this connection, it will be unnecessary to dwell at length on this class of affections.
Dermatitis Traumatica. Dermatitis from Mechanical Injury. Besides the veritant factors already named as causing traumatic erythema, we must here recognize contusions, overreaching, treads, interfering, bruising and chafing by harness, girths, circingles, hobbles, ropes, traces, twists, and blows with whip, club, chain or rope. Here the source of injury must be removed, by attention to shoeing, harness, etc., and the lesions treated according to their gravity as simple wounds.
Dermatitis Venenata: Dermatitis Calorica. These, like the corresponding erythema, come from contact with irritant plants or animals or their products, from excessive heat or cold, and may show any grade of eruption or even gangrene and sloughing. Apart from the washing off of the irritant or venomous matter and the application of alkalies or permanganates in the case of the latter, these must be treated like ordinary sores. In burns, especial value attaches to solutions of sodium bicarbonate, and preparations that will exclude the air. Vesicles may be emptied by puncture and the part covered with cotton soaked in carbolated sweet oil and lime water, or carron oil (linseed oil and lime water) may be freely applied, or a resorcin solution (2:100 water), or a thick varnish of
linseed oil and litharge, equal parts, with 5 per cent. of salicylic acid, melted and painted over the surface. A layer of surgeon’s cotton covered by a rubber bandage where admissible, will complete the dressing. In the process of healing, skin grafting may be required. Thin slices of cuticle are placed in the center of the granulating surface, or at intervals and carefully bound in place.
When a part has been frozen the usual method is to recover circulation slowly by rubbing with cold water or snow. The parts are then treated by astringent and antiseptic dressings. If the skin sloughs use antiseptics until it separates, and then treat like an ordinary sore.
Chillblains may be treated with a mixture of sweet oil, 5 ozs., oil of turpentine ½ oz., Aqua Ammonia ½ oz., oil of peppermint 1 dr., or powdered camphor 10 grs., Peru balsam 20 drops, linseed oil 2 ozs.
Nourishing food and a course of iron should be given.
Dermatitis Medicamentosa. Medicines given by the mouth sometimes cause inveterate skin eruptions. Among these are arsenic, belladonna, bromides, iodides, mercurials, salicylates, tansy, turpentine, tar, and the carminative seeds and oils. The latter are chargeable with many eruptions in live stock fed on patent foods. In cattle treated with iodides for actinomycosis, an universal eruption and desquamation is a common condition. In all such cases the drug must be withheld, the bowels cleared out by a purgative and the elimination of any remaining irritant products favored by gentle diuretics.
ECZEMA. A BOILING OUT. A PUSTULE.
General method of eruption. Successive advancing lesions. Definition. Causes: usual factors and special susceptibility.
This term, standing for what boils out, has long been applied to vesicular eruptions on the skin, but inasmuch as the inflammation rarely stops short with vesiculation, but usually in part at least goes on to more advanced lesions, it must be held to include in many cases erythema, papules, vesicles, pustules, crusts, desquamations and erosions. All of these may coexist or succeed each other in the same subject, so that considerable latitude must be allowed to the name to cover all parts and stages of the same attack. Dermatologists have defined eczema as a non-infectious inflammation of the skin with multiform manifestations, but recent observations would indicate that it may at times, at least, be contagious, and micrococci have been found in the serum of the vesicles, while the very occurrence of pus must virtually imply the existence of a bacterial infection. Doubtless different diseases pass under this name in the different genera and species, and even in the same variety of animals, yet until we learn to discriminate sharply the one from the other, it is convenient to consider the whole as a kindred clinical group, if not a pathological entity.
Definition. An acute or more frequently, a chronic inflammation of the skin and sometimes of the mucosæ, characterized by itching, erythema, papules, vesicles, serous or sero-purulent exudation with squama or crusts and loss of hair, and usually largely due to an internal cause. The exudative condition has suggested a catarrh of the skin.
Causes. These are the usual causes of skin disease, local and general, together with a special susceptibility, under which, what are
ordinary irritants produce this characteristic disease. Many local irritants can produce eczema, but again it is often the case that these factors will operate on a given susceptible subject while on another they are without much effect. This susceptibility is called a “dartrous diathesis” by the French writers, while most English and American writers are willing rather to find the hidden cause or causes in the disorder of internal organs (digestive, hepatic, urinary, generative, hæmatic, trophic, infective, plethoric, atonic).
ACUTE ECZEMA IN SOLIPEDS. DORSAL ASPECT.
Head, neck, shoulder, back, under girths, breeching, crupper. Summer. Moulting. Heavy coat. Thin skin. Youth. Symptoms: erect hair, papular groups, hot, thick rigid skin, itching, abrasion, ulceration, encrusting, pustules, white spot and hair. Treatment: laxative, cooling diet, cleanliness, pure air, shade, rest, alkalies, locally vaseline, astringents, dusting powder, anodynes, tar water, creolin, etc.
This shows itself especially on the head, the sides of the neck, under the collar, or saddle, the circingle or crupper, the breeching or general surface. In these cases the profuse secretion of sweat, and the friction of the harness is a marked local factor in its production. It often shows a preference for the summer season, the period of shedding the coat, the heavy coated animal, the animal with white, thin or delicate skin. Youth also predisposes.
Symptoms. There is usually erection or roughness of the hair, and the formation at such points of minute papules like small peas collected in groups. The skin may feel hot, thickened, lacking in pliancy, not to be pinched up in folds, the panniculus is contracted and manipulation shows tenderness. Soon the papules flatten and desicate and more or less violent itching sets in. The patient rubs or scratches himself, causing deep red congestion of the surface or even abrasion, or ulceration. Apart from abrasion the skin becomes covered with crusts or even scales which agglutinate tufts of hairs and dry up and desquamate.
In other cases the eruption advances from the condition of papules to that of vesicles and even of pustules, though finally drying up with the same pruritus as in the papular form.
In either case the affected parts are more or less depilated, red if on unpigmented skin, grayish and scabby or scurfy if on the darker.
At times, after recovery, the patch remains devoid of pigment and hairs growing from it are white.
Treatment. It is usually desirable to clear out the prima viæ by aloes or Glauber salts, to resort to a carefully regulated, non-heating diet, to clean the skin of all concretions from sweat or otherwise, to give pure air and shade and to protect the animal from active exertion, profuse sweating and friction by harness or otherwise. In the early stages benefit will often come from the use of alkalies, especially sodium bicarbonate. Locally an inunction with vaseline to soften crusts, and the subsequent removal of these with tepid water, may be followed by some soothing or astringent application, always bearing in mind that what is soothing to one skin is irritant to another. Dusting powders (starch, lycopodion, magnesium carbonate, oxide of zinc, calamine, bismuth) will often do good; soothing lotions or liniments (lead acetate with laudanum, lime water and olive oil; sodium bicarbonate in well boiled gruel of oatmeal or marsh mallow; zinc oxide or sulphate in water or glycerine or as ointment in vaseline, etc, etc). In chronic stages with much squama and pruritus tar water or ointment; a lotion of tar and alcohol; creolin lotion; chloral lotion; or other stimulant application may be used.
CHRONIC ECZEMA OF THE HEAD IN SOLIPEDS.
Affects face, eyelids, cheeks. Symptoms: papules, vesicles, dry, rigid skin, scurf, glistening, shedding hairs. Treatment: as in eczema; antiseptics.
1. Acute eczema of the heels. See chapped heels and grease.
The cheeks and forehead are the most liable to suffer in this affection, yet the eyelids and the parts below the inner canthus may participate in connection with the escape of tears and the disease of the lachrymal sac or ducts. It has been seen in the young when strangles had merged into skin eruption, but also in the aged and independently of that affection.
Symptoms. Following strangles the papules or vesicular eruption may have passed leaving the skin thick, rigid, dry and scurfy. The pigment may be increased and the hairs are usually shed in connection with atrophy of their follicles and rubbing of the itching surface, so that the cuticle is smooth, glabrous and even glistening. In implication of the lachrymal apparatus, there is shedding of hairs beneath the eye or the wet matted condition of those that remain.
Treatment. In strangles use a lotion of silver nitrate or sodium hyposulphite to destroy the local infection. In other cases treat as for ordinary eczema.
CHRONIC MOIST ECZEMA (IMPETIGO) AT THE MANE AND TAIL.
Fleshy neck, thick mane and tail, lymphatic constitution, profuse perspiration, lack of cleanliness, alkaline soaps, plethora, foul stable, pus microbes. Symptoms: itching or tenderness, shedding hair, thinning of mane and tail, skin thickened, ridges and folds, tenderness, moisture, crusts raise hairs from follicles, fœtor, sores and ulcers, matted hairs. Treatment: remove general and local causes, cleanse, cool, pure stable, clip, reduce grain; cooling, laxative food, soothing or stimulating applications, zinc oxide, talc, olive oil and diachylon plaster, iodoform, silver nitrate, oil of cade, or of white birch, sulphur iodide, Canada balsam and sulphur, green soap, dusting powders, ointments.
This condition is especially common in horses with a profusion of long hairs in the mane and tail, and in the heavy draught animal with a thick, fleshy neck. In such the skin is very sensitive, and when profuse perspiration soaks the skin, or concretes and decomposes about the roots of the hairs, the local irritation necessary to the production of the eruption is present. A lack of careful grooming is therefore a common cause, yet soap left in washing the mane or tail may be no less injurious. Plethora has its influence in many cases, and the ammoniacal fumes from a wooden stable saturated with excretions are not to be ignored. Finally in cases accompanied by pustular eruption, the pus microbes must be recognized as factors. Symptoms. There may be marked itching or extreme tenderness of the part affected or in the absence of both there may occur a gradual shedding of the long hairs, so that an increasing thinness of the mane and tail (rat tail) becomes apparent. The skin covering the affected parts is thickened, inflamed and thrown into ridges and folds, one rubbing against another. The surface feels moist or is covered by crusts formed by the condensation of the moist exudate, and embracing the hairs and drawing them out of their follicles. Beneath
the concretions the skin is soaked in the tenacious fœtid liquid discharge. The hair follicles become atrophied in connection with the evulsion of the hairs, or under congestion the hairs stand rigidly erect, and bristly or curly. As the freer secretion abates, the exudate become more purely scally or encrusted, but the skin remains thickened and thrown into folds. Under the inveterate rubbing or gnawing the skin is often extensively abraded and large open sores are formed which are indolent and slow to heal. That matting together of the hairs which has been known as plica Polonica is often the result of the disease of the hair follicles and the accumulation of scabs which takes place in this disease, rather than to a special infection like gregarina (coccidiosis).
Treatment. The first consideration must be to remove all general and local causes of eczema, insure perfect cleanliness and good grooming in any case in which these may been lacking, purify the air of the stable if that has been foul, procure a cool environment when that has been too hot, clip the patient if habitually soaked with perspiration by reason of a heavy coat, suspend or moderate the work if that has been too exacting, withhold a heating grain ration (corn, buckwheat, barley, wheat, peas, beans), and furnish cooling, laxative, easily digested food. In the cases before us the acute, irritable stage has usually passed, so that the more stimulating applications may be safely used, yet in many old standing cases a fresh eruption may have taken place, which would demand for a time the most soothing applications only. Apart from such cases the more stimulating dressings are applied at once.
The affected surface is exposed by clipping or shaving off the long hairs, thus at once removing a source of heat and irritation and allowing of the direct and thorough application of the dressing. Among the astringent and stimulant applications oxide of zinc ointment and benzoated oxide of zinc are among the simplest and least likely to irritate, but the stronger applications can usually be borne. The Lassar paste consists of two parts each of finely powdered talc and zinc oxide, four parts of vaseline and three per cent. of salicylic acid. Oxide of bismuth may substitute the zinc oxide. Three parts of olive oil and four of diachylon plaster melted together and stirred until cool, makes another mildly astringent and sedative application. Iodoform 1 dr. to an ounce of vaseline is an excellent