Module 59 The Sixth Mass Extinction 633 Module 59 Review 640
Module 60 Causes of Declining Biodiversity 641
Module
About the Authors
ies Program at Dartmouth College. He was the founding chair of the Advanced Placement Test Development Committee (College Board) for Environmental Science. He has a strong interest in high
shops. For more than 10 years, Andy has been a guest lecturer at
Environmental Science Curriculum Development and Assessment
Andy regularly teaches introductory environmental science andgeochemistry, global change, and soil science, as well as foreignductory environmental science course to the massive, open, online course format through the DartmouthX platform.
Andy received a BA degree in both biology and environmental studies, and a PhD in earth and environmental science, from the University of Pennsylvania. For more than three decades, Andy has been investigating the effects of air pollution on the cycling of carbon, nitrogen, and lead in high-elevation forests of New England and the Northeast. Recently, he has been examining the impact of increased demand for wood as a fuel, and the subsequent effect on carbon stored deep in forest soils.
Andy has served on panels for the National Science Foundation, USDA Forest Service, and Science Advisory Board of the Environmental Protection Agency. He has authored or coauthored more than 65 peer-reviewed publications and one book, Writing Successful Science Proposals (Yale University Press).
Andy is passionate about saving energy and has pursued many energy efficiency endeavors in his home. Recently, he installed a 4 kW solar photovoltaic tracker that follows the Sun during the day.
Rick Relyea is the David Darrin Senior ‘40 Endowed Chair in Biology and the executive director of the Darrin Freshwater Institute at Rensselaer Polytechnic Institute. Rick teaches courses in ecology, evolution, and animal behavior at the undergraduate and graduate levels. He received a BS in environmental forest biology from the State University of New York College of Environmental Science and Forestry, an MS in wildlife management from Texas Tech University, and a PhD in ecology and evolution from the University of Michigan.
Rick is recognized throughout the world for his work in the fields of ecology, evolution, animal behavior, and ecotoxicology. He has served on multiple scientific panels for the National Science Foundation and has been an associate editor for the journals of the Ecological Society of America. For two decades, he has conducted research on a wide range of topics, including predator-prey interactions, phenotypic plasticity, eutrophication of aquatic habitats, sexual selection, disease ecology, long-term dynamics of populations and communities across the landscape, and pesticide impacts on aquatic ecosystems. He has authored more than 110 scientific articles and book chapters, and has presented research seminars throughout the world. Rick recently moved to Rensselaer from the University of Pittsburgh, where he was named the Chancellor’s Distinguished Researcher in 2005 and received the Tina and David Bellet Teaching Excellence Award in 2014.
Rick has a strong interest in high school education. High school science teachers conduct research in his laboratory and he offers summer workshops for high school teachers in the fields of ecology, evolution, and ecotoxicology. Rick also works to bring cutting-edge research experiments into high school classrooms.
Rick’s commitment to the environment extends to his personal life. He lives in a home constructed with a passive solar building design and equipped with active solar panels on the roof. The solar panels generate so much electricity that he sells the extra electricity back to the local electric utility every month.
Nancy Nutile-McMenemy
Brian Mattes
Acknowledgments
We would like to thank the many people at Bedford, Freeman, and Worth who helped guide us through the publication process in both the first and second editions of this book. They have taught us a great deal and have been crucial to our book becoming greatly appreciated by so many people. We especially want to acknowledge: Ann Heath, Jeffrey Dowling, Becky Kohn, Fred Burns, Janie Pierce-Bratcher, Kerry O’Shaughnessy, Julia DeRosa, Matt McAdams, Joseph BelBruno, Anna Skiba-Crafts, Aaron Stoler, Lucas Sanford-Long, Christine Buese, Vicki Tomaselli, Lee Wilcox, Jerry Correa, Beth Howe, Cindi Weiss, Karen Misler, Deborah Goodsite, Ted Szczepanski, and Cathy Murphy. We thank David Courard-Hauri, Ross Jones, and Susan Weisberg for contributions to the first edition of this book.
We also wish to convey our appreciation to the dozens of reviewers who constantly challenged us to write a clear, correct, and philosophically balanced textbook.
From Andy Friedland . . .
A large number of people have contributed to this book in a variety of ways. I would like to thank all of my teachers, students, and colleagues. Professors Robert Giegengack and Arthur Johnson introduced me to environmental science as an undergraduate and graduate student. My current and previous colleagues in the Environmental Studies Program at Dartmouth and elsewhere have contributed in a variety of ways. I thank Doug Bolger, Michael Cox, Rich Howarth, Anne Kapuscinski, Karol Kawiaka, Rosi Kerr, Nick Reo, Bill Roebuck, Jack Shepherd, Chris Sneddon, Scott Stokoe, Ross Virginia, and D.G. Webster for all sorts of contributions to my teaching and scholarship and to this book. Graduate students Chelsea Petrenko and Justin Richardson have also contributed. Emily Lacroix and Jacob Ebersole, Dartmouth undergraduates
who have taken courses from me, provided excellent editorial, proofreading, and writing assistance. Many other colleagues have had discussions with me or evaluated sections of text including William Schlesinger, Ben Carton, Jon Kull, Nat Draper, Bob Hawley, Jim Labelle, Tim Smith, Charlie Sullivan, Jenna Pollock, Jim Kaste, Carol Folt, Celia Chen, Matt Ayres, Kathy Cottingham, and Mark McPeek. Since the time when AP® Environmental Science was just an idea at a College Board workshop, Beth Nichols, Tom Corley, and many others, especially teachers I have since met at meetings and workshops, have introduced me to the world of Advanced Placement® teaching.
I wish to acknowledge Dana Meadows and Ned Perrin, both of whom have since passed away, for contributions during the early stages of this work. Terry Tempest Williams has been a tremendous source of advice and wisdom about topics environmental, scientific, and practical.
I am grateful to Dick and Janie Pearl for friendship and support through the Richard and Jane Pearl Professorship in Environmental Studies. Finally, I thank Katie, Jared, and Ethan Friedland, and my mother Selma.
From Rick Relyea . . .
I would like to thank my family—my wife Christine and my children Isabelle and Wyatt. Too many nights and weekends were taken from them and given to this textbook and they never complained. Their presence and patience continually inspired me to push forward and complete the project.
I am also grateful to the many people at Bedford, Freeman, and Worth who helped guide me and taught me a great deal about the publication process. I would like to especially thank Jerry Correa for convincing me to join the first edition of this book.
High School Focus Group Participants and Reviewers
Our deep appreciation and heartfelt thanks are due to the experienced AP® teachers who participated in focus groups and/or reviewed the manuscript during the development of this book. Their contributions have been invaluable.
Cynthia Ahmed, Signature School, IN
Timothy Allen, Thomas A. Edison Preparatory High School, OK
Julie Back, Kecoughtan High School, VA
Maureen Bagwell, Collierville High School, TN
Fredrick Baldwin, Kendall High School, NY
Lisa Balzas, Indian Springs School, AL
Debra Bell, Montgomery High School, TX
Melinda Bell, Flagstaff Arts and Leadership Academy, AZ
Karen Benton, South Brunswick High School, NJ
Richard Benz, Wickliffe High School, OH
Cindy Birkner, Webber Township High School, IL
Christine Bouchard, Milford Public Schools, CT
Gail Boyarsky, East Chapel Hill High School, NC
Rebecca Bricen, Johnsonburg High School, PA
Deanna Brunlinger, Elkhorn Area High School, WI
Kevin Bryan, Woodrow Wilson Senior High School, CA
Tanya Bunch, Carter High School, TN
Diane Burrell, Starr’s Mill High School, GA
Teri Butler, New Hanover High School, NC
Charles Campbell, Russellville High School, AR
Sande Caton, Concord High School, DE
Andrea Charles, West Side Leadership Academy, IN
Linda Charpentier, Xavier High School, CT
Blanca Ching, Fort Hamilton High School, NY
Ashleigh Coe, Bethesda-Chevy Chase High School, MD
Bethany Colburn, Randolph High School, MA
Jonathan D. Cole, Holmdel High School, NJ
Robert Compton, Walled Lake Northern High School, MI
Ann Cooper, Oseola High School, AR
Thomas Cooper, The Walker School, GA
Joyce Corriere, Hampton High School, VA
Stephanie Crow, Milford High School, MI
Stephen Crowley, Winooski High School, VT
Linda D’Apolito, Trinity School, NY
Brygida DeRiemaker, Eisenhower High School, MI
Chand Desai, Martin Luther King Magnet High School, TN
Michael Douglas, Bronx Prep Charter School, NY
Nancy Dow, A. Crawford Mosley High School, FL
Nat Draper, Deep Run High School, VA
Denis DuBay, Leesville High School, NC
John Dutton, Shaw High School, OH
Heather Earp, West Johnston High School, NC
Kim Eife, Academy of Notre Dame, PA
Brian Elliot, San Dimas High School, CA
Christina Engen, Crescenta Valley High School, CA
Mary Anne Evans, Allendale Columbia School, NY
Kay Farkas, Rush-Henrietta High School, NJ
Tim Fennell, LASA at LBJ High School, TX
Michael Finch, Greene County Tech High School, AR
Robert Ford, Fairfield College Preparatory School, CT
Paul Frisch, Fox Lane High School, NY
Bob Furhman, The Covenant School, VA
Nivedita (Nita) Ganguly, Oak Ridge High School, TN
Mike Gaule, Ladywood High School, MI
Billy Goodman, Passaic Valley High School, NJ
Amanda Graves, Mt. Tahoma High School, WA
Barbara Gray, Richmond Community High School, VA
Jack Greene, Logan High School, UT
Jeannie Kornfeld, Hanover High School, NH
Jen Kotkin, St. Philip’s Academy, NJ
Pat Kretzer, Timber Creek High School, FL
Michelle Krug, Coral Springs High School, FL
Jim Kuipers, Chicago Christian High School, IL
Claire Kull, Career Center, NC
Jay Kurima, O. D. Wyatt High School, TX
Tom LaHue, Aptos High School, CA
Cathy Larson, Patuxent High School, MD
Michael Lauer, Danville High School, KY
Sonia Laureni, West Orange High School, NJ
Amy Lawson, Naples High School, FL
Jim Lehner, The Taft School, CT
Dr. Avon Lewis, Lexington High School, MA
Marie Lieberman, Ravenscroft School, NC
John Ligget, Conestoga High School, PA
Ann Linsley, Bellaire High School, TX
Mark Little, Broomfield High School, CO
Leyana Lloyd, Washington Senior Academy, GA
Larry Lollar, Alice High School, TX
Stephanie Longfellow, Deltona High School, FL
Sue Ellen Lyons, Holy Cross School, LA
Theresa Lyster, Camden County High School, GA
John F. Madden, Ashley Hall School, SC
Jeremy Magee, Sandy High School, OR
Mike Mallon, James I. O’Neill High School, NY
Scott Martin, Deer Creek High School, OK
Kristi Martinez, Eastlake High School, WA
Christeena Mathews, The Philadelphia High School for Girls, PA
Courtney Mayer, Winston Churchill High School, TX
Monica Maynard, Schurr High School, CA
James McAdams, Center Grove High School, IN
Kristen McClellen, Grand Junction High School, CO
Sandy McDonough, North Salem Middle/High School, NY
Diane Medford, Los Alamos High School, NM
Leslie Miller, Flintridge Sacred Heart Academy, CA
Lonnie Miller, El Diamante High School, CA
Melody Mingus, Breckinridge County High School, KY
Myra Morgan, National Math & Science Initiative, AP ® Environmental Consultant
Tammy Morgan, Lake Placid High School, NY
David Moscarelli, Ponaganset High School, RI
Terri Mountjoy, Greene County Career Center, OH
Bill Mulhearn, Archmere Academy, DE
Sharna Murphy, Millikan High School, CA
Jeanine Musgrove, Oakton High School, VA
Anna Navarro, Veterans Memorial High School, TX
Barbara Nealon, Southern York County School District, PA
Dara Nix-Stevenson, American Hebrew Academy, NC
Bennett O’Connor, Dallas ISD, TX
Robert Oddo, Horace Greeley High School, NY
Kate Oitzinger, El Molino High School, CA
Paul Olson, Redwood High School, CA
Janet Ort, Hoover High School, AL
Roger Palmer, Bishop Dunne High School, TX
Annetta Pasquarello, Triton Regional High School, NJ
Lynn Paulsen, Mayde Creek High School, TX
Judy Perrella, Academy of the Holy Names, FL
Carolyn Phillips, Southeastern High School, IL
Pam Phillips, Hayden High School, AL
Alanna Piccillo, Palisade High School, CO
Julie Quinn Kiernan, CretinDurham Hall, NC
Jenny Ramsey, Charlotte Christian School, NC
Susan Ramsey, VASS, VA
Cristen Rasmussen, Costa Mesa High School, CA
Alesa Rehmann, Coral Shores High School, FL
Mark Reilly, Jefferson High School, IΩ
Kimbell Reitz, Penn High School, IN
Cheryl Rice, Howard High School, MD
Sharon Riley, Springfield High School, OH
Chris Robson, Ironwood Ridge High School, AZ
James Rodewald, Shaker High School, NY
Kurt Rogers, Northern Highlands Regional High School, NJ
Kris Rohrbeck, Almont High School, MI
David Rouby, Hall High School, AR
Rebecca Rouch, East Bay High School, FL
Jennifer Roy, TrekNorth Junior & Senior High School, MN
Reva Beth Russell, Lehi High School, UT
Sheila Scanlan, Highland High School, AZ
Kristi Schertz, Saugus High School, CA
Greg Schiller, James Monroe High School, CA
Amy Schwartz, Aragon High School, CA
Shashi Sharma, Henry Snyder High School, NJ
Tonya Shires, Edgewood High School, MD
Pamela Shlachtman, South Dade Senior High School, FL
Julie Smiley, Winchester Community High School, IN
Amy Snodgrass, Central High School, AR
Bill Somerlot, New Albany High School, OH
Anne Soos, Stuart Country Day School of the Sacred Heart, NJ
Joan Stevens, Arcadia High School, CA
Marianne Strickhart, Henry Snyder High School, NJ
Timothy Strout, Jericho High School, NY
Robert Summers, A+ College Ready, AL
Jeff Sutton, The Harker School, CA
Dave Szaroleta, Salesianum School, DE
Kristen Thomson, Saratoga High School, CA
James Timmons, Carrboro High School, NC
Thomas Tokarski, Woodlands High School, NY
Susan Tully, Salem Academy Charter School, MA
Debra Tyson, Brooke Pointe High School, VA
Melissa Valentine, Elizabeth Seton High School, MD
College Reviewers
Dirk Valk, McKeel Academy, FL
Gene Vann, Head-Royce School, CA
Rebecca Van Tassell, Herron High School, IN
Marc Vermeire, Friday Harbor High School, WA
Naomi Volain, Springfield Central High School, MA
Betty Walden, Merritt Island High School, FL
Craig Wallace, North Oldham High School, KY
Abbie Walston, North Haven High School, CT
Annette Weeks, Battle Ground High School, WA
Pamela Weghorst, Ardrey Kell High School, NC
Michelle Whitehurst, Powhatan High School, VA
Jane Whitelock, Easton High School, MD
Laurie Whitesell, Eli Whitney Middle School, OK
Robert Whitney, Westview High School, CA
Carol Widegren, Lincoln Park High School, IL
Sarrah Williams, Hamden Hall Country Day School, CT
Robert Willis, Lakeside High School,GA
We are also indebted to numerous college instructors, many of whom are also involved in AP® Environmental Science, for their insights and suggestions through various stages of development. The content experts who carefully reviewed Chapters in their area of expertise are designated with an asterisk (*).
M. Stephen Ailstock, PhD, Anne Arundel Community College
Deniz Z. Altin-Ballero, Georgia Perimeter College
Daphne Babcock, Collin County Community College District
Jay L. Banner, University of Texas at San Antonio
James W. Bartolome, University of California, Berkeley
Ray Beiersdorfer, Youngstown State University
Grady Price Blount, Texas A&M University, Corpus Christi
Dr. Edward M. Brecker, Palm Beach Community College, Boca Raton
Anne E. Bunnell, East Carolina University
Ingrid C. Burke, Colorado State University
Anya Butt, Central Alabama Community College
John Callewaert, University of Michigan *
Kelly Cartwright, College of Lake County
Mary Kay Cassani, Florida Gulf Coast University
Young D. Choi, Purdue University Calumet
John C. Clausen, University of Connecticut *
R ichard K. Clements, Chattanooga State Technical Community College
Thomas Cobb, Bowling Green State University, OH
Stephen D. Conrad, Indiana Wesleyan University
Terence H. Cooper, University of Minnesota, Saint Mary’s Winona Campus
Douglas Crawford-Brown, University of North Carolina at Chapel Hill
Wynn W. Cudmore, Chemeketa Community College
Katherine Kao Cushing, San Jose State University
Maxine Dakins, University of Idaho
Robert Dennison, Heartland Community College
Michael Denniston, Georgia Perimeter College
Roman Dial, Alaska Pacific University
Robert Dill, Bergen Community College
Michael L. Draney, University of Wisconsin, Green Bay
Anita I. Drever, University of Wyoming *
Ja mes Eames, Loyola University New Orleans
Kathy Evans, Reading Area Community College
Mark Finley, Heartland Community College
Dr. Eric J. Fitch, Marietta College
Karen F. Gaines, Northeastern Illinois University
James E. Gawel, University of Washington, Tacoma
Carri Gerber, Ohio State University Agricultural Technical Institute
Julie Grossman, Saint Mary’s University of Minnesota, Saint Mary’s Winona Campus
Lonnie J. Guralnick, Roger Williams University
Sue Habeck, Tacoma Community College
Hilary Hamann, Colorado College
Dr. Sally R. Harms, Wayne State College
Floyd Hayes, Pacific Union College
Keith R. Hench, Kirkwood Community College
William Hopkins, Virginia Tech *
R ichard Jensen, Hofstra University
Sheryll Jerez, Stephen F. Austin State University
Shane Jones, College of Lake County
Caroline A. Karp, Brown University
Erica Kipp, Pace University, Pleasantville/Briarcliff
Christopher McGrory Klyza, Middlebury College *
Frank T. Kuserk, Moravian College
Matthew Landis, Middlebury College *
K imberly Largen, George Mason University
Larry L. Lehr, PhD, Baylor University
Zhaohui Li, University of Wisconsin, Parkside
Thomas R. MacDonald, University of San Francisco
Robert Stephen Mahoney, Johnson & Wales University
Bryan Mark, Ohio State University, Columbus Campus
Paula J.S. Martin, Juniata College
Robert J. Mason, Tennessee Temple University
Michael R. Mayfield, Ball State University
Alan W. McIntosh, University of Vermont
Dr. Kendra K. McLauchlan, Kansas State University *
Patricia R. Menchaca, Mount San Jacinto Community College
Dr. Dorothy Merritts, Franklin and Marshall College *
Bram Middeldorp, Minneapolis Community and Technical College
Tamera Minnick, Mesa State College
Mark Mitch, New England College
Ronald Mossman, Miami Dade College, North
William Nieter, St. John’s University
Mark Oemke, Alma College
Victor Okereke, PhD, PE, Morrisville State College
Duke U. Ophori, Montclair State University
Chris Paradise, Davidson College
Dr. Clayton A. Penniman, Central Connecticut State University
Christopher G. Peterson, Loyola University Chicago
Craig D. Phelps, Rutgers, The State University of New Jersey, New Brunswick
F.X. Phillips, PhD, McNeese State University
Rich Poirot, Vermont Department of Environmental Conservation *
Bradley R. Reynolds, University of Tennessee, Chattanooga
Amy Rhodes, Smith College *
M arsha Richmond, Wayne State University
Sam Riffell, Mississippi State University
Jennifer S. Rivers, Northeastern Illinois University
Ellison Robinson, Midlands Technical College
Bill D. Roebuck, Dartmouth Medical School *
William J. Rogers, West Texas A&M University
Thomas Rohrer, Central Michigan University
Aldemaro Romero, Arkansas State University
William R. Roy, University of Illinois at Urbana-Champaign
Steven Rudnick, University of Massachusetts, Boston
Heather Rueth, Grand Valley State University
Eleanor M. Saboski, University of New England
Seema Sah, Florida International University
Shamili Ajgaonkar Sandiford, College of DuPage
Robert M. Sanford, University of Southern Maine
Nan Schmidt, Pima Community College
Jeffery A. Schneider, State University of New York at Oswego
Bruce A. Schulte, Georgia Southern University
Eric Shulenberger, University of Washington
Michael Simpson, Antioch University New England *
A nnelle Soponis, Reading Area Community College
Douglas J. Spieles, Denison University
David Steffy, Jacksonville State University
Christiane Stidham, State University of New York at Stony Brook
Peter F. Strom, Rutgers, The State University of New Jersey, New Brunswick
Kathryn P. Sutherland, University of Georgia
Christopher M. Swan, University of Maryland, Baltimore County *
Melanie Szulczewski, University of Mary Washington
Jamey Thompson, Hudson Valley Community College
John A. Tiedemann, Monmouth University
Conrad Toepfer, Brescia University
Todd Tracy, Northwestern College
Steve Trombulak, Middlebury College
Zhi Wang, California State University, Fresno
Jim White, University of Colorado, Boulder
Rich Wolfson, Middlebury College *
C. Wesley Wood, Auburn University
David T. Wyatt, Sacramento City College
Getting the Most from This Book
Daily life is filled with decisions large and small that affect our environment. From the food we eat, to the cars we drive or choose not to drive, to the chemicals we put into the water, soil, and air. The impact of human activity is wide-ranging and deep. And yet making decisions about the environment is often not easy or straightforward. Is it better for the environment if we purchase a new, energyefficient hybrid car or should we continue using the older car we already own? Should we remove a dam that provides electricity for 70,000 homes because it interferes with the migration of salmon? Are there alternatives to fossil fuel for heating our homes?
The purpose of this book is to give you a working knowledge of the big ideas of environmental science and help you to prepare for the AP® Environmental Science Exam. The book is designed to provide you with a strong foundation in the scientific fundamentals, to introduce you to the policy issues and conflicts that emerge in the real world, and to offer you an in-depth exploration of all the topics covered on the advanced placement exam in environmental science.
Like the first edition, Friedland and Relyea Environmental Science for AP®, Second Edition, is organized to closely follow the AP® environmental science course description. Every item on the College Board’s “Topic Outline” is covered thoroughly in the text. Look inside the front cover for a detailed alignment guide. The textbook offers comprehensive coverage of all required AP® course topics and will help you prepare for success on the exam by:
• providing chapter opening case studies that will help you to see how environmental science is grounded in your daily life and in the world around you
• dividing each chapter into manageable modules that will help you to be organized and keep up with the challenging pace of the AP® environmental science course
• using the same ter minology, language, and formulas that you will see on the AP® environmental science exam
• using exper tly selected and artistically rendered figures, photographs, graphs, and visuals that will help you to understand and remember the big ideas and important concepts that will be on the exam
• providing you with many opportunities to practice for the exam throughout the year, including end-of-module AP® review questions, chapter AP® practice exams, unit AP® practice exams, and a cumulative AP® practice exam at the end
The next few pages offer you a brief tour of the features of this book that have been designed to help you succeed in the course and on the exam.
Explore the world around you through science.
Earth Systems
Chapter Opening Case Study
Read the intriguing case study that begins each chapter and think about the environmental challenges and trade-offs that are introduced. The subjects of these studies often will spark spirited class discussion.
As you can see from case studies like this one from Chapter 8, it’s not always easy to make sustainable choices.
as We Think?
Many people in the environmental science community believe that hybrid electric vehicles (HEV) and all-electric vehicles are some of the most exciting innovations of the last decade. Cars that run on electric power or on a combination of electricity and gasoline are much more efficient in their use of fuel than similarly sized internal combustion (IC) automobiles. Some of these cars use no gasoline at all, while others are able to run as much as twice the distance as a conventional IC car on the same amount of gasoline.
Although HEV and all-electric vehicles reduce our consumption of liquid fossil fuels, they do come with environmental trade offs. The construction of HEV vehicles uses scarce metals, including neodymium, lithium, and lanthanum. Neodymium is needed to
form the magnets used in the electric motors, and lithium and lanthanum are used in the compact high-performance batteries the vehicles require. At present,
Although HEV and all-electric vehicles reduce our consumption of liquid fossil fuels, they do come with environmental trade offs.
there appears to be enough lanthanum available in the world to meet the demand of the Toyota Motor Corporation, which has manufactured more than 3 million Prius HEV vehicles. Toyota obtains its lanthanum from China. There are also supplies of lanthanum in various geologic deposits in California, Australia,
Bolivia, Canada, and elsewhere, but most of these deposits have not yet been developed for mining. Until this happens, some scientists believe that the production of HEVs and all-electric vehicles will eventually be limited by the availability of lanthanum.
In addition to the scarcity of metals needed to make HEV and all-electric vehicles, we have to consider how we acquire these metals. Wherever mining occurs, it has a number of environmental consequences. Material extraction leaves a landscape fragmented by holes, and road construction necessary for access to and from the mining site further alters the habitat. Erosion and water contamination are also common results of mining.
A typical Toyota Prius HEV uses approximately 1 kg (2.2 pounds) of
Patterns of Energy Use
In this module we begin our study of nonrenewable energy sources by looking at patterns of energy use throughout the world and in the United States. We will see how evaluating energy efficiency can help us determine the best application for different energy sources. Finally, because electricity accounts for such a large percentage of our overall energy use, we will examine the ways in which electricity is generated.
Learning Objectives
After reading this module, you should be able to
• describe the use of nonrenewable energy in the world and in the United States.
• explain why different forms of energy are best suited for certain purposes.
• understand the primary ways that electricity is generated in the United States.
Module Structure
Chapters are divided into short Modules to help keep you on pace. Each module opens with a brief description of what topics will be covered.
Learning Objectives
A list key ideas at the beginning of the module help to keep you focused as you read.
Nonrenewable energy is used worldwide and in the United States
Fossil fuels are fuels derived from biological material that became fossilized millions of years ago. Fuels from this source provide most of the energy used in both developed and developing countries. The vast majority of the fossil fuels we use—coal, oil, and natural gas— come from deposits of organic matter that were formed 50 million to 350 million years ago. As we saw in Chapter 3 (see Figure 7.2 on page 83), when organisms die, decomposers break down most of the dead biomass aerobically, and it quickly reenters the food web. However, in an anaerobic environment—for example in places such as swamps, river deltas, and the ocean floor—a large amount of detritus may build up quickly. Under these conditions, decomposers cannot break down all of the detritus. As this material is buried under succeeding layers of sediment and exposed to heat and pressure, the organic compounds within it are chemically transformed into high-energy solid, liquid, and
gaseous components that are easily combusted. Because fossil fuel cannot be replenished once it is used up, it is known as a nonrenewable energy resource. Nuclear fuel, derived from radioactive materials that give off energy, is another major source of nonrenewable energy on which we depend. The supplies of these energy types are finite.
Every country in the world uses energy at different rates and relies on different energy resources. Factors that determine the rate at which energy is used include the resources that are available and affordable. In the past few decades, people have also begun to consider environmental impacts in some energy-use decisions.
Running glossary
Important key terms are set in bold type in the text and defined at the bottom of the page on which they are introduced. Key terms are also defined in the glossary at the end of the book.
Are Hybrid Electric Vehicles as Environmentally Friendly
Math practice makes perfect.
Do the Math
Among the biggest challenges on the AP® Environmental Science Exam are questions that ask you to solve environmental science math problems. “Do the Math” problems help you practice the math skills that you’ll need to tackle these problems on the exam.
do the math
Calculating Energy Supply
According to the U.S. Department of Energy, a typical home in the United States uses approximately 900 kWh of electricity per month. On an annual basis, this is
How many homes can a 500 MW power plant with a 0.9 capacity factor support?
Begin by determining how much electricity the plant can provide per month:
1 MWh equals 1,000 kWh, so to convert MWh per month into kWh per month, we multiply by 1,000: 324,000 MWh∕month × 1,000 kWh/MWh = 324,000,000 kWh∕month
So
324,000,000 kWh∙month 900 kWh∙month∙home = 360,000 homes
On average, a 500 MW power plant can supply roughly 360,000 homes with electricity.
Your Turn During summer months, in hot regions of the United States, some homes run air conditioners continuously. How many homes can the same power plant support if average electricity usage increases to 1,200 kWh/month during summer months?
Your Turn
Each “Do the Math” box has a “Your Turn” practice problem to help you review and practice the math skills introduced.
nuclear and coal-fired plants running at all times. As demand for electricity changes during the day or week, plants that are more easily powered up, such as those that use natural gas, oil, water, or wood, are used.
Cogeneration
do the
math
Converting Between Hectares and Acres
Prepare for the Exam
In the metric system, land area is expressed in hectares. A hectare (ha) is 100 meters by 100 meters. In the United States, land area is most commonly expressed in acres. There are 2.47 acres in 1 ha. The conversion from hectares is relatively easy to do without a calculator; rounding to two significant figures gives us 2.5 acres in 1 ha. If a nature preserve is 100 ha, what is it size in acres? 100 ha × 2.5 acres = 250 acres
Your Turn A particular forest is 10,000 acres. Determine its size in hectares.
indicator, the current loss of biodiversity tells us that natural systems are facing strains unlike any in the recent past. We will look at this important topic in greater detail in Chapters 5 and 18.
The use of a fuel to generate electricity and produce heat is known as cogeneration, also called combined heat and power. Cogeneration is a method employed by certain users of steam for obtaining greater efficiencies. If steam used for industrial purposes or to heat buildings is diverted to turn a turbine first, the user will achieve greater overall efficiency than by generating heat and electricity separately. Cogeneration efficiencies can be as high as 90 percent, whereas steam heating alone might be 75 percent efficient, and electricity generation alone might be 35 percent efficient. There are over 17,000 power plants in the United States. In 2012, they generated approximately 3.7 billion MWh. FIGURE 34.8 shows the fuels that were used to
Once you are comfortable with the math skills introduced, you’ll be prepared for quantitative problems on the exam.
FIGURE 34.8 Fuels used for electricity generation in the United States in 2012. Coal is the fuel most commonly used for electricity generation. However, the electricity fuel mix in the United States is changing rapidly due to the increased availability and decreasing price of natural gas. (Data from U.S. Department of Energy, Energy Information Administration, 2013)
Some measures of biodiversity are given in terms of land area, so becoming familiar with measurements of land area is important to understanding them. A hectare (ha) is a unit of area used primarily in the measurement of land. It represents 100 meters by 100 meters. In the United States we measure land area in terms of square miles and acres. However, the rest of the world measures
In the past we have used science and technology to increase the amount of food we can produce on a given area of land. World grain production has increased fairly steadily since 1950 as a result of expanded irrigation, fertilization, new crop varieties, and other innovations. At the same time, worldwide production of grain per person, also called per capita world grain production, has leveled off. Figure 2.3 shows what might be a slight downward trend in wheat production since about 1985. In 2008, food shortages around the world led to higher food prices and even riots in some places. Why
Cogeneration The use of a fuel to generate electricity and produce heat. Also known as combined heat and power.
Analyze and interpret visual data.
Photos and Illustrations
whether a population in a particular location is so dense that it might outstrip its food supply.
The photos and illustrations in this book are more than just pretty pictures. They have been carefully chosen and developed to help you comprehend and remember the key ideas.
Population density can be a particularly useful measure for wildlife managers who must set hunting or fishing limits on a species. For example, managers may divide the entire population of an animal species that is hunted or fished into management zones. Management zones may be designated political areas, such as counties, or areas with natural boundaries, such as the major water bodies in a state. Wildlife managers might offer more hunting or fishing permits for zones with a high-density population and fewer permits for zones with a low-density population.
Population Distribution
In addition to population size and density, population ecologists are interested in how a population occupies space. Population distribution is a description of how individuals are distributed with respect to one another. Figure 18.2 shows three types of population distributions. In some populations, such as a population of trees in a natural forest, the distribution of individuals is random (Figure 18.2a). In other words, there is no pattern to the locations where the individual trees grow.
Tables and Graphs
The best-known and most significant human alteration of the carbon cycle is the combustion of fossil fuels. This process releases fossilized carbon into the atmosphere, which increases atmospheric carbon concentrations and upsets the balance between Earth’s carbon pools and the atmosphere. The excess CO2 in the atmosphere acts to increase the retention of heat energy in the biosphere.
(c) Clumped distribution
carbon in their wood, both above and below ground. The destruction of forests by cutting and burning increases the amount of CO2 in the atmosphere. Unless enough new trees are planted to recapture the carbon, the destruction of forests will upset the balance of CO2
To understand environmental science and succeed on the exam, you need to engage in the scientific practice of analyzing and interpreting a variety of tables, graphs, and charts.
The result, global warming, is a major concern among environmental scientists and policy makers.
Figure 18.2 Population distributions. Populations in nature distribute themselves in three ways. (a) Many of the tree species in this New England forest are randomly distributed, with no apparent pattern in the locations of individuals. (b) Territorial nesting birds, such as these Australasian gannets (Morus serrator), exhibit a uniform distribution, in which all individuals maintain a similar distance from one another.
In other populations, such as a population of trees in a plantation, the distribution of individuals is uniform, or evenly spaced (Figure 18.2b). Uniform distributions are common among territorial animals, such as nesting birds that defend areas of similar sizes around their nests. Uniform distributions are also observed among plants that produce toxic chemicals to prevent other plants of the same species from growing close to them.
Tree harvesting is another human activity that can affect the carbon cycle. Trees store a large amount of
(c) Many pairs of eyes are better than one at detecting approaching predators. The clumped distribution of these meerkats (Suricata suricatta ) provides them with extra protection. (a: David R. Frazier Photolibrary, Inc./Science Source; b: Michael Thompson/Earth Scenes/ Animals Animals; c: Clem Haagner/ARDEA)
Population Density
Population density is the number of individuals per unit area (or volume, in the case of aquatic organisms) at a given time. Knowing a population’s density, in addition to its size, can help scientists estimate whether a species is rare or abundant. For example, the density of coyotes (Canis latrans) in some parts of Texas might be only 1 per square kilometer, but in other parts of the state it might be as high as 12 per square kilometer. Scientists also study population density to determine
To date, large areas of forest, including tropical forests as well as North American and European temperate forests, have been converted into pastures, grasslands, and croplands. In addition to destroying a great deal of biodiversity, this destruction of forests has added large amounts of carbon to the atmosphere. The increases in
In still other populations, the distribution of individuals is clumped (Figure 18.2c). Clumped distributions, which are common among schooling fish, flocking birds, and herding mammals, are often observed when living in large groups provides enhanced feeding opportunities or protection from predators.
11:45 AM
Population Sex Ratio
The sex ratio of a population is the ratio of males to females. In most sexually reproducing species, the sex ratio is usually close to 50:50, although sex ratios can be far from equal in some species. In fig wasps, for example, there may be as many as 20 females for every male. Because the number of offspring produced is
Population density The number of individuals per unit area at a given time.
Bird populations are often regulated by densityindependent factors. For example, in the United Kingdom, a
Population distribution A description of how individuals are distributed with respect to one another. Sex ratio The ratio of males to females in a population.
(a) Random distribution
(b) Uniform distribution
Review and practice for quizzes and tests.
Module Review
Solidify your understanding by reviewing the main ideas in each module review.
In this module, we have seen how specific aspects of the scientific method are used to conduct field and laboratory evaluations of how human activity affects the natural environment. The scientific method follows a process of observations and questions, testable hypotheses and predictions, and data collection. Results are inter-
Module 3 AP ® Review Questions
1. The first step in the scientific process is
(a) collecting data.
(b) observations and questions.
(c) forming a hypothesis.
(d) disseminating findings.
(e) forming a theory.
Use the following information for questions 2 and 3: Two new devices for measuring lead contamination in water are tested for accuracy. Scientists test each device with seven samples of water known to contain 400 ppm of lead.Their data is shown below.
Concentration is in parts per billion.
Water
2. The data from device 1 is
(a) accurate, but not precise.
(b) precise, but not accurate.
(c) both accurate and precise.
(d) neither accurate nor precise.
(e) not clear enough to support any conclusion about accuracy or precision.
3. Assuming the devices were used correctly, and assuming we want to choose a device that accurately reflects the true concentration of lead in
preted and shared with other researchers. Experiments can be either controlled (manipulated) experiments or natural experiments that make use of natural events. There are often challenges in environmental science including the lack of baseline data and the interactions with social factors such as human preferences.
the water samples, which conclusion does the data support?
(a) Device 1 is superior to device 2 because it is more precise.
(b) Device 2 is superior to device 1 because it is more precise.
(c) Device 1 is superior to device 2 because it is more accurate.
(d) Device 2 is superior to device 1 because it is more accurate.
(e) Both devices are equally effective at measuring contaminates.
4. Challenges in the study of environmental science include all of the following except (a) dangers of studying natural systems.
(b) lack of baseline data.
(c) subjectivity of environmental impacts.
(d) complexity of natural systems.
(e) complex interactions between humans and the environment.
5. A control group is
(a) a group with the same conditions as the experimental group.
(b) a group with conditions found in nature.
(c) a group with a randomly assigned population.
(d) a group with the same conditions as the experimental group except for the study variable.
(e) a group that is kept at the same conditions throughout the experiment.
Chapter Review
Friedland2e_c01_xxx-029hr1_pv3.1.1.indd
At the end of each chapter, take time to review the main ideas and key terms.
Exam Prep All Year
Each module ends with multiple-choice questions similar to those on the AP® exam. Practicing your test-taking strategies for multiple-choice questions throughout the year will pay off when you take the exam.
Throughout this chapter, we have outlined principles, techniques, and methods that will allow us to approach environmental science from an interdisciplinary perspective as we evaluate the current condition of Earth and the ways that human beings have influenced it. We identified that we can use environmental indicators to show the status of specific environmental conditions in
Key Terms
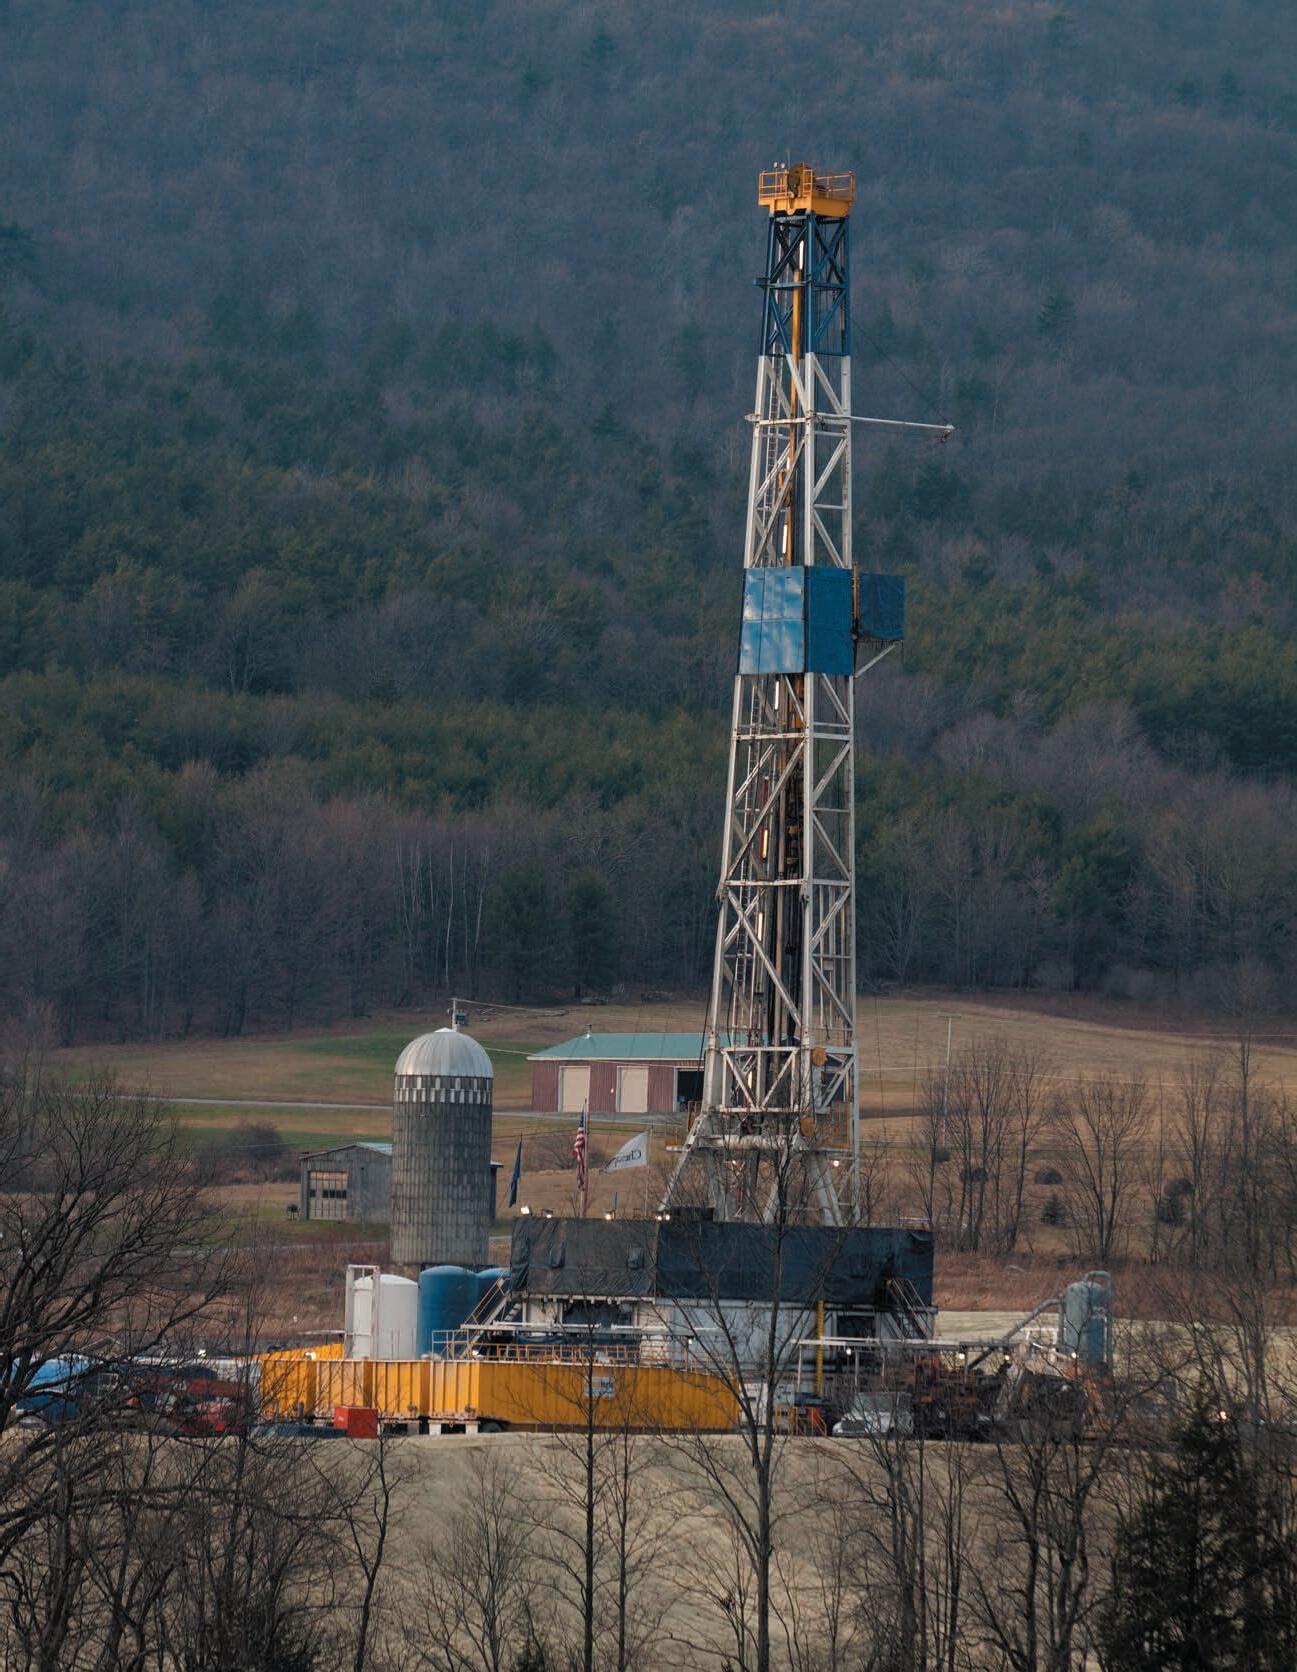
Fracking
Environment
Environmental science
Ecosystem
Biotic
Abiotic
Environmentalist
Environmental studies
Ecosystem services
Environmental indicators
Biodiversity
Genetic diversity
Learning Objectives Revisited
Check your notes against summaries of the learning objectives for each module in the chapter.
the past, at present, and, potentially, into the future. These indicators and other environmental metrics must be measured using the same scientific process used in other fields of science. Environmental science does contain some unique challenges because there is no undisturbed baseline—humans began manipulating Earth long before we have been able to study it.
Species
Species diversity
Speciation
Background extinction rate
Greenhouse gases
Anthropogenic
Development
Sustainability
Sustainable development
Biophilia
Ecological footprint
Scientific method
Learning Objectives Revisited
Module 1 Environmental Science
• Define the field of environmental science and discuss its importance.
Environmental science is the study of the interactions among human-dominated systems and natural systems and how those interactions affect environments. Studying environmental science helps us identify, understand, and respond to anthropogenic changes.
• Identify ways in which humans have altered and continue to alter our environment.
The impact of humans on natural systems has been significant since early humans hunted some large animal species to extinction. However, technology and population growth have dramatically increased both the rate and the scale of human-induced change.
Hypothesis
Null hypothesis
Replication
Sample size
Accuracy
Precision
Uncertainty
Theory
Control group
Natural experiment
Module 2 Environmental Indicators and Sustainability
• Identify key environmental indicators and their trends over time.
Five important global-scale environmental indicators are biological diversity, food production, average global surface temperature and atmospheric CO2 concentrations, human population, and resource depletion. Biological diversity is decreasing as a result of human actions, most notably habitat destruction and habitat degradation. Food production appears to be leveling off and may be decreasing. Carbon dioxide concentrations are steadily increasing as a result of fossil fuel combustion and land conversion. Human population continues to increase and probably will continue to do so throughout this century. Resource depletion for most natural resources continues to increase.
• Define sustainability and explain how it can be measured using the ecological footprint. Sustainability is the use of Earth’s resources to meet our current needs without jeopardizing the ability of future generations to meet their own needs. The ecological footprint is the land area required to support a person’s (or a country’s) lifestyle. We can use that information to say something about how sustainable that lifestyle would be if it were adopted globally.
results, and dissemination of findings. Repetition of measurements or experiments is critical if one is to determine the validity of findings. Hypotheses are tested and often modified before being accepted.
Prepare and practice for the AP ® Environmental Science Exam.
Chapter AP® Environmental Science Practice Exam
Module 3 Scientific Method
When you finish a chapter take the practice exam to check your understanding of the main ideas. The practice exam will help you become familiar with the style of questions on he AP® Environmental Science Exam.
• Explain the scientific method and its application to the study of environmental problems. The scientific method is a process of observation, hypothesis generation, data collection, analysis of
• Describe some of the unique challenges and limitations of environmental science. We lack an undisturbed “control planet” with which to compare conditions on Earth today. Assessments and choices are often subjective because there is no single measure of environmental quality Environmental systems are so complex that they are poorly understood, and human preferences and policies may affect them as much as do natural laws.
Chapter 1 AP® Environmental Science Practice Exam
Section 1: Multiple-Choice Questions
Choose the best answer for questions 1–11.
1. Which of the following events has increased the impact of humans on the environment?
I. advances in technology
II. reduced human population growth III. use of tools for hunting
(a) I only
(b) I and II only
(c) II and III only
(d) I and III only
(e) I, II, and III
2. As described in this chapter, environmental indicators
(a) always tell us what is causing an environmental change.
(b) can be used to analyze the health of natural systems.
(c) are useful only when studying large-scale changes.
(c) For the past 130 years, average global surface temperatures have shown an overall increase that seems likely to continue.
(d) World population is expected to be between 8.1 billion and 9.6 billion by 2050.
(e) Some natural resources are available in finite amounts and are consumed during a one-time use, whereas other finite resources can be used multiple times through recycling.
4. Figure 2.5 (on page 12) shows atmospheric carbon dioxide concentrations over time.The measured concentration of CO2 in the atmosphere is an example of (a) a sample of air from over the Antarctic. (b) an environmental indicator.
7. All of the following would be exclusively caused by anthropogenic activities except (a) combustion of fossil fuels. (b) overuse of resources such as uranium. (c) forest clearing for crops. (d) air pollution from burning oil. (e) forest fires.
(d) do not provide information regarding sustainability.
(e) take into account only the living components of ecosystems.
3. Which statement regarding a global environmental indicator is NOT correct?
8. Use Figure 2.3 (on page 11) to calculate the approximate percentage change in world grain production per person between 1950 and 2000. (a) 10 percent (d) 40 percent (b) 20 percent (e) 50 percent (c) 30 percent
(a) Concentrations of atmospheric carbon dioxide have been rising quite steadily since the Industrial Revolution.
(b) World grain production has increased fairly steadily since 1950, but worldwide production of grain per capita has decreased dramatically over the same period.
Free-Response Questions
(c) replicate sampling.
Multiple-Choice Questions
Each chapter exam begins with multiple-choice questions modeled after those you’ll see on the exam. Many of the questions ask you to analyze or interpret tables, graphs, or figures.
11. After analyzing the results of the experiment, the most appropriate conclusion would be that caffeine
(d) calculating an ecological footprint. (e) how to study seasonal variation in Earth’s temperatures.
(a) increased the pulse rates of the 18-year-old males tested.
5. Environmental metrics such as the ecological footprint are most informative when they are considered along with other environmental indicators.Which indicator, when considered in conjunction with the ecological footprint, would provide the most information about environmental impact?
(b) decreased the pulse rates of the 18-year-old males tested.
(c) will increase the pulse rate of any individual that is tested.
(d) increases the pulse rate and is safe to consume.
(a) biological diversity
(e) makes drinks better than decaffeinated beverages.
(b) food production
(c) human population (d) CO2 concentration (e) water quality
Section 2: Free-response Questions
6. In science, which of the following is the most certain? (a) hypothesis (d) observation (b) idea (e) theory (c) natural law
9. The populations of some endangered animal species have stabilized or increased in numbers after human intervention. An example of a species that is still endangered and needs further assistance to recover is the (a) American bison. (d) American alligator. (b) peregrine falcon. (e) snow leopard. (c) bald eagle.
Questions 10 and 11 refer to the following experimental scenario:
Chapter exams include two free-response questions. Points are assigned to indicate how a complete, correct answer would be scored on the AP® exam. The more practice you have in writing answers to free-response questions, the better you will do on the exam.
An experiment was performed to determine the effect of caffeine on the pulse rate of five healthy 18-year-old males. Each was given 250 mL of a beverage with or without caffeine.The men had their pulse rates measured before they had the drink (time 0 minutes) and again after they had been sitting at rest for 30 minutes after consuming the drink.The results are shown in the following table. Caffeine Pulse rate Pulse
Write your answer to each part clearly. Support your answers with relevant information and examples. Where calculations are required, show your work.
1. Your neighbor has fertilized her lawn. Several weeks later, she is alarmed to see that the surface of her ornamental pond, which sits at the bottom of the sloping lawn, is covered with a green layer of algae.
(a) Suggest a feasible explanation for the algal bloom in the pond. (2 points)
(b) Design an experiment that would enable you to validate your explanation. Include and label in your answer:
(i) a testable hypothesis (2 points)
(ii) the variable that you will be testing (1 point)
(iii) the data to be collected (1 point)
(iv) a description of the experimental procedure (2 points)
(v) a description of the results that would validate your hypothesis (1 point)
(c) Based on the data from your experiment and your explanation of the problem, think of and suggest one action that your neighbor could take to help the pond recover. (1 point)
2. The study of environmental science sometimes involves examining the overuse of environmental resources.
(a) Identify one general effect of overuse of an environmental resource. (3 points)
(b) For the effect you listed above, describe a more sustainable strategy for resource utilization. (3 points)
Unit AP® Environmental Science Practice Exam
The textbook is divided into 8 major units. At the end of each unit, you are provided with a longer practice exam containing 20 multiple-choice questions and 2 free-response questions. These exams give you a chance to review material across multiple chapters and to practice your test-taking skills.
Unit 1 AP® Environmental Science Practice Exam
Section 1: Multiple-Choice Questions Choose the best answer for questions 1–20.
1. Which best describes how humans have altered natural systems?
I. Overhunted many large mammals to extinction.
II. Created habitat for species to thrive.
III. Emitted greenhouse gases.
(a) I only
(b) I and II only
(c) II and III only
(d) I and III only (e) I, II, and III
2. Which does NOT describe a benefit of biodiversity?
(a) Genetic biodiversity improves the ability of a population to cope with environmental change.
(b) Ecosystems with higher species diversity are more productive.
(c) Species serve as environmental indicators of global-scale problems.
(d) Speciation reduces natural rates of species extinction.
(e) Humans rely on ecological interactions among species to produce ecosystem services.
3. Which of the following is NOT a consequence of human population growth?
(a) Depletion of natural resources
(b) Background extinction
(c) Emission of greenhouse gases
(d) Rise in sea level
Cumulative AP® Environmental Science Practice Exam
(e) Reduction in per capita food supply
4. An example of sustainable development is
(a) harvesting enough crops to provide the basic needs of all humans.
(b) increasing the price of vegetables.
6. The greatest value of the scientific method is best stated as:
(a) The scientific method permits researchers a rapid method of disseminating findings.
(b) The scientific method removes bias from observation of natural phenomenon.
(c) The scientific method allows findings to be reproduced and tested.
(d) The scientific method promotes sustainable development.
(e) The scientific method reduces the complexity of experimental results.
7. Researchers conducted an experiment to test the hypothesis that the use of fertilizer near wetlands is associated with increased growth of algae. An appropriate null hypothesis would be:
(a) The use of fertilizer near wetlands is associated with an increase in fish biomass.
(b) Growth of algae in wetlands is never associated with increased fertilizer use.
(c) Application of fertilizers near wetlands is always associated with increased growth of algae.
(d) Fertilizer use near wetlands has no association with growth of algae.
(e) Fertilizer use near wetlands leads to increased growth of algae as a result of elevated nutrient concentrations.
Questions 8 and 9 refer to the following experiment:
Researchers designed an experiment to test the hypothesis that air pollution positively correlates with the number of asthma-related problems among humans.To test this hypothesis, they compared medical records obtained from large hospitals in 10 major U. S. cities.
At the end of the text you will find a cumulative exam with 100 multiple-choice questions and 4 free-response questions. This exam matches the actual AP® Environmental Science exam in length and scope.
(c) reducing the use of all major modes of transportation.
(d) creating renewable sources of construction material.
(e) enforcing laws that stop future development of cities.
5. The ecological footprint of a human is
cumulative AP® environmental science practice exam
Section 1: Multiple-Choice Questions
Choose the best answer for questions 1–100.
1. Primary production is an example of I. an ecosystem service.
II. an environmental indicator.
III. heterotrophic activity.
(a) I only
(b) II only
(c) I and II
(d) II and III
(e) I, II, and III
2. Which of the following is likely to increase biodiversity within a biome?
(a) Landscape fragmentation
(b) Introduction of an invasive species
(c) Immigration of humans
(d) Speciation
(e) A disease epidemic
3. The United States produces 8 million tons of oranges in a single year. However, many orange crops are succumbing to a deadly invasive bacteria. If 10,000 hectares of orange cropland are lost in a year to this bacteria, and a single acre can produce 20 tons of oranges, what percentage of the total orange crop is lost to the disease in a year? (Note that 1 hectare = 2.5 acres.)
(a) 2 percent
(b) 6 percent
(c) 10 percent
(d) 20 percent
(e) 24 percent
Questions 4 and 5 refer to the following experiment:
A group of scientists wanted to test the effects of increased greenhouse gas concentrations on plant growth. They hypothesized that elevated levels of CO2 would increase plant biomass after 2 weeks, whereas elevated levels of N2O and CH4 would have no effect. To test this hypothesis, they placed red maple (Acer rubrum) tree saplings in incubators, and then subjected each sapling to one of three treatments. The treatments included 10 ppm of CO2, N2O, or CH4 gas above ambient concentrations. Each treatment had four replicates. After 2 weeks, they measured plant biomass.
(a) a measure of how much a human consumes, expressed in joules.
(b) a measure of human consumption, expressed in area of land.
4. Which is a flaw of this experiment?
(c) a measure of biodiversity loss stemming from industrial processes.
8. This experiment is an example of a (a) controlled study.
(b) manipulative experiment.
(c) laboratory experiment.
(d) replication.
(e) natural experiment.
9. Results of the study indicated that cities with more air pollution had a higher number of patients with asthma. The most appropriate conclusion from this study is that
(a) air pollution causes asthma in humans.
(b) air pollution is a cause of asthma in humans.
(c) air pollution is associated with asthma in humans.
(d) a measure of plant biomass removed by a farmer.
(a) The experiment lacks a control treatment.
(d) there is no association between air pollution and asthma in humans.
(e) a measurement calculated through statistical methods.
(b) 10 ppm is a negligible increase of CO2 relative to ambient concentrations.
(c) The hypothesis is actually a null hypothesis.
(d) The measured response variable does not relate to the hypothesis.
(e) N2O gas is not a greenhouse gas.
5. As hypothesized, the researchers found that plants exposed to elevated CO2 had increased biomass after 2 weeks, whereas plants exposed to elevated N2O and CH4 did not exhibit any change in biomass.Which would be a deductive statement based solely on these results?
(e) confounding variables make the results difficult to interpret.
(a) Elevated levels of CO2 are due to global climate change.
Write your answer to each part clearly. Support your answers with relevant information and examples. Where calculations are required, show your work.
(b) Reduced levels of CO2 due to global climate change will decrease red maple production.
(c) An observed increase in red maple production is probably due to elevated levels of CO2
(d) Increases in red maple production in nature are probably not due to elevated levels of N2O or CH4
(e) CH4 and N2O are not likely to be biologically important greenhouse gases for tree growth.
6. For radioactive elements, the transformation between a parent and daughter atom involves
(a) the creation of ionic bonds.
1. The City of Philadelphia recently replaced one out of every 10 trash bins with solar-powered trash compactors. The compactor is an enclosed unit with a door that opens for trash disposal. The compactor automatically detects when the bin is full and uses a solar-powered mechanical crusher to compact the contents.When the compactor needs to be emptied, it sends an electronic signal. Use of solar-powered compactors has increased the capacity of public trash bins and has reduced the number of trash collection visits to each bin from 17 times per week to 5 times per week.
(b) a release of neutrons and energy.
(c) an increase in total energy.
(a) Describe four positive externalities of installing solar-powered trash compactors. (2 points)
(d) the transformation of chemical energy to potential energy.
(b) Describe six cradle-to-grave components of solar-powered trash compactors. (2 points)
(e) the transformation of heat energy to kinetic energy.
7. Which group of compounds is listed in order of increasing pH?
(c) Suggest one way that the installation of solarpowered trash compactors can reverse the effects of urban blight. (2 points)
(a) OH , H2O, CaCO3
(b) CaCl, LiCl, HCl
(c) NaOH, BaO, OH
(d) NaOH, H2O, H2SO4
(e) HF, NaCl, NaOH
(d) The price of a regular trash bin is $300, and it has a lifespan of 20 years. The price of a solarpowered trash compactor is $4,000, and it has a lifespan of 10 years; it also requires approximately $150 in maintenance costs each year. On average, a trash collection visit costs $5 in fuel and $20 in employee salary. Based on this information, are solar-powered trash compactors economically beneficial? (2 points)
2. The country of Costa Rica has an abundance of climactic, geographic, and biological diversity. However, in the last century intensive farming and population growth have led to a 75 percent reduction in its forests. In the 1980s, the government of Costa Rica began to address concerns about the loss of forest with a series of political and environmental programs. These programs, designed to generate more sustainable economic development, include land protection and conservation of biodiversity.
(a) Costa Rica lies just north of the equator and contains a series of mountain ranges that run the entire length of the country.
(i) Given its geographic location, what is likely to be the prevailing wind pattern across the country? (1 point)
(ii) Describe how mountain ranges contribute to the climactic, geographic, and biological diversity observed in Costa Rica. (1 point)
(b) Given that Costa Rica is bordered by the Atlantic and Pacific Oceans, how are weather patterns in the country likely to be affected by the El Niño–Southern Oscillation (ENSO)? (2 points)
(c) Describe four ecosystem services that are provided through the protection of land and how the Costa Rican government may profit from each of them. (4 points)
(d) To promote economic sustainability, a large proportion of land was protected through debt-for-nature programs. Describe debt-fornature programs and why they are effective. (2 points)
(e) Describe two ways that you might determine if
8. You have installed a solar-charged battery that can provide 4 MJ of electrical energy each day. Approximately how many 50 W bulbs can you run on the battery if each bulb is on for an average of
Section 2: Free-Response Questions
Be inspired by individuals making a difference.
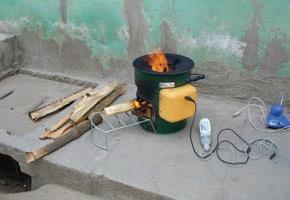
A New Cook Stove Design working toward sustainability
In China, India, and sub-Saharan Africa, people in 80 to 90 percent of households cook food using wood, animal manure, and crop residues as their fuel. Since women do most of the cooking, and young children are with the women of the household for much of the time, it is the women and young children who receive the greatest exposure to carbon monoxide and particulate matter. When biomass is used for cooking, concentrations of particulate matter in the home can be 200 times higher than the exposure limits recommended by the EPA. A wide range of diseases has been associated with exposure to smoke from cooking. Earlier in this chapter, we described that indoor air pollution is responsible for 4 million deaths annually around the world, and indoor cooking is a major source of indoor air pollution.
fire and moves air through the stove at a rate that ensures complete combustion. The result is a more efficient burn, less fuel use, and less release of carbon monoxide and particulate matter. The stove weighs 0.7 kg (1.6 pounds).
Two innovators from the United States developed a cook stove for backpackers and other outdoor enthusiasts who needed to cook a hot meal with little impact on the environment. They described their stove as needing no gasoline and no batteries, both desirable features for people carrying all their belongings on their backs. They soon realized that their stove, which could burn wood, animal manure, or crop residue, could make an important contribution in the developing world. This stove, called BioLite, physically separates the solid fuel from the gases that form when the fuel is burned and allows the stove to burn the gases. In addition, a small electric fan, located inside the stove, harnesses energy from the heat of the
How did the innovators manage to generate the electricity? They added a small semiconductor that generates electricity from the heat of the stove. All components of the stove except the semiconductor could be manufactured or repaired in a developing country. The BioLite stove won an international competition in early 2009 for the lowest emission stove. It was also the only stove in the competition that required no additional electricity inputs to operate. The BioLite stove is commercially available. One review of it stated that “it charges your phone while cooking your dinner.”
There are hundreds of projects underway around the world to enable women to use more efficient cooking stoves, ventilate cooking areas, cook outside whenever possible, and change customs and practices that will reduce their exposure to indoor air pollution. The use of an efficient cook stove will have the added benefit of consuming less fuel. This improves air quality and reduces the amount of fuel needed, which has environmental benefits and also reduces the amount of time that a woman must spend searching for fuel. Increasing the efficiency of the combustion process requires the proper mix of fuel and oxygen. One effective method of ensuring a cleaner burn is the use of a small fan to facilitate greater oxygen delivery. However, because most homes in developing countries with significant indoor air pollution problems do not have access to electricity, some sort of internal source of energy for the fan is needed.
There are many possible hurdles for those who are trying to introduce cleaner, more efficient cooking apparatus to the developing world. Manufacturing costs might make the stove difficult to afford for many. There has been some concern about possible reluctance
Critical Thinking Questions
Working Toward Sustainability
At the end of each chapter read about people and organizations that are making a difference.
to accept a different kind of cooking appliance. However, a number of studies in the developing world suggest that most households are quite receptive to using efficient stoves because of the benefits of improved air quality and reduced time spent obtaining fuel. Other promising ways to reduce fuel use and improve indoor air quality include the solar cooker shown in Figure 39.2 on page 451.
Critical Thinking Questions
1. Why are women and children often the ones most exposed to indoor air pollution in developing countries?
2. How can technology offer solutions to cooking over open fires?
References
Bilger, B. 2009. Annals of Invention, Hearth Surgery, The New Yorker, December 21, p. 84; http://www.newyorker .com/reporting/2009/12/21/091221fa_fact_bilger#ixzz 0sMCn DR00. www.biolitestove.com, homepage of BioLite stove.
Working Toward Sustainability provides questions that give you a chance to hone your critical thinking and writing skills.
Science in the real world.
approximately 285 billion kilograms of dissolved salts today, so at the rate of stream flow before the diversion, it would have taken about 47,500 years to accumulate that much salt:
In this chapter, we examined the major air pollutants and their natural and anthropogenic sources. We found that photochemical smog and acidic deposition are two
285 billion kg ÷ 6 million kg/year = 47,500 years
Does our calculation agree with the salt in Mono Lake?
atmosphere. Stratospheric ozone depletion has occurred because of the release of chlorofluorocarbons (CFCs) from refrigeration and air-conditioning units. Due to an international agreement, the Montreal Protocol on Substances That Deplete the Ozone Layer, there was a stratospheric ozone depletion has been reduced. Indoor air pollution is a problem that occurs around the world, although with causes and pollutants that differ between developing
Key Terms
Air pollution
Earth scientists believe that no water has flowed out of the Mono Lake basin since it was formed about 120,000 years ago. Assuming that Earth’s climate hasn’t changed significantly over that time and that water inputs to Mono Lake have not changed drastically over that time period, what can we calculate about how much salt should be in the water of Mono Lake?
At today’s input rate, how much salt should be in the water of Mono Lake today?
6 million kg/year × 120,000 years = 720 billion kg of dissolved salt versus 285 billion kg estimated recently.
Photochemical smog
Science Applied
Questions
1. How did Los Angeles inadvertently conduct an experiment at Mono Lake?
scienceapplied
Particulate matter (PM)
Particulates
Particles
Haze
Photochemical oxidant
Los Angeles–type smog
Brown smog
At the end of each unit, the “Science Applied” feature offers you an opportunity to read about how the science you are learning is used to make decisions about environmental issues.
2. What chemical principle causes terminal lakes to become more salty?
Primary pollutant
3. What is the reason for the discrepancy between the two calculations of salt content in Mono Lake?
Secondary pollutant
The calculated salt contents do not match. How can we explain the discrepancy?
Sulfurous smog
London-type smog
Thermal inversion
Inversion layer
Free-response Question
Asbestos
What Happened to the Missing Salt?
Ozone (O3)
Smog
Friedland2e_c15_516-551hr_pv3.0.1.indd 547
Gray smog
Industrial smog
Volatile organic compound (VOC)
At the beginning of the twentieth century, the City of Los Angeles needed more water for its inhabitants. As we saw at the beginning of Chapter 2, in 1913 the city designed a plan to redirect water away from Mono Lake in California. Before the Los Angeles Aqueduct was built, approximately 120 billion liters of stream water (31 billion gallons) flowed into Mono Lake in an average year. The City of Los Angeles altered the water balance of Mono Lake and at the same time caused a series of changes to the Mono Lake system that led to an increase in the salt concentration in Mono Lake.
To understand the problems at Mono Lake, ecosystem scientists had to examine water and chemical flows in natural waterways. Looking at the water and salt budgets of Mono Lake gave rise to observations, conclusions, and new studies on how human activities influence lakes. In a way, the City of Los Angeles con ducted an experiment of what happens if you stop the flow of water into a terminal lake.
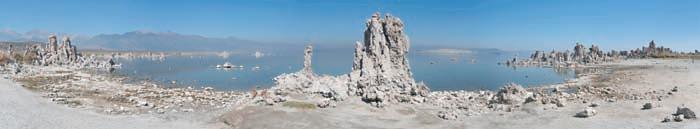
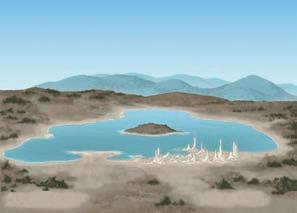
The lake’s towering tufa formations, prominently featured in the photograph at the beginning of Chapter 2, hold the answer: Many of the salts that entered Mono Lake over time (including calcium, sodium, and magnesium) have precipitated—that is, solidified—out of the water to form the tufa rock. In this way, the salts have been removed from the water, but not from the Mono Lake system as a whole. Our analysis of salts in Mono Lake is complete when we account for the salts removed from the lake as tufa. FIgURE SA1.1 summarizes these inputs to and outputs from the Mono Lake system. And they show us how we can apply environmental science to learn about natural processes in systems, and understand how humans impact natural systems, in this case by diverting water (FIgURE SA1.2).
Sick building syndrome
water from streams must be equal to the output of water through evaporation.
How did the salt balance change at Mono Lake?
Although we can make the assumption that the water in Mono Lake is in steady state in a typical year, the salt balance in the lake is not. By applying some of the principles we have learned in the first two chapters, we can make observations and draw conclusions about what has probably happened at Mono Lake. The stream water that entered Mono Lake contained salt, as all natural waters do. The salt content of this water flowing into Mono Lake varied, but a typical liter of lake water averaged 50 mg of salt. Note that 50 mg/L
Practice Free-Response Questions
10/29/14 4:47 PM
Input: Stream water and dissolved salts
What is a terminal lake?
Mono Lake is a terminal lake because it is at the lowest point of the landscape: Water flows into the lake from rivers and streams and from precipitation, but does not flow out. However, in a typical year before Los Angeles began diverting water, the water level did not rise or fall at Mono Lake. The water exiting a terminal lake must balance with the water entering. If it does not, the lake will eventually either dry out or overflow its banks. But if the water level stays constant, and since Mono Lake is a terminal lake with no surface exits for liquid water,
Output: Evaporation of water (leaving salts behind)
To calculate the total amount of salt that entered Mono Lake each year, we can multiply the concentration of salt, 50 mg per liter of water, by the number of liters of water flowing into the lake, before it was diverted by the City of Los Angeles: 120 billion liters per year:
Science Applied includes a free-response question related to the topic in the article.
Water that flows into Mono Lake contains a much smaller concentration of salt than the water already in the lake. This inflow tends to stratify, or float on top of existing water, because fresh water is less dense that salt water. As salt from the lower layer dissolves into the upper layer, nutrients from the bottom of the lake also rise to the surface. This exchange of nutrients is critical for the growth of algae in the surface waters. Recent research suggests that the reduction of water diversion from Mono Lake had unexpected results: In 1995, the reduction of stream diversions from Mono Lake, combined with greater than average quantities of fresh water from snowmelt runoff, led to a rapid rise in water level. The large volume of fresh water from streams led to a long-term stratification of the lake, with fresh water on the surface and salt water on the bottom. Relative to baseline data taken before the initial stream diversions, stratification has severely reduced the rate at which nutrients rise from the bottom of the lake. Long-term projections based on mathematical models suggest that the current degree of stratification will persist for decades.
6 trillion mg salt/year
(a) List three potential consequences of reduced lake mixing. (3 points)
6 million kg salt/year
(b) Describe two adaptive management strategies that could reduce lake stratification in Mono Lake. (3 points)
This is the annual input of salt by weight to Mono Lake.
(c) What is the chemical property of water that allows salt to dissolve? (2 points)
(d) Why would the mixing of salt water with fresh
BioLite cookstove. This small stove, and others like it, has the potential to reduce the amount of firewood needed to cook a meal, and lower the amount of indoor air pollution emitted as well. (Jonathan den Hartog; courtesy of Jonathan Cedar, www.BioLiteStove.com)
Tracy Packer Photography/Getty Images
Figure SA1.2 Research at Mono Lake. This photo shows a scientist collecting a water sample at Mono Lake. (Henry Bortman/NASA)
FRIEDLAND and RELYEA Environmental Science for AP®
SECOND EDITION
A hydraulic fracturing site like this one near Canton, Pennsylvania, can contain many features that are seen prominently here including a concrete pad, a drilling rig, and many storage containers. (Les Stone/Corbis)
Environmental Science: Studying the State of Our Earth
Module 1 Environmental Science
Module 2 Environmental Indicators and Sustainability
Module 3 Scientific Method
To Frack, Or Not to Frack
The United States—like other developed countries—is highly dependent on fuels such as coal and oil that come from the remains of ancient plants and animals. However, the use of these fossil fuels is responsible for many environmental problems that include land degradation and the release of pollutants into the air and water. Natural gas, also known as methane, is the least harmful producer of air pollution among the fossil fuels; it burns more completely and cleanly than coal or oil, and it contains fewer impurities. Due to advances in technology, oil and mining companies have recently increased their reliance on fracking.
Fracking, short for hydraulic fracturing, is a method of oil and gas extraction that uses high-pressure fluids to force open existing cracks in rocks deep underground. This technique allows extraction
Footage of flames shooting from kitchen faucets became popular on YouTube.
of natural gas from locations that were previously so difficult to reach that extraction was economically unfeasible. As a result, large quantities of natural gas are now available in the United States at a
lower cost than before. A decade ago, 40 percent of energy in the United States was used to generate electricity with half of that energy coming from coal. As a result of fracking, electricity generation now uses less coal and more natural gas. Since coal emits more air pollutants—including carbon dioxide—than does natural gas, increased fracking initially appeared to be beneficial to the environment.
Fracking Hydraulic fracturing, a method of oil and gas extraction that uses high-pressure fluids to force open cracks in rocks deep underground.
However, reports soon began appearing both in the popular press and in scientific journals about the negative consequences of fracking. Large amounts of water are used in the fracking process with millions of gallons of water taken out of local streams and rivers and pumped down into each gas well. A portion of this water is later removed from the well and must be properly treated after use to avoid contaminating local water bodies.
A variety of chemicals are added to the fracking fluid to facilitate the release of natural gas. Mining companies are not required to publicly identify all of these chemicals. Environmental scientists and concerned citizens began to wonder if fracking was responsible for chemical contamination of underground water and, in one case, the poisoning of livestock. Some drinkingwater wells near fracking sites became c ontaminated with natural gas, and homeowners and public health officials asked if fracking was the culprit. Water with high concentrations of natural gas can be flammable, and footage of flames shooting from kitchen faucets after someone ignited the water became popular on YouTube, in documentaries, and in feature films.
THowever, it wasn’t clear if fracking caused natural gas to contaminate well water or if some of these wells contained natural gas long before fracking began. Several reputable studies showed that drinking-water wells near some fracking sites were contaminated, with natural gas concentrations in the nearby wells being much higher than in more distant wells. These issues need further study, which may take years.
Scientists have begun to assess how much natural gas escapes during the fracking and gas extraction process. As we will learn in Chapter 19, methane is a greenhouse gas and is much more efficient at trapping heat from Earth than carbon dioxide, which is the greenhouse gas most commonly produced by human activity. As the number of potential environmental issues associated with fracking began to increase, environmental scientists and activists began to ask whether fracking was making the greenhouse problem and other environmental problems worse. By 2014, it appeared that opponents of fracking were as numerous as supporters.
Certainly, using natural gas is better for the environment than coal, though using less fossil fuel—or using no
fossil fuel at all—would be even better. However, at present it is difficult to know whether the benefits of using natural gas outweigh the problems that extraction causes. Many years may pass before the extent and nature of harm from fracking is known.
The story of natural gas fracking provides a good introduction to the study of environmental science. It shows us that human activities that are initially perceived as causing little harm to the environment can in fact have adverse effects, and that we may not recognize these effects until we better understand the science surrounding the issue. It also illustrates the difficulty in obtaining absolute answers to questions about the environment and demonstrates that environmental science can be controversial. Finally, it shows us that making assessments and choosing appropriate actions in environmental science are not always as clear-cut as they first appear.
Sources:
S. G. Osborn et al., Methane contamination of drinking water accompanying gas-well drilling and hydraulic fracturing, Proceedings of the National Academy of Sciences 108 (2011): 8172–8176; Drilling down. Multiple authors in 2011 and 2012. New York Times, viewed at: http://www.nytimes.com/interactive/us /DRILLING_DOWN_SERIES.html.
he process of scientific inquiry builds on previous work and careful, sometimes lengthy, investigations. For example, we will eventually accumulate a body of knowledge on the effects of hydraulic fracturing of natural gas, but until we have this knowledge, we will not be able to make a fully informed decision about the policies of energy extraction. In the meantime, we may need to make interim decisions based on incomplete information. This uncertainty is one feature—and an exciting aspect—of environmental science.
To investigate important topics such as the extraction and use of fossil fuels, environmental science relies on a number of indicators, methodologies, and tools. This chapter introduces you to the study of the environment and outlines some of the important foundations and assumptions you will use throughout your study.
Environmental Science 1
Humans are dependent on Earth’s air, water, and soil for our existence. However, we have altered the planet in many ways, both large and small. The study of environmental science can help us understand how humans have changed the planet and identify ways of responding to those changes.
Learning Objectives
After reading this module you should be able to
• define the field of environmental science and discuss its importance.
• identify ways in which humans have altered and continue to alter our environment.
Environmental science offers important insights into our world and how we influence it
Stop reading for a moment and look up to observe your surroundings. Consider the air you breathe, the heating or cooling system that keeps you at a comfortable temperature, and the natural or artificial light that helps you see. Our environment is the sum of all the conditions surrounding us that influence life. These conditions include living organisms as well as nonliving components such as soil, temperature, and water. The influence of humans is an important part of the environment as well. The environment we live in determines how healthy we are, how fast we grow, how easy it is to move around, and even how much food we can obtain. One environment may be strikingly different from another—a hot, dry desert versus a cool, humid tropical rainforest, or a coral reef teeming with marine life versus a crowded city street. We are about to begin an examination of environmental science, the field of study that looks at interactions among human systems and those found in nature. By system we mean any set of interacting com-
ponents that influence one another by exchanging energy or materials. We have already seen that a change in one part of a system—for example, fracking in a particular geologic formation—can cause changes throughout the entire system, such as in a nearby well that supplies drinking water.
An environmental system may be completely human-made, like a subway system, or it may be natural, like weather. The scope of an environmental scientist’s work can vary from looking at a small population of individuals, to multiple populations that make up a species, to a community of interacting species, or to even larger systems, such as the global climate system. Some environmental scientists are interested in regional problems. The specific case of fracking at a particular location in the United States, for example, is a regional problem. Other environmental scientists
Environment The sum of all the conditions surrounding us that influence life.
Environmental science The field of study that looks at interactions among human systems and those found in nature.
work on global issues, such as species extinction and climate change.
Many environmental scientists study a specific type of natural system known as an ecosystem. An ecosystem is a particular location on Earth with interacting components that include living, or biotic, components and nonliving, or abiotic, components.
As a student of environmental science, you should recognize that environmental science is different from environmentalism, which is a social movement that seeks to protect the environment through lobbying, activism, and education. An environmentalist is a person who participates in environmentalism. In contrast, an environmental scientist, like any scientist, follows the process of observation, hypothesis testing, and field and laboratory research. We’ll learn more about the process of science later in this chapter.
Ecosystem A particular location on Earth with interacting biotic and abiotic components.
Biotic Living.
Abiotic Nonliving.
Environmentalist A person who participates in environmentalism, a social movement that seeks to protect the environment through lobbying, activism, and education.
Environmental studies The field of study that includes environmental science and additional subjects such as environmental policy, economics, literature, and ethics.
So what does the study of environmental science actually include? As FIGURE 1.1 shows, environmental science encompasses topics from many scientific disciplines, such as chemistry, biology, and Earth science. Environmental science is itself a subset of the broader field known as environmental studies, which includes additional subjects such as environmental policy, economics, literature, and ethics. Throughout the course of this book you will become familiar with these and many other disciplines.
We have seen that environmental science is a deeply interdisciplinary field. It is also a rapidly growing area of study. As human activities continue to affect the environment, environmental science can help us understand the consequences of our interactions with our planet and help us make better decisions about our actions.
Humans alter natural systems
Think of the last time you walked in a wooded area. Did you notice any dead or fallen trees? Chances are that even if you did, you were not aware that living and nonliving components were interacting all around you. Perhaps an insect pest killed the tree you saw and many others of the same species. Over time, dead trees in a forest lose moisture. The increase in dry wood makes the forest more vulnerable to intense wildfires. But the process doesn’t stop there. Wildfires trigger the germination of certain tree seeds, some of which lie dormant until after a fire. And so what began with the activity of insects leads to a transformation of the forest. In this way, biotic factors interact with abiotic factors to influence the future of the forest. All of these factors are part of a system.
Systems can vary in size. A large system may contain many smaller systems within it. FIGURE 1.2 shows an example of complex, interconnecting systems that operate at multiple space and time scales: the fisheries of the North Atlantic. A physiologist who wants to study how codfish survive in the North Atlantic’s freezing waters must consider all the biological adaptations of the cod that enable it to be part of one system. In this case, the fish and its internal organs are the system being studied. In the same environment, a marine biologist might study the predator-prey relationship between cod and herring. That relationship constitutes another system, which includes two fish species and the environment they live in. At an even larger scale, a scientist might examine a system that includes all of these systems as well as people, fishing technology, policy, and law. The global environment is composed of both small-scale and large-scale systems.
FIGURE 1.1 Environmental studies. The study of environmental science uses knowledge from many disciplines.