EMPIRICAL CORRELATION OF SOIL LIQUEFACTION BASED
ON SPT N-VALUE AND FINES CONTENT
KoHJI ToKIMATsu* and Y OSHIAKI Y OSHIMI**
ABSTRACT
A critical review of field performance of sandy soil deposits during past earthquakes is conducted with special emphasis being placed on Standard Penetration Test N-values and fines content. The field relationship between adjusted dynamic shear stress ratio and normalized SPT N-values together with laboratory tests on undisturbed sands indicate that (1) sands containing more than 10 percent fines has much greater resistance to liquefaction than clean sands having the same SPT N-values, (2) extensive damage would not occur for clean sands with SPT Ncvalues (N-values normalized for effective overburden stress of 1 kgf/cm 2) greater than 25, silty sands containing more than 10 percent fines with SPT N 1-values greater than 20, or sandy silts with more than 20 percent clay, and (3) sands containing gravel particles seem to have less resistance to liquefaction than clean sands without gravel having the same SPT N-values.
On the basis of the above findings, an improved empirical chart separating liquefiable and non-liquefiable conditions is presented in terms of dynamic shear stress ratio, SPT N-values, fines content, and shear strain amplitude.
Key words: case history, earthquake, earthquake damage, __ sample disturbance, sand, sandy soil (IGC: D 7/C 3)
INTRODUCTION
Despite its limitation as to lack of rigid standardization, the standard penetration test (SPT) N-value has been employed as a convenient parameter to express resistance of sandy soils to liquefaction. When the concept of critical N-value was first proposed by Koizumi (1966) and Kishida (1966) based on their observations of the Niigata earthquake of 1964, the availability of data was the
primary, if not the only, justification for using the SPT results to express resistance of sands to liquefaction. For several years afterwards, the emphasis was shifted toward the use of relative density that could readily be correlated with laboratory test results (Seed and Idriss, 1971).
More recently, however, the SPT has received renewed attention as various factors other than the relative density have been recognized to have significant influences on
* Assistant, Tokyo Institute of Technology, Meguro-ku, Tokyo (currently on leave as Visiting Scholar at University of California, Berkeley).
** Professor, Tokyo Institute of Technology, Meguro-ku, Tokyo.
Manuscript was received for review on March 31, 1983.
Written discussions on this paper should be submitted before October 1, 1984.
EMPIRICAL CORRELATION OF LIQUEFACTION
the liquefaction resistance of sands. The following conditions seem to support the use of the SPT N-value to express directly the resistance of sands to liquefaction, if a more standardized SPT procedure is used or an appropriate correction is made for adjusting energy loss due to friction between cathead and rope:
1. The SPT is an in situ test which reflects stress history and strain history effects, soil fabric, and horizontal effective stress, in addition to the combined effect of the relative density and the vertical stress (Seed, 1979). All of the above factors are known to influence the resistance of sands to liquefaction but are difficult to retain in most so-called "undisturbed" samples.
2. Numerous case histories of soil liquefaction during past earthquakes are available for which the SPT N-values before the earthquakes are known. The method based on field performance with these SPT Nvalues can, therefore, reflect in situ soil characteristics under real stress conditions during earthquakes which are difficult to be thoroughly simulated in the laboratory. Besides, abundant SPT data in potentially liquefiable soils will become useful for future earthquakes.
3. The SPT is primarily a shear strength test under essentially undrained conditions because of rapid strain rate (Schmertmann, 1977).
4. The SPT yields representative samples of soil whose index properties can be determined. This is a clear advantage of the SPT over the cone penetration test alone.
5. The low cost of the SPT enables one to carry out many tests so as to reduce the risk of missing weak spots.
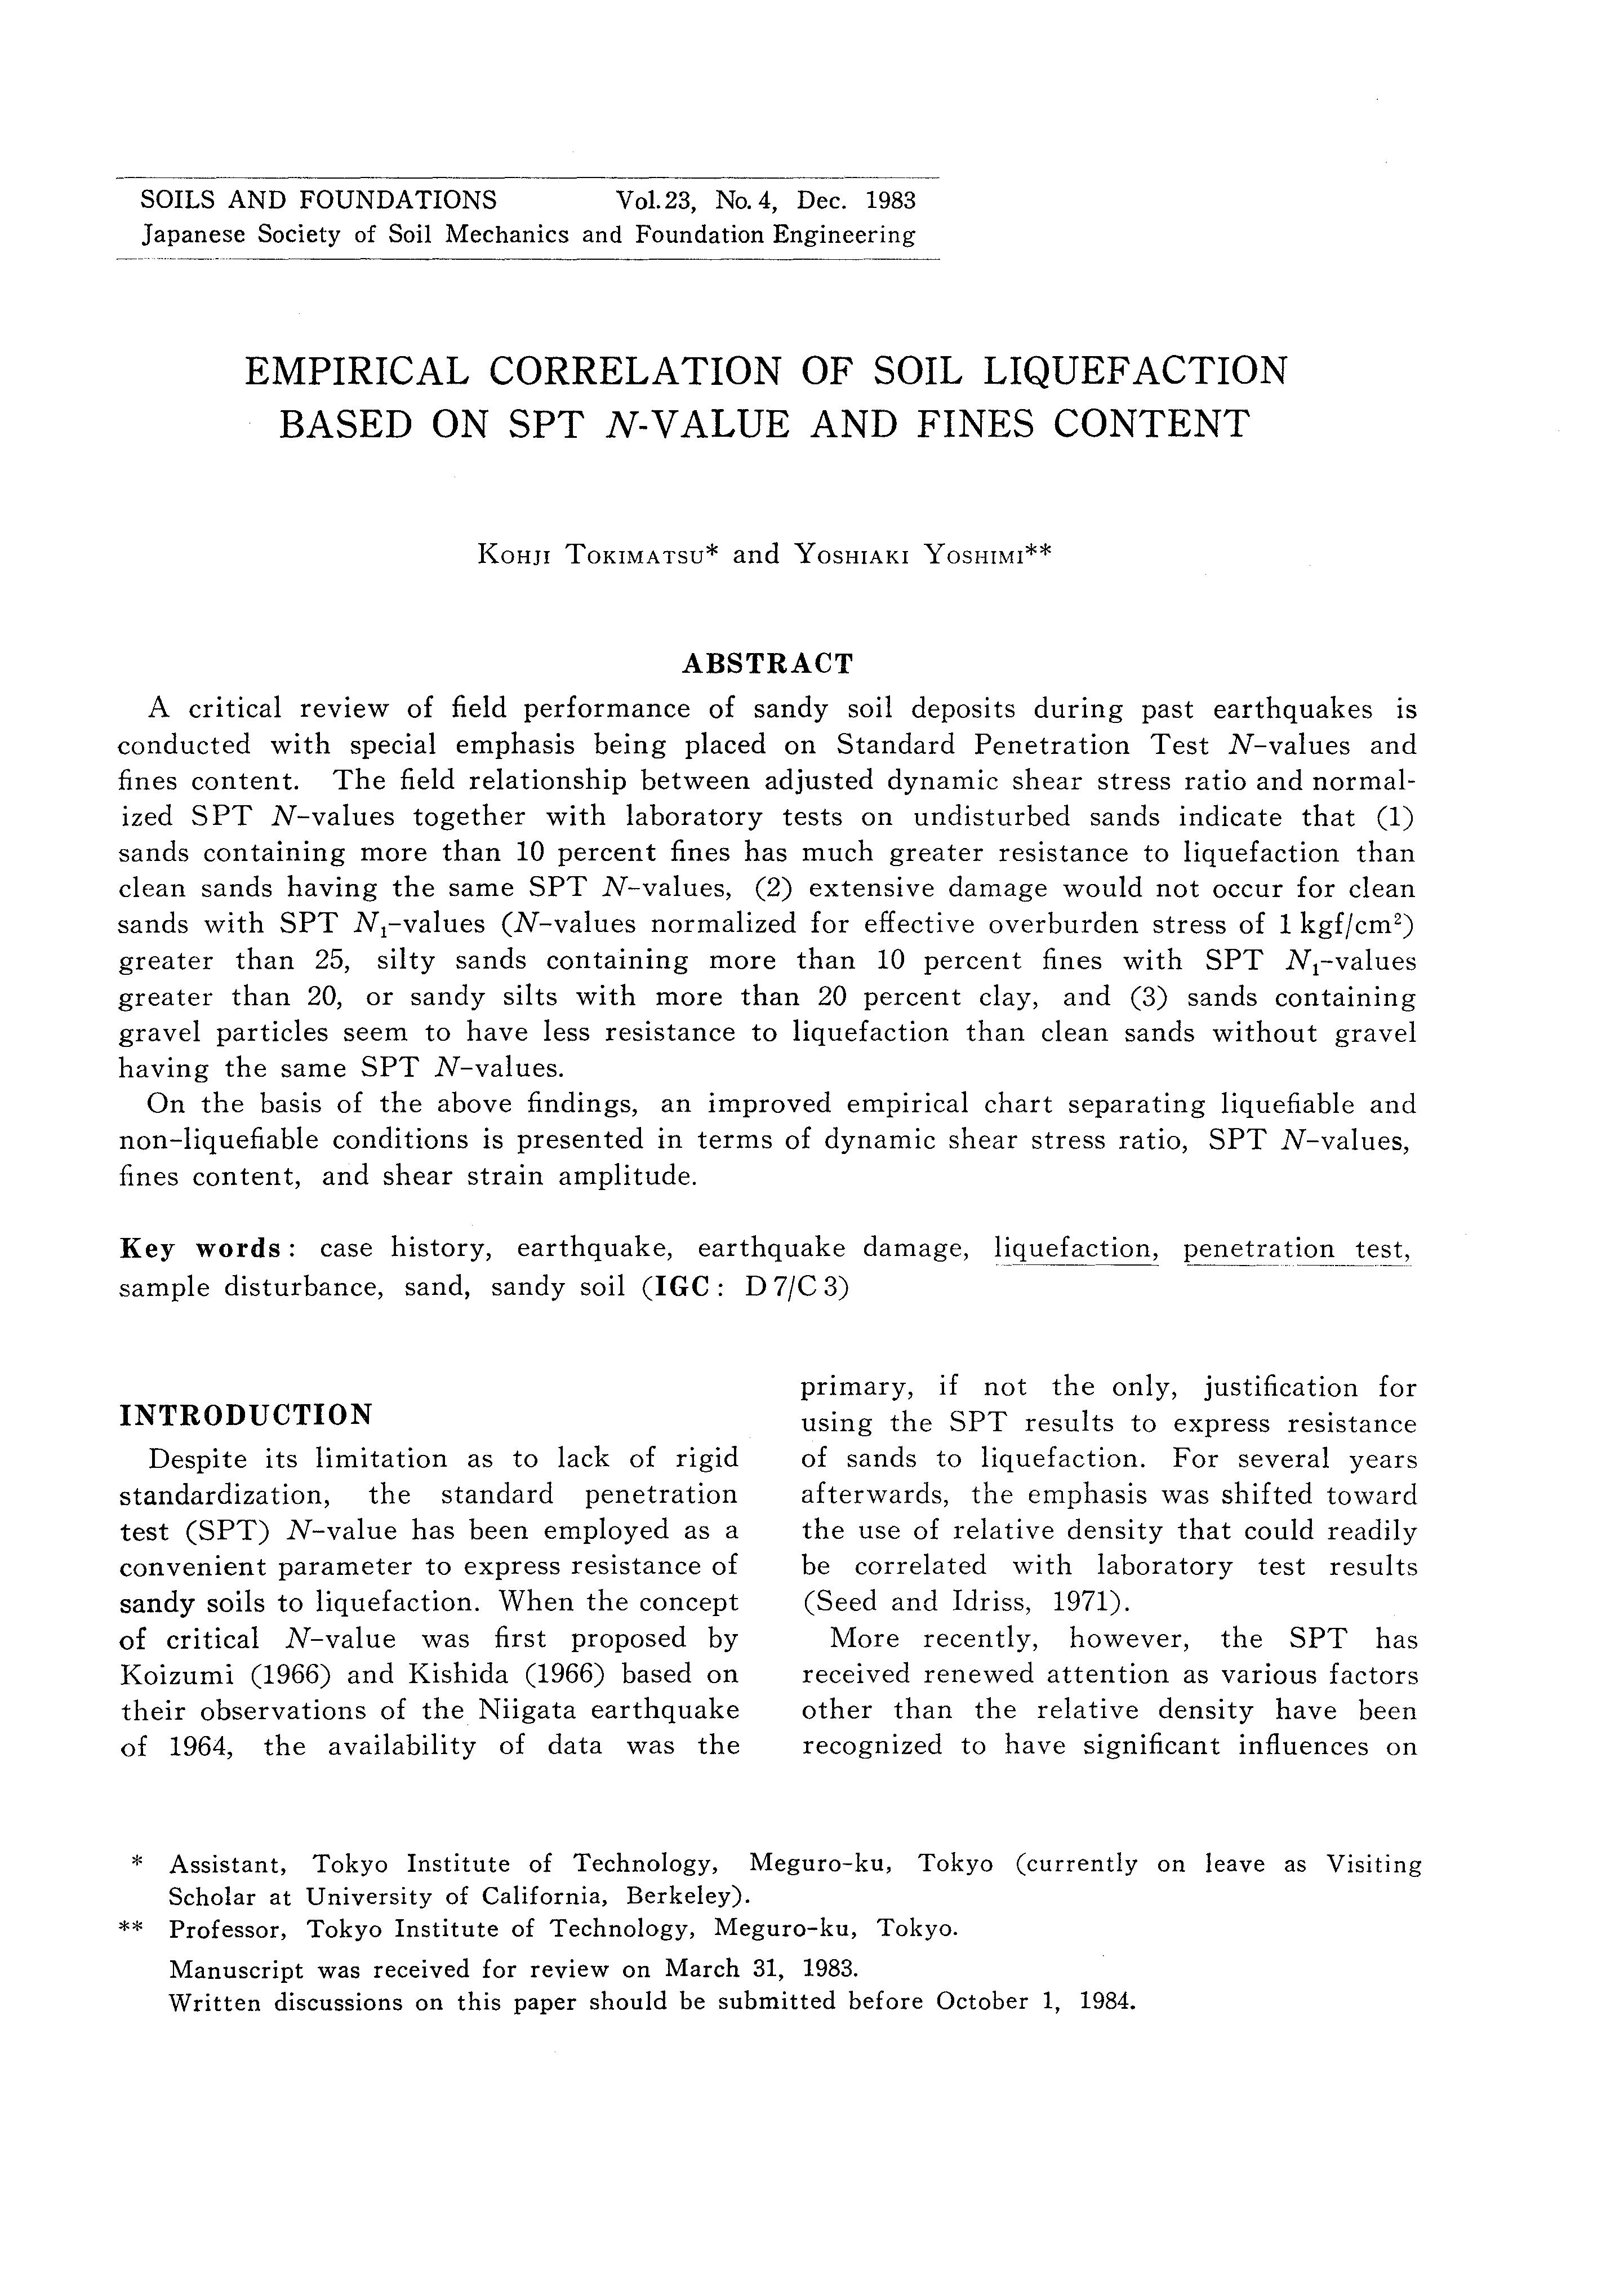
On the other hand, it has often been pointed out that the presence of fines tend to reduce the SPT N-value of sands without affecting their shear strength so much. Kodera (1964) reported that some piers of the Old Arakawa Bridge of the Tohoku line across the Ara river on clean sands settled during the Kanto Earthquake of 1923 considerably more than those on silty sands,
Fig. 1. Results of soil investigations conducted in 1964 along Arakawa Bridge of the Tohoku line with lJ indicating settlement of spread footing due to the Kanto Earthquake of 1923 (after Kodera, 1964)
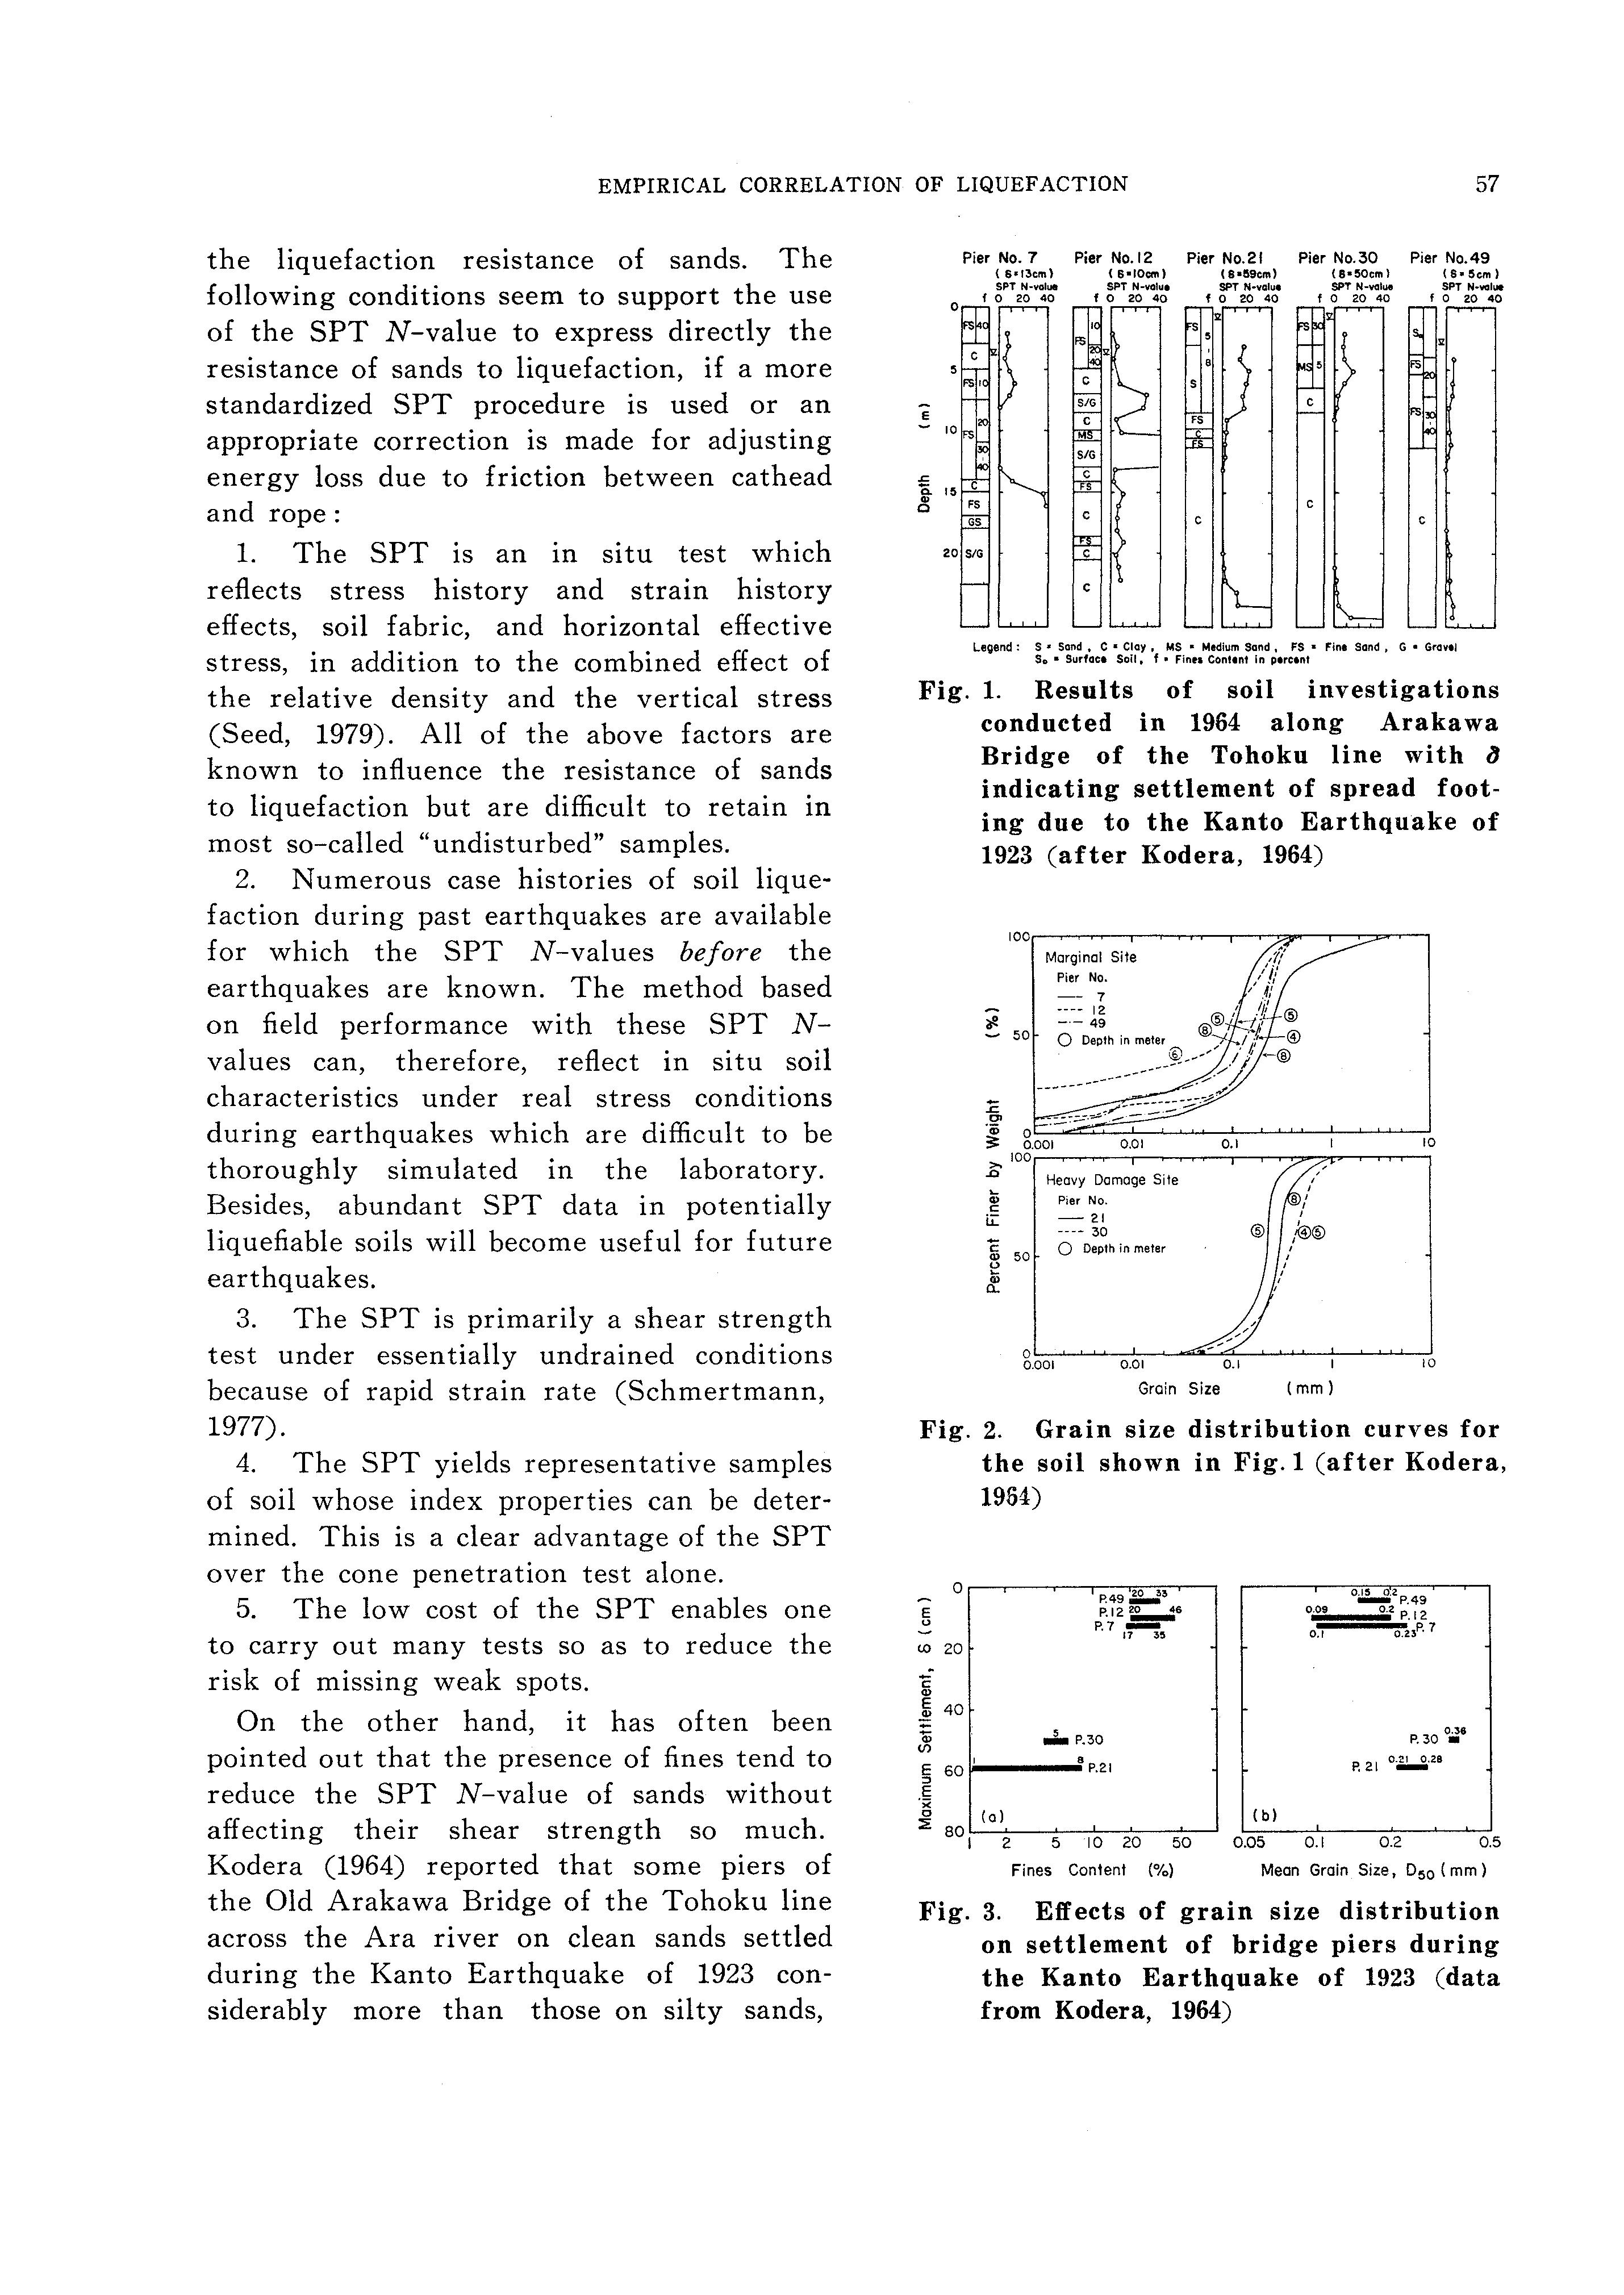
Fig. 2. Grain size distribution curves for the soil shown in Fig. 1 (after Kodera, 1954)
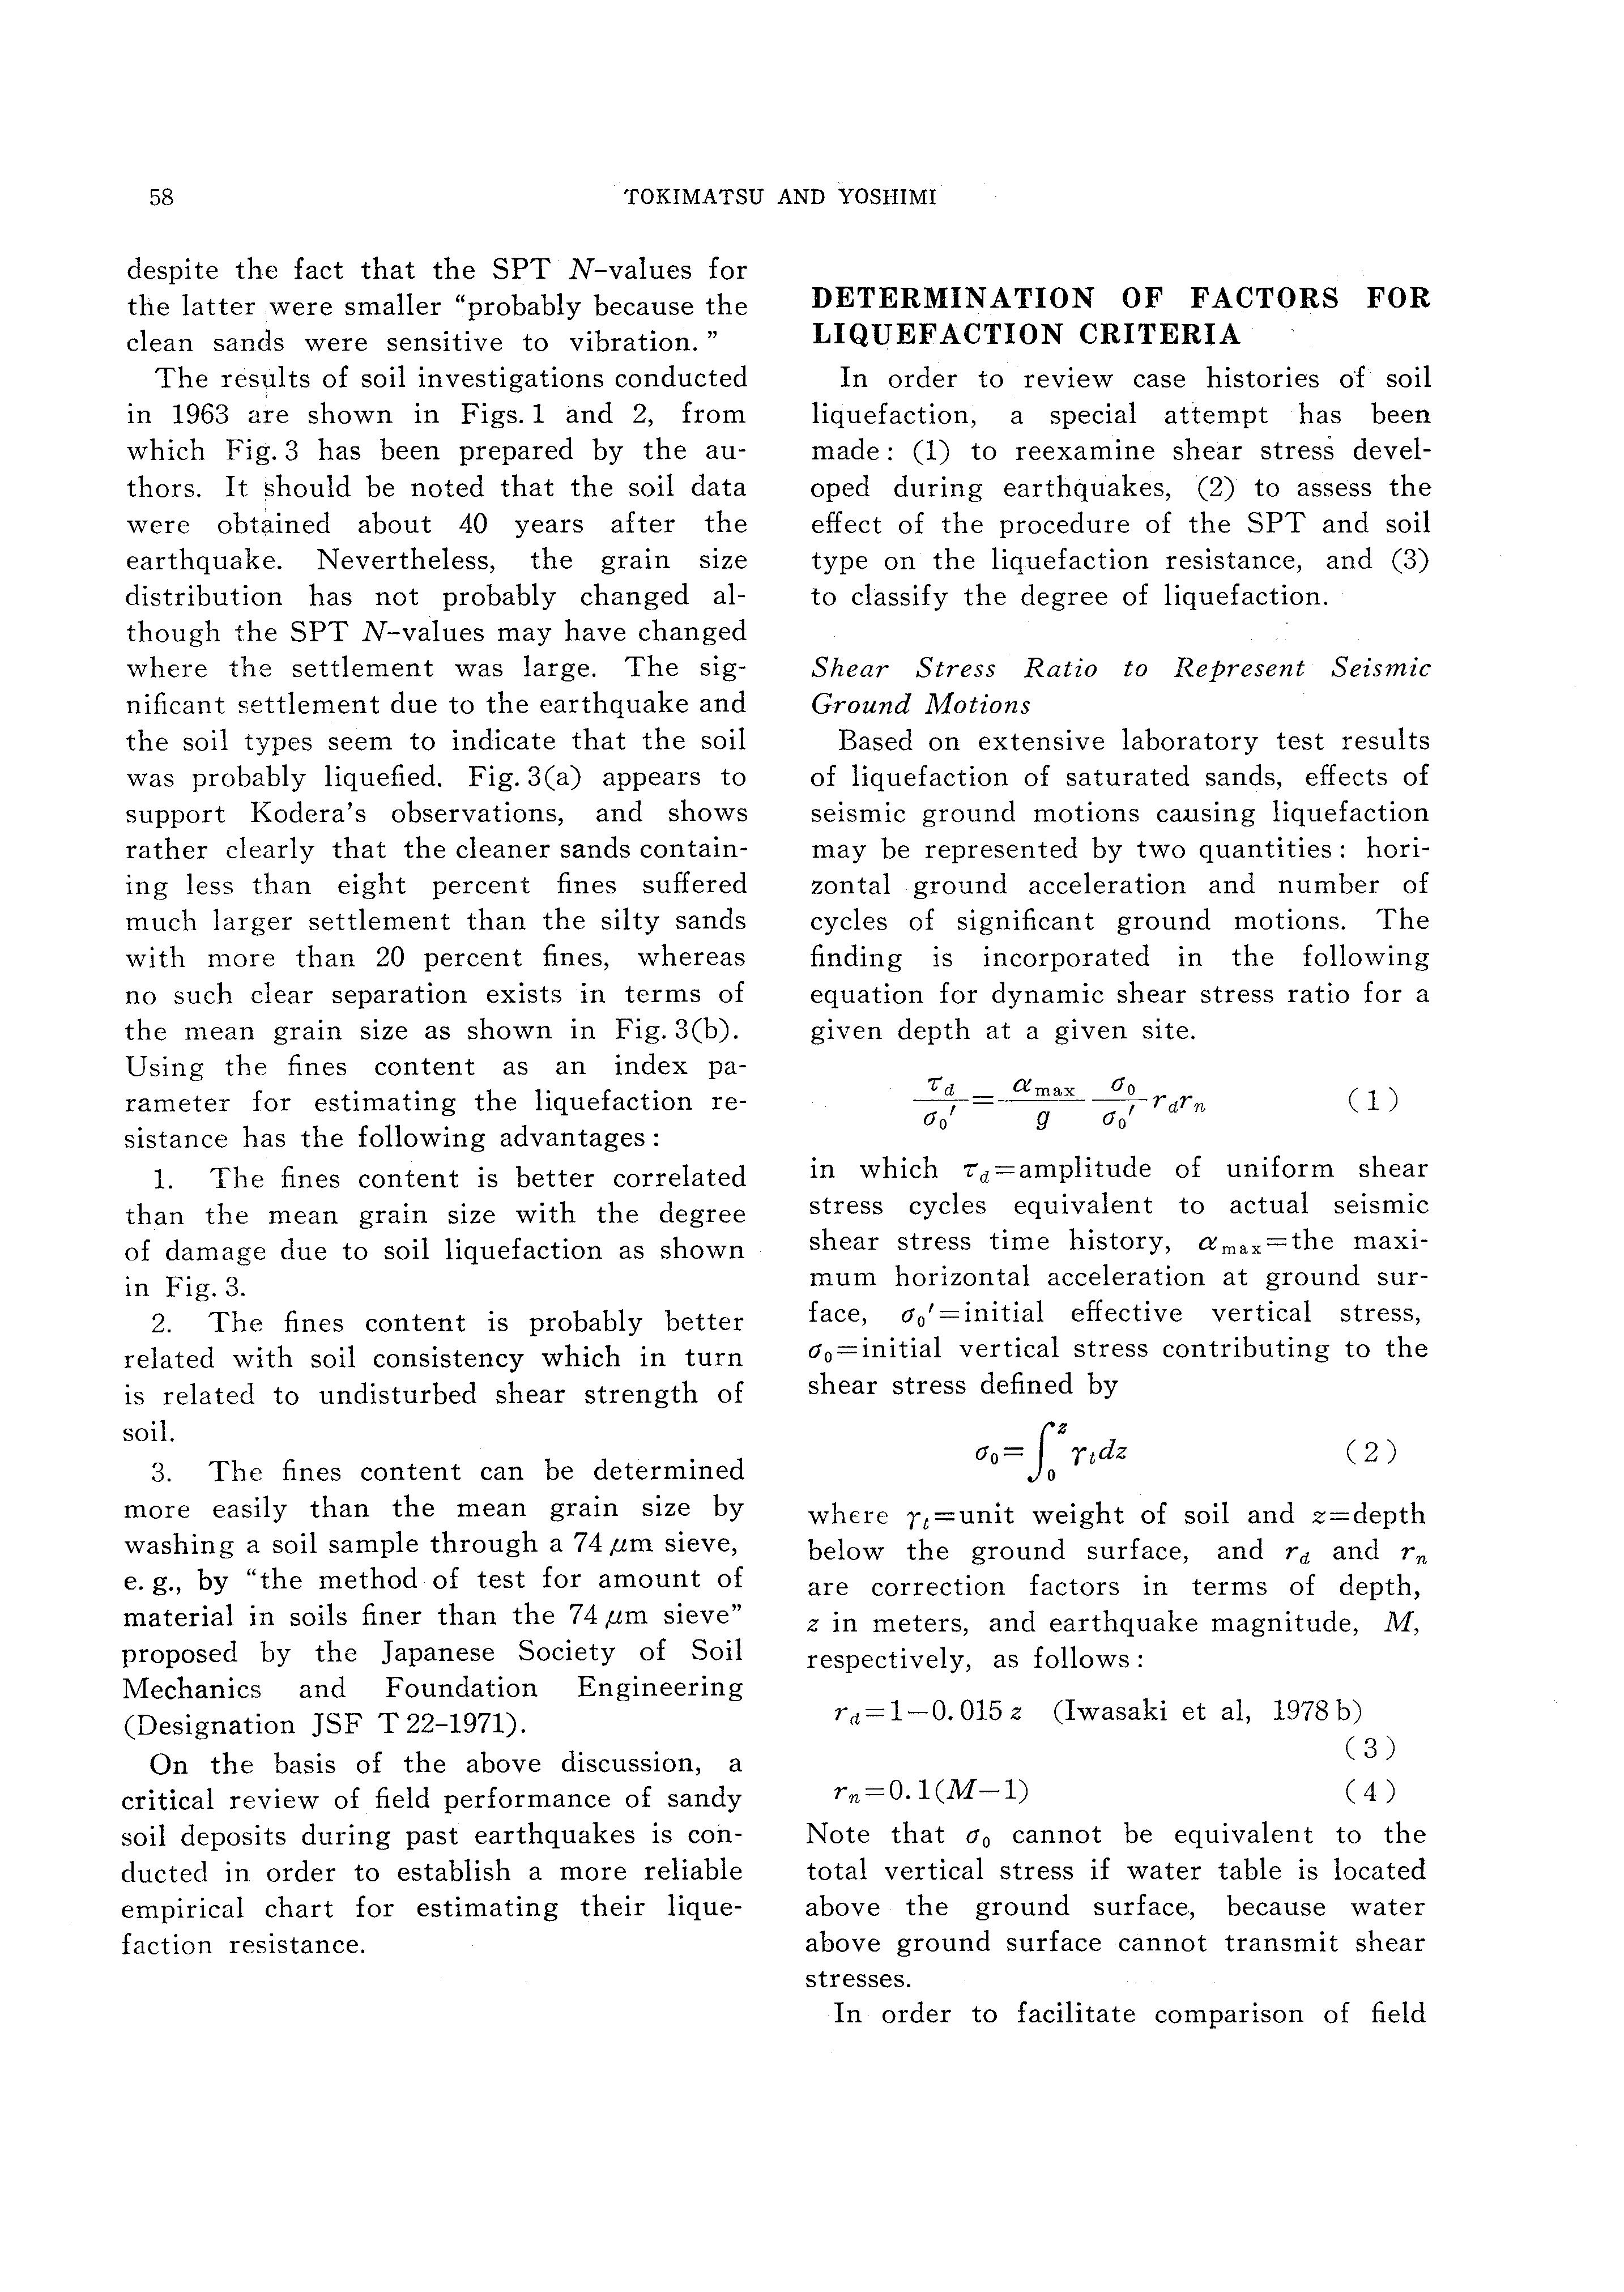
Fig. 3. Effects of grain size distribution on settlement of bridge piers during the Kanto Earthquake of 1923 (data from Kodera, 1964)
TOKIMATSU AND YOSHIMI
despite the fact that the SPT N-values for the latter were smaller "probably because the clean sands were sensitive to vibration. "
The results of soil investigations conducted in 1963 shown in Figs. 1 and 2, from which Fig. 3 has been prepared by the authors. It should be noted that the soil data were obtained about 40 years after the earthquake. Nevertheless, the grain size distribution has not probably changed although the SPT N-values may have changed where the settlement was large. The significant settlement due to the earthquake and the soil types seem to indicate that the soil was probably liquefied. Fig. 3(a) appears to support Kodera's observations, and shows rather clearly that the cleaner sands containing less than eight percent fines suffered much larger settlement than the silty sands with more than 20 percent fines, whereas no such clear separation exists in terms of the mean grain size as shown in Fig. 3(b). Using the fines content as an index parameter for estimating the liquefaction resistance has the following advantages:
1. The fines content is better correlated than the mean grain size with the degree of damage due to soil liquefaction as shown in Fig. 3.
2. The fines content is probably better related with soil consistency which in turn is related to undisturbed shear strength of soil.
3. The fines content can be determined more easily than the mean grain size by washing a soil sample through a 74 ,um sieve, e. g., by "the method of test for amount of material in soils finer than the 74 ,um sieve" proposed by the Japanese Society of Soil Mechanics and Foundation Engineering (Designation JSF T 22-1971).
On the basis of the above discussion, a critical review of field performance of sandy soil deposits during past earthquakes is conductecl in order to establish a more reliable empirical chart for estimating their liquefaction resistance.
DETERMINATION OF FACTORS FOR LIQUEFACTION CRITERIA
In order to review case histories of soil liquefaction, a special attempt has been made: (1) to reexamine shear stress developed during earthquakes, (2) to assess the effect of the procedure of the SPT and soil type on the liquefaction resistance, and (3) to classify the degree of liquefaction.
Shear Stress Ratio to Represent Seismic Ground Motions
Based on extensive laboratory test results of liquefaction of saturated sands, effects of seismic ground motions causing liquefaction may be represented by two quantities: horizontal ground acceleration and number of cycles of significant ground motions. The finding is incorporated in the following equation for dynamic shear stress ratio for a given depth at a given site.
-r d a max do --------rr Oo' - g oo' d n ( 1)
in which -r a =amplitude of uniform shear stress cycles equivalent to actual seismic shear stress time history, amax=the maximum horizontal acceleration at ground surface, rJ 0 1 =initial effective vertical stress, o 0 =initial vertical stress contributing to the shear stress defined by
Oo= lz TtdZ ( 2)
where rt=unit weight of soil and z=depth below the ground surface, and r a and r n are correction factors in terms of depth, z in meters, and earthquake magnitude, M, respectively, as follows:
ra=1-0.015z (Iwasaki et al, 1978b) ( 3)
rn=0.1(M-1) (4)
Note that o 0 cannot be equivalent to the total vertical stress if water table is located above the ground surface, because water above ground surface cannot transmit shear stresses.
In order to facilitate comparison of field
Table 1. Relationship among earthquake magnitude, number of cycles, and rn
l':arthquat:e Number r 11agnitude of Cycles n
6 0.54
rn =O.I(M-1)
Data from Table I
6 7 8 Magnitude, M
Fig. 4. Relationship between rn and earthquake magnitude
behavior during earthquakes of different magnitudes, the factor r n in Eq. ( 4) is introduced so that a given number of cycles, Nz, of 0. 65 times the maxim urn shear stress amplitude will be converted into 15 cycles of rn times the maximum shear stress amplitude, on the basis of the relationship between number of cycles of 0. 65 times the maximum shear stress and earthquake magnitude (Seed et al, 1975) as shown in Table 1, and the assumption that the relationship between dynamic shear stress and number of cycles on a log-log graph is a straight line having a slope of 0. 2 as defined by rn=O. 65(Nz/15) 0 • 2 ( 5)
The exact relationship between r n and M based on Eq. (5) is shown in Table 1 which may well be represented by Eq. ( 4) as shown in Fig. 4. It can be noted that if M=7. 5, Eq. (4) gives rn=O. 65 which is familiar in currently available simplified procedures. \Vhen the expressions for r d and r n are incorporated, Eq. (1) becomes - r d = 0. 1 (M -1) (f o' g 4 (1-0. 015 z) ao (6)
The maximum acceleration in Eqs. (1) and (6) has been estimated on the basis of various field observations including those of overturned tombstones and collapse ratio of wooden houses as well as empirical relationships between earthquake magnitude and epicentral distance and, if any, strong motion records registered near the site. In order to estimate the maximum horizontal acceleration from overturned the following equation 1s introduced based on static equilibrium.
1Xmax K ( 7 ) g 1+tcK in \vhich K is the resultant seismic coefficient defined by the critical width to height ratio, B/H, of a tombstone, which would just overturn during an earthquake, and tc denotes the ratio of the maximum vertical acceleration to the maximum horizontal acceleration. In the following, the coefficient tc is rather arbitrarily assigned a value of 0. 5 for determining a max/ g, because many studies have shown that it is within a range between 1/2 and 2/3.
SPT N-value to Express Liquefaction Resistance
Recent studies by Schmertmann (1977) and Kovacs et al (1977) have shown that potential variability may exsist in the SPT Nvalue despite the adjective "standard." Among various factors, the amount of energy delivered into sampler rods appears to be the most important factor affecting SPT N-values. The SPT N-values used in the following pages are mainly obtained in Japan and, therefore, measured according to the Method of Penetration Test for Soils, JIS A 1219-1961, that requires a free fall of the hammer.
On the basis of a questionnaire survey conducted recently, Yoshimi and Tokimatsu (1983) showed that the following three procedures to drop the hammer onto the rod during the SPT measurement are frequently used in current Japanese practice.
( 1 ) The trip monkey (tonbi) method ( 2) The cathead (pulley) and rope meth-
TOKIMA TSU AND YOSHIMI
0 A Data from Yoshimi and Tokimotsu (1983) 40 o A Dota from Tokimot&u and Yoshimi (1981)
OQ I0 20 30 40 50 SPT N-value by the Cat head and Rape Methad
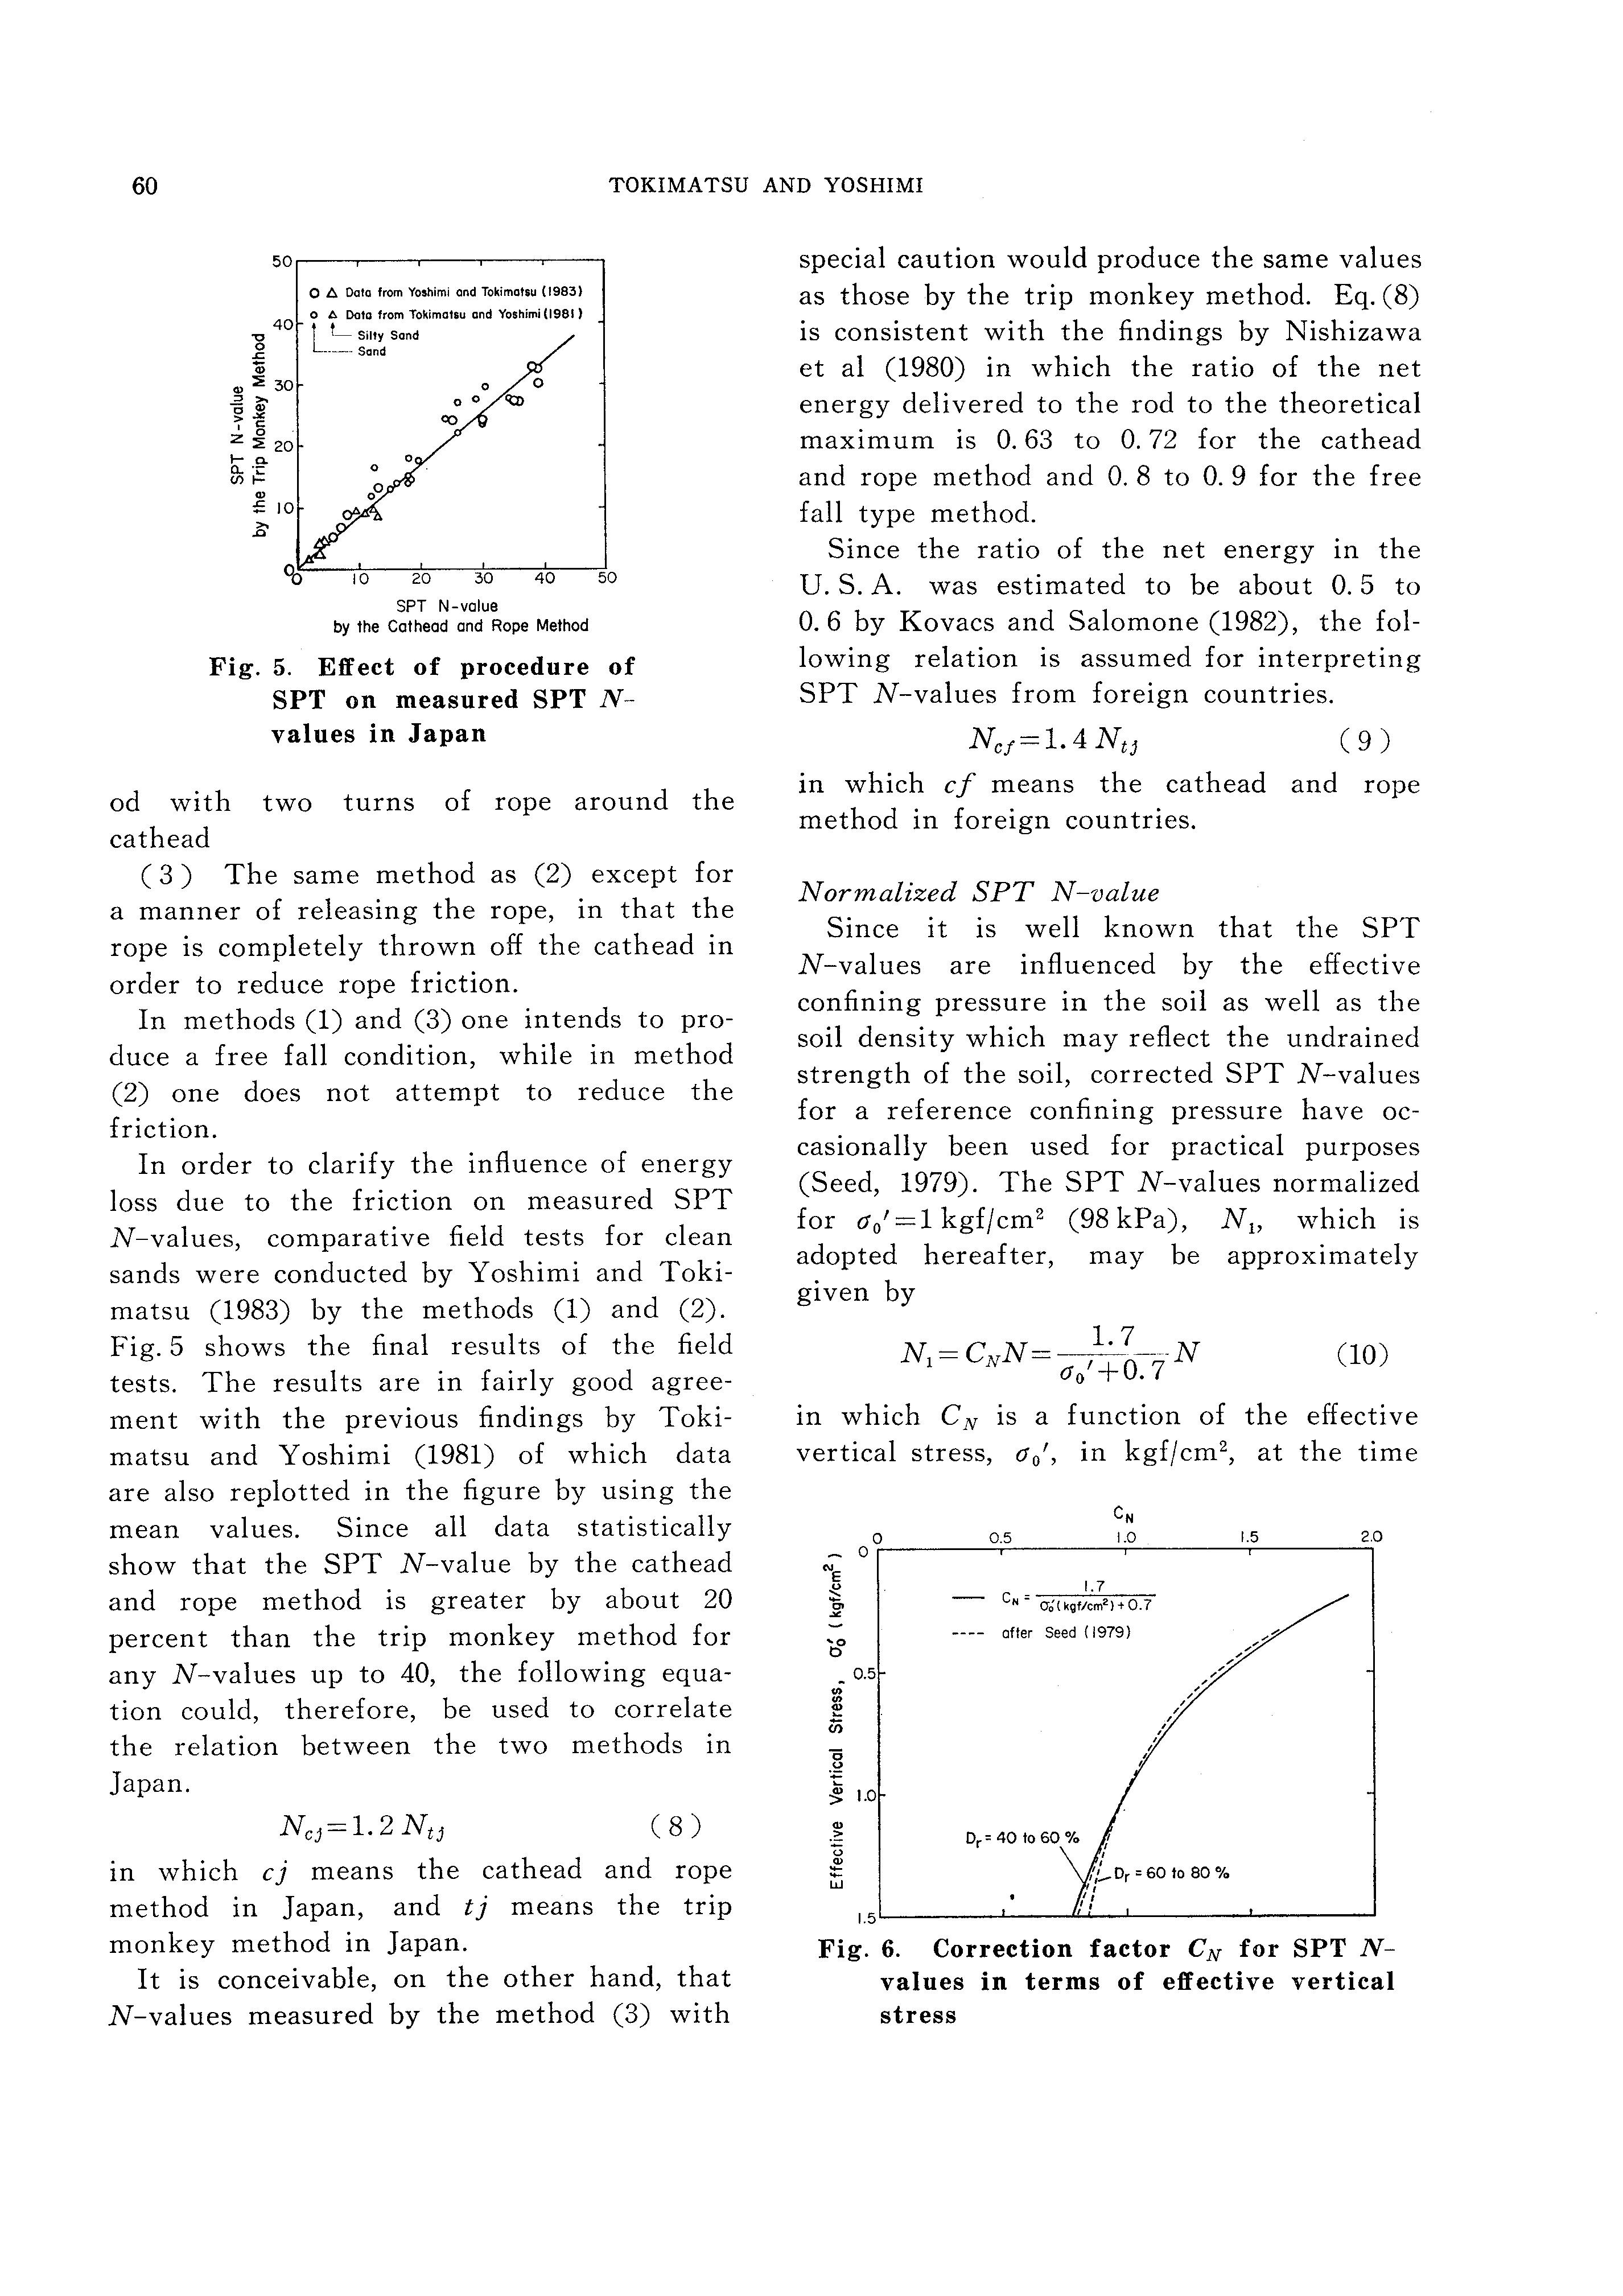
Fig. 5. Effect of procedure of SPT on measured SPT Nvalues in Japan
od with two turns of rope around the cat head ( 3 ) The same method as (2) except for a manner of releasing the rope, in that the rope is completely thrown off the cathead in order to reduce rope friction.
In methods (1) and (3) one intends to produce a free fall condition, while in method (2) one does not attempt to reduce the friction.
In order to clarify the influence of energy loss due to the friction on measured SPT N-values, comparative field tests for clean sands were conducted by Yoshimi and Tokimatsu (1983) by the methods (1) and (2). Fig. 5 shows the fmal results of the field tests. The results are in fairly good agreement with the previous findings by Tokimatsu and Yoshimi (1981) of which data are also replotted in the figure by using the mean values. Since all data statistically show that the SPT N-value by the cathead and rope method is greater by about 20 percent than the trip monkey method for any N-values up to 40, the following equation could, therefore, be used to correlate the relation between the two methods in Japan.
( 8)
in which cj means the cathead and rope method in Japan, and tj means the trip monkey method in Japan.
It is conceivable, on the other hand, that N-values measured by the method (3) with
special caution would produce the same values as those by the trip monkey method. Eq. (8) is consistent with the findings by Nishizawa et al (1980) in which the ratio of the net energy delivered to the rod to the theoretical maximum is 0. 63 to 0. 72 for the cathead and rope method and 0. 8 to 0. 9 for the free fall type method.
Since the ratio of the net energy in the U.S. A. was estimated to be about 0. 5 to 0. 6 by Kovacs and Salomone (1982), the following relation is assumed for interpreting SPT N-values from foreign countries.
Ncf = 1. 4 NtJ ( 9 ) in which cf means the cathead and rope method in foreign countries.
Normalized SPT N-value
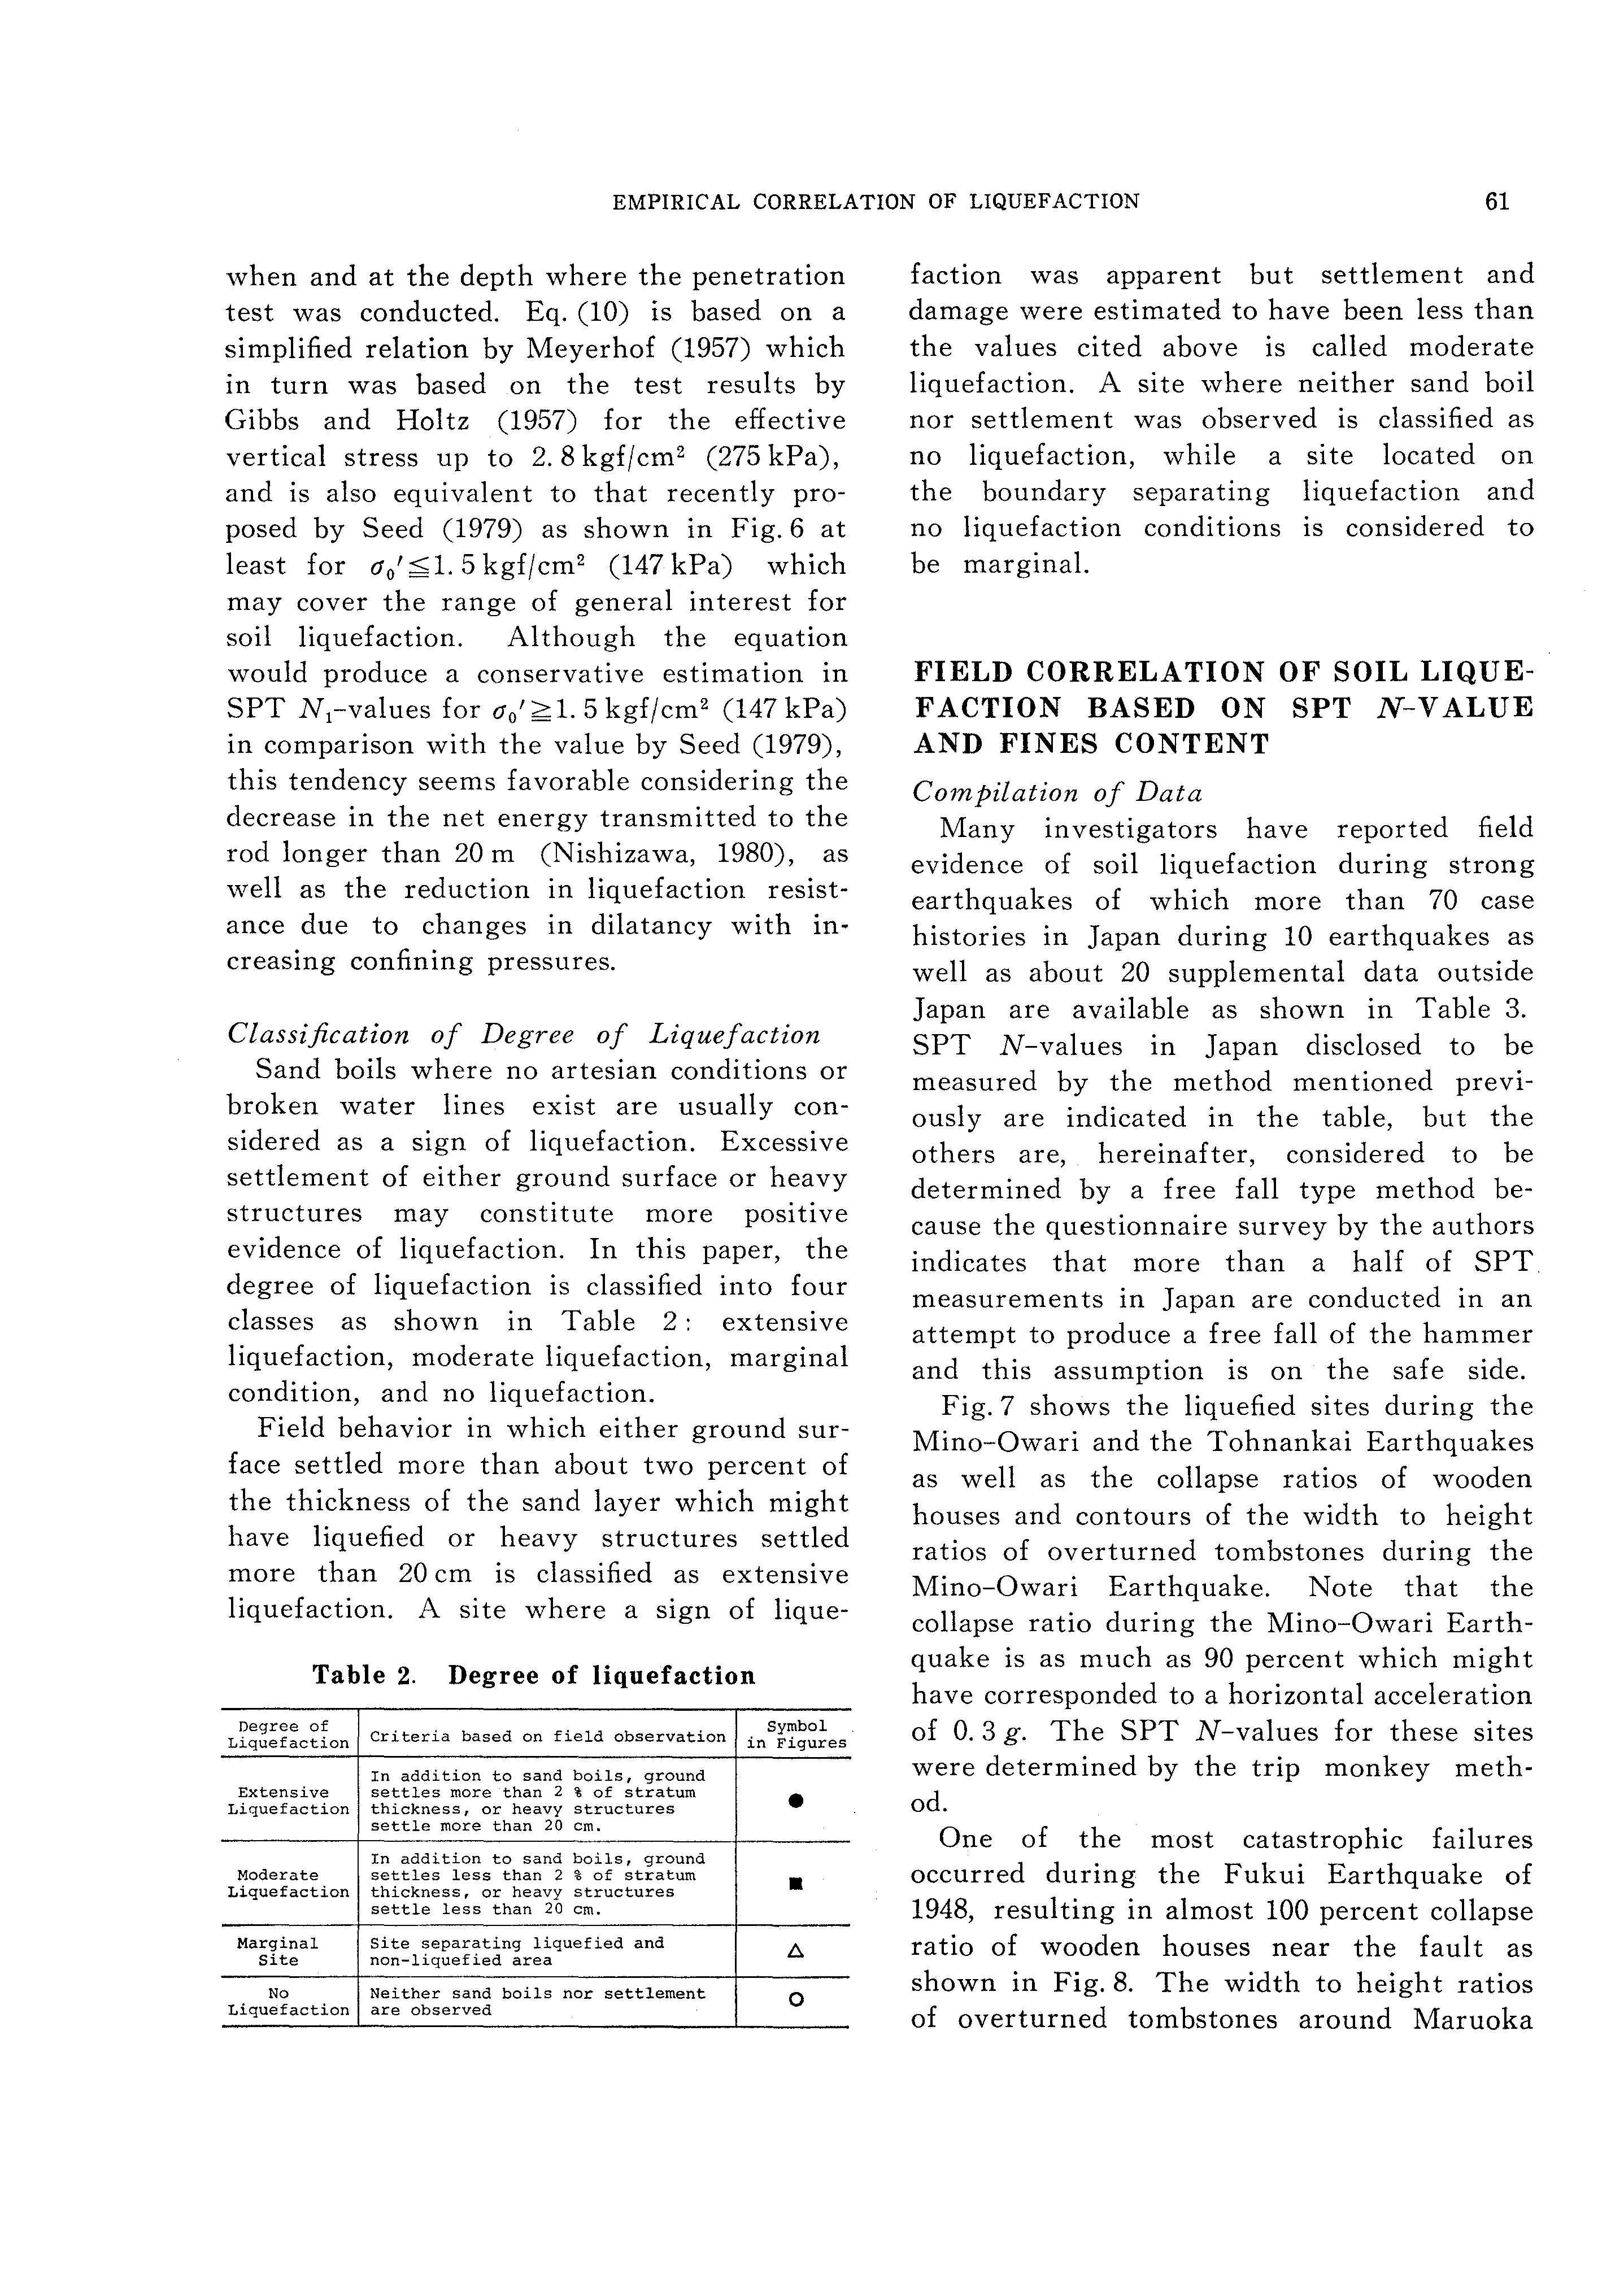
Since it is well known that the SPT N-values are influenced by the effective confining pressure in the soil as well as the soil density which may reflect the undrained strength of the soil, corrected SPT N-values for a reference confining pressure have occasionally been used for practical purposes (Seed, 1979). The SPT N-values normalized for a 0 '=1kgf/cm 2 (98kPa), N 1, which is adopted hereafter, may be approximately g1ven by
=C N=_l.J---N 1 N 0" 0 '+0.7 (10) m which C N is a function of the effective vertical stress, a 0 ', in kgf/cm 2 , at the time
Fig. 6. Correction factor CN for SPT Nvalues in terms of effective vertical stress
when and at the depth where the penetration test was conducted. Eq. (10) is based on a simplified relation by Meyerhof (1957) which in turn was based on the test results by Gibbs and Holtz (1957) for the effective vertical stress up to 2. 8 kgf/cm 2 (275 kPa), and is also equivalent to that recently proposed by Seed (1979) as shown in Fig. 6 at least for (147kPa) which may cover the range of general interest for soil liquefaction. Although the equation would produce a conservative estimation in SPT N 1-values for 5 kgf/cm 2 (147 kPa) in comparison with the value by Seed (1979), this tendency seems favorable considering the decrease in the net energy transmitted to the rod longer than 20m (Nishizawa, 1980), as well as the reduction in liquefaction resistance due to changes in dilatancy with in· creasing confining pressures.
Classification of Degree of Liquefaction
Sand boils where no artesian conditions or broken water lines exist are usually considered as a sign of liquefaction. Excessive settlement of either ground surface or heavy structures may constitute more positive evidence of liquefaction. In this paper, the degree of liquefaction is classified in to four classes as shown in Table 2: extensive liquefaction, moderate liquefaction, marginal condition, and no liquefaction.
Field behavior in which either ground surface settled more than about two percent of the thickness of the sand layer which might have liquefied or heavy structures settled more than 20 em is classified as extensive liquefaction. A site where a sign of lique-
Table 2. Degree of liquefaction
Degree of Criteria based on field observation Symbol Liquefaction in Figures
In addition to sand boils, ground Extensive settles more than 2 % of stratum • Liquefaction thickness, or heavy structures settle more than 20 em.
In addition to sand boils, ground Moderate settles less than 2 % of stratum • Liquefaction thickness, or heavy structures settle less than 20 em.
Marginal Site separating liquefied and D. Site non-liquefied area
No Neither sand boils nor settlement 0 Liquefaction are observed
faction was apparent but settlement and damage were estimated to have been less than the values cited above is called moderate liquefaction. A site where neither sand boil nor settlement was observed is classified as no liquefaction, while a site located on the boundary separating liquefaction and no liquefaction conditions is considered to be marginal.
FIELD CORRELATION OF SOIL LIQUEFACTION BASED ON SPT N-VALUE AND FINES CONTENT
Compilation of Data
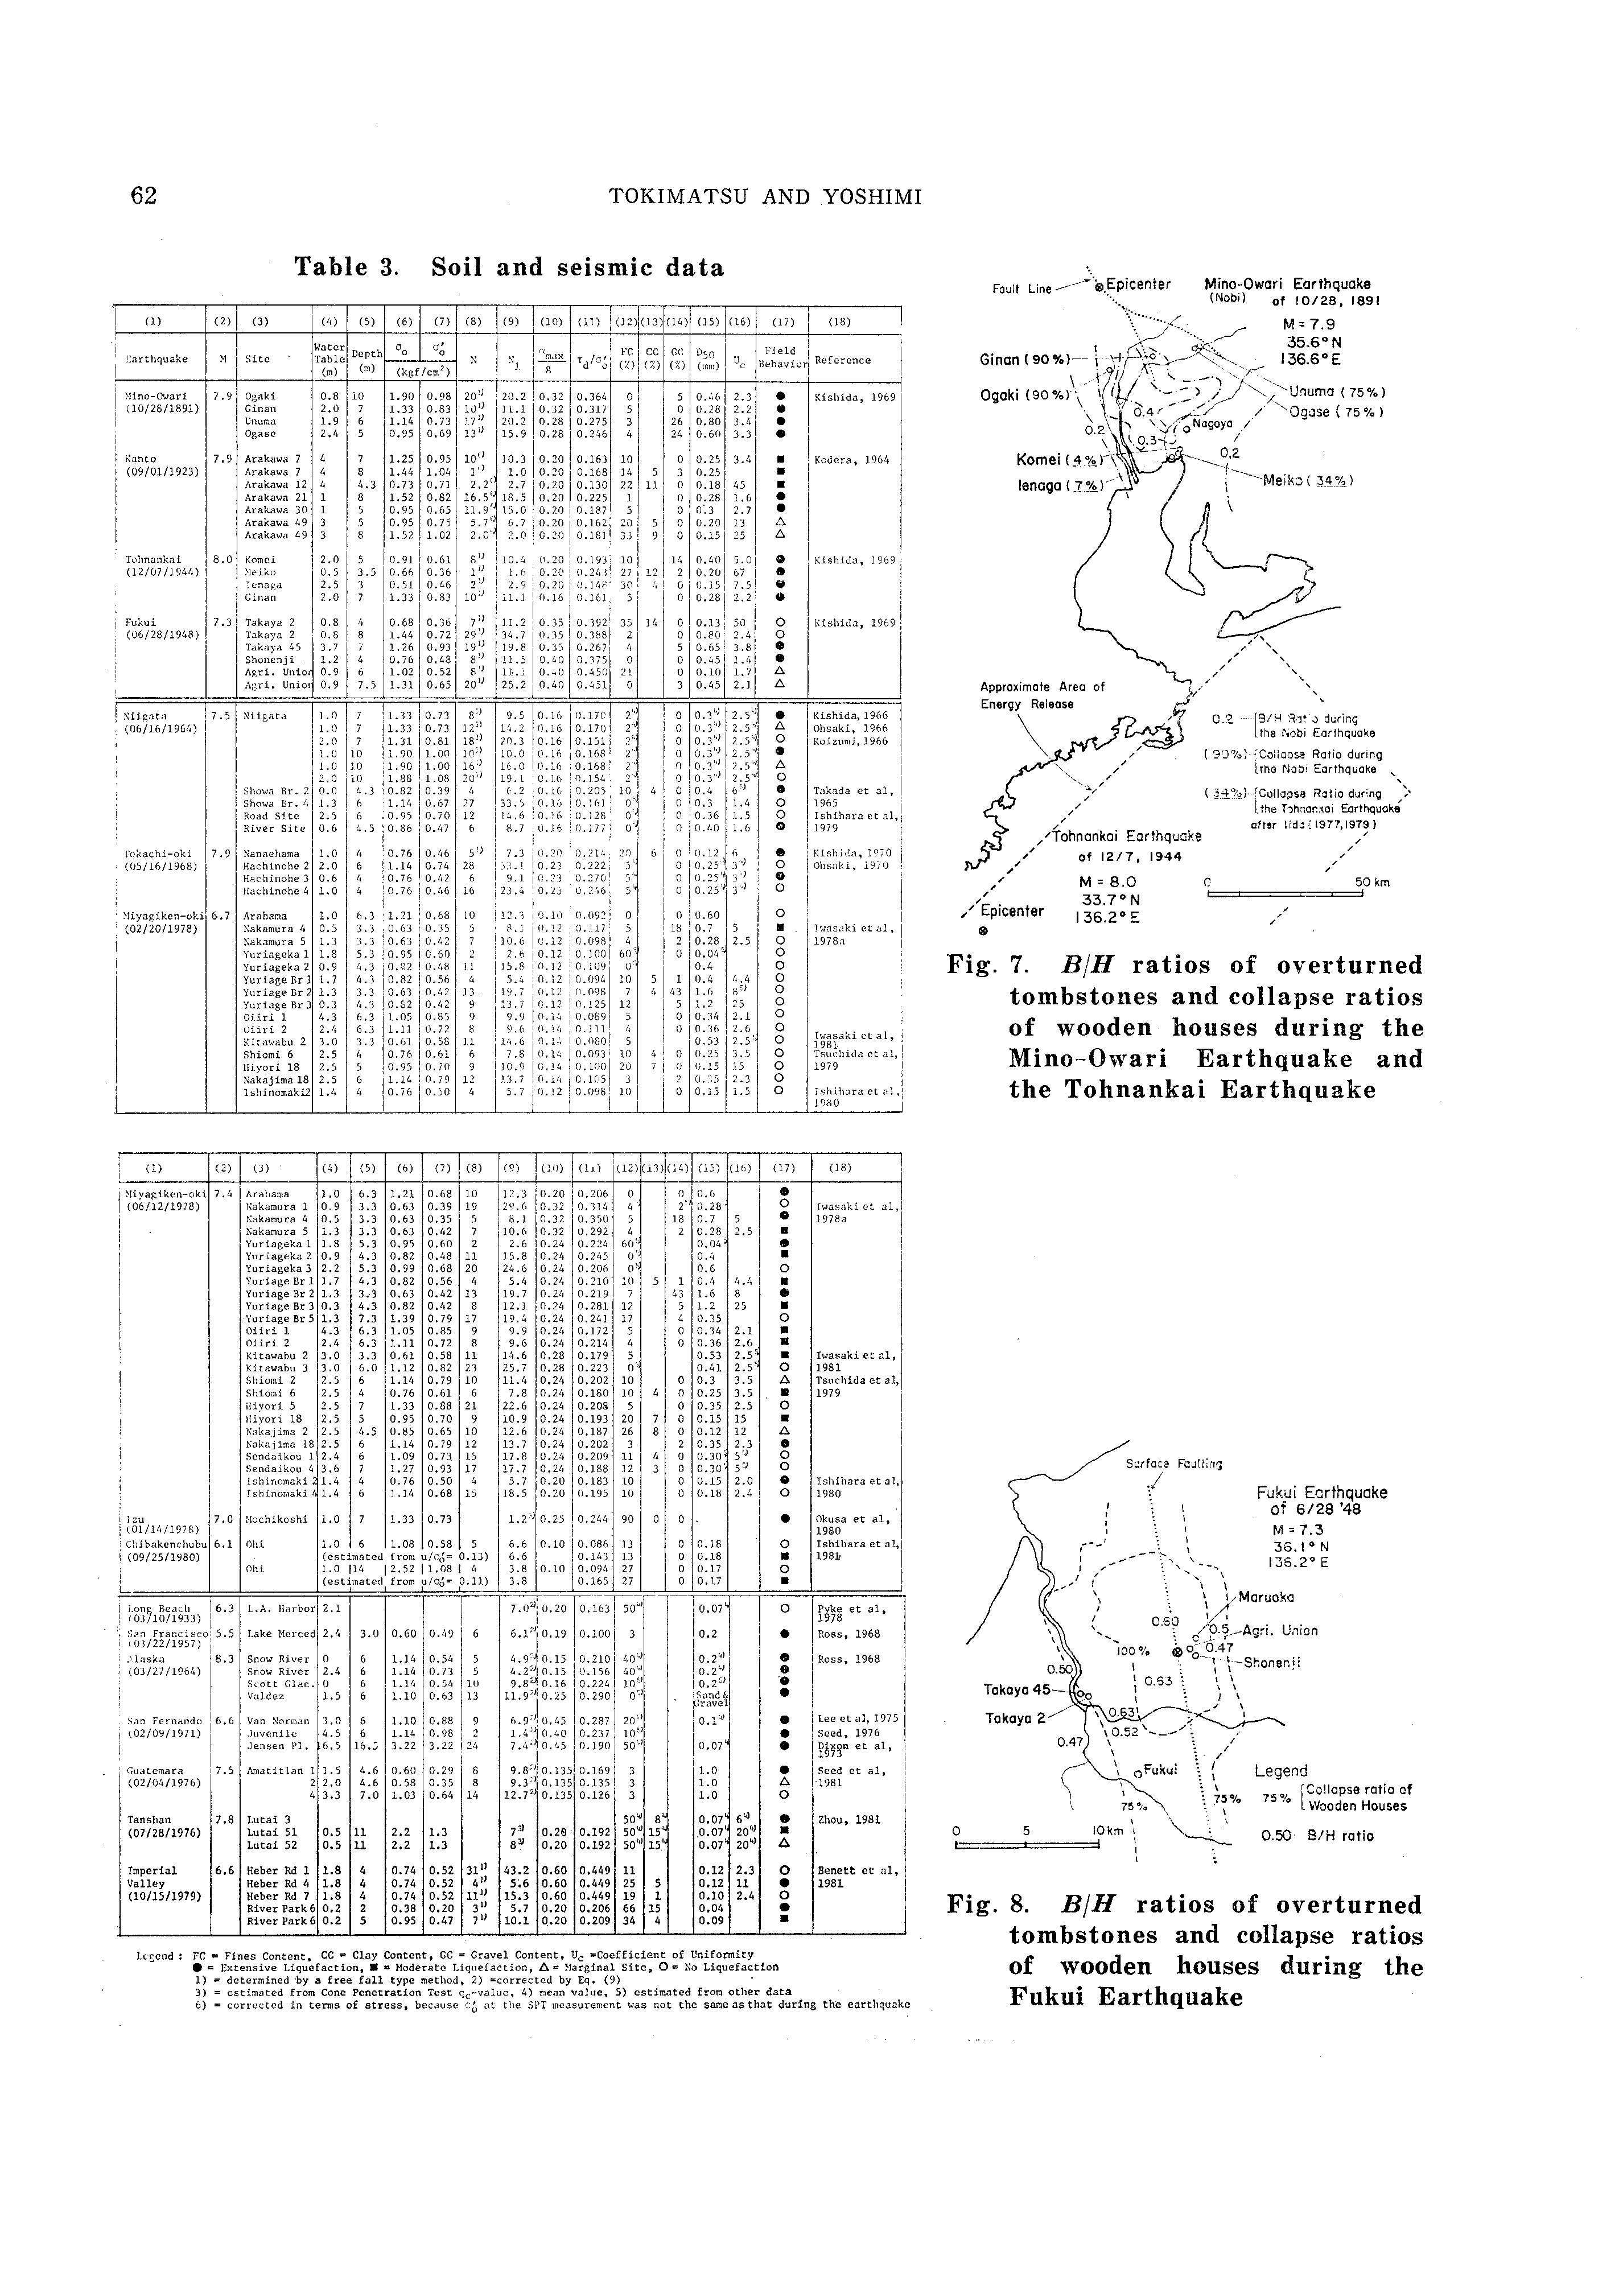
Many investigators have reported field evidence of soil liquefaction during strong earthquakes of which more than 70 case histories in Japan during 10 earthquakes as well as about 20 supplemental data outside Japan are available as shown in Table 3. SPT N-values in Japan disclosed to be measured by the method mentioned previously are indicated in the table, but the others are, hereinafter, considered to be determined by a free fall type method because the questionnaire survey by the authors indicates that more than a half of SPT measurements in Japan are conducted in an attempt to produce a free fall of the hammer and this assumption is on the safe side. Fig. 7 shows the liquefied sites during the Mino-Owari and the Tohnankai Earthquakes as well as the collapse ratios of wooden houses and contours of the width to height ratios of overturned tombstones during the Mino-Owari Earthquake. Note that the collapse ratio during the Mino-Owari Earthquake is as much as 90 percent which might have corresponded to a horizontal acceleration of 0. 3 g. The SPT N-values for these sites were determined by the trip monkey method
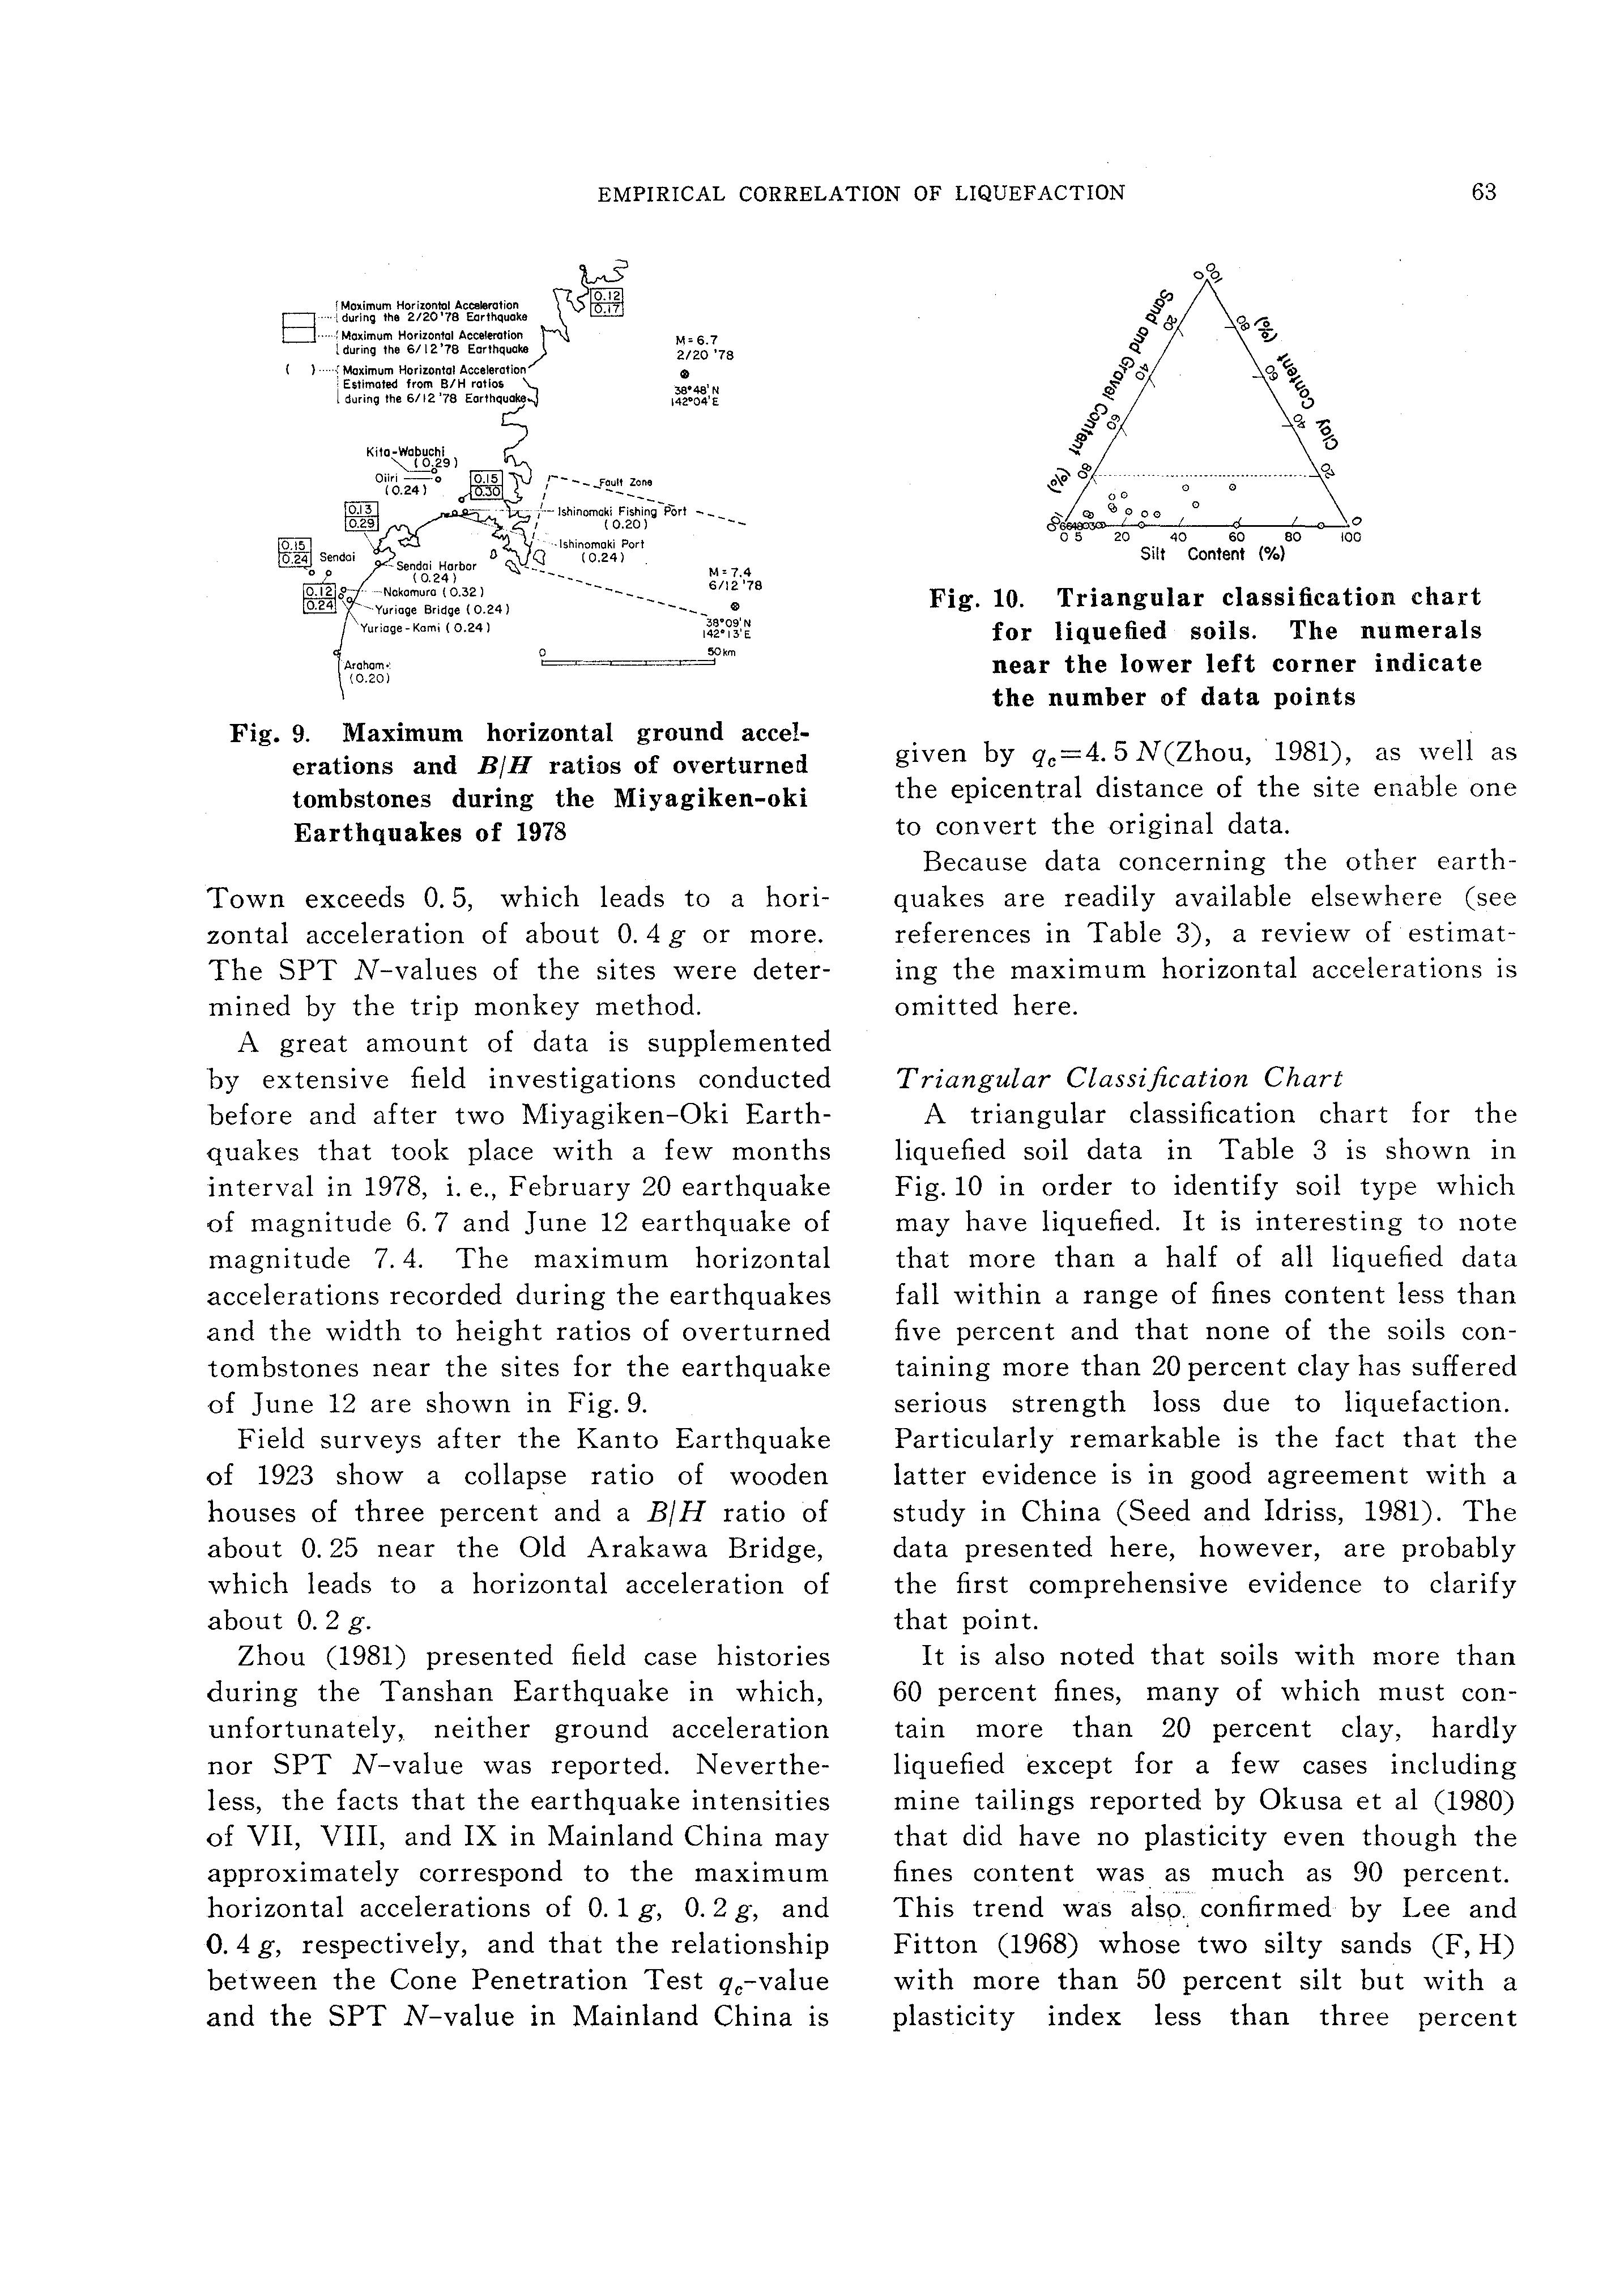
One of the most catastrophic failures occurred during the Fukui Earthquake of 1948, resulting in almost 100 percent collapse ratio of wooden houses near the fault as shown in Fig. 8. The width to height ratios of overturned tombstones around Maruoka
'lzu !tOl/14/1978) Clljbakcnchubu 6.1 1(09/25/1')80) Tanshan
(07/28/1976)
Table 3.
TOKIMATSU AND YOSHIMI
Soil and seismic data
Fig. 7. BjH ratios of overturned tombstones and collapse ratios of wooden houses during the Mino-Owari Earthquake and the Tohnankai Earthquake
Fig. 8. BjH ratios of overturned tombstones and collapse ratios of wooden houses during the
Fig. 9. Maximum horizontal ground accelerations and B/H ratios of overturned tombstones during the Miyagiken-oki Earthquakes of 1978
Town exceeds 0. 5, which leads to a horizontal acceleration of about 0. 4 g or more. The SPT N-values of the sites were determined by the trip monkey method.
A great amount of data is supplemented by extensive field investigations conducted before and after two Miyagiken-Oki Earthquakes that took place with a few months interval in 1978, i.e., February 20 earthquake of magnitude 6. 7 and June 12 earthquake of magnitude 7. 4. The maximum horizontal accelerations recorded during the earthquakes and the width to height ratios of overturned tombstones near the sites for the earthquake of June 12 are shown in Fig. 9.
Field surveys after the Kanto Earthquake of 1923 show a collapse ratio of wooden houses of three percent and a B/ H ratio of about 0. 25 near the Old Arakawa Bridge, which leads to a horizontal acceleration of about 0. 2 g.
Zhou (1981) presented field case histories during the Tanshan Earthquake in which, unfortunately, neither ground acceleration nor SPT N-value was reported. Nevertheless, the facts that the earthquake intensities of VII, VIII, and IX in Mainland China may approximately correspond to the maximum horizontal accelerations of 0. 1 g, 0. 2 g, and 0. 4 g, respectively, and that the relationship between the Cone Penetration Test qc-value and the SPT N-value in Mainland China is
Fig. 10. Triangular classification chart for liquefied soils. The numerals near the lower left corner indicate the number of data points given by qc=4. 5 N(Zhou, ·1981), as well as the epicentral distance of the site enable one to con vert the original data.
Because data concerning the other earthquakes are readily available elsewhere (see references in Table 3), a review of estimating the maximum horizontal accelerations is omitted here.
Triangular Classification Chart
A triangular classification chart for the liquefied soil data in Table 3 is shown in Fig. 10 in order to identify soil type which may have liquefied. It is interesting to note that more than a half of all liquefied data fall within a range of fines content less than five percent and that none of the soils containing more than 20 percent clay has suffered serious strength loss due to liquefaction. Particularly remarkable is the fact that the latter evidence is in good agreement with a study in China (Seed and Idriss, 1981). The data presented here, however, are probably the first comprehensive evidence to clarify that point.
It is also noted that soils with more than 60 percent fines, many of which must contain more than 20 percent clay, hardly liquefied except for a few cases including mine tailings reported by Okusa et al (1980) that did have no plasticity even though the fines content was. as much as 90 percent. This trend was alsp._ confirmed by Lee and Fitton (1968) whose two silty sands (F, H) with more than 50 percent silt but with a plasticity index less than three percent
TOKIMATSU AND YOSHIMI
showed low liquefaction resistance compared with a sandy silt (G) which had a plasticity index of 17. According to a study in Mainland China (Finn, 1982), plasticity index of 10 seems to be the threshold for liquefaction. Even though more field evidence is needed to clarify this point, it is conceivable that the plasticity index could be a promising index for estimating liquefaction resistance of silty soils, considering the fact that it is more reliable yet easier to determine than clay content.
Relationship Between Stress Ratio and SPT Ncvalue
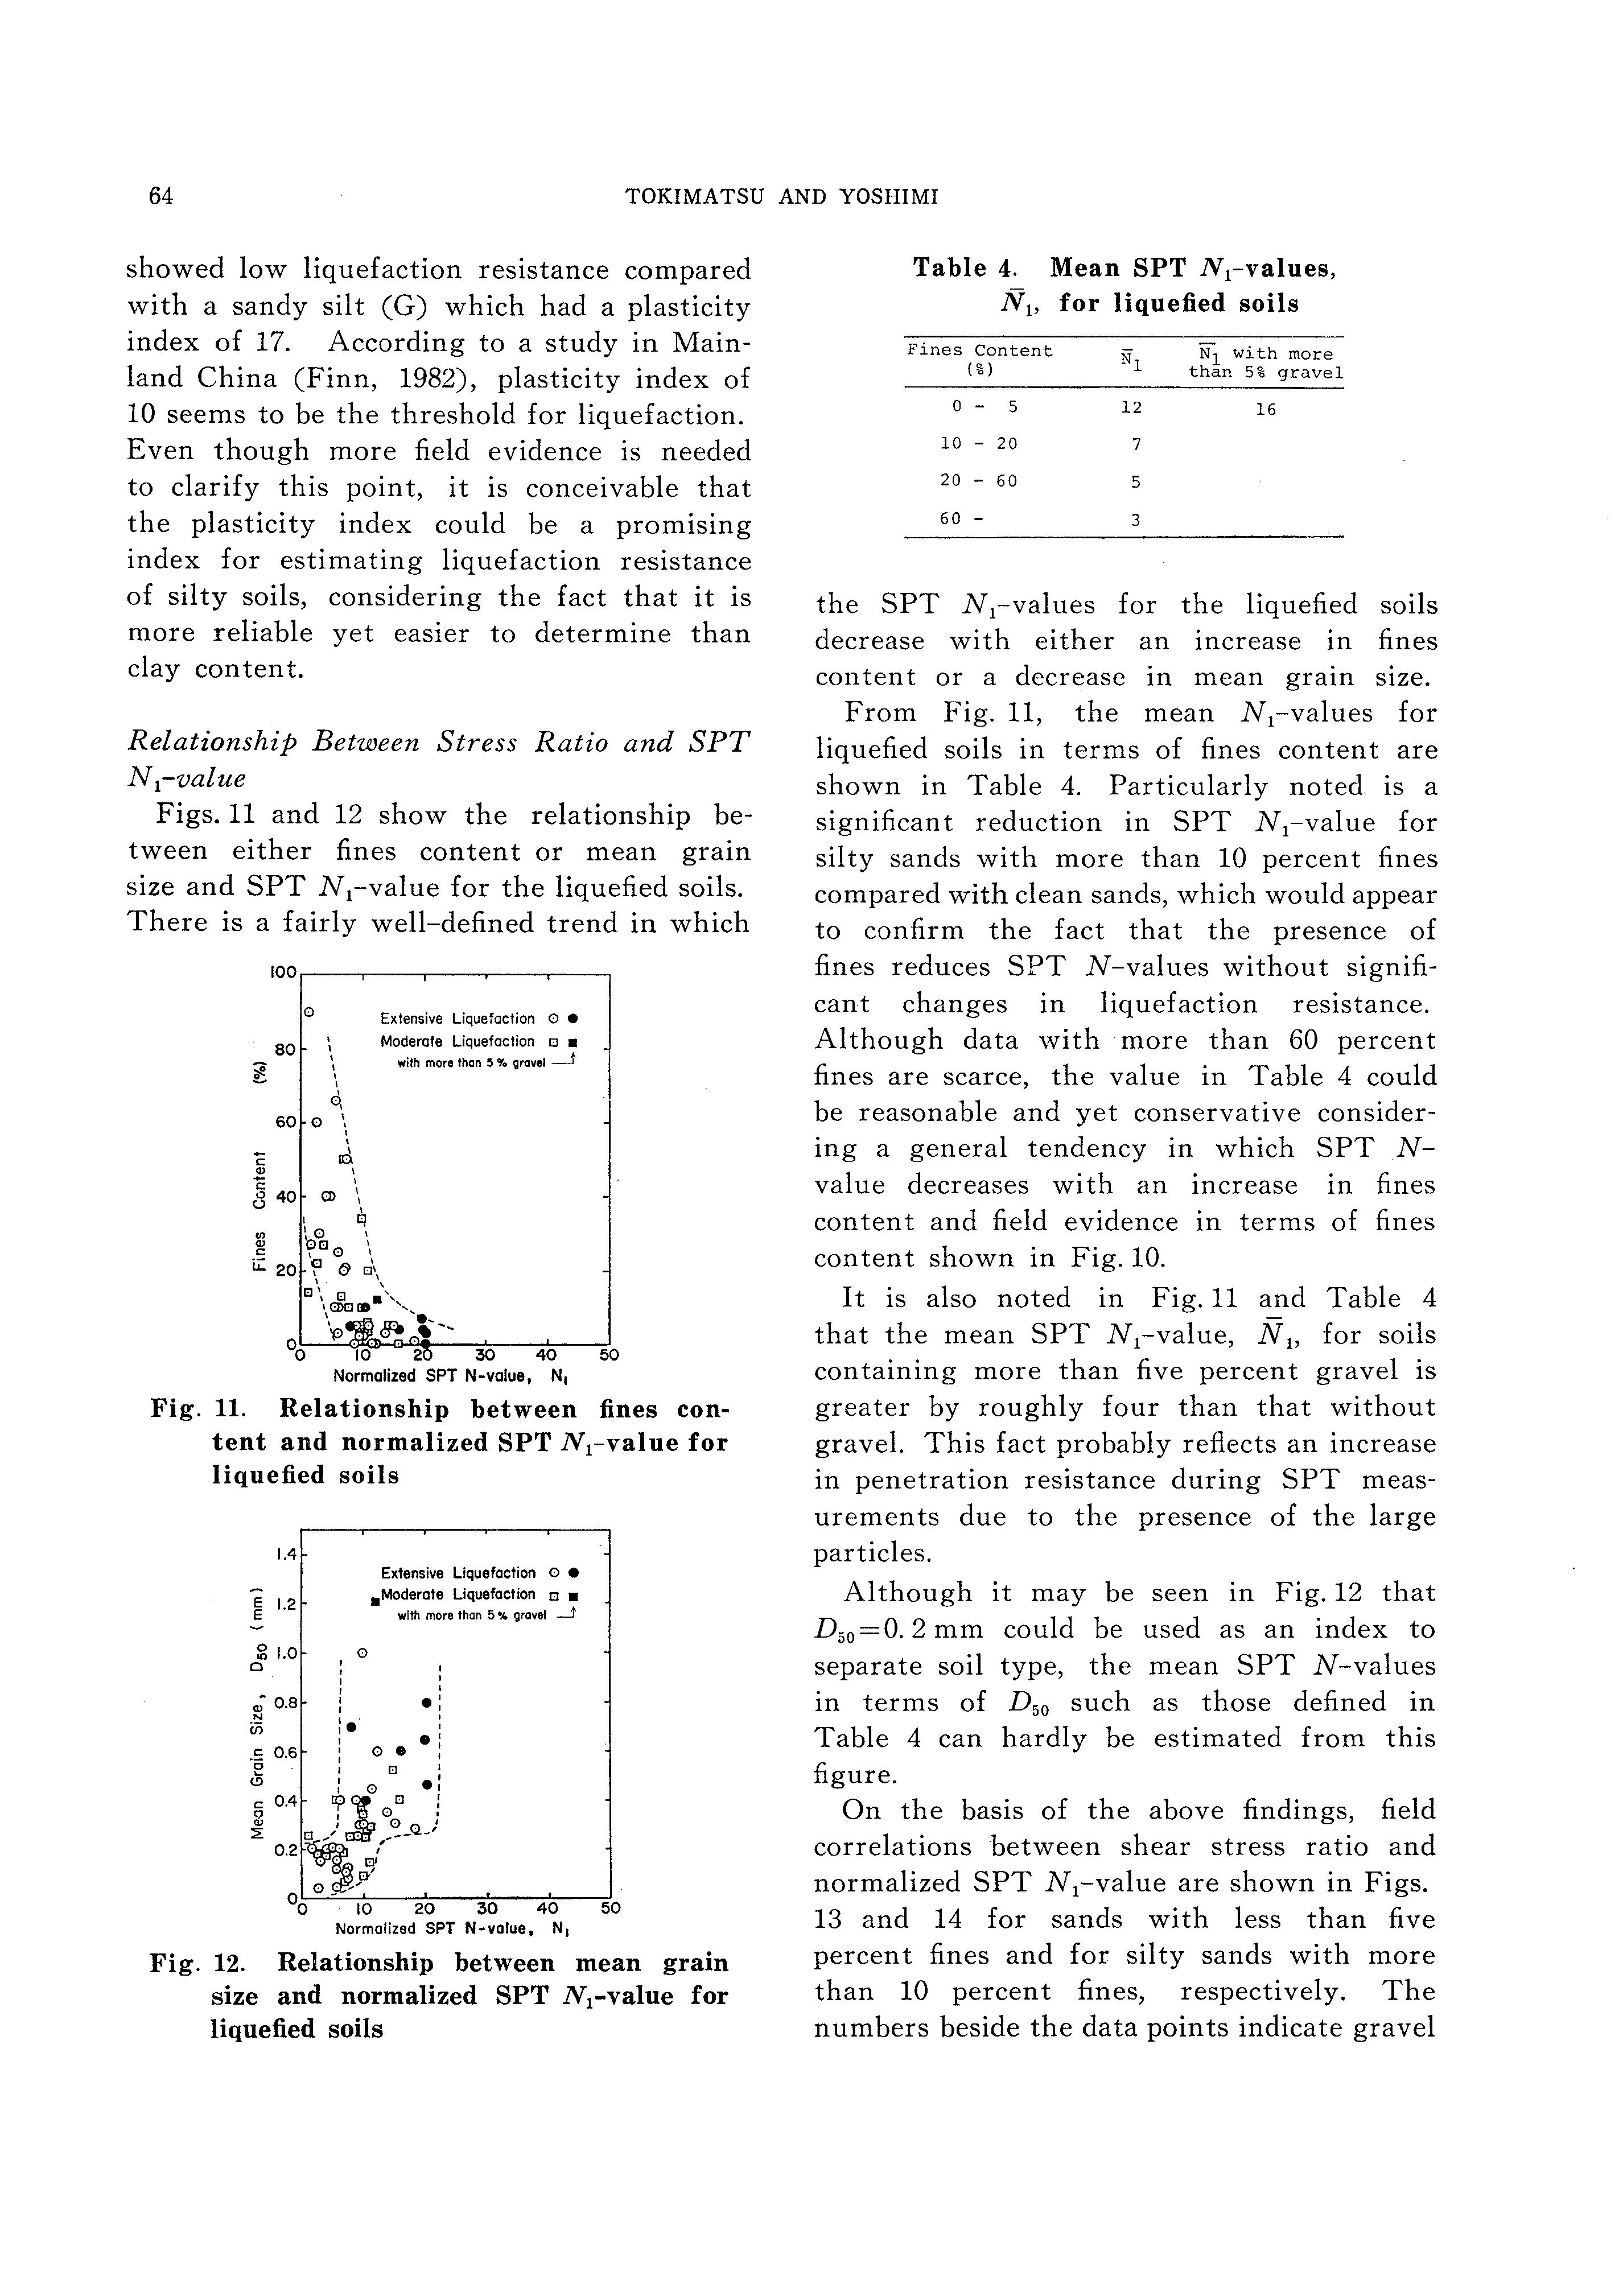
Figs. 11 and 12 show the relationship between either fines content or mean grain size and SPT N 1-value for the liquefied soils. There is a fairly well-defined trend in which
Fig. 11. Relationship between fines content and normalized SPT Ncvalue for liquefied soils
N 1
Fig. 12. Relationship between mean grain size and normalized SPT N 1-value for liquefied soils
Table 4. Mean SPT Ncvalues, N 1, for liquefied soils
Fines Content (%) 0 - 5 12 10 - 20 7 20 - 60 5 60N1
the SPT N 1-values for the liquefied soils decrease with either an increase in fines content or a decrease in mean grain size.
From Fig. 11, the mean N 1-values for liquefied soils in terms of fines content are shown in Table 4. Particularly noted. is a significant reduction in SPT N 1-value for silty sands with more than 10 percent fines compared with clean sands, which would appear to confirm the fact that the presence of fines reduces SPT N-values without significant changes in liquefaction resistance. Although data with more than 60 percent fines are scarce, the value in Table 4 could be reasonable and yet conservative considering a general tendency in which SPT Nval ue decreases with an increase in fines content and field evidence in terms of fines content shown in Fig. 10.
It is also noted in Fig. 11 and Table 4 that the mean SPT Ncvalue, N 1, for soils containing more than five percent gravel is greater by roughly four than that without gravel. This fact probably reflects an increase in penetration resistance during SPT measurements due to the presence of the large particles.
Although it may be seen in Fig. 12 that D 50 = 0. 2 mm could be used as an index to separate soil type, the mean SPT N-values in terms of D 50 such as those defined in Table 4 can hardly be estimated from this figure.
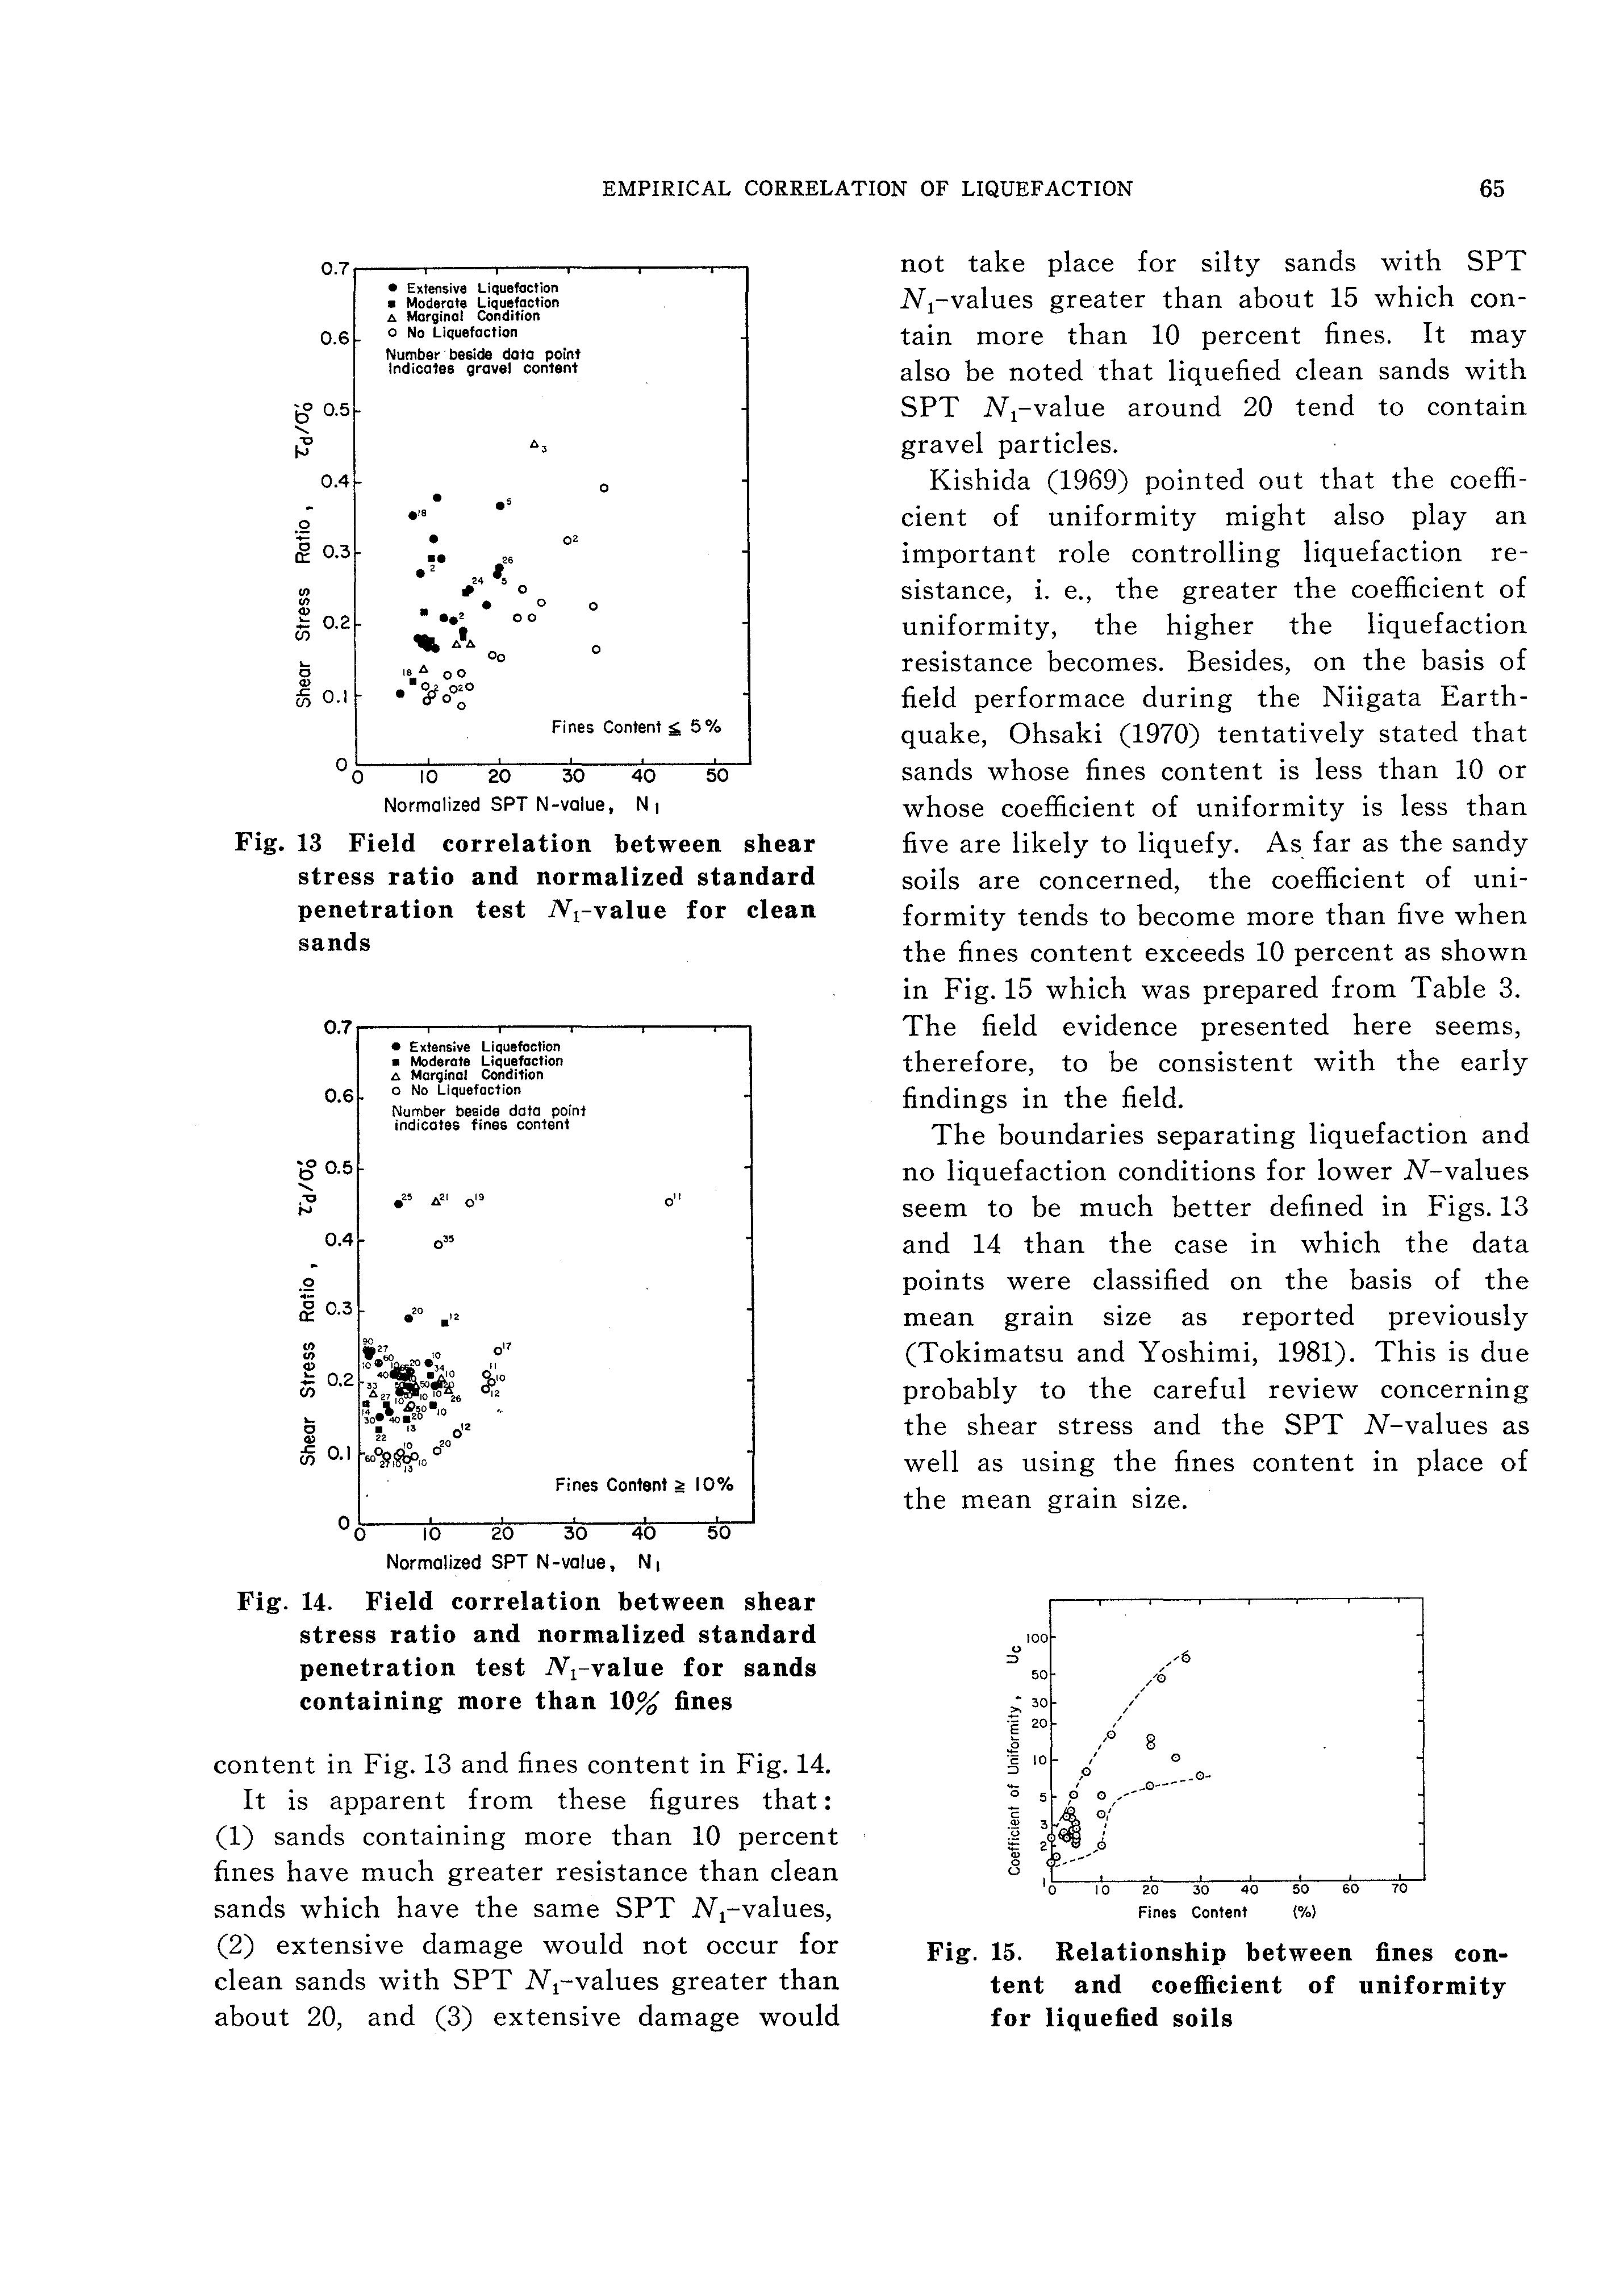
On the basis of the above findings, field correlations between shear stress ratio and normalized SPT N 1-value are shown in Figs. 13 and 14 for sands with less than five percent fines and for silty sands with more than 10 percent fines, respectively. The numbers beside the data points indicate gravel
EMPIRICAL CORRELATION OF LIQUEFACTION
not take place for silty sands with SPT N 1-values greater than about 15 which contain more than 10 percent fines. It may also be noted that liquefied clean sands with SPT N 1-value around 20 tend to contain gravel particles.
SPT N-value, N 1
Fig. 13 Field correlation between shear stress ratio and normalized standard penetration test N 1-value for clean sands
Kishida (1969) pointed out that the coefficient of uniformity might also play an important role controlling liquefaction resistance, i. e., the greater the coefficient of uniformity, the higher the liquefaction resistance becomes. Besides, on the basis of field performace during the Niigata Earthquake, Ohsaki (1970) tentatively stated that sands whose fines content is less than 10 or whose coefficient of uniformity is less than five are likely to liquefy. As far as the sandy soils are concerned, the coefficient of uniformity tends to become more than five when the fines content exceeds 10 percent as shown in Fig. 15 which was prepared from Table 3. The field evidence presented here seems, therefore, to be consistent with the early findings in the field.
0.4
Normalized SPT N -value, N 1
Fig. 14. Field correlation between shear stress ratio and normalized standard penetration test Ncvalue for sands containing more than 10% fines
content in Fig. 13 and fines content in Fig. 14. It is apparent from these figures that: (1) sands containing more than 10 percent fines have much greater resistance than clean sands which have the same SPT Ncvalues, (2) extensive damage would not occur for clean sands with SPT Ncvalues greater than about 20, and (3) extensive damage would
The boundaries separating liquefaction and no liquefaction conditions for lower N-values seem to be much better defined in Figs. 13 and 14 than the case in which the data points were classified on the basis of the mean grain size as reported previously (Tokimatsu and Yoshimi, 1981). This is due probably to the careful review concerning the shear stress and the SPT N-values as well as using the fines content in place of the mean grain size.
Fig. 15. Relationship between fines content and coefficient of uniformity for liquefied soils
TOKIMATSU AND YOSHIMI
COMPARISON WITH LABORATORY 'TEST RESULTS
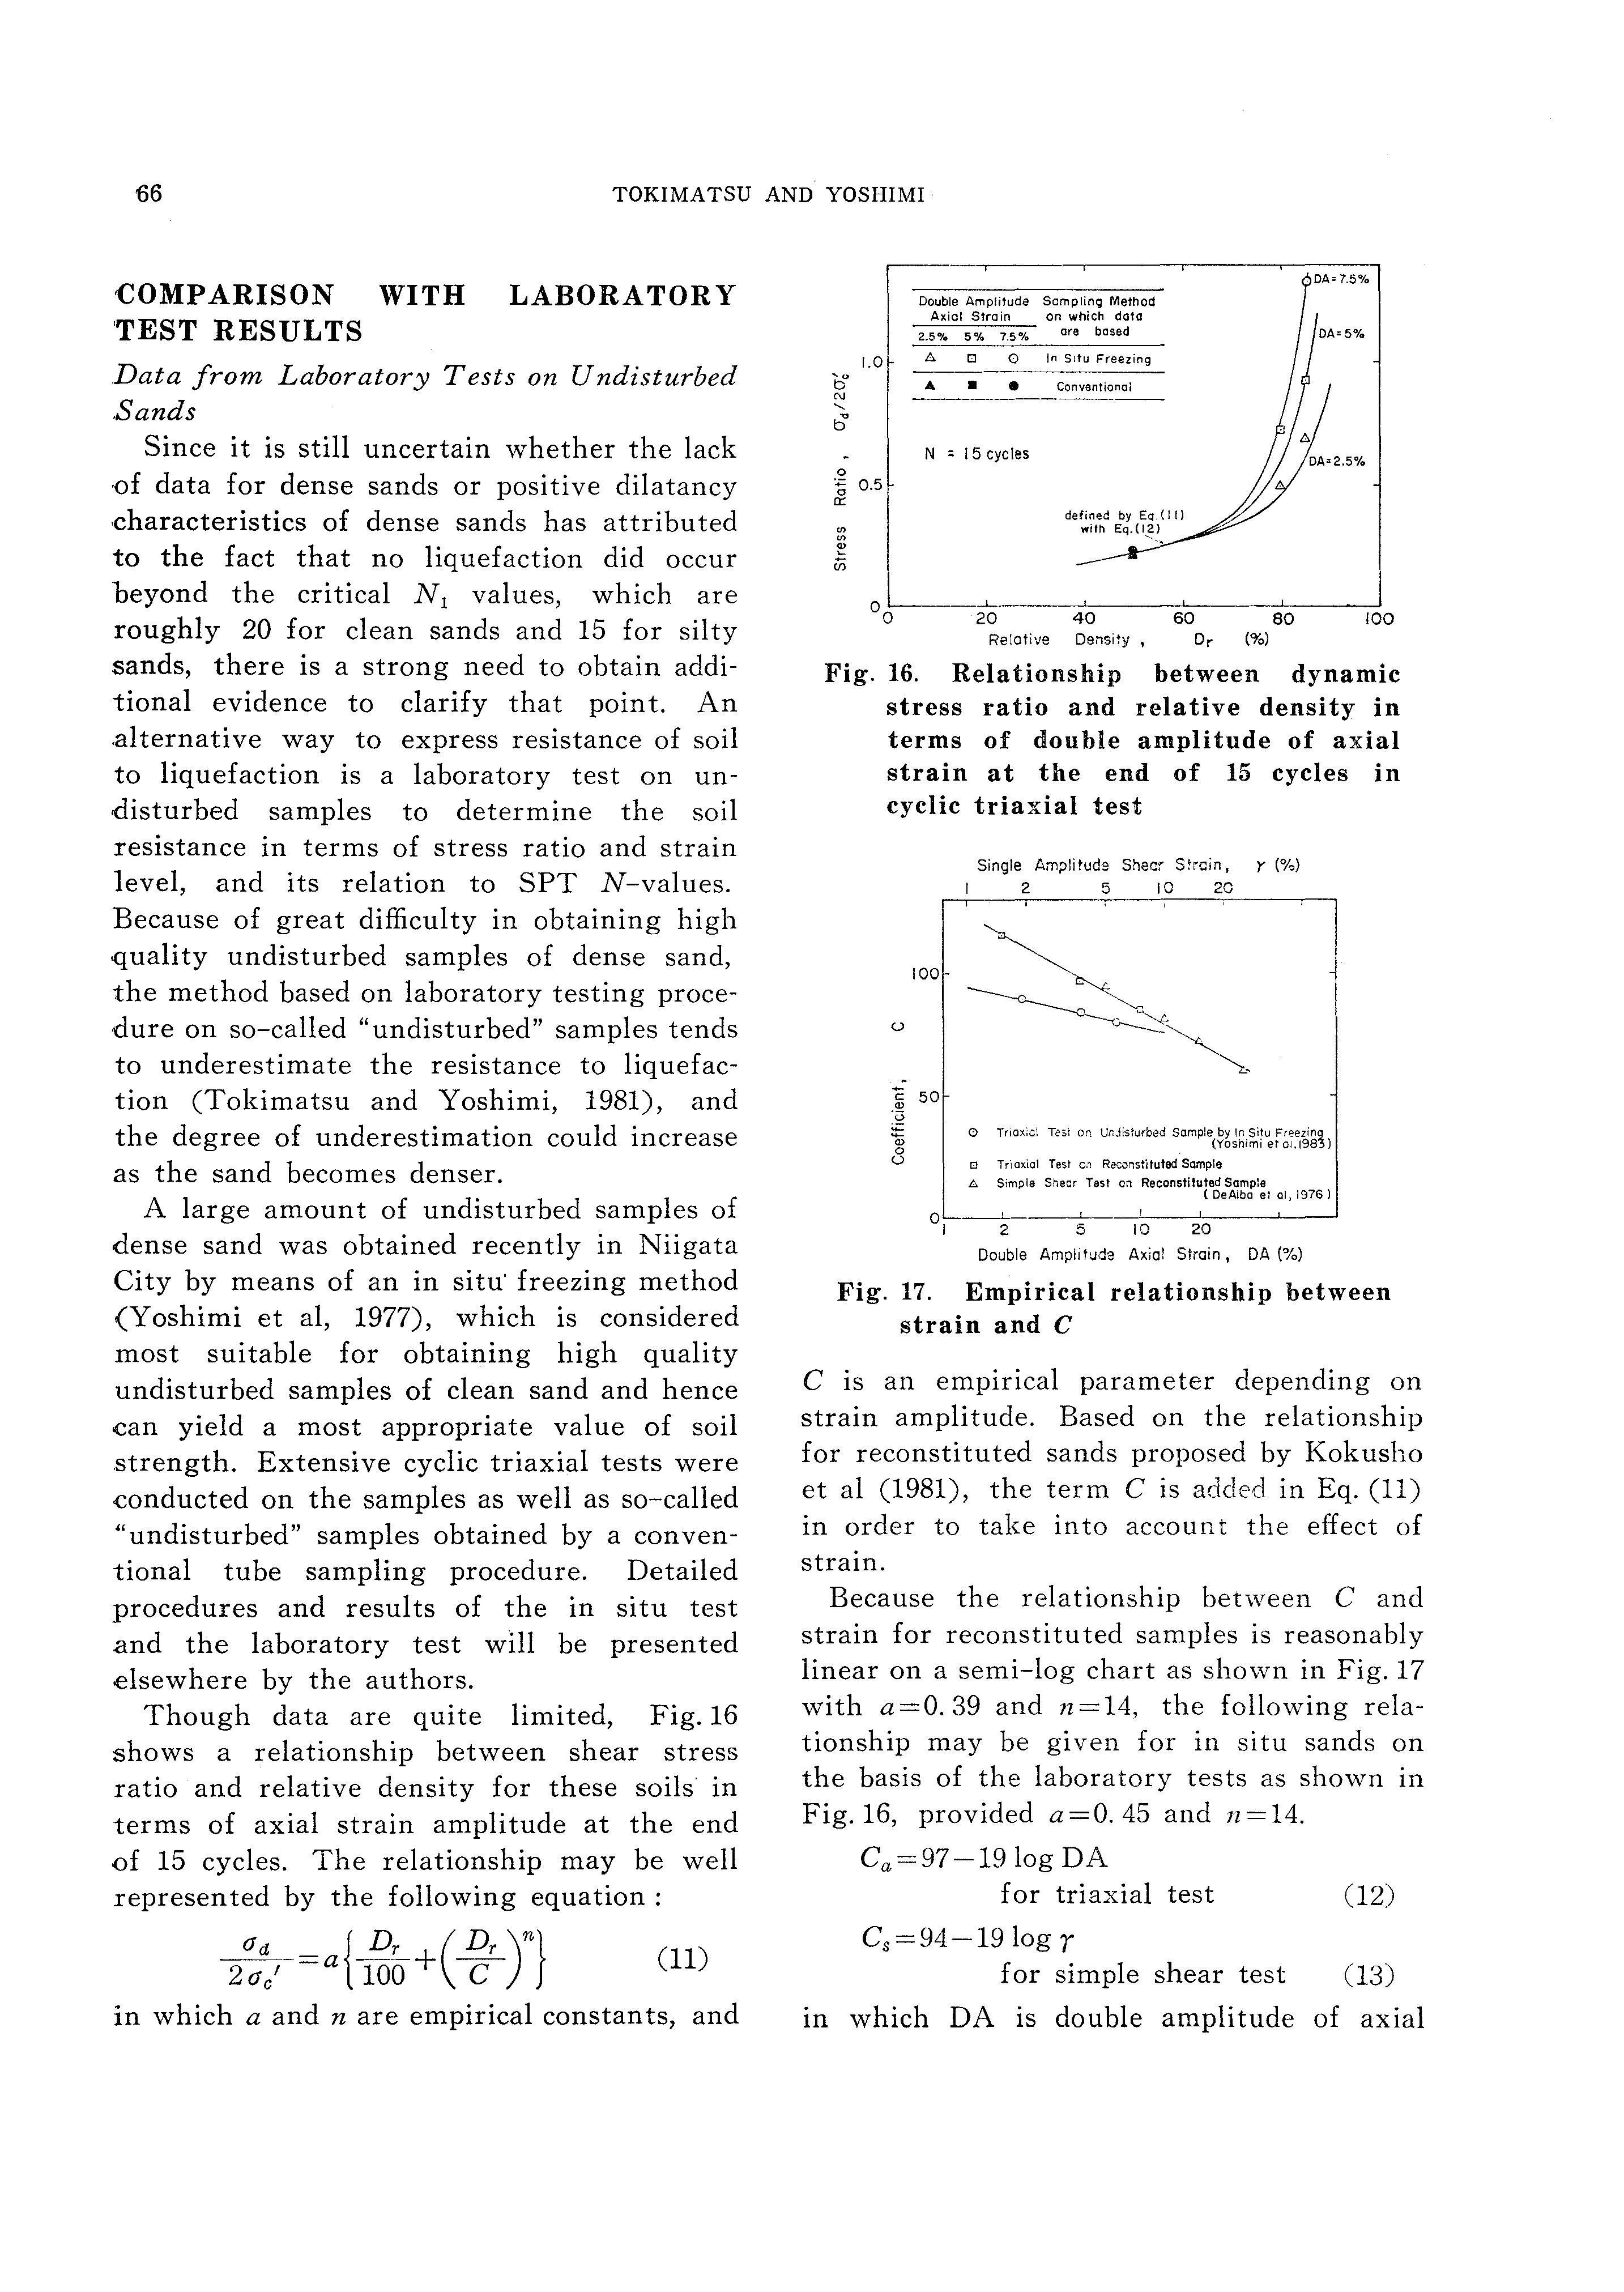
Data from Laboratory Tests on Undisturbed Sands
Since it is still uncertain whether the lack ·of data for dense sands or positive dilatancy ·characteristics of dense sands has attributed to the fact that no liquefaction did occur beyond the critical N 1 values, which are roughly 20 for clean sands and 15 for silty sands, there is a strong need to obtain additional evidence to clarify that point. An .alternative way to express resistance of soil to liquefaction is a laboratory test on undisturbed samples to determine the soil resistance in terms of stress ratio and strain level, and its relation to SPT N-values. Because of great difficulty in obtaining high ·quality undisturbed samples of dense sand, the method based on laboratory testing procedure on so-called "undisturbed" samples tends to underestimate the resistance to liquefaction (Tokimatsu and Yoshimi, 1981), and the degree of underestimation could increase as the sand becomes denser.
A large amount of undisturbed samples of dense sand was obtained recently in Niigata City by means of an in situ' freezing method (Yoshimi et al, 1977), which is considered most suitable for obtaining high quality undisturbed samples of clean sand and hence can yield a most appropriate value of soil strength. Extensive cyclic triaxial tests were conducted on the samples as well as so-called "undisturbed" samples obtained by a conventional tube sampling procedure. Detailed procedures and results of the in situ test .and the laboratory test will be presented .elsewhere by the authors.
Though data are quite limited, Fig. 16 shows a relationship between shear stress ratio and relative density for these soils in terms of axial strain amplitude at the end of 15 cycles. The relationship may be well represented by the following equation:
in which a and n are empirical constants, and
Fig. 16. Relationship between dynamic stress ratio and relative density in terms of double amplitude of axial strain at the end of 15 cycles in cyclic triaxial test
Double Amplitude Axial Strain, DA (%)
Fig. 17. Empirical relationship between strain and C
C is an empirical parameter depending on strain amplitude. Based on the relationship for reconstituted sands proposed by Kokusho et al (1981), the term C is added in Eq. (11) in order to take in to account the effect of strain.
Because the relationship between C and strain for reconstituted samples is reasonably linear on a semi-log chart as shown in Fig. 17 with a=O. 39 and n=l4, the following relationship may be given for in situ sands on the basis of the laboratory tests as shown m Fig.16, provided a=O. 45 and n=l4.
Ca=97-19log DA for triaxial test (12)
Cs=94-19log r for simple shear test (13)
m which DA is double amplitude of axial
60 z -.- Averaoe Curves for Submerged Sand without Fine& - /
60 ---Relationship from Eq. (16) ;' 0 40 z f20 / 0 0 20 40 Relative Density, Dr (%) I
Fig. 18. Relationship among SPT Nvalues, relative density and effective vertical stress strain, and r is single amplitude of shear strain. Fig. 16 shows that Eq. (11) together with Eq. (12) could simulate reasonably well the relationship between stress ratio and relative density of the undisturbed clean sands.
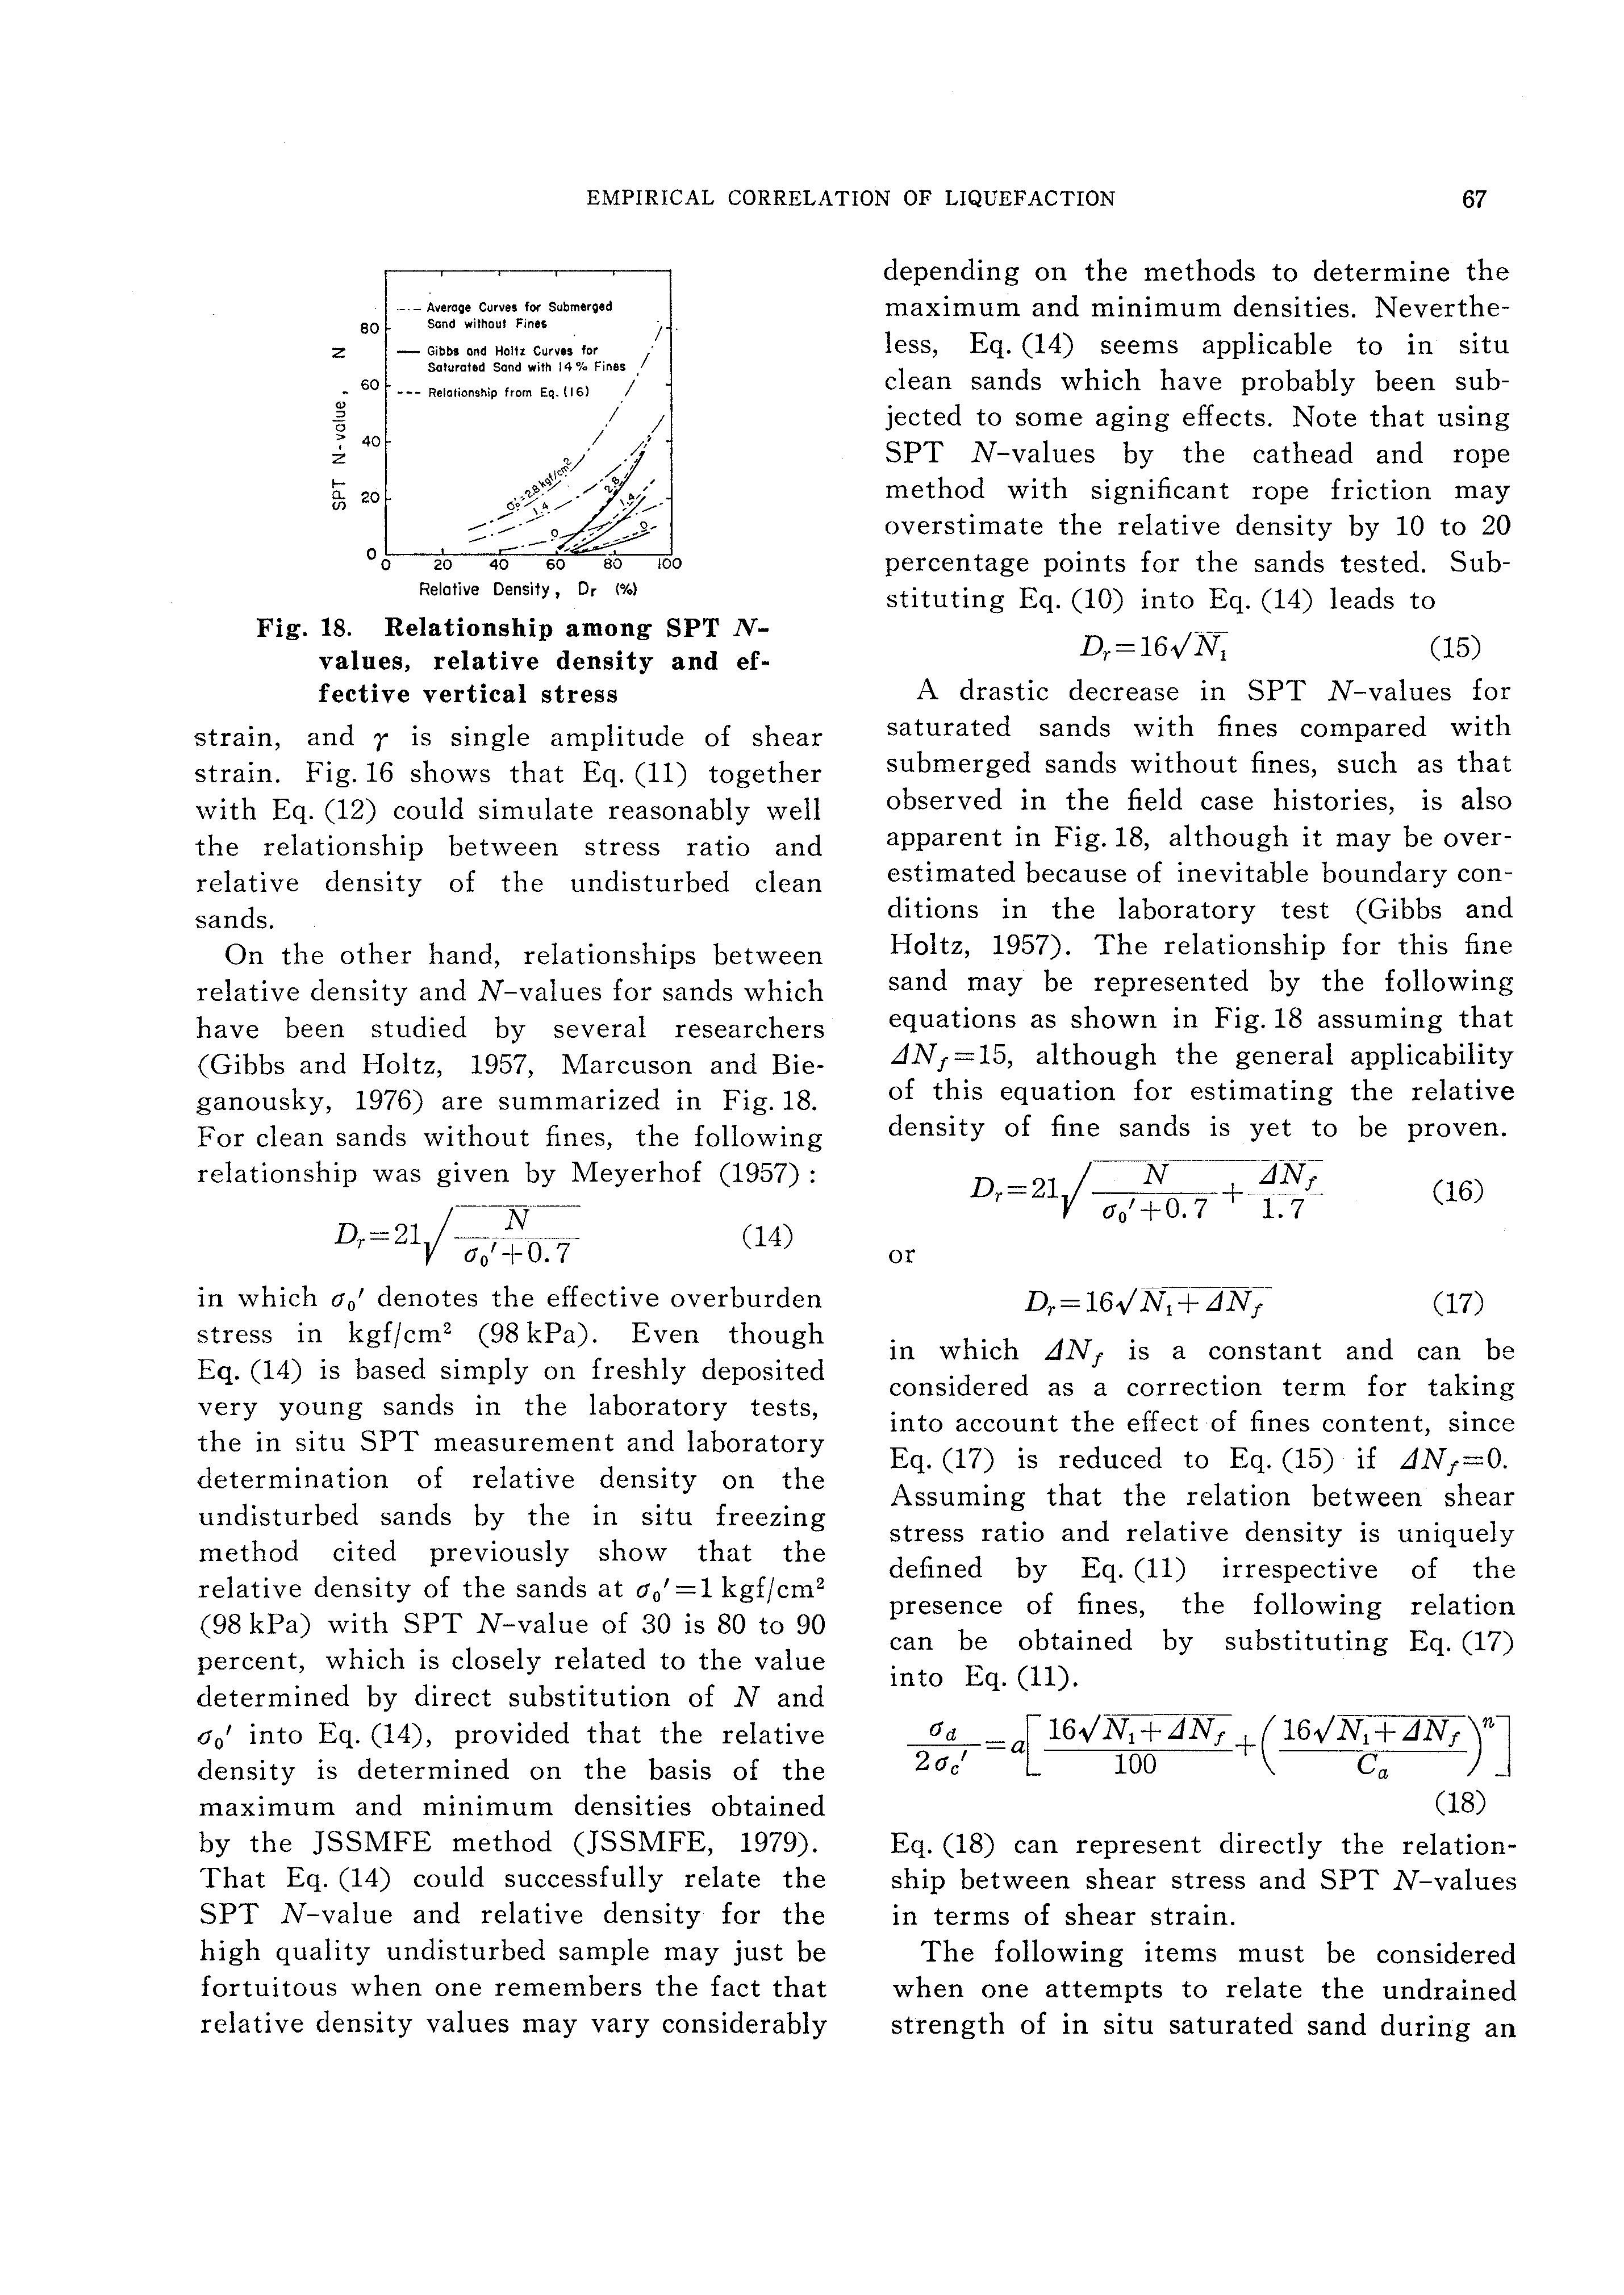
On the other hand, relationships between relative density and N-values for sands which have been studied by several researchers (Gibbs and Holtz, 1957, Marcuson and Bieganousky, 1976) are summarized in Fig. 18. For clean sands without fines, the following relationship was given by Meyerhof (1957) : (14)
in which 0 0 1 denotes the effective overburden stress in kgfjcm 2 (98 kPa). Even though Eq. (14) is based simply on freshly deposited very young sands in the laboratory tests, the in situ SPT measurement and laboratory determination of relative density on the undisturbed sands by the in situ freezing method cited previously show that the relative density of the sands at o 0 '=1 kgfjcm 2 (98 kPa) with SPT N-value of 30 is 80 to 90 percent, which is closely related to the value determined by direct substitution of N and <1 0 1 into Eq. (14), provided that the relative density is determined on the basis of the maximum and minimum densities obtained by the JSSMFE method (JSSMFE, 1979). That Eq. (14) could successfully relate the SPT N-value and relative density for the high quality undisturbed sample may just be fortuitous when one remembers the fact that relative density values may vary considerably
depending on the methods to determine the maximum and minimum densities. Nevertheless, Eq. (14) seems applicable to in situ clean sands which have probably been subjected to some aging effects. Note that using SPT N-values by the cathead and rope method with significant rope friction may overstimate the relative density by 10 to 20 percentage points for the sands tested. Substituting Eq. (10) into Eq. (14) leads to Dr=16-/Jf; (15)
A drastic decrease in SPT N-values for saturated sands with fines compared with submerged sands without fines, such as that observed in the field case histories, is also apparent in Fig. 18, although it may be overestimated because of inevitable boundary conditions in the laboratory test (Gibbs and Holtz, 1957). The relationship for this fine sand may be represented by the following equations as shown in Fig. 18 assuming that L1N1 =15, although the general applicability of this equation for estimating the relative density of fine sands is yet to be proven.
Dr= (16) or (17)
in which LJN1 is a constant and can be considered as a correction term for taking into account the effect of fines content, since Eq. (17) is reduced to Eq. (15) if LJN1 =0. Assuming that the relation between shear stress ratio and relative density is uniquely defined by Eq. (11) irrespective of the presence of fines, the following relation can be obtained by substituting Eq. (17) into Eq. (11). _!!_!!:__=a[ 16JN;+L1}J7 +( 16-J N 1 +LJN1 )n] 2 oc' 100 Ca _ (18)
Eq. (18) can represent directly the relationship between shear stress and SPT N-values in terms of shear strain.
The following items must be considered when one attempts to relate the undrained strength of in situ saturated sand during an
TOKIMATSU AND YOSHIMI
earthquake and that obtained by the cyclic triaxial test even if the soil sample is perfectly undisturbed: (1) the effect of system compliance including membrane penetration and of end friction, (2) the difference between the triaxial condition and the simple shear condition, (3) the effect of irregular shear stress, and ( 4) the effect of multidirectional shear. However, for lack of direct evaluation of the above using high quality undisturbed samples of dense sand, the correction factor Cr=O. 57 proposed by De Alba et al. (1976) based on their large-scale simple shear tests on a reconstituted clean sand will be tentatively adopted here, i.e.,
( Tz) -c( oa) 09 ) Oo 1 field- r 2 oc' triaxial
Thus, the relationship between dynamic shear stress ratio and SPT Ncvalue with respect to shear strain amplitude for representative samples of in situ soils may be defined by the following equation.
[16vNl+L1N1 +(16,JN-;+;;TFT;)n] oo' r 100 Cs (20)
where a=O. 45, Cr=O. 57, n=14, L1N1 =0 for clean sands and L1N1 =5 for silty sands are assumed. The last assumption is rather arbitrary but judged by the authors to be appropriate.
Comparison Between Field Evidence and Laboratory Test Results
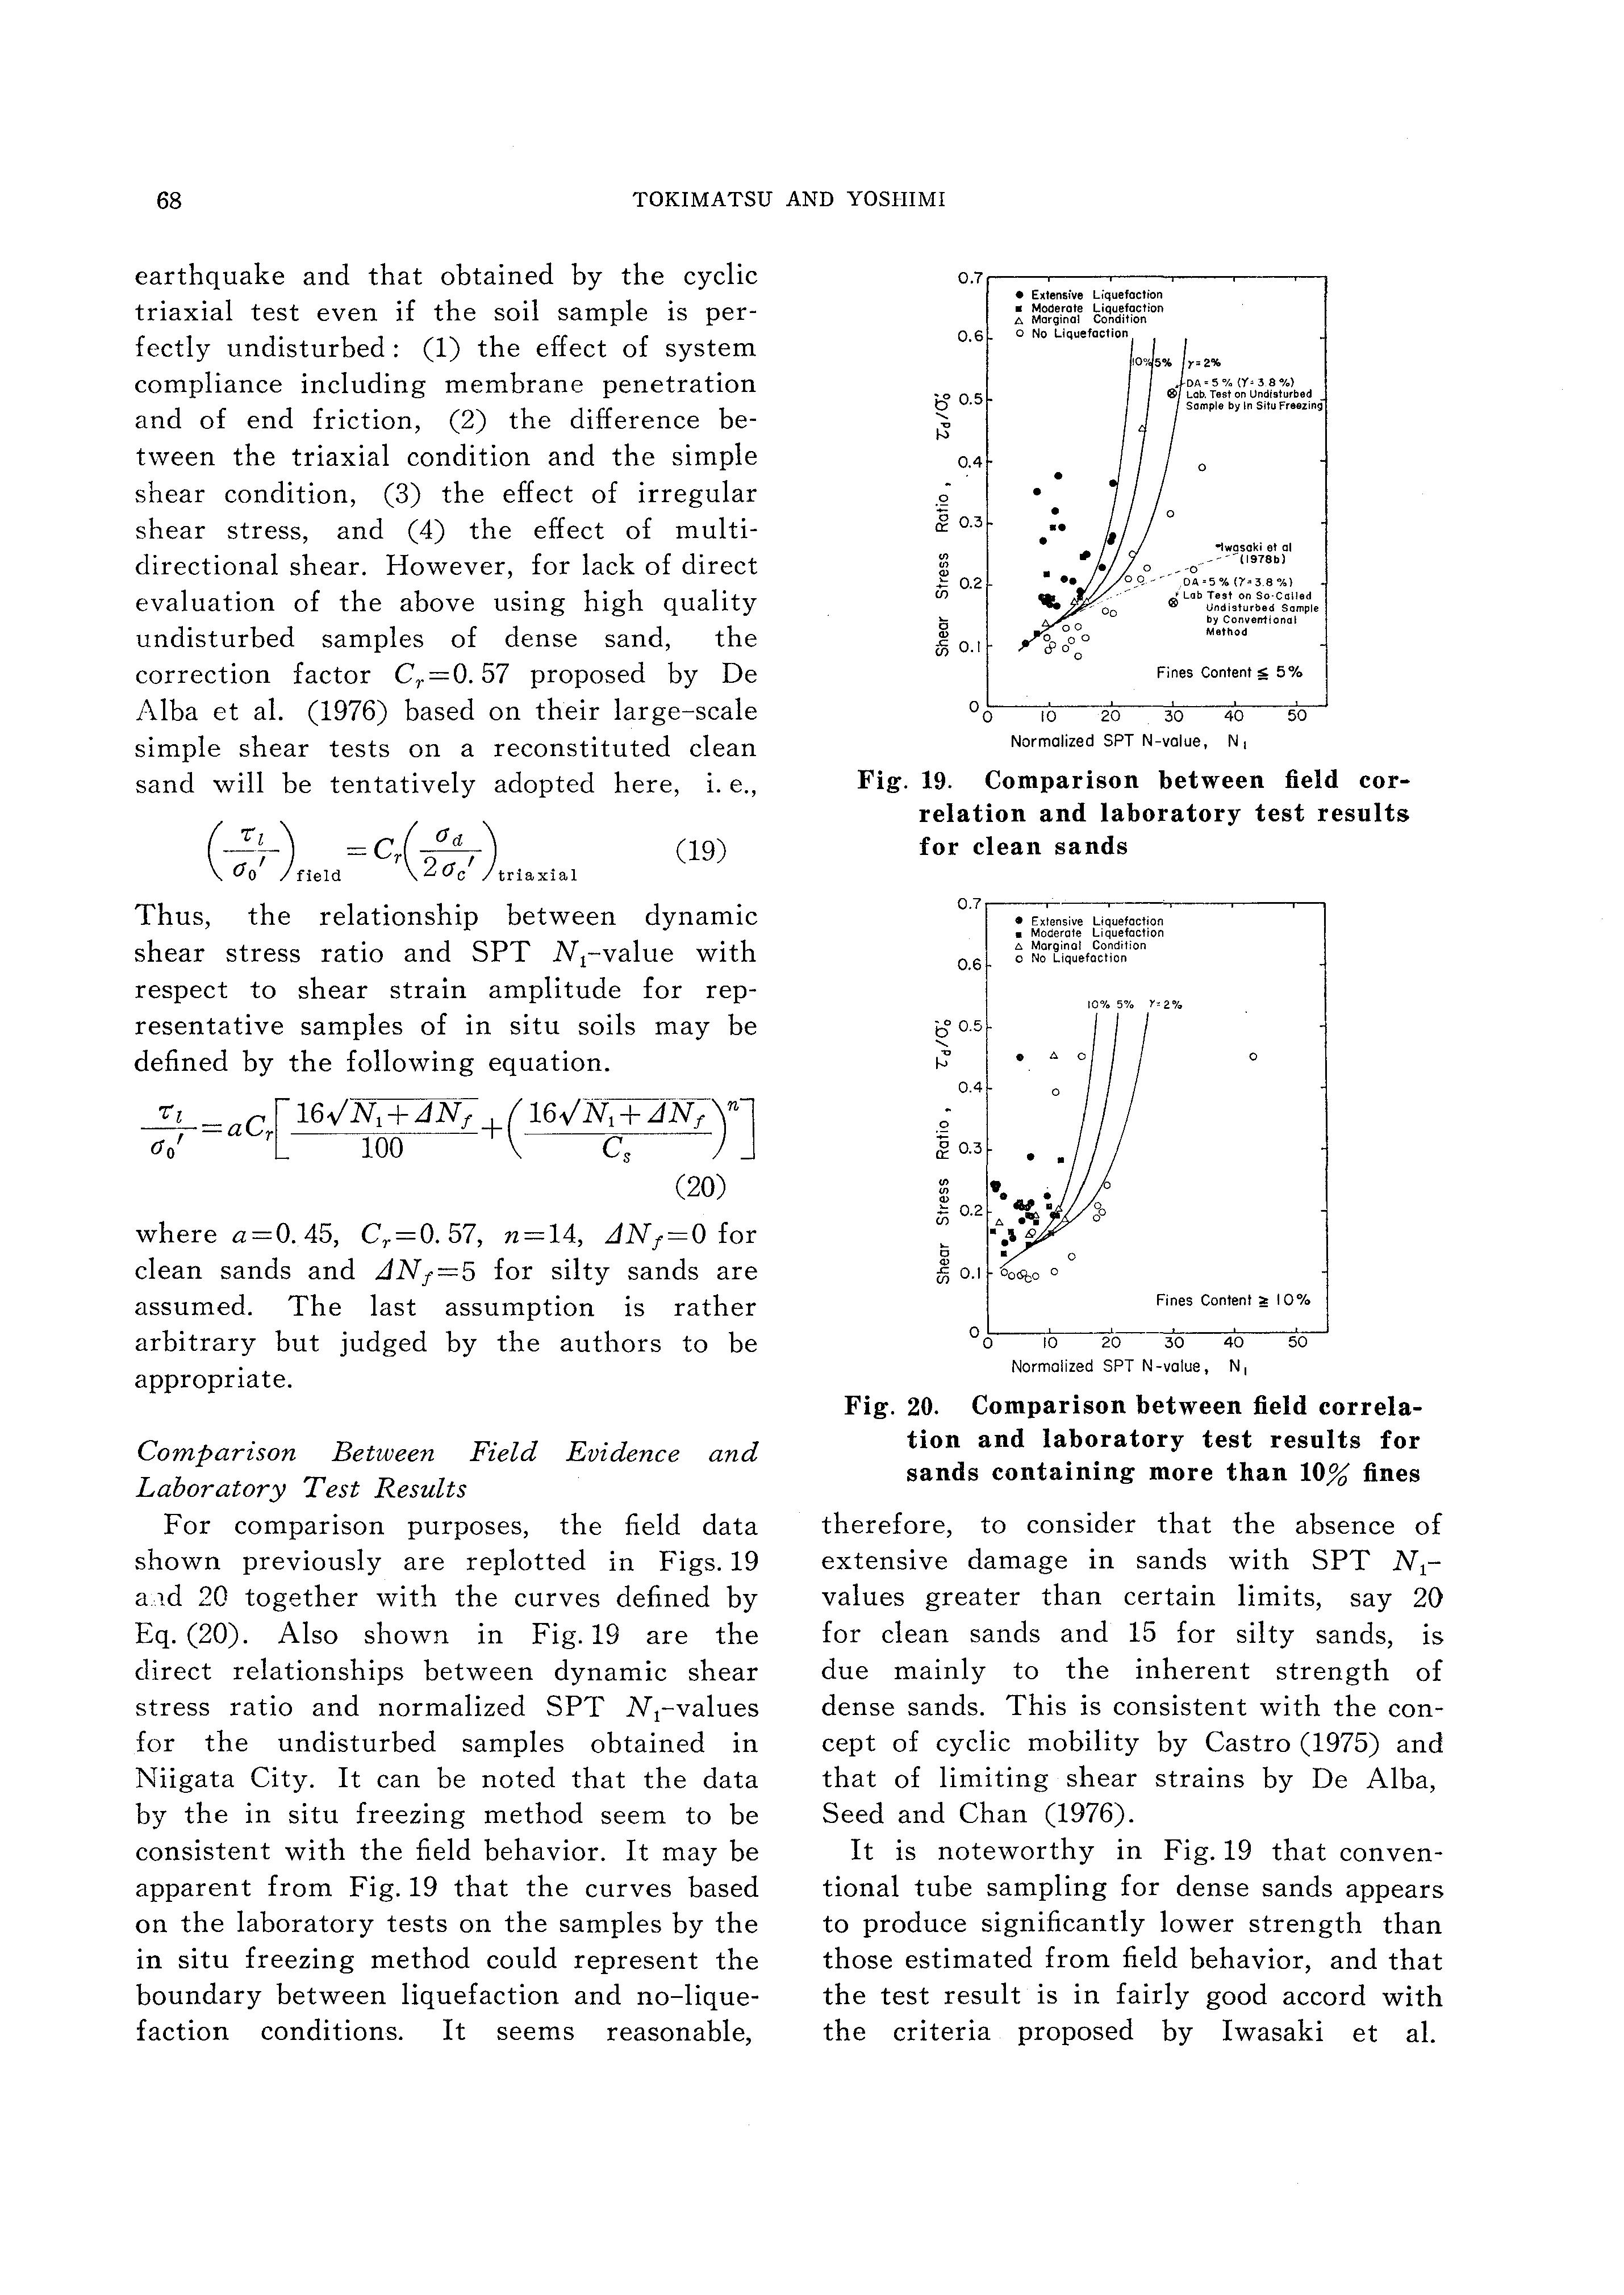
For comparison purposes, the field data shown previously are replotted in Figs. 19 a 1d 20 together with the curves defined by Eq. (20). Also shown in Fig. 19 are the direct relationships between dynamic shear stress ratio and normalized SPT Ncvalues for the undisturbed samples obtained in Niigata City. It can be noted that the data by the in situ freezing method seem to be consistent with the field behavior. It may be apparent from Fig. 19 that the curves based on the laboratory tests on the samples by the in situ freezing method could represent the boundary between liquefaction and no-liquefaction conditions. It seems reasonable,
SPT
Fig. 19. Comparison between field correlation and laboratory test results for clean sands
Normalized SPT N -value, N 1
Fig. 20. Comparison between field correlation and laboratory test results for sands containing more than 10% fines
therefore, to consider that the absence of extensive damage in sands with SPT Nc values greater than certain limits, say 20 for clean sands and 15 for silty sands, 1s due mainly to the inherent strength of dense sands. This is consistent with the concept of cyclic mobility by Castro (1975) and that of limiting shear strains by De Alba, Seed and Chan (1976).
It is noteworthy in Fig. 19 that conventional tube sampling for dense sands appears to produce significantly lower strength than those estimated from field behavior, and that the test result is in fairly good accord with the criteria proposed by Iwasaki et al.
EMPIRICAL CORRELATION OF LIQUEFACTION
(1978 b) which are based on their laboratory tests on tube samples. The strength ratios at DA=5% between the in situ freezing method and the conventional tube sampling from the figure would be roughly 1. 0, 1. 2, 1. 5 to 2, and 2. 5 to 3 for SPT N 1-values of 15, 20, 25 and 30, respectively, which indicate that considerable underestimation of undrained strength does occur for medium dense to dense sands if it is based on laboratory tests on samples by conventional methods.
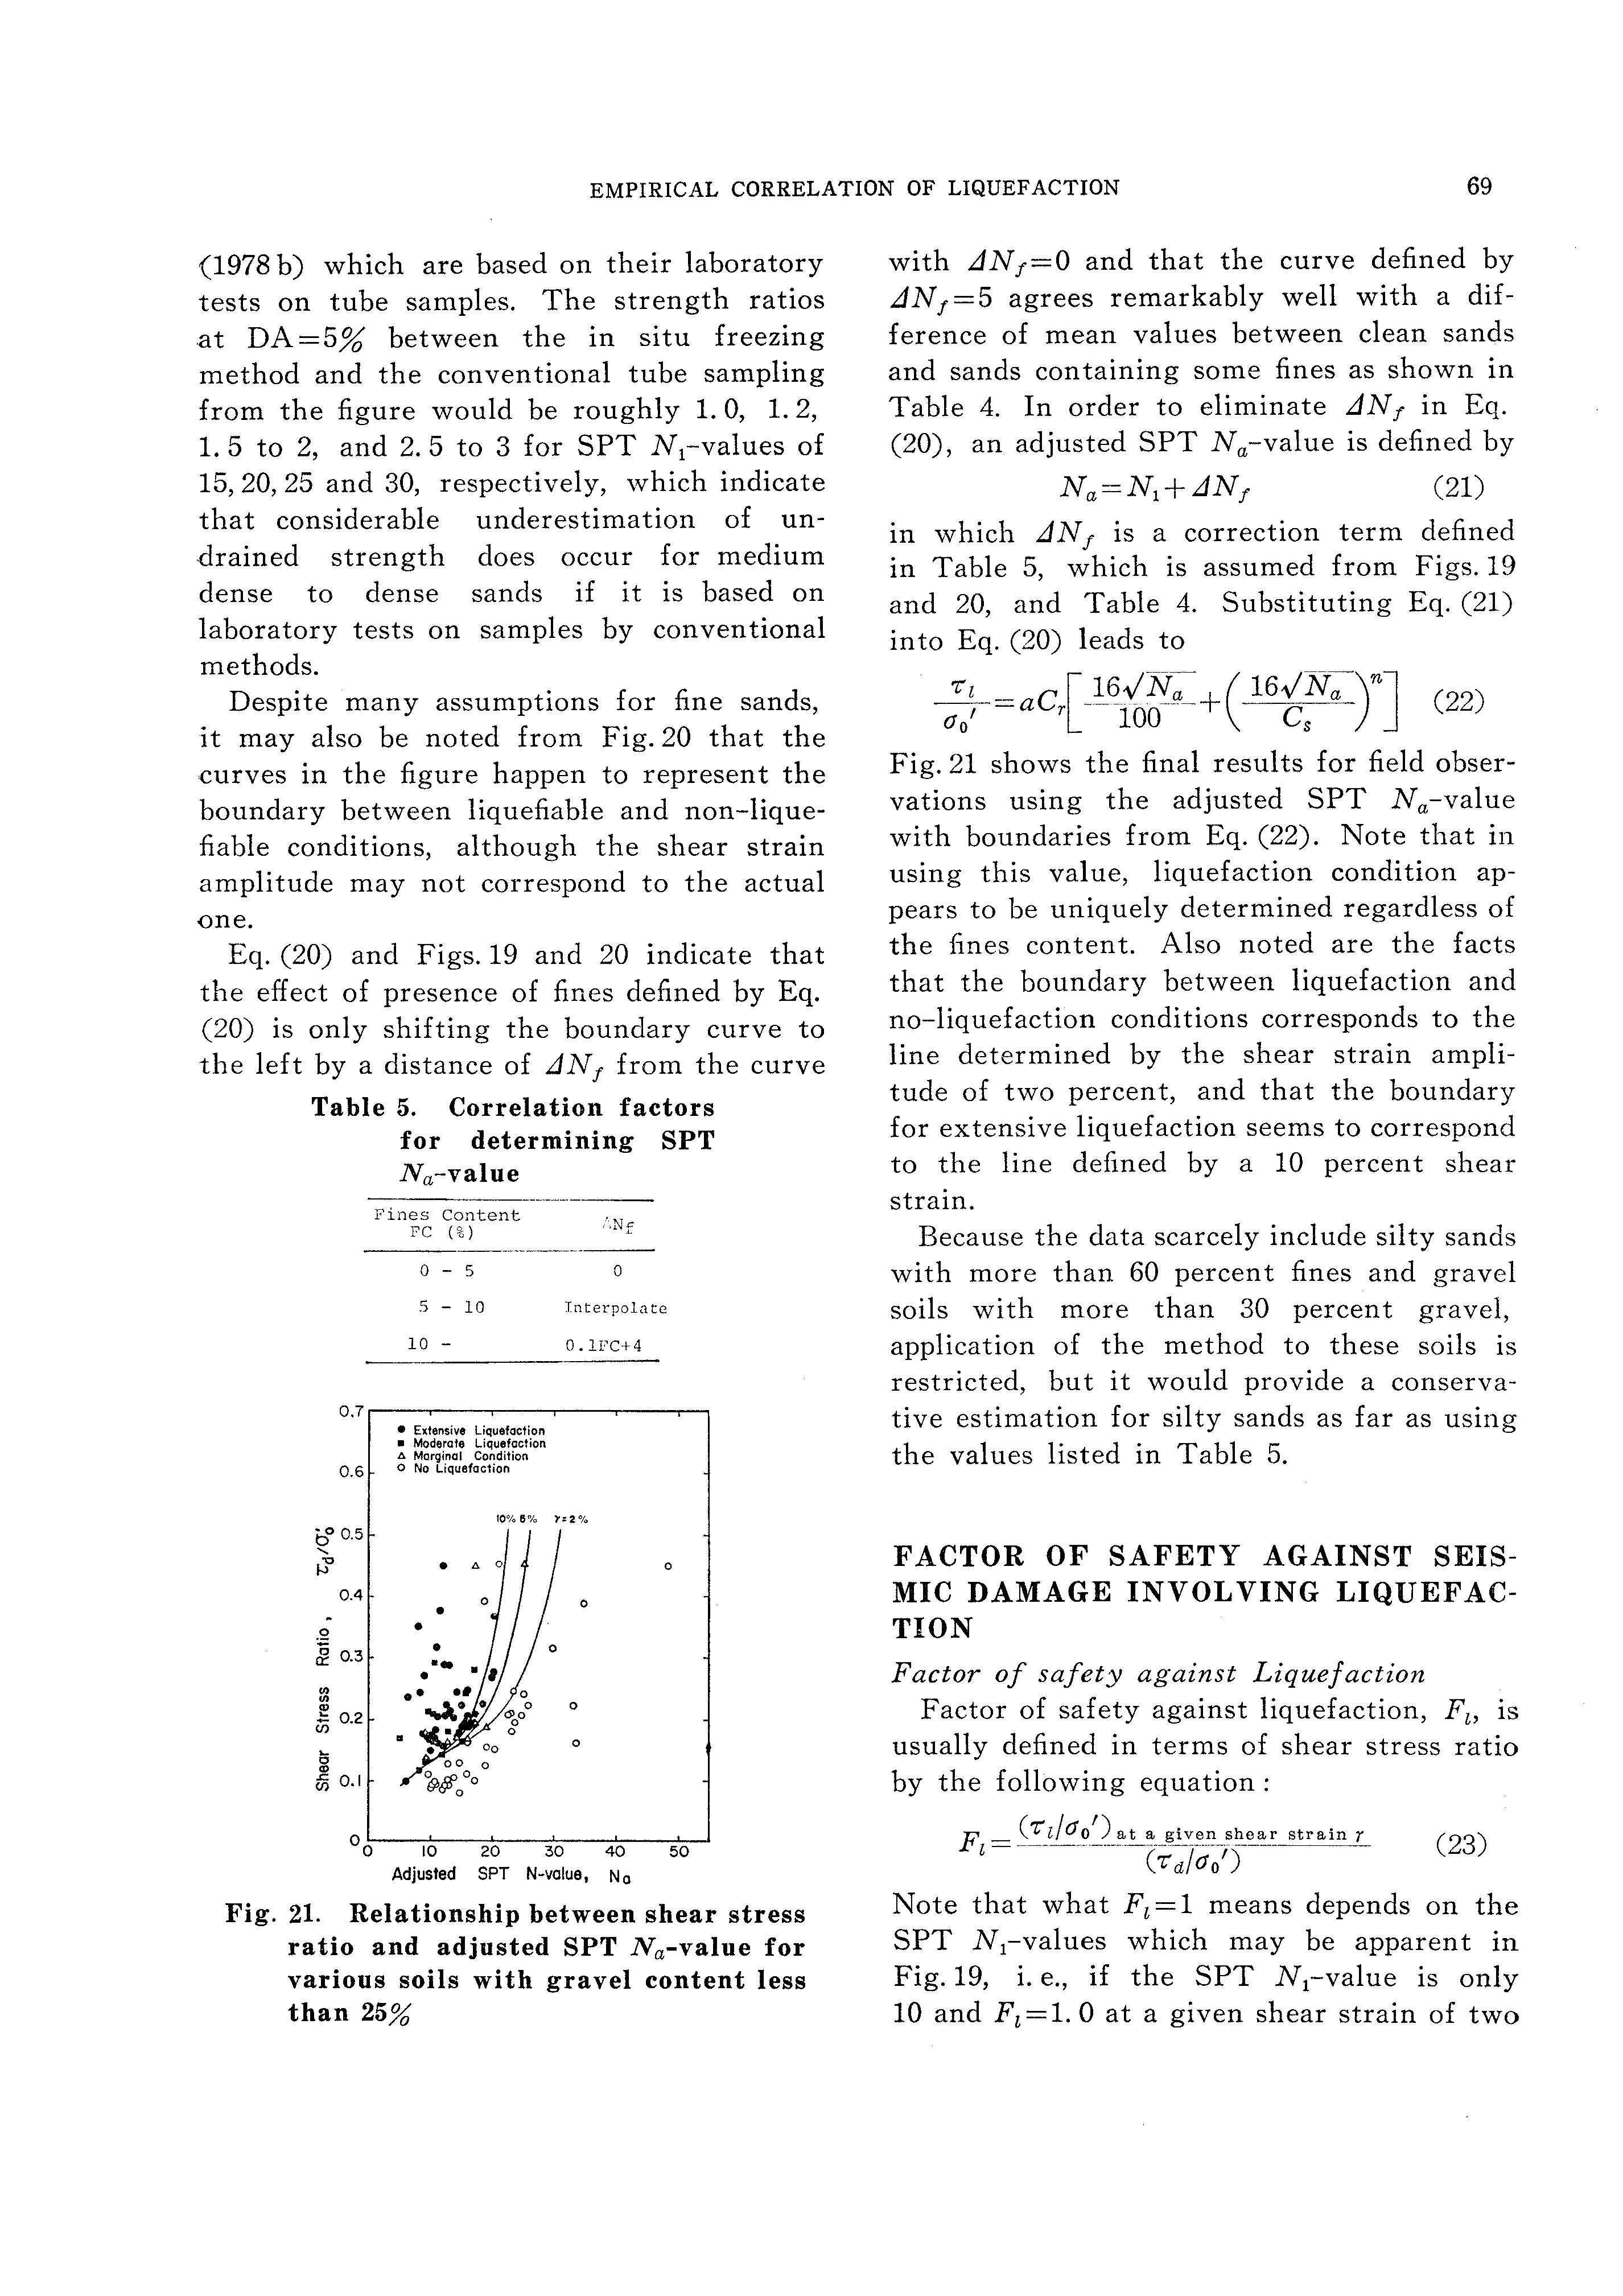
Despite many assumptions for fine sands, it may also be noted from Fig. 20 that the curves in the figure happen to represent the boundary between liquefiable and non-liquefiable conditions, although the shear strain amplitude may not correspond to the actual one.
Eq. (20) and Figs. 19 and 20 indicate that the effect of presence of fines defined by Eq. (20) is only shifting the boundary curve to the left by a distance of iJN1 from the curve
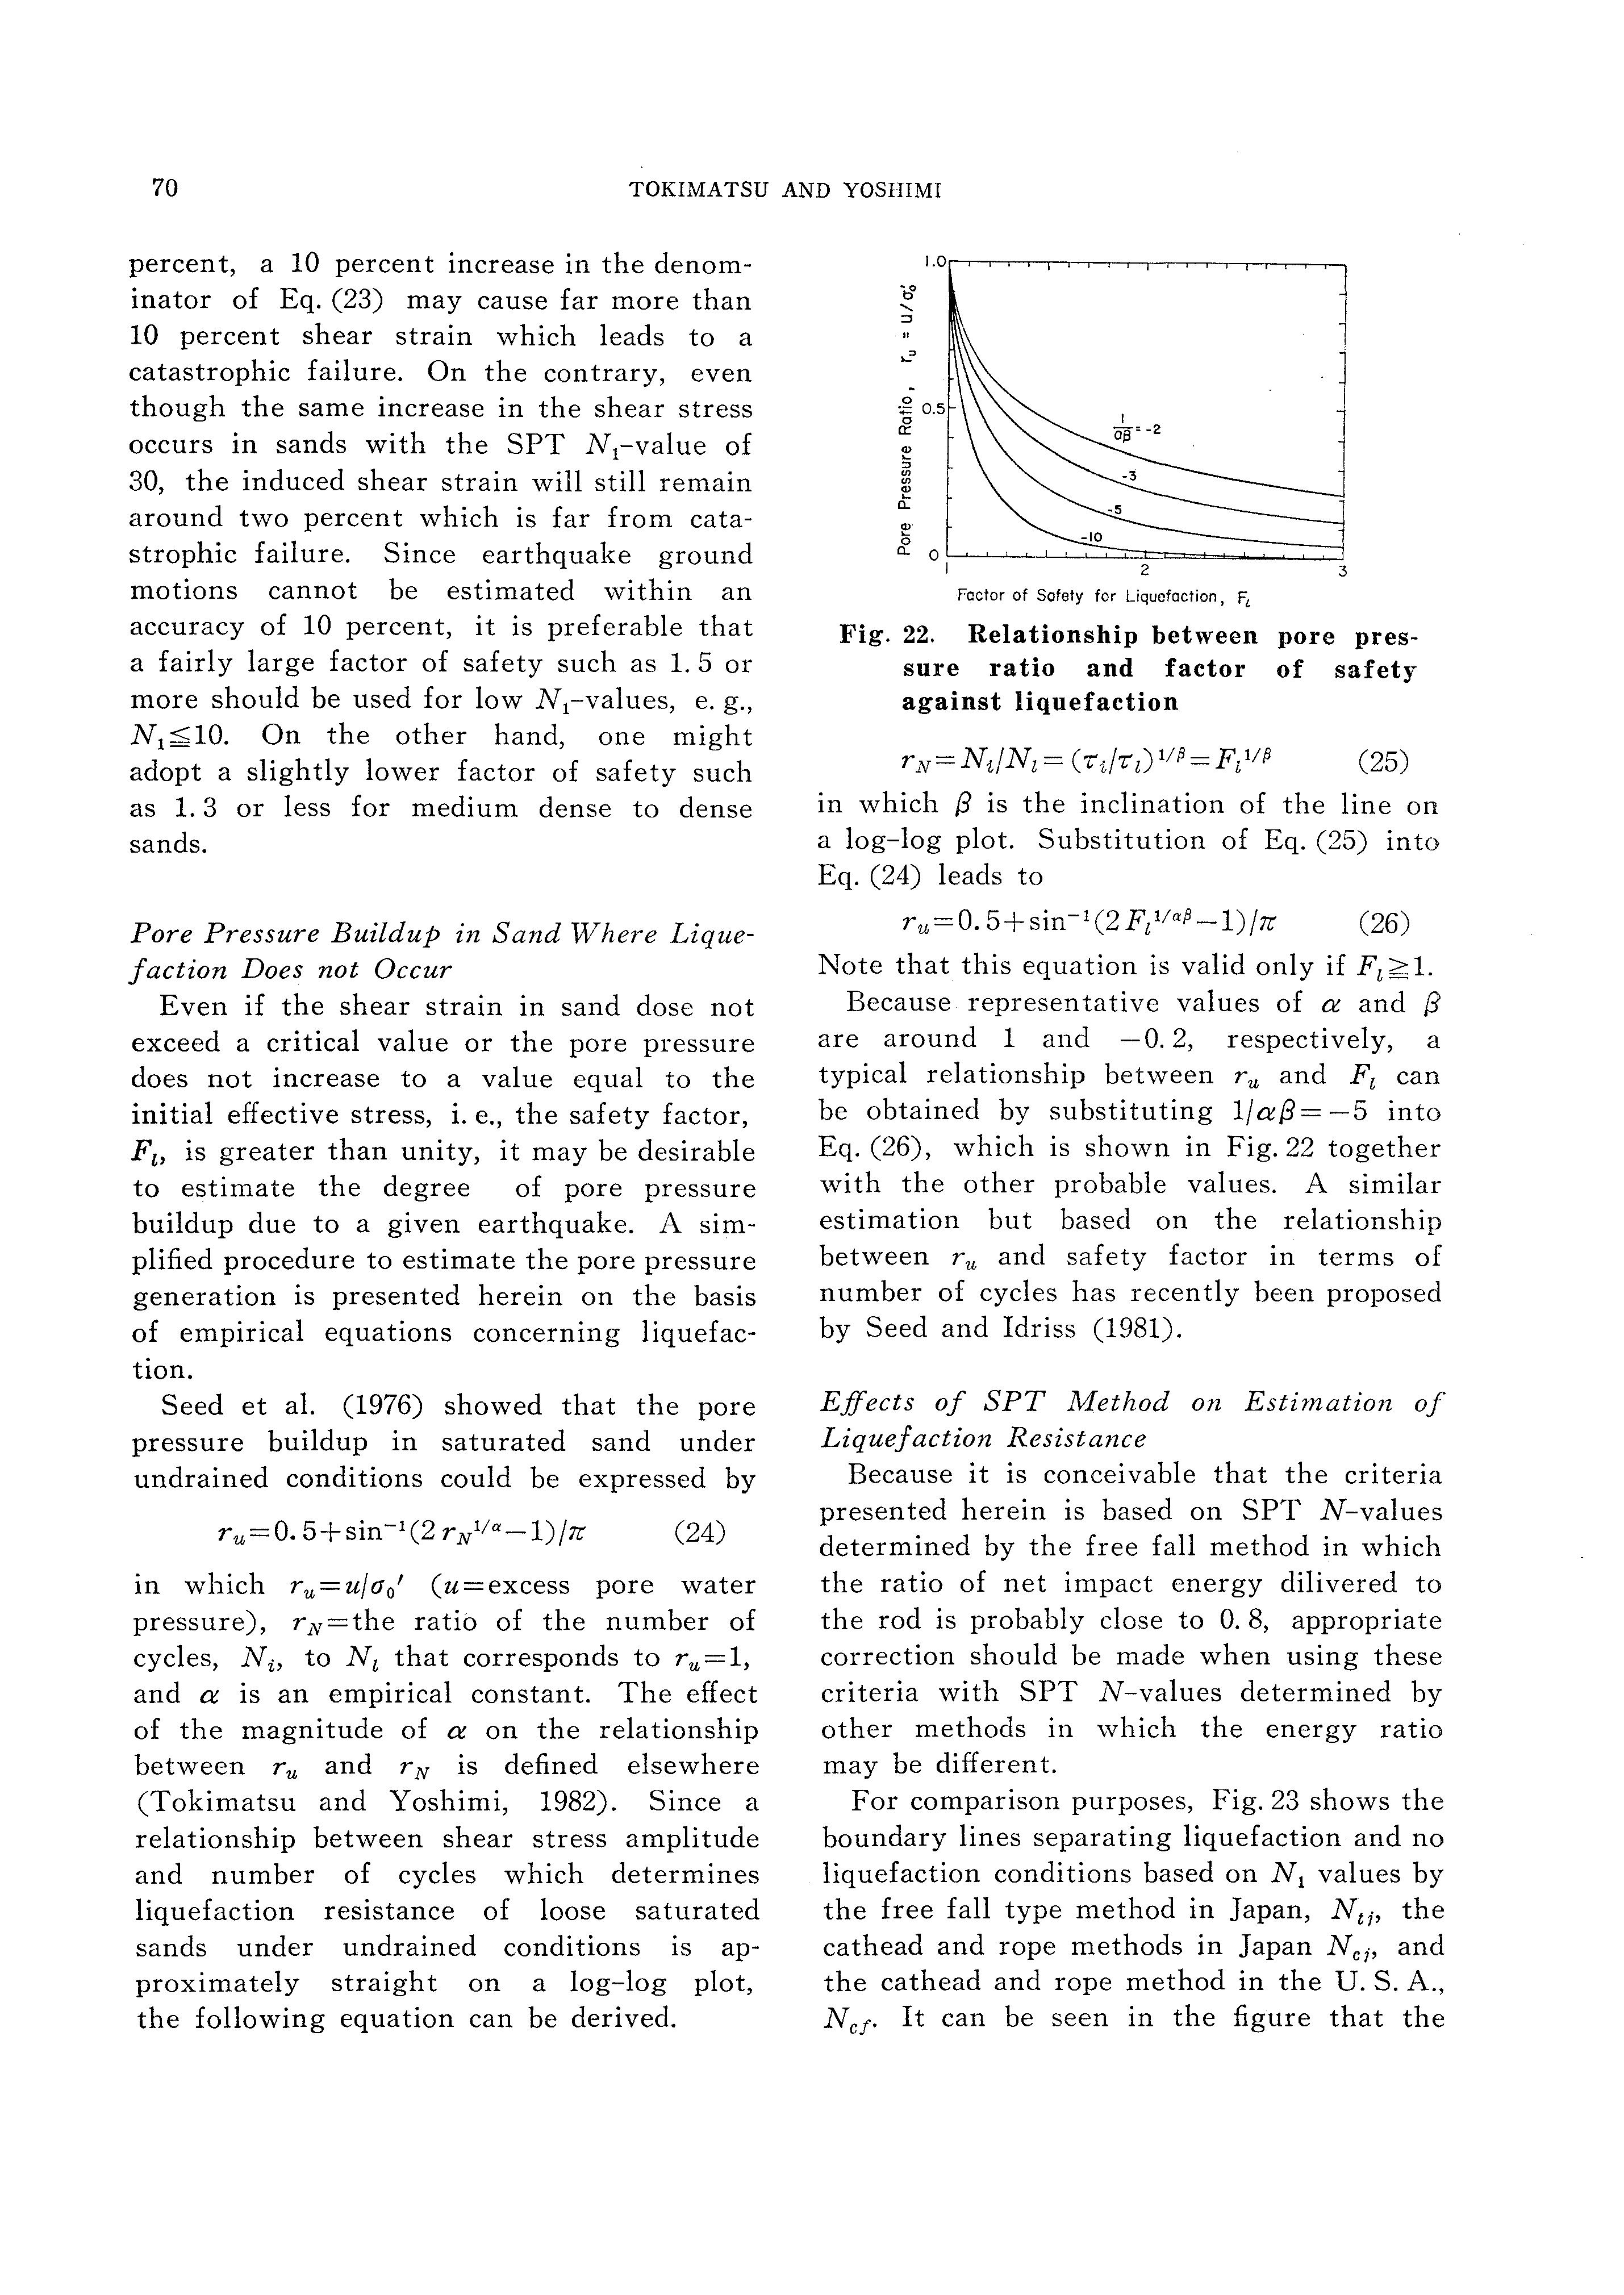
Table 5. Correlation factors for determining SPT Na-value
Fig. 21. Relationship
with ilN1 =0 and that the curve defined by ilN1 =5 agrees remarkably well with a difference of mean values between clean sands and sands containing some fines as shown in Table 4. In order to eliminate ilN1 in Eq. (20), an adjusted SPT Na-value is defined by Na=N1+ilN1 (21) in which iJN1 is a correction term defined in Table 5, which is assumed from Figs. 19 and 20, and Table 4. Substituting Eq. (21) into Eq. (20) leads to (22)
Fig. 21 shows the final results for field observations using the adjusted SPT Na-value with boundaries from Eq. (22). Note that in using this value, liquefaction condition appears to be uniquely determined regardless of the fines content. Also noted are the facts that the boundary between liquefaction and no-liquefaction conditions corresponds to the line determined by the shear strain amplitude of two percent, and that the boundary for extensive liquefaction seems to correspond to the line defined by a 10 percent shear strain.
Because the data scarcely include silty sands with more than 60 percent fines and gravel soils with more than 30 percent gravel, application of the method to these soils is restricted, but it would provide a conservative estimation for silty sands as far as using the values listed in Table 5.
FACTOR OF SAFETY AGAINST SEISMIC DAMAGE INVOLVING LIQUEF ACTION
Factor of safety against Liquefaction
Factor of safety against liquefaction, Fl, is usually defined in terms of shear stress ratio by the following equation:
F _ (Tz/cfo') at a given shear strain r l(Td/cfo') (23)
Note that what Fl=1 means depends on the SPT N 1-values which may be apparent in Fig. 19, i.e., if the SPT Ncvalue is only 10 and Fl=l. 0 at a given shear strain of two
TOKIMATSU AND YOSHIMI
percent, a 10 percent increase in the denominator of Eq. (23) may cause far more than 10 percent shear strain which leads to a catastrophic failure. On the contrary, even though the same increase in the shear stress occurs in sands with the SPT N 1-value of 30, the induced shear strain will still remain around two percent which is far from catastrophic failure. Since earthquake ground motions cannot be estimated within an accuracy of 10 percent, it is preferable that a fairly large factor of safety such as 1.5 or more should be used for low Ncvalues, e. g., N 1 ;;£ 10. On the other hand, one might adopt a slightly lower factor of safety such as 1. 3 or less for medium dense to dense sands.
Pore Pressure Buildup in Sand Where Liquefaction Does not Occur
Even if the shear strain in sand dose not exceed a critical value or the pore pressure does not increase to a value equal to the initial effective stress, i.e., the safety factor, Fl, is greater than unity, it may be desirable to estimate the degree of pore pressure buildup due to a given earthquake. A simplified procedure to estimate the pore pressure generation is presented herein on the basis of empirical equations concerning liquefaction.
Seed et al. (1976) showed that the pore pressure buildup in saturated sand under undrained conditions could be expressed by ru=O. 5+sin- 1 (2 rNI/a_l)/ll (24)
m which ru=ufao' (u=excess pore water pressure), rN=the ratio of the number of cycles, Ni, to Nl that corresponds to ru=1, and a is an empirical constant. The effect of the magnitude of a on the relationship between ru and rN is defined elsewhere (Tokimatsu and Yoshimi, 1982). Since a relationship between shear stress amplitude and number of cycles which determines liquefaction resistance of loose saturated sands under undrained conditions 1s approximately straight on a log-log plot, the following equation can be derived.
Foetor of Safety for Liquefaction, F,
Fig. 22. Relationship between pore pressure ratio and factor of safety against liquefaction
rN=NtfNz= (Tt/Tz) 1113 =Fz 11 f3 (25)
m which {3 is the inclination of the line on a log-log plot. Substitution of Eq. (25) into Eq. (24) leads to 5+sin- 1 (2Fzllaf3_1)/7t (26)
Note that this equation is valid only if Fl;;;;).
Because representative values of a and {3 are around 1 and -0. 2, respectively, a typical relationship between ru and Fz can be obtained by substituting 1fa{3= -5 into Eq. (26), which is shown in Fig. 22 together with the other probable values. A similar estimation but based on the relationship between ru and safety factor in terms of number of cycles has recently been proposed by Seed and Idriss (1981).
Effects of SPT Method on Estimation of Liquefaction Resistance
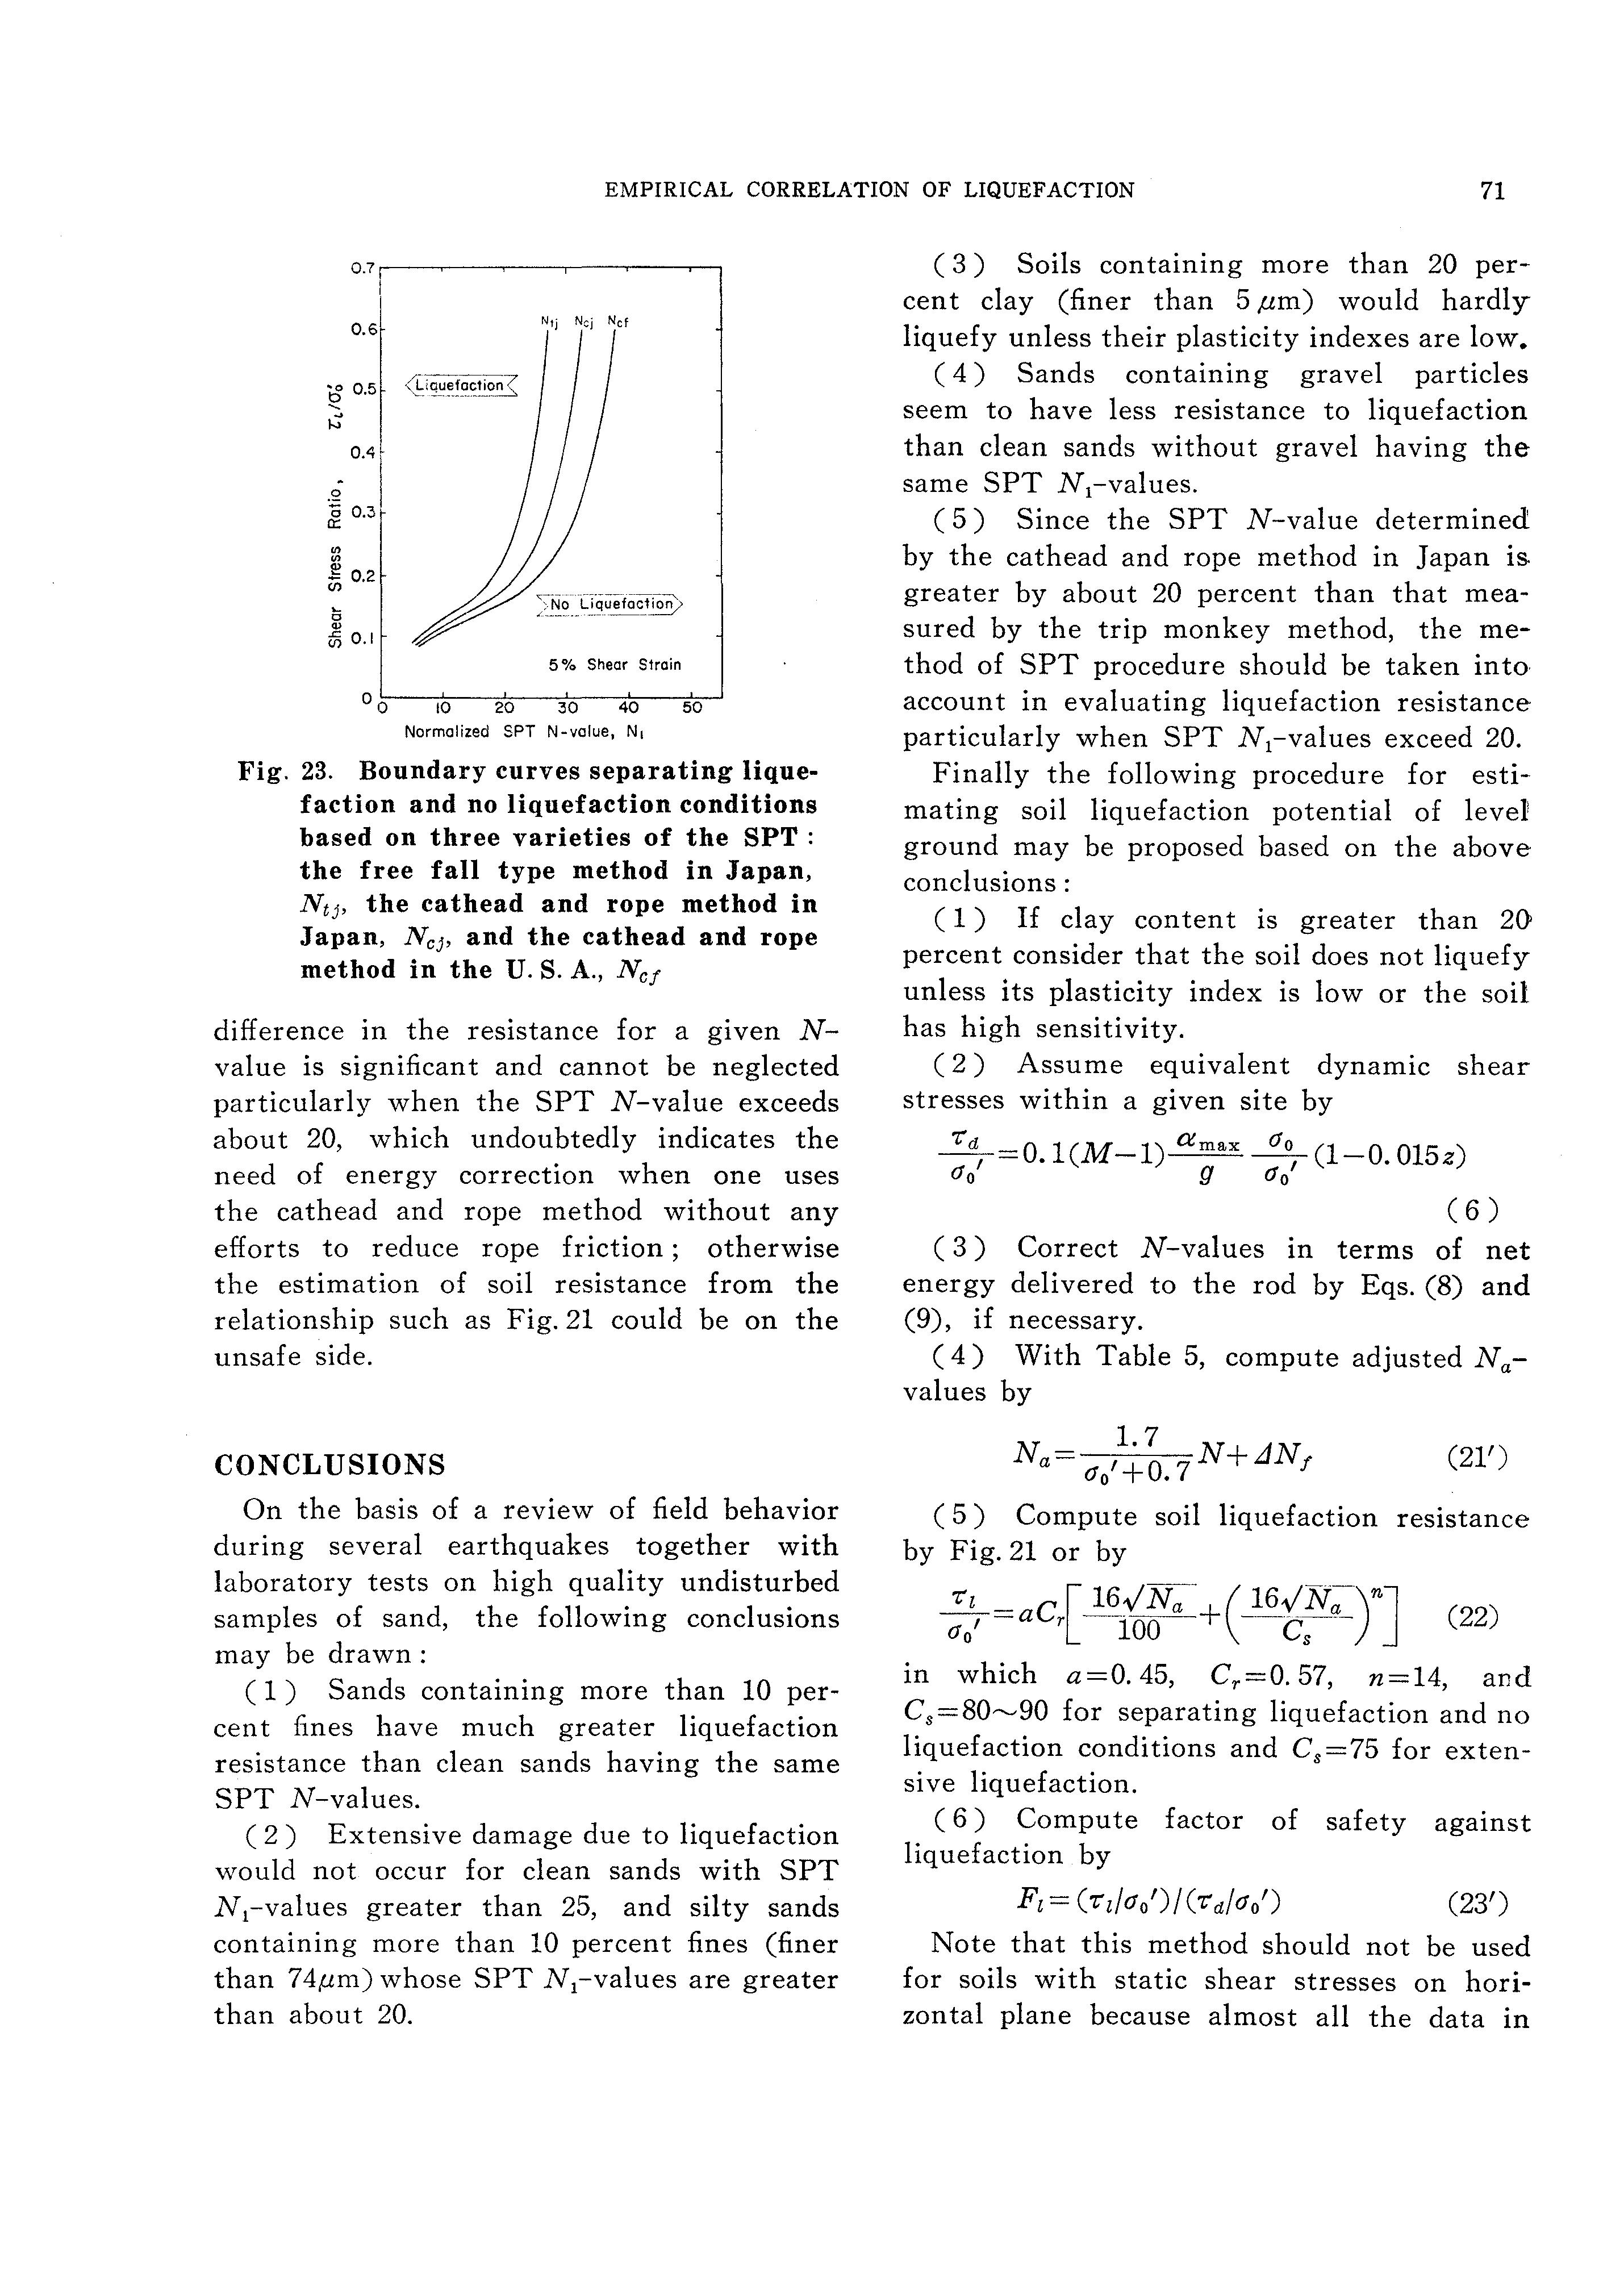
Because it is conceivable that the criteria presented herein is based on SPT N-values determined by the free fall method in which the ratio of net impact energy dilivered to the rod is probably close to 0. 8, appropriate correction should be made when using these criteria with SPT N-values determined by other methods in which the energy ratio may be different.
For comparison purposes, Fig. 23 shows the boundary lines separating liquefaction and no liquefaction conditions based on N 1 values by the free fall type method in Japan, Nti• the cathead and rope methods in Japan Nci• and the cathead and rope method in the U.S. A., Ncf· It can be seen in the figure that the
EMPIRICAL CORRELATION OF LIQUEFACTION
( 3 ) Soils containing more than 20 percent clay (finer than 5 ,urn) would hardly liquefy unless their plasticity indexes are low.
( 4) Sands containing gravel particles seem to have less resistance to liquefaction than clean sands without gravel having the same SPT N 1-values.
( 5) Since the SPT N-value determined by the cathead and rope method in Japan is greater by about 20 percent than that measured by the trip monkey method, the method of SPT procedure should be taken into account in evaluating liquefaction resistance particularly when SPT N 1-values exceed 20.
Fig. 23. Boundary curves separating liquefaction and no liquefaction conditions based on three varieties of the SPT : the free fall type method in Japan, NtJ, the cathead and rope method in Japan, NcJ• and the cathead and rope method in the U.S. A., Ncf
difference in the resistance for a g1ven Nvalue is significant and cannot be neglected particularly when the SPT N-value exceeds about 20, which undoubtedly indicates the need of energy correction when one uses the cathead and rope method without any efforts to reduce rope friction ; otherwise the estimation of soil resistance from the relationship such as Fig. 21 could be on the unsafe side.
CONCLUSIONS
On the basis of a review of field behavior during several earthquakes together with laboratory tests on high quality undisturbed samples of sand, the following conclusions may be drawn:
( 1) Sands containing more than 10 percent fines have much greater liquefaction resistance than clean sands having the same SPT N-values.
( 2) Extensive damage due to liquefaction would not occur for clean sands with SPT N 1-values greater than 25, and silty sands containing more than 10 percent fines (finer than 74.um) whose SPT N 1-values are greater than about 20.
Finally the following procedure for estimating soil liquefaction potential of level ground may be proposed based on the above conclusions :
( 1) If clay content is greater than 20 percent consider that the soil does not liquefy unless its plasticity index is low or the soil has high sensitivity.
( 2) Assume equivalent dynamic shear stresses within a given site by amax (fo' g (fo' (6)
( 3) Correct N-values in terms of net energy delivered to the rod by Eqs. (8) and (9), if necessary.
( 4) With Table 5, compute adjusted Navalues by (21')
( 5) Compute soil liquefaction resistance by Fig. 21 or by ::, =ac{lf!_(o[;a (22)
in which a=O. 45, Cr=O. 57, n=14, and Cs=80""'90 for separating liquefaction and no liquefaction conditions and C 8 =75 for extensive liquefaction.
( 6) Compute factor of safety against liquefaction by Fz= (-rzl(fo')/(-rdf(fo') (23')
Note that this method should not be used for soils with static shear stresses on horizontal plane because almost all the data in
TOKIMATSU AND YOSHIMI
this paper are based on field performance of relatively level ground with free surface. One must be particularly careful with loose soils with static shear stresses on horizontal plane because their liquefaction resistance is likely to be overestimated by direct application of this method.
ACKNOWLEDGEMENTS
This study was partially supported by a research grant from the Ministry of Education, Science and Cui ture. Valuable discussions by Professor H.B. Seed of the University of California, Berkeley, during the preparation of this paper are greatly appreciated. State-of-the-art in Mainland China concerning the SPT method and estimation of maximum horizontal accelerations provided by Mr. Z. Zhang, Visiting Scholar, University of California, Berkeley, is gratefully acknowledged.
REFERENCES
1) Bennett, M. J., et al (1981) : "Subsurface investigation of liquefaction, Imperial Valley Earthquake, California, October 15, 1979," U. S. Geological Survey Open-File Report 81-502, 83 pp.
2) Castro, G. (1975) : "Liquefaction and cyclic mobility of saturated sands," Jour. Geotech. Eng. Di v., ASCE, Vol. 101, No. G T 6, pp. 551-569.
3) De Alba, P., Seed, H. B. and Chan, C. K. (1976) : "Sand liquefaction in large-scale simple shear tests," Jour. Geotech. Eng. Div., ASCE, Vol. 102, No. GT9, pp. 909-927.
4) Dixson, S. J. and Burke, J. W. (1973) : "Liquefaction case history," Jour., Soil Mech. and Found. Div., ASCE, Vol. 99, No. SM 11, pp. 921-955.
5) Finn, W. D. L. (1982) : "Soil liquefaction studies in the People's Republic of China," Soil Mechanics-Transient and Cyclic Loads, Ch. 22, pp. 609-626, John Wiley & Sons, Ltd.
6) Gibbs, H. J. and Holtz, W. G. (1957) : "Research on determining the density of sands by spoon penetration testing," Proc., 4th Int. Con£. Soil Mech. and Found. Eng., London, Vol. 1, pp. 35-39.
7) Iida, K. (1977): "Distribution of damage and earthquake intensity during the Tohnankai Earthquake of 1944," Committee for Disaster Prevention in Nagoya Prefecture, 1977-3 (in Japanese).
8) !ida, K. (1979) : "Distribution of damage and earthquake intensity during the Mino-Owari Earthquake of 1891," Committee for Disaster Prevension in Nagoya Prefecture, 1979-3 (in Japanese).
9) Ishihara, K., Silver, M. L. and Kitagawa, H. (1979) : "Cyclic strength of undisturbed sands obtained by a piston sampler," Soils and Foundations, Vol. 19, No.3, pp. 61-76.
10) Ishihara, K., Kawase, Y. and Nakajima, M. (1980) : "Liquefaction characteristics of sand deposits at an oil tank site during the 1978 Miyagiken-Oki Earthquake," Soils and Foundations, Vol. 20, No.2, pp. 97-111.
11) Ishihara, K., Shimizu, K. and Yamada, Y. (1981) : "Pore water pressures measured in sand deposit during an earthquake," Soils and Foundations, Vol. 21, No.4, pp. 85-100.
12) Iwasaki, T., Kawashima, K. and Tokida, K. (1978 a) : "Report of the Miyagiken-Oki Earthquake of June, 1978," Public Works Research lnsti tu te, Ministry of Construction, Report No. 1422, 202 pp (in Japanese).
13) Iwasaki, T., et al. (1978 b) : "A practical method for assessing soil liquefaction potential based on case studies at various sites in Japan," Proc. 2nd Int. Con£. on Microzonation, San Francisco, Vol. 2, pp. 885-896.
14) Iwasaki, T., et al. (1981) : "Studies on aseismic stability of river dykes considering ground liquefaction," Proc., 16th Annual Meeting, JSSMFE, pp. 637-640 (in Japanese).
15) Kishida, H. (1966) : "Damage to reinforced concrete buildings in Niigata City with special reference to foundation engineering," Soil and Foundation, Vol. 6, No.1, pp. 71-88.
16) Kishida, H. (1969) : "Characteristics of liquefied sands during Mino-Owari, Tohnankai and Fukui Earthquakes, " Soils and Foundations, Vol. 9, No.1, pp. 75-92.
17) Kishida, H. (1970) : "Characteristics of liquefaction of level sandy ground during the Tokachioki Earthquake," Soils and Foundations, Vol.10, No.2, pp.l03-111.
18) Kodera, J. (1964) : "Earthquake damage and the ground of pier foundations, Part 1," Tsuchi-to-Kiso, Vol.12, No.3, pp.11-18 (in Japanese).
19) Koizumi, Y. (1966) : "Changes in density of
EMPIRICAL CORRELATION OF LIQUEFACTION
sand subsoil caused by the Niigata Earthquake," Soil and Foundation, Vol. 6, No.2, pp. 38-44.
20) Kokusho, T., Kato, S. and Shimada, M. (1981) : "The effect of initial shear stress on cyclic shear characteristics of saturated dense sand," Proc., 16th Annual Meeting, JSSMFE, pp. 581-584 (in Japanese).
21) Kovacs, W. D., Evans,]. C. and Griffith, A. H. (1977) : "Towards a more standard SPT," Proc. 9th Int. Con£. Soil Mech. and Found. Eng., Vol. 2, pp. 269-276.
22) Kovacs, W. D. and Salomone, L. A. (1982) : "SPT hammer energy measurements," Jour. Geotech. Eng. Div., ASCE, Vol.108, No. G T 4, pp. 599-620.
23) Lee, K. L. and Fitton, J. A. (1968) : "Factors affecting the cyclic loading strength of soil, " Vibration Effects of Earthquakes on Soils and Foundations, ASTM STP 450, Am. Soc. for Testing and Materials, pp. 71-95.
24) Lee, K. L., et al. (1975) : "Properties of soil in the San Fernando hydraulic fill dams," Jour. Geotech. Eng. Div., ASCE, Vol. 101, No. GT 8, pp. 801-821.
25) Marcuson, W. F. III, and Bieganousky, W. A. (1976) : "Laboratory standard penetration tests on fine sands," Jour. Geotech. Eng. Div., Vol. 103, No. GT 6, pp. 565-588.
26) Meyerhof, G. G. (1957) : Discussion, Proc. 4th Int. Con£. on Soil Mech. and Found. Eng., Vol. 3, p. 110.
27) Nishizawa, Y., Fuyuki, S. and Uto, K. (1980): "In situ tests and efficiency concerning SPT," Proc., Sounding Symp., JSSMFE, pp. 83-92 (in Japanese).
28) Ohsaki, Y. (1966) : "Niigata Earthquake, 1964, building damage and soil conditions," Soil and Foundation, Vol. 6, No.2, pp. 14-37.
29) Ohsaki, Y. (1970) : "Effects of sand compaction on liquefaction during Tokachioki Earthquake, " Soils and Foundations, Vol. 10, No. 2, pp. 112-128.
30) Okusa, S., Arima, S. and Maikuma, H. (1980): "Liquefaction of mine tailings m the 1978 Izu-Ohshima-Kinkai Earthquake, Central Ja· pan," Proc. 7th World Con£. on Earthquake Eng., Istanbul, Vol. 3, pp. 89-96.
31) Pyke, R. M., Knuppel, L.A. and Lee, K. L. (1978) : "Liquefaction potential of hydraulic fills," Jour. Geotech. Eng. Div., ASCE, Vol. 104, No. GT 11, pp. 1335-1354.
33) Schmertmann, J. H. (1978) : "Use the SPT to measure dynamic soil properties? -yes, but ···!," Dynamic Geotech. Testing, Am. Soc. for Testing and Materials, STP 654, pp. 341-355.
34) Seed, H. B. and Idriss, I. M. (1971) : "Simplified procedure for evaluating soil liquefaction potential," Jour., Soil Mech. and Found. Div., ASCE, Vol. 97, No. SM 9, pp.1249-1273.
35) Seed, H. B., et al. (1975) : "Representation of irregular stress time histories by equivalent uniform stress series in liquefaction analyses, " Earthquake Eng. Research Center, Univ. of Cal., Berkeley, No. 75-29.
36) Seed, H. B., Martin, P. P. and Lysmer, ]. (1976) : "Pore-water pressure changes during soil liquefaction," Jour. Geotech. Eng. Div. ASCE, Vol.102, No. GT 4, pp. 323-346.
37) Seed, H. B. (1976) : "Evaluation of soil lique· faction effects on level ground during earthquakes," Liquefaction Problems m Geotech. Eng., ASCE Annual Convention and Exposition, held at Philadelphia, pp. 1-104.
38) Seed, H. B. (1979) : "Liquefaction and cyclic mobility evaluation for level ground during earthquakes," Jour. Geotech. Eng. Div., ASCE, Vol.105, No. GT 2, pp. 201-255.
39) Seed, H. B. and Idriss, I. M. (1981) : "Evaluation of liquefaction potential of sand deposits based on observations of performance in previous earthquakes," Preprint 81-544, In Situ Testing to Evaluate Liquefaction Susceptibility, ASCE National Convention, St. Louis, Missouri, October 27.
40) Seed, H. B., et al. (1981) : "Earthquake mduced liquefaction near Lake Amatitlan, Guatemala," Jour. Geotech. Eng. Div., ASCE, Vol.107, No. GT4, pp. 501-518.
41) Takada, T., et al. (1965) : "A report of Niigata Earthquake-Part 5, damage of bridges," Report No. 125-5, Public Works Research Institute, Ministry of Construction.
42) Tokimatsu, K. and Yoshimi, Y. (1981) : "Field correlation of soil liquefaction with SPT and grain size," Proc., Int. Con£. on Recent Advances m Geotech. Earthquake Eng. and Soil Dynamics, St. Louis, Mo., Vol. 1, pp. 203-208.
43) Tokimatsu, K. and Yoshimi, Y. (1982) : "Liquefaction of sand due to multidirectional cyclic shear," Soils and Foundations, Vol. 22, No.3, pp. 126-130.
32) Ross, G. A. (1968) : "Case studies of soil stability problems resulting from earthquakes," Thesis submitted to the Univ. of Cal., Berkeley.
44) Tsuchida, H., et al. (1979) : "The damage to port structures by the 1978 Miyagiken-Oki Earthquake, " Technical Note, The Port and Harbour Research Inst., Ministry of Transport, No. 325 (in Japanese).
45) Yoshimi, Y., Hatanaka, M. and Oh-oka, H. (1977) : "A simple method for undisturbed sampling by freezing," Proc., Specialty Session 2 on Soil Sampling, 9th Int. Con£. on Soil Mech. and Found. Eng., Tokyo, pp. 23-28.
46) Yoshimi, Y., Kaneko, 0. and Tokimatsu, K. (1983) : "Cyclic shear characteristics of a dense
AND YOSHIMI
sand sampled by in situ freezing," Proc. 18th Annual Meeting, JSSMFE, pp. 559-560 (in Japanese).
47) Yoshimi, Y. and Tokimatsu, K. (1983) : "SPT practice survey and comparative tests," Soils and Foundations, Vol. 23, No.3, pp. 105-111.
48) Zhou, S. G. (1981) : "Influence of fines on evaluating liquefaction of sand by CPT," Proc., Int. Con£. on Recent Advances in Geotech. Earthquake Eng. and Soil Dynamics, St. Louis, Mo., Vol.1, pp.167-172.