6.3.1GiniIndices:All Individuals‘TotalIncome’ Before Tax1935to2014136
6.3.2IncomeDataBeforeand
6.3.4SomeComparisons
6.3.5GiniIndices by Gender andBeforeand After Tax: 1981–2013148 6.4Conclusions150
7RegressionModelsofMobility155
7.1SomePreviousLiterature157
7.2The Dataset158
7.3RegressionwithFirst-OrderSerialCorrelation160
7.3.1Specificationofthe Model160
7.3.2IncomeDynamic Estimates164
7.4AnExtension: Second-Order Serial Correlation168
7.5Conclusions172
8IllustratingDifferentialGrowth175
8.1Illustrative
8.2The TIMCurve178
8.2.1The TIPCurve178
8.2.2Three Is of Mobility
Acknowledgements
This bookisbasedontheresults of aprogramme of incomedistribution researchcarried outinrecentyears.Ittherefore consists of revisedversions ofearlier papers. Iamgratefulfor permission to usethese papers. Most of the chaptershave beenco-authored, andI wouldliketotakethisopportunity toacknowledge themanyvaluablecontributions of my collaborators.In particular,I wouldliketomention Norman Gemmell, who is aco-author ofsix of thechaptersandhaslong been agreatlyappreciated source of encouragementand support.
Chapter 2isbasedon Creedy,J.and Eedrah, J.(2016) Incomeredistributionand changes in inequalityinNew Zealandfrom2007 to 2011:alternative distributions andvalue judgements. NewZealand EconomicPapers,50, pp. 129-152.
Chapter 3is based onCreedy,J.(2016) Interpretinginequalitymeasures andchangesin inequality. New ZealandEconomicPapers,50,pp. 177-192. Theappendixuses material from Creedy,J.(2019)The Atkinsoninequality measure andinequalityaversion. VictoriaUniversityofWellingtonChair of Public FinanceWorking Paper WP01/209.
Chapter5 isbasedon Ball, C. andCreedy,J.(2016)Inequality in New Zealand 1983/84 to 2013/14. NewZealandEconomicPapers,50,pp.323342.
Chapter6 is basedonCreedy, J.,Gemmell, N. andNguyen,L. (2018)
IncomeinequalityinNew Zealand1935-2014. AustralianEconomic Review, 51, pp. 21-40.
Chapter 7isbased on Creedy, J.,Gemmell, N. andLaws, A. (2021)
Relative incomedynamics of individualsin NewZealand:new regression estimates. NewZealand Economic Papers,55,pp.203-220.
Chapter 8isbased onpart of Creedy,J.and Gemmell, N. (2019)Illustratingincomemobility: newmeasures. Oxford Economic Papers,71,pp. 733-755.
Chapter 9isbasedon Creedy,J.and Gemmell,N.(2023)Summary measuresofequalisingincomemobilitybasedon ‘Three "I"sof Mobility’ curves. Journal of Income Distribution (forthcoming).
Chapter 10 is basedonpartofCreedy,J.and Gemmell, N. (2019)Illustratingincomemobility: newmeasures. Oxford Economic Papers,71,pp. 733-755.
Chapter11 is based on Creedy,J.and Gemmell, N. (2018)Incomedynamics,pro-poormobilityand povertypersistencecurves. EconomicRecord, 94, pp. 316-328.
Chapter1 Introduction
This bookisconcernedwithtwo mainfeaturesofincome distributioncomparisons. The rst vechapters(Chapters2 to6) examinea rangeoftechnical aspects of inequalitymeasurement,includinglesswell-known propertiesof inequalityindices, andthedecompositionofinequalitychanges into component contributions. Thenext vechapters (Chapters7 to11)areconcerned withvarious aspects of thegraphicaldisplay andmeasurement of incomemobility. There is no attempttooffer acomprehensivetreatment, or indeedthe kindofsystematic treatmentthatwould be requiredof atextbook.Instead it bringstogether, in much revisedform,a number of contributionsmade overrecentyears. Thebookmay in some ways be regarded as asequelto three earlier volumes– Creedy(1985,1992, 1998) –which alsoconcentrate onthestatics anddynamics of incomedistribution.Whilethemain focus ison methods,illustrative examplesare providedusing NewZealanddata. The remainderofthisintroductionbrieysummariseseach of thechapters in turn.
rangeof alternatives,andresultingsummary measures, whichcould be used tocompareinequalityovertime. Usingan annual accountingperiod, alternative welfare metricsandunitsofanalysisare investigated.Thirteen different distributionscan be distinguished.Inaddition,thesensitivitytoassumptionsabouteconomiesofscale within householdsisexamined,and changes in inequalityaredecomposedintothosearisingfrompopulationand tax structure changes.Illustrations, using NewZealand data forthe period2007 to2010, show that judgements aboutchanges in inequalitydependonthe precise choicesmade. Forthe same time period,the answer tothequestionof whether inequalityhasrisen or fallendepends cruciallyonthe combination of welfare metric,incomeunit, adultequivalence scale andinequalitymeasureused.In empiricalstudiesitistherefore important toexplore arange of alternativeapproaches, providinginformationforreaderstomaketheir own judgements.
Chapter 3isconcerned withtheproblem of howtointerpretordersof magnitudeof inequalitychanges. Forexample,theinformationthata Gini or Atkinson measure of inequalityhasincreased by agiven percentage does nothaveanobviousintuitivemeaning. Thechapterexplores, mainlyinthe context oftheAtkinsoninequalitymeasure, variousattemptstointerpret ordersof magnitude in atransparentway.One suggestionisthat theanalogy ofsharing acakeamong averysmall number of people providesa useful intuitivedescriptionfor people whowantsomeidea of whatan inequality measure‘actuallymeans’. In contrastwiththe Gini measure, for whicha simple ‘cake-sharing’ resultis available, theAtkinsonmeasurerequires anonlinear equation to be solved.This involves comparisonsof ‘excessshares’–theshareobtainedbythe richer person in excess of thearithmeticmean–for arangeofassumptions.The implications forthe ‘leakybucket’experiments, oftenused to clarifythe natureofinequalityaversion, are also examined. An additionalapproachistoobtainthe‘pivotal income’, abovewhich asmall income increaseforany individualincreasesinequality. Thepropertiesof
this measurefor theAtkinson indexare also explored.
Chapter 4discussesasomewhatneglected,althoughwidely recognised, feature of summarymeasuresofinequality, namely that agiven numerical valueofa measure can be associated with arangeof distributions. Just as differentdistributionscan have thesamearithmetic mean,itispossible –given sufficientobservations– forhigher momentsofdifferentdistributionstobeequal. To explorethisaspect, thechapter considerstheproblem of distributing a xedamount of money(‘income’) amonga given number of people, such that inequality(measured by eithertheGini or Atkinson measure)takes aspeci edvalue. Theissuebasicallycorresponds tothe wellknown factthat simultaneous equationsadmit of many solutionswhere the numberof variablesexceedsthatofequations (constraints).However,the approach examinescases wherethere arejust oneortwo degrees of freedom, clarifyingthe resultingrange ofdistributions. Thepropertiesofsimultaneous disequalising andequalisingtransfersarediscussed.
Whenexamininga time series ofannual inequalitymeasures,a complicationisthattherearemanyother changestaking place,suchaschanges in the age compositionofthepopulation,labourforce participation, andhousehold structure.Chapter 5shows howsurveycalibration methods, where sample weightsarecalculatedtoensure thatcertainaggregates matchthose obtained from independentdata,canbeusedtoexaminethecontributions to changing inequality of awiderangeof variables. Thechapterexamines approximately 50 population characteristics which,as partof thedecompositionmethod, are assumedtoremainconstantoverthe period,sothattheirseparate contributionstoinequalitycan be measured. Thechapter provides an empirical analysis ofannualincomeand expenditure inequalityinNew Zealandovera thirty-year period fromtheearly1980s. Theextent of redistributionthrough thetax andbene t system is alsoexplored. HouseholdEconomicSurvey dataareused foreachyearfrom1983/84to1997/98 inclusive, 2000/01and 2003/04,and foreachyearfrom2006/07.
Chapter 6exploresthechallengesinvolvedinextendingthe time period, over which annual summarymeasuresare compared, to alongernumber of years.Inparticular, comparisonsare complicatedbythe factthat data coverageand de nitionsused by statisticalagencies changeovertime,sothat comparableresults areoften difficultto obtain. As seen in Chapter5, New Zealandincomeinequality indicesincreased during thelate1980sandearly 1990s, buttherehasbeenlimited changethereafter.Little is knownabout thelevelsandchanges in inequalityoverprior decades.Sucha long term analysisisrestricted by the more limited data availability in earlier decades ofthelast century. Basedon previously unexplored datafrom Statistics New Zealand Official Yearbooks and Inland Revenue, this chapterreports estimates forthe Gini indexofincomeinequalityfor NewZealandfromthe middle 1930stothepresent. ComparisonswithestimatesforAustraliafor theperiod, 1942to 2001,revealsomeremarkablecommonfeatures.
Thevastmajorityofdiscussionsofinequality, likethe rst vesubstantivechaptersinthepresentbook,focusexclusivelyon‘static’comparisons ofthedistributionofannualincomesin different places or times.Yet it has long beenrecognised that an importantcharacteristicofindividuals’incomes is thattheyare subjecttosystematic variations associated withthe lifecycle,aswellas bothexogenousand endogenousvariationsovertimefor alarge varietyofreasons, includinghealth, employment andjob changes. Suchchanges taking placeinthe distributionof annualincomes overtime maygivea highly misleadingindicationofinequality,when measured overa longer accounting period. Furthermore,comparisonsare often made of the growth rates from oneyeartothe next in,say,decilesoftherelevant distributions. Lowergrowthratesof lowerincomedeciles,compared withthegrowth ratesofhigher deciles, aresaidtoindicateinegalitarian mobility. However, what mattersare therelativeaveragegrowthratesexperienced by individualswho were initiallyinvarious ranges of thedistribution. Theserates require longitudinal information,andtypically demonstratehighergrowth
rates,on average,forindividualsinitially in lowerdeciles compared with those in higherdecile groups. Thenext vechaptersare concerned with such dynamicaspectsofincomedistribution comparisons.
Chapter 7shows that thepattern of relativeincomechanges, despite beingsubjecttoconsiderablecomplexity, canbedescribedsuccinctly using asimpleautoregressivestochastic processin which‘regressiontowardsthe mean’iscombined with serial correlationinthestochasticterm. Theparameters of the model areshown to have convenientinterpretationsandcan be estimatedusinglimitedlongitudinaldata. Usingaseries of random samples of NewZealand individualtaxpayers,witheachsamplecontaining income dataforthe sameindividualsoverthreeconsecutiveyears,revealssubstantial regressiontowardsthe mean,combinedwithnegativeserialcorrelation.Remarkablestabilityinthe estimatedparameters is observedacrossthesamples over thewhole1997to2012 period.These implythat relatively high-income individuals have,onaverage,lower proportional increasesinincomefromone yeartothenext compared withthose with lowerinitial incomes,andthose with alargeincreaseinone yeararemorelikelytoexperiencea relative decreasethefollowing year. Both of theseeffects,thoughcombined witha stochasticcomponent that on itsown wouldtendtoincrease inequalityover time,are sufficientinthisNew Zealandcasetoensurethatinequalityfalls as theaccountingperiodoverwhich incomesare measuredincreases, andthere is no systematictendencyforannual inequalitytorise.Despitethesimplicityofthedynamic processspeci ed, itis nevertheless capable ofexplaining about75per cent of thevariation in annual incomes.
Chapter8introduces agraphical device whichillustrates ‘ata glance’ theincidence,intensityand inequalityofmobility,consideredintermsof differential income growth. Thecurve,named a‘Three"I"sofMobility’, or TIM, curveplotsthe cumulativeproportionofthe population(from lowestto highest values of initialincome)againstthecumulativechange inlog-incomes percapita over agiven period. Theadvantageisthat, liketheLorenz curve
in thecaseofstatic inequality, thecurve issimple to produce, provides convenientcomparisonsofthedifferentdimensions, andcan be suggestiveof furtheranalysis.
Chapter 9extends the ‘Three"I"s of Mobility’ framework,discussedin Chapter8, by proposingassociatedquantitativesummary measuresof equalisingmobilitybetween twoperiods.The chaptershows thatmeasures canbe based,asinthe famous Lorenzcurve used to depictcross-sectionalinequality, on areaswithin thediagram.These areareameasures of the‘distance’from theTIM curveto twoalternativecurveswhich depict,indifferentsenses, hypothetical extremeequalising mobility cases.The rstcase involves the equalisationofincomesin thesecondperiod, such that allsecond-period incomesare equaltotheactualaverage,and theaveragegrowthrateis equal to the actual average growth overtherelevantperiod. Thisinvolves acompressionofincomes andnore-ranking. If second-periodequalityis treatedas‘extremeequalisation’, then anyre-rankingofincomes(generated by non-systematicchanges)canberegarded as ‘frustrating’redistribution. Thesecondconceptinvolvesa differentconcept of maximum redistribution, de ned in termsofthe inequalityofincomes measuredoverthe twoperiods combined. This hypotheticalextreme involves acombinationofdifferential income growth with maximum re-ranking,whereby second-periodincomes are‘swapped’:the richest personbecomesthepoorest,andsoon.Inthis case, maximumre-rankingisviewedas afundamental componentofequalisingchange. Themeasuresareillustratedusingalargesampleoftaxpayers’ incomesinNew Zealand, obtainedfromcon dential unit-record les.Itis suggestedthat these measures of equalisingmobilitycan usefullyaugment the visualinformation provided by theTIMcurveconcept.
Chapter 10 turnstothe analysisof incomemobility, viewed intermsof re-rankingorpositionalchanges.Individualscan move to higherorlower rankpositions,sothatthe explicittreatment of the directionofchangebecomes important. In de ninga re-rankingmobility index, itis therefore
rstnecessary to decidewhether negativere-ranking(droppingdownthe ranking)istreatedsymmetrically with positive(upward)movementwithin theranking.A secondissueconcernsthe choice of whose mobilityistobe included.Thischapterproposes asimpleillustrative device forpositional mobility. Thechapter showshow are-ranking mobilitycurve,analogous to theTIMcurve,can illustratetheincidence, intensity andinequalityofpositional mobilityinthe formof re-ranking. This plotsthecumulativedegree of re-rankingagainstthe cumulative proportionofthe population(from lowest to highestincomes). Additionally,sinceforany givenfractionof the populationthere is adifferentmaximum possibleextentofre-ranking,itisuseful toconsiderthecumulativeratio ofactual-to-maximumre-rankingagainst thecumulativeproportion of thepopulation.Illustrations of re-rankingare examinedbased on threepanelsofNew Zealand incomesfrom1998 to 2010, revealinga highdegreeofpositionalmobility, comparedwiththe maximum possible, amongthelowest andhighestincomeindividuals. This highlights howsome conclusionsregarding theextentofre-rankingdependcrucially onthere-rankingmeasure adopted –positive, netorabsolute. Forexample,thehighestre-rankingratiosare observedaroundthe 50 tothe 70 percentiles foranabsolutere-ranking measure but risesteadilytowardsthe 100 percentile when apositivere-rankingratioisconsidered.
Chapter11 suggests twonew illustrativedevices forpoverty income dynamics. To examinepro-poormobility in the formof relative income growth, it suggeststhat TIMcurvescanbeappliedtoindividualsin poverty. In additiontohighlightingthe ‘threeI’s’properties(incidence, intensity and inequality) of mobilityforalternativepoverty de nitions,thisallowsthe relativemobilityofeachpovertygroup to be compared with mobilitybythe populationasa whole. To examine povertypersistence,the chaptersuggests thata povertypersistence curvecan identify boththeextentofmovement acrossa povertythresholdandtheparticularpoorand non-poorincomesfor whichpersistence or movement is prevalent. Applyingtheseconceptsto New
Zealandincomedata for individualincometaxpayersshowedthatincomedynamics were especiallypro-poorduringthe period2006to2010, with much fasterincome growthforthoseonthelowestincomesthanthosehigherup the income distribution. Forexample,a mobilityindex based on cumulative income growthratesfor thosewiththe lowest vepercent of 2006 incomes, is on averagearoundten timeshigherthan theequivalentindex forall taxpayerscombined.Forthelowest twenty- ve percentthe equivalent index is around fourtimes higher than mobilityacross alltaxpayers. On poverty persistence,average income growth rates withineach percentile of thedistributionsuggestrelativelylittle movement into poverty, butsomewhatmore movement outofpoverty. However,consideringall individuals withineach percentile(around330individuals perpercentileinthis case)revealed arelativelymobile population overall, withsomeindividualsobserved within all percentiles that areabove the2006 povertythreshold movinginto poverty over the ve year period examined.
Chapter2 AlternativeDistributions and Metrics
Thisaim of this chapter is to explore theuse ofalternative distributions,and theimplicationsofusing differentsummary measuresofinequality,toassess thecontributionof thetax andtransfersysteminreducinginequality. Stress is placedon theroleofa rangeof valuejudgements,theneedtobeexplicit aboutthemand,forrational policy analysis,theimportance of considering theimplicationsofa rangeofalternative values. Thepresentchapter does notoffernewtheoreticalinsights, but it providesanillustrationoftheneed toconsideralternativedistributionsand measures,showingthat unequivocal results areseldom available.
Thecontext is one– notunusual in economics –inwhichthere is something of adichotomybetweentheory andempiricalanalysis. Whileconsiderableattentionhas been giventoinequalityinrecently policy debates,those reportingempirical evidenceoften provideonlya limitedrange ofresults anddonotalwaysclarify eitherthenatureof theincome concept(including, where relevant,theadultequivalence scalesused)orthe unitof analysis.In thelattercase, theindividual is most oftenusedwithout comment,although itturnsoutthat anumberoffamiliarresultsregarding comparisonsmay not necessarily be appropriate:forexample, widely used welfare functionscanin some circumstances be ‘inequalitypreferring’.
Alternativeapproaches areillustrated using NewZealand HouseholdEconomic Survey data. Results wereobtained usingthe NewZealand Treasury’s microsimulationmodel,Taxwell.1 Theaccounting periodisthusnecessarily ayear. Giventheuseofanannual measure, choicesmustthenbemade regarding precisely what is to be measuredandtheunitofanalysis. The formerchoiceconcernswhatisoften referredtoas the‘welfare metric’. For example,this maybepre-taxincomes, wage rates,or ameasureofexpenditureorconsumption.Itmay be based on individuals’income, or could assumesomeformofincomesharing within householdsorfamilies,inwhich case adultequivalencescalesare adopted. Herenoattempt is made to allow forthe valueof leisure.2 Afurtherdecisioninvolvesthe unit ofanalysis, which could be the family,thehousehold,the individualorthe ‘adult equivalentperson’: essentially,the choice ofunit of analysisdeterminestheweight attachedtothe welfare metric.Boththe welfaremetric andthe incomeunit couldbearti cialmeasures,designedtoallowfordifferences in thecomposition of householdsusing adultequivalence scales.Ultimatelythese choices cannotavoidtheuseof value judgements,soitisimportantfor empirical studiestoprovide arangeof clearlydescribed alternative results,therebyallowing readers to make their ownjudgements.Indeed,the results presented belowdemonstratethattheanswertothe question of whetherinequality has risenorfallen in recentyearsdepends cruciallyonthe combinationof welfare metric,incomeunitandadultequivalencescalesused.
Section2.1 begins by briey rehearsingsomebasicfeaturesofinequality comparisonsinvolving Lorenzcurves andthe valuejudgementssummarised by atypeofsocial welfarefunction. Section2.2 describesthe inequality measures used,namelytheAtkinson andGinimeasures, payingparticular
1The‘well’ in thenameofthemodelcomesfromIvanTuckwell, whocontributed greatly totaxand bene tmodellingin theNewZealand Treasury.
2Furthermore,noattempt is made to allowfor changes overtimesuchasthe introductionofnewcommodities,orrelativepricechanges whichmay have differentialimpactsondifferent income groups.
attentiontothe valuejudgements involved.The implicationsofincluding zero valuesinthedistributionsare alsoexamined briey. Section2.3 describestherangeofdistributionsexamined,distinguished by welfare metric andincomeunit. Theoften-neglected valuejudgementsinvolved in choosing alternativeunitsarediscussed.
Thedata andconstruction of alternative distributions areexplained in Section 2.4.Inequalitymeasures forNew Zealand in 2007, 2010 and2011are comparedin Section 2.5. Theperiodfrom2007to2010covers years which maybethought to be substantiallyaffected by theglobal nancial crises. However,there werefew changes in thetaxstructure.Major reformstook placein2010,so comparisons involving2011 areofinterest. Thesensitivity of resultstothe assumptionregardingeconomies of scale within households isexaminedinSection2.5. Adecompositionofinequalitychangesintopopulationandtaxstructure changes is presented in Section2.6.Inviewofthe timing of thetax reforms, theempiricaldecompositionsareexaminedforthe period 2007to2011.
2.1ValueJudgements andLorenzCurves
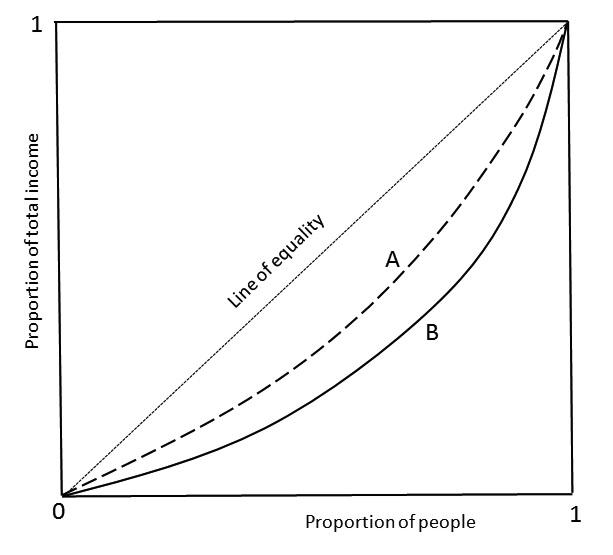
Themost widely-used graphical device usedtocompare relativeinequality (amongincomeunitsregardedashavingnorelevantnon-incomecharacteristics) isthe Lorenzcurve. Withallincomes orderedfromlowestto highest, thisplotsthecumulativeproportionoftotalincomeagainstthecorresponding cumulative proportion of people. Henceconcern is withrelativeinequality, so that theunitsofmeasurement of incomes(andhencethe arithmetic means)areirrelevant. Considerthetwo LorenzcurvesshowninFigure2.1, where distribution Alies everywhere insidethatof distribution B.That is, A’scurveisclosertotheupward slopingdiagonallineofequalitywhich arisesifall incomesare equal. DistributionA is saidto‘Lorenzdominate’ distributionB.
Further insightwasprovided by Atkinson (1970), whopointedout that theintuitive judgement that distributionA is unequivocallylessunequalthan distributionB is consistentwiththe valuejudgementexpressed by the‘principleoftransfers’.3 Thisprinciple is theinequality-dislikingvalue judgement which takesthe view(againin thecontextofhomogeneousunits)that an incometransferfroma richerto apoorer unit, whichleavestheirrelative rank unchanged,reducesinequality. That is,itispossibletomovefrom distribution BtodistributionA by aseries of transfers,eachofwhich satis esthe principle of transfers. Faced withthedesiretocomparerelativeinequality, it is thereforeusefulto beginsimplybyexaminingLorenzcurvestosee if this kindofdominanceapplies. However, in practice –and certainlyinthecase ofthe distributions comparedinthischapter –suchdominanceresultsare rarely available,and itis necessary to make additional valuejudgements.
One waythatdistributions canbemorewidely evaluated involvestheuse
of asocial welfarefunction, expressingexplicitlythe valuejudgementsimposed in makingcomparisons.For adistribution ,for =1,suppose theevaluationfunction– representing thevalue judgementsofan independent judge– takesthe form, P =1 (),where () is afunctionrepresenting thecontributionof individual ’sincometo . 4 Thebasicvalue judgementsshared by alljudgeswhose functions take this form arethat evaluations areindividualistic,additiveand Paretean (such thatanimprovementforanyoneunit,withnounits beingworseoff,isjudgedtoincrease ). Furthermore,if () is concave,sothatthe slopeofthe functionfalls as increasesand for , ()
( ) .Thisadditional assumptionreectsadherencetotheprinciple oftransfers (a rank-preserving transferfrom to mustincrease ), where thedegreeofconcavityreects theextent of aversiontoinequality.Atkinson(1970)alsoestablishedthat, if the twodistributionshave thesamearithmetic mean income,all functions ofthisgeneral kind wouldjudge distribution AtobesuperiortoB,inthat it givesahigher valueof ,aswellasbeingmoreequal.Thisresultis trueirrespective ofthepreciseextentofaversiontoinequality.5 If Lorenz dominanceisestablished,alljudgeswhohave thesebasic valuejudgements wouldagreeaboutwhich distribution is preferredtotheother.
Ifthearithmetic meansofthe twodistributions differ, welfare(as opposedpurelyto inequality) comparisonsrequirean explicittrade-off between(looselyspeaking)‘equity andefficiency’. Shorrocks(1983)showed that Atkinson’sresultcan be extendedif,instead of theLorenz curve,the conceptofthe Generalised Lorenzcurve is used.Thisplotstheproductof
4Itistempting tothinkof () asrepresenting a(cardinal)utilityfunction, assumed to be thesameforallindividuals. Thecasewhere ()= (implying no aversiontoinequality) thus correspondstothe‘Classicalutilitarian’ case.However, itisnecessarytothinkof () assimplyrepresentingthe contribution of to , reectingtheindependent judge’sviews.
5Fordetailsand elaborationsforspecialcaseswherefurtherassumptionsregarding valuejudgementscan be usedtoestablishdominance resultswhencurves intersect,seeLambert(1993).
theproportionoftotal income andthearithmeticmeanincomeagainstthe correspondingproportionof people.Thus,theverticalaxis of theLorenz curveis‘stretched’ by an amount dependingonthe arithmetic mean.Itis possible to ndthatdistributionA is moreequal than B, butB is preferred to AifB’s Generalised Lorenzcurveiseverywhere abovethatofA.
As withtheLorenzcurve,dominance resultsare seldomavailable,sothat more structure needstobegiventothewelfare function; that is,morespeci c value judgements needto be speci ed, leadingtoparticularinequality and welfare measures. Theseare discussedinthefollowingSection.Whenmakingcomparisonsbetween pre-taxand post-taxand transferincomesinany period,only inequalitymeasures arerelevant,but whencomparing distributionsovertime, wheremeanincomes areexpectedto change,both inequality andwelfaremeasuresare of concern.
2.2 Inequality Measures
Thissectiondescribestheinequalitymeasuresused below, payingparticular attention to thevalue judgementsassociated witheachmeasure.Itis also necessarytorecognisethatsome ofthedistributions examined have zero incomes.The formulaegivenare forunweighteddistributions,but in practice weights areusedtodeal with boththesample weights(foraggregation to population values) and, insome cases,theunitofanalysis.
TheAtkinson measure, fora relativeinequalityaversion parameterof , is de ned astheproportionaldifference betweenthe arithmeticmeanand the ‘equally distributedequivalent’ income. Themeasureisbasedona social welfarefunction,representingthevaluejudgements of an independent observer,ofthe form:
for = 0 and =1,and incomesof ,for =1
.If =1, then
= 1 P =1 log .The equally distributedequivalent, ,isthat income level which, if obtained by everyunit, givesthe same ‘total welfare’as the actualdistribution;hence isthepower mean:
Thenforarithmetic mean of ,the Atkinson measure, ,is:
(2.3)
From theform in (2.1), it is clearthatthisisa member ofthebroadclassof welfare functionsthatare individualistic, additive,Paretean,and satisfythe principle oftransfers.6 From(2.3), =¯ (1 ),which expressesthe equally distributedequivalent income interms of and .Hencethevalue of correspondingtothedistributioncan be writtenas 1 (1 )= { (1 )}1 (1 ).Thisreects exactly thesame ‘trade-off’between equality, (1 ),and mean income as itself. Hence,thewelfarefunction associatedwiththe Atkinson measurecanbeexpressed in ‘abbreviated’form as =¯ (1 ). 7 Thenature ofthetrade-off is an important implication ofthebasicvalue judgementsunderlying theuseoftheAtkinsonmeasure.
Anydistributionthatisconcernedwithmarket income andincludesnonworkers (and thosewithout other income sources)canhaveincomeunits with zeroincome.In thesecases,caremust be takeninusingand interpreting Atkinsoninequalitymeasures.Toillustrate adifficultyinthepresence of zero values,suppose there are individuals with incomesof [0 1 1 1],so there is only oneunitwith azero valueand therest have equalincomes of
6Itisobviously possibleto modifytheformof () toallow,for example, for constant absoluteinequalityaversionrather thanconstantrelativeaversion,but forconveniencethe latterspeci cationisusedhere.
7Insteadofwriting ,asin(2.1), in termsofall individual incomes, theabbreviatedformisexpressed in termsofsummarymeasuresofthedistribution;see Lambert (1993). Theabbreviatedformisalso convenient to avoid negativevalues of incases where 1.