No part of this publication may be reproduced or transmitted in any form or by any means, electronic or mechanical, including photocopying, recording, or any information storage and retrieval system, without permission in writing from the publisher. Details on how to seek permission, further information about the Publisher’s permissions policies and our arrangements with organizations such as the Copyright Clearance Center and the Copyright Licensing Agency, can be found at our website: www.elsevier.com/permissions
This book and the individual contributions contained in it are protected under copyright by the Publisher (other than as may be noted herein).
Notices
Knowledge and best practice in this field are constantly changing. As new research and experience broaden our understanding, changes in research methods, professional practices, or medical treatment may become necessary.
Practitioners and researchers must always rely on their own experience and knowledge in evaluating and using any information, methods, compounds, or experiments described herein. In using such information or methods they should be mindful of their own safety and the safety of others, including parties for whom they have a professional responsibility.
With respect to any drug or pharmaceutical products identified, readers are advised to check the most current information provided (i) on procedures featured or (ii) by the manufacturer of each product to be administered, to verify the recommended dose or formula, the method and duration of administration, and contraindications. It is the responsibility of practitioners, relying on their own experience and knowledge of their patients, to make diagnoses, to determine dosages and the best treatment for each individual patient, and to take all appropriate safety precautions.
To the fullest extent of the law, neither the Publisher nor the authors, contributors, or editors, assume any liability for any injury and/or damage to persons or property as a matter of products liability, negligence or otherwise, or from any use or operation of any methods, products, instructions, or ideas contained in the material herein.
Library of Congress Cataloging-in-Publication Data
Names: Miller, John M. (John Michael), 1954- author. | Das, Mithilesh K., author. | Zipes, Douglas P., author.
Title: Case studies in clinical cardiac electrophysiology / John Miller, Mithilesh Das, Douglas Zipes.
Description: Philadelphia, PA : Elsevier, [2018] | Includes bibliographical references and index.
Identifiers: LCCN 2016053043 | ISBN 9780323187725 (hardcover : alk. paper)
Classification: LCC RC683.5.E5 | NLM WG 141.5.F9 | DDC 616.1/2075--dc23
LC record available at https://lccn.loc.gov/2016053043
Content Strategist: Maureen Iannuzzi
Senior Content Development Specialist: Janice Galliard
Publishing Services Manager: Catherine Jackson
Project Manager: Kate Mannix
Design Direction: Brian Salisbury
Keenly aware of the time and energy diverted from our families that was required to perform these procedures and assemble the recordings into a form accessible by readers, we dedicate this volume to our beloved wives (Jeanne, Rekha, and Joan), who have allowed us the privilege of putting this work together. We also dedicate this work to the readers, who we hope will benefit from the lessons we have tried to convey, and finally to their patients, who we hope will in turn benefit from their learning.
The practice of clinical cardiac electrophysiology is one of clinical exploration that starts with integration of the patient’s symptoms and cardiac evaluation with electrocardiographic interpretation. One of the most gratifying experiences for patient and physician is when this process culminates in the electrophysiology laboratory with confirmation of the diagnosis and implementation of effective therapy for the arrhythmia with catheter ablation. Mastery of each component is needed, and the knowledge that is gained from each step can be applied to the previous step to refine one’s diagnostic acumen. We became much better electrocardiographers by applying the knowledge gained from the pioneering work that defined cardiac activation patterns and arrhythmia mechanisms using cardiac mapping and programmed electrical stimulation. Expertise in the last step, interventional electrophysiology, is the most challenging to acquire. It requires assimilation of complex patterns of cardiac activation, interpretation of spontaneous changes in patterns, and application of maneuvers to confirm a diagnosis, and this confirmation is critical for guiding catheter ablation.
Drs. Miller, Das, and Zipes have assembled a wonderful book that captures the spirit of clinical exploration leading to effective therapy. They use cases to describe pathophysiologic concepts that start with fundamentals and proceed to complex concepts. From the electrophysiology laboratory they incorporate findings ranging from those that are classic to those that are only recently described and that require a nuanced interpretation and understanding, but that are critical to arriving at the correct diagnosis. Examples include the newest technologies that are now being applied for delineation of arrhythmia mechanisms and substrate.
The authors are renowned teachers who apply their wealth of experience in communicating complex scenarios and concepts to make the cases accessible for the complete range of students of clinical electrophysiology, from the trainee to the advanced practitioner. The cases clarify concepts and provide fundamentals for the new student, but also provide insights that will expand the knowledge of experienced clinicians. Dr Miller’s hand is evident throughout in the superb graphics, for which he is widely known among teachers of cardiology.
One of the amazing aspects of biology, medicine, and certainly extending to cardiac electrophysiology, is the variability that one encounters from patient to patient. After years in the field, one still encounters new arrhythmia problems. A solid basis in understanding mapping and diagnostic maneuvers is required for solving new puzzles in the electrophysiology laboratory, and this learning is acquired from the study of cases. You can never analyze too many cases. I congratulate the authors of Case Studies in Clinical Cardiac Electrophysiology on a wonderful book.
William G. Stevenson, MD Director, Cardiac Arrhythmia Program Cardiovascular Division Brigham and Women's Hospital Professor of Medicine, Harvard Medical School Boston, Massachusetts
The understanding and care of patients with heart rhythm disturbances (clinical cardiac electrophysiology [EP]) has evolved in the last three decades from simple diagnostic studies of the conduction system using a few electrodes, to complex diagnostic and therapeutic procedures involving recording and stimulation from a large number of electrodes, for the purpose of finding and ablating arrhythmogenic tissue. With this dramatic change in the character of EP studies has come the critical need for careful analysis and thorough understanding of the meaning of recordings that are made and results of stimulation in order to achieve optimal results from ablation. At the same time, EP training programs have come under increasing pressure to perform more procedures in a shorter amount of time, resulting in compromising time for careful and methodical study of and learning from these procedures that are rich with teaching material. Although many excellent texts in our field explain the principles of recording and stimulation in treatment of arrhythmias, for example, Clinical Arrhythmology and Electrophysiology, few are structured to show their practical application in a case-study format. In light of this, the purpose of this volume is to take the reader through a representative series of EP procedures from start to finish, evaluating results of diagnostic pacing maneuvers, sampling and comparing characteristics of electrograms, and selection of appropriate sites for ablation. It is our hope that readers will benefit from this mode of presentation, highlighting some of the limitations of techniques that are used on a daily basis, with the aim of improving the efficacy and safety of procedures they perform on their patients.
Acknowledgments
We gratefully acknowledge the role played by our nursing and technical staff with whom we performed the procedures reviewed in this work, as well as electrophysiology fellows, whose patience in keeping catheters in place during long procedures contributed greatly to the quality of the figures. We also acknowledge our patients, who provide a constant source for learning.
Sinus Node and Atrioventricular Conduction Disease 1
Case Presentation
A 56-year-old man experienced syncope while walking at work. Coworkers called emergency medical services (EMS). Upon the arrival of EMS, he was awake and feeling normal but was convinced to go to the emergency room (ER). The patient had a history of anterior wall myocardial infarction (MI), percutaneous coronary intervention (PCI), to left anterior descending coronary artery (LAD) several years before, and a negative stress test within the last 6 months. Examination results were normal except for obesity. ECG showed sinus rhythm, long PR, right bundle branch block (RBBB), left anterior fascicular block (LAFB), and anterior scar. Echocardiogram revealed ejection fraction (EF) 40% and anterior hypokinesis. The patient was referred for electrophysiology (EP) study.
Baseline ECG
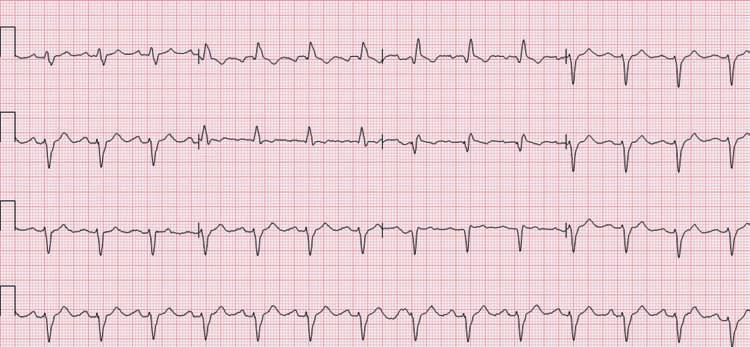
The ECG in Fig. 1-1 shows sinus rhythm with a prolonged P wave (left atrial abnormality), slightly prolonged PR interval, RBBB and left anterior fascicular block, and an extensive anterior infarction. On the basis of this, there are many possible causes of syncope—atrial arrhythmias (atrial flutter and fibrillation, other reentrant atrial tachycardias), heart block (either in AV node or His-Purkinje system), or ventricular arrhythmia (ventricular tachycardia or fibrillation). There is nothing in the ECG to favor one cause of syncope over another, and because treatment strategies are very different depending on the cause (medications or ablation for atrial arrhythmias; pacemaker for heart block; implantable defibrillator for ventricular arrhythmias), further investigation is needed.
Figure 1-1
1-2
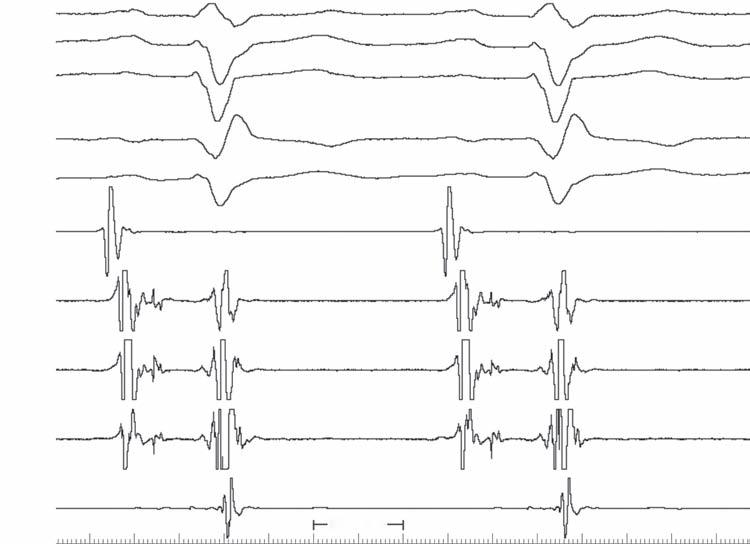
Intracardiac recordings during sinus rhythm (Fig. 1-2) show atrial (A), His (H), and ventricular (V) recordings as noted. This confirms the presence of His-Purkinje disease, with an HV interval of 85 ms—prolonged (normal, 40 to 55 ms), but not enough to implicate His-Purkinje dysfunction as a cause of heart block. Surprisingly, though the PR interval is somewhat prolonged, the AH interval is normal (85 ms [normal, 60 to 125 ms]). Usually, prolongation of the PR interval is caused by the AV nodal (AH) component, because to prolong the PR even 60 ms from His-Purkinje disease would require a lengthening of the HV to a degree (that is, from 40 ms to 100 ms) that 1:1 conduction would be unlikely. Note also that there is a delay between the distal His recording and right bundle branch (RBB)—there is usually ,10 ms between these—and that the RBBB is further caused by delay or block between the RBB and RV apical electrogram, with a QRS onset (dashed blue line) to RV electrogram of 75 ms (normal, 10 to 35 ms).
1-3
Baseline Intracardiac Recordings
Sinus Rhythm And Ventricular Pacing
Figure
Figure
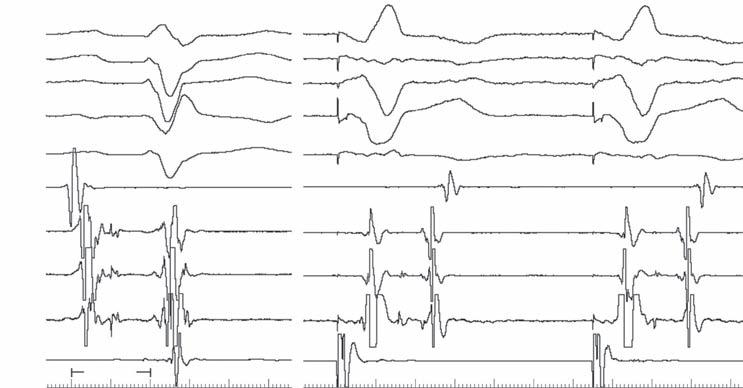
The left side of Fig. 1-3 shows a sinus rhythm complex as in the previous figure for reference, whereas the 2 complexes on the right are during pacing from the right ventricular apical region. Note that there is retrograde conduction to the atria, with the His bundle activated from distal to proximal as expected. Usually, the timing of the His potential is before the local ventricular electrogram in the His recoding, because conduction proceeds more rapidly up the RBB to the His than does muscle-to-muscle propagation from apex to base. Because there is RBBB in this case, the impulse cannot ascend the RBB as it normally would and instead must traverse the interventricular septum, enter the left bundle branch, and then activate the His retrogradely. These findings just confirm the His-Purkinje disease but give no further insight as to the cause of syncope.
Retrograde His-Purkinje Conduction
As illustrated in Fig. 1-4, in patients with normal His-Purkinje function (at left), pacing from the right ventricular apex (red circle) results in retrograde conduction over the RBB (white line) that is more rapid than muscle-to-muscle conduction (wavy line in septum), resulting in a His potential (H) inscribed before the larger local ventricular recording (V). At right, in the presence of anterograde RBBB, the paced wavefront cannot ascend the blocked right bundle and instead crosses the interventricular septum (wavy horizontal line) to engage the left bundle, and then proceeds rapidly to the His that now appears after the local ventricular recording (that is again generated after muscle-to-muscle spread).
Normal
RBBB
LBB RBB
LBB
Figure 1-4
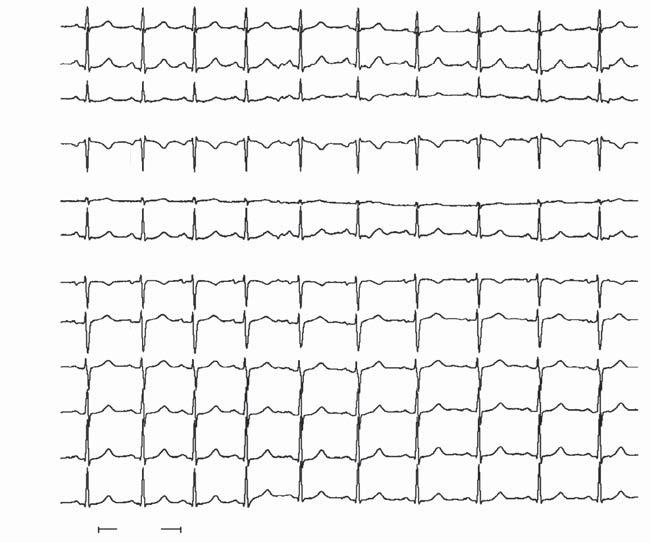
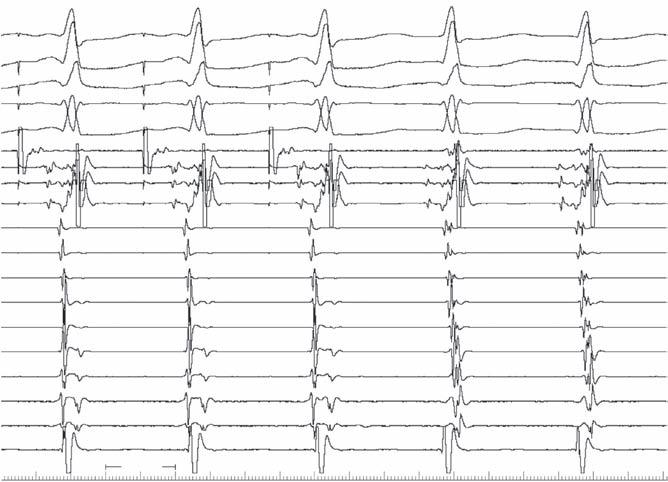
Rapid pacing can often reveal abnormalities of AV conduction that were not very evident at rest. In Fig. 1-5, pacing the atrium (S) slightly faster than the sinus rate shows minimal change in either AH (90 ms) or HV (85 ms) intervals. It is useful to display multiple electrode pairs of His recordings because the signal amplitude may vary enough between complexes that the His potential may be poorly visible or even absent in one electrode pair (Hisdist in this case), whereas it is readily visible in other electrode pairs.
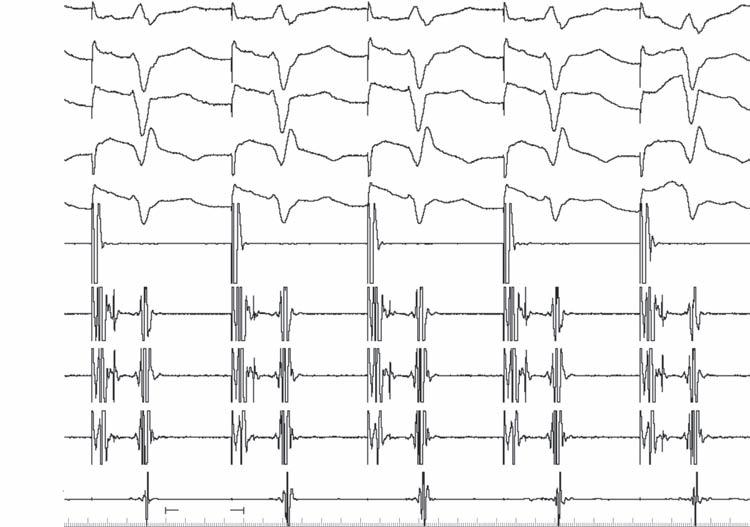
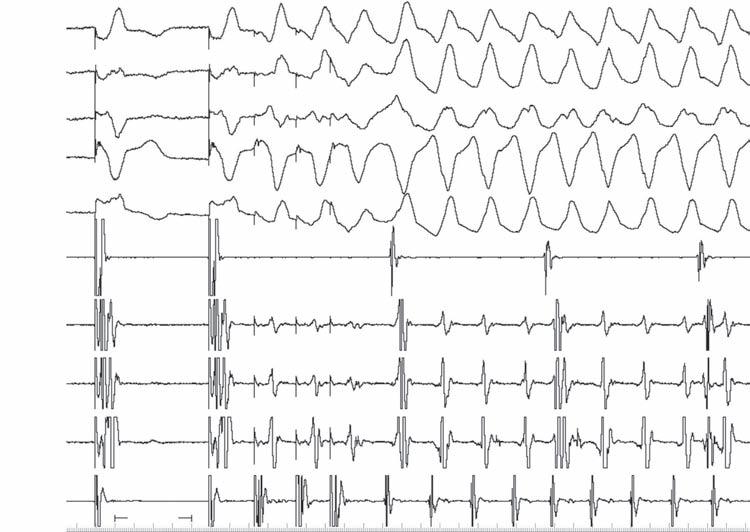
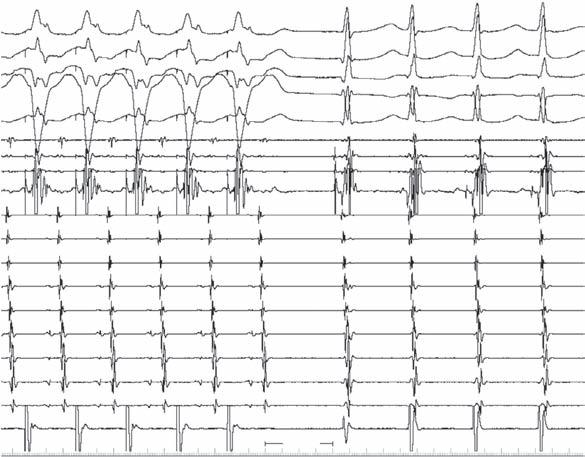
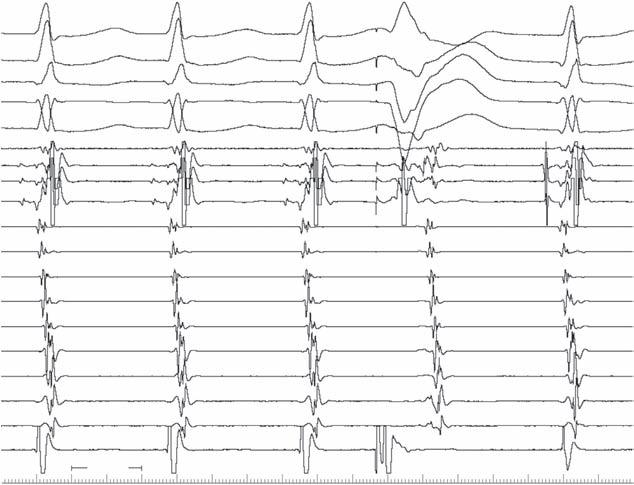
More rapid pacing starts to reveal some abnormalities. As the pacing rate increases (cycle length decreases), the AH is expected to prolong but the HV interval usually remains constant. In Fig. 1-6, the AH (in blue) does prolong, but so does the HV interval (in green). The asterisk denotes where AV nodal block occurs (no subsequent His potential), but three cycles after this, there is a His potential not followed by a QRS (infra-His block; green dash)
Figure 1-5
Figure 1-6
and the HV intervals on the prior two cycles had prolonged (thus, infra-His Wenckebach). This is distinctly abnormal and likely warrants pacemaker implantation. However, this may not be the reason that syncope had occurred (there may be other abnormalities that have not yet been uncovered during the study). Atrial Pacing
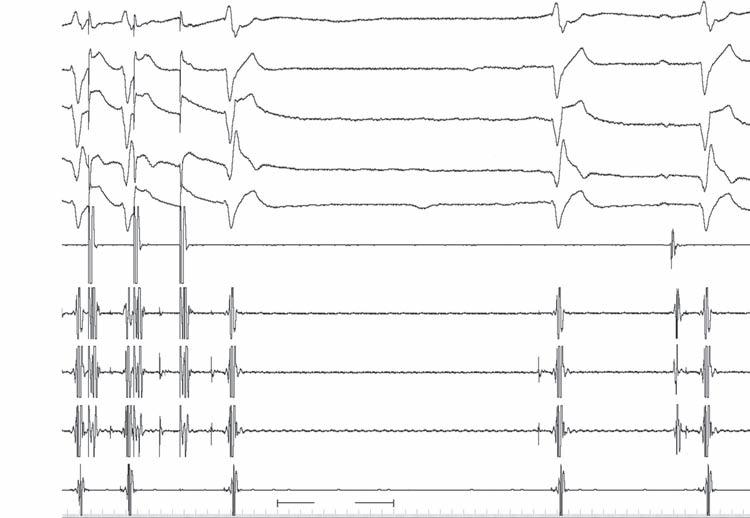
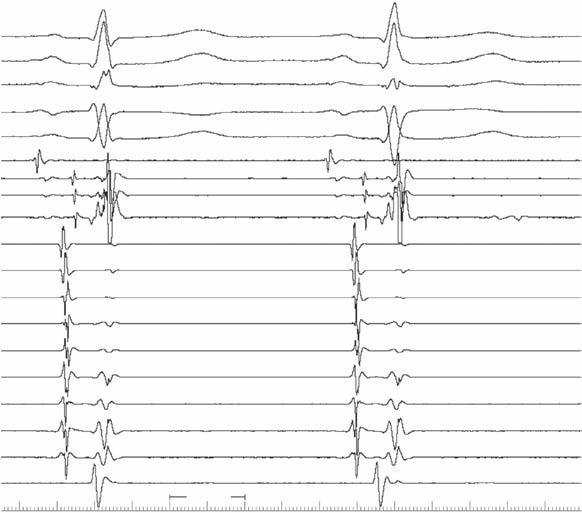
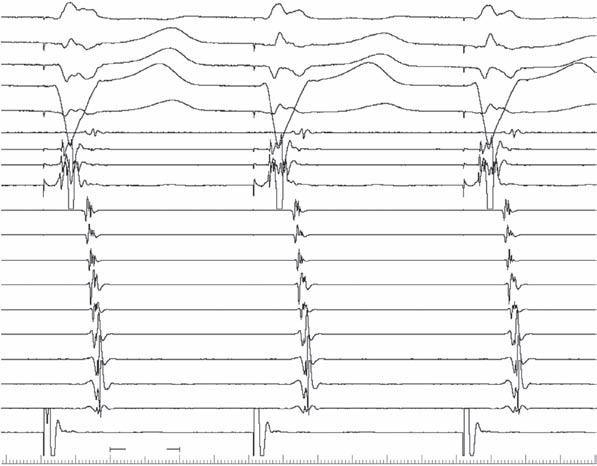
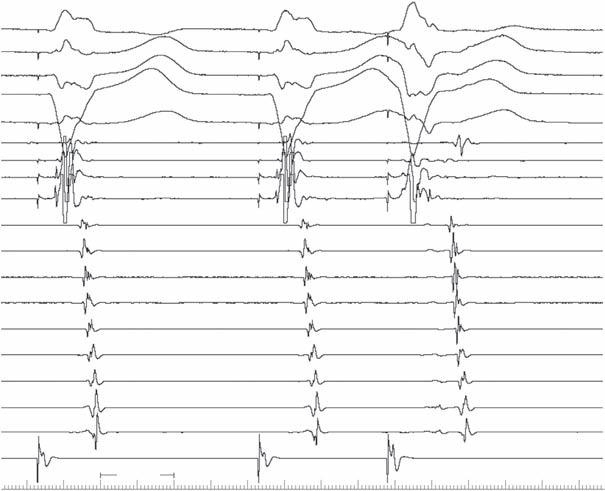
In Fig. 1-7, pacing is repeated for 1 min at the same cycle length as shown in the prior figure to stress the sinus node. Upon cessation of pacing, a prolonged sinus pause (4.15 seconds) is observed; a junctional escape complex occurs after 3 seconds. This is another potential cause of syncope (sinus node dysfunction).
Figure 1-7
1-8
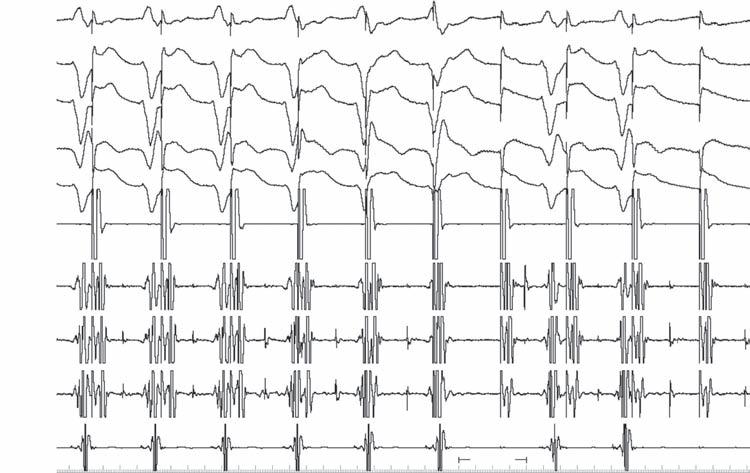
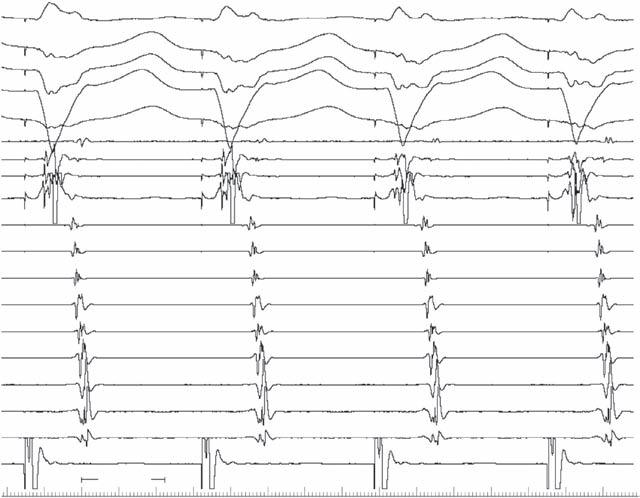
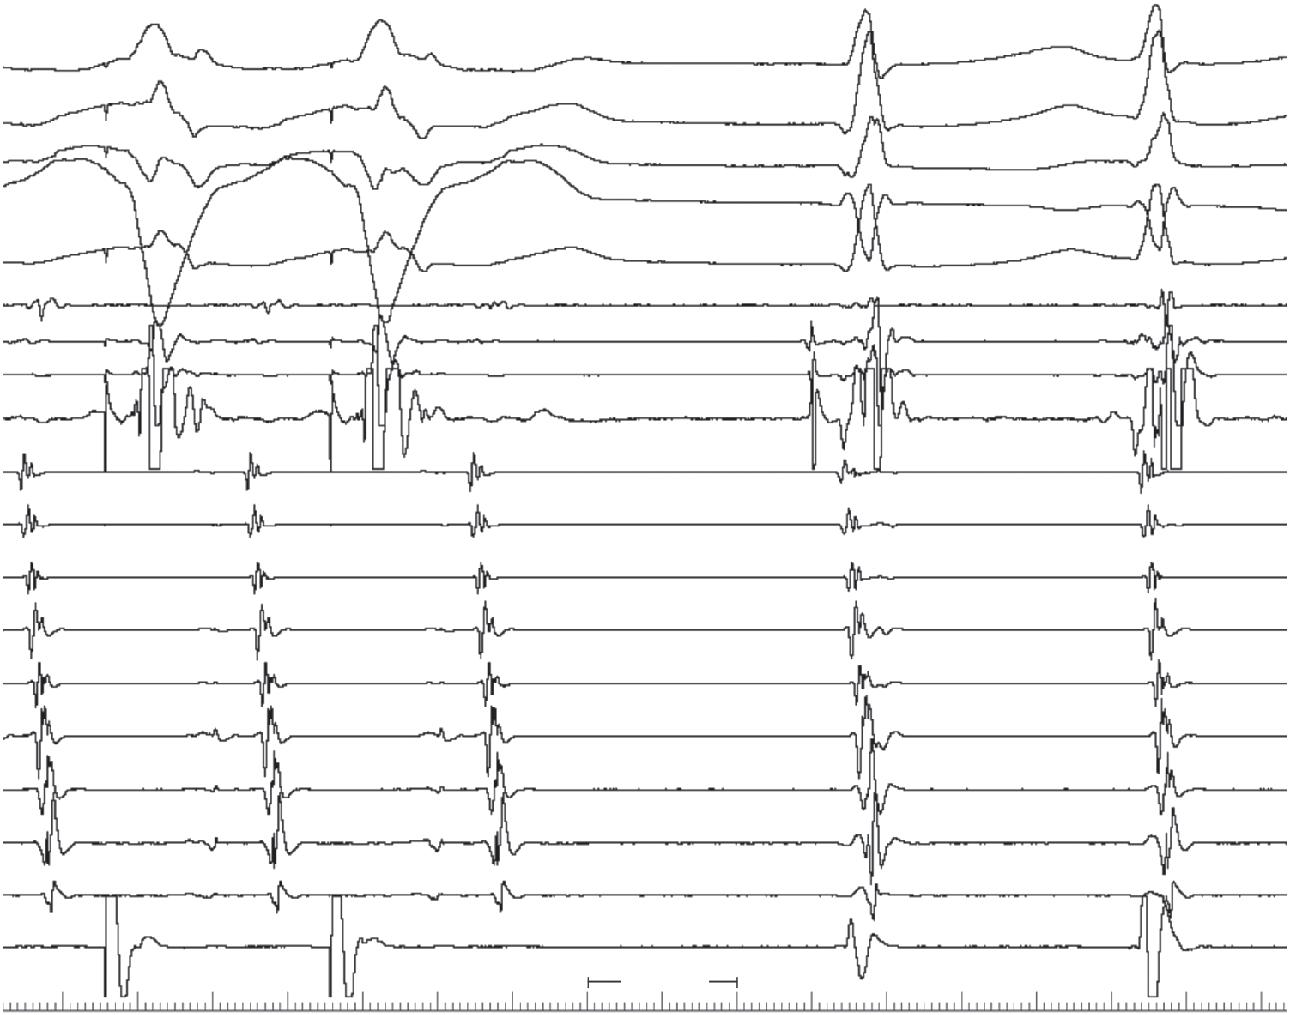
Turning to the ventricles (Fig. 1-8), slow ventricular pacing again shows that there is retrograde conduction; the first and last atrial complexes are sinus in origin (HRA before His atrial recordings) but the middle three complexes are retrogradely conducted. The first two of these (blue arrows) are over the fast pathway, but after the fourth ventricular stimulus, the ventriculoatrial interval suddenly increases, signifying a switch to a slow pathway (red arrow). Immediately after this, there is a QRS complex that is not fully paced (asterisk); this is because of fusion between the paced wavefront and one over the normal conduction system (see His potential). This is the result of an atypical AV nodal echo (retrograde slow pathway, anterograde fast—blue arrow). This is a common finding and, unless accompanied by sustained atypical AV nodal reentrant SVT, has no relevance for the diagnosis of syncope.
1-9
Figure
Figure
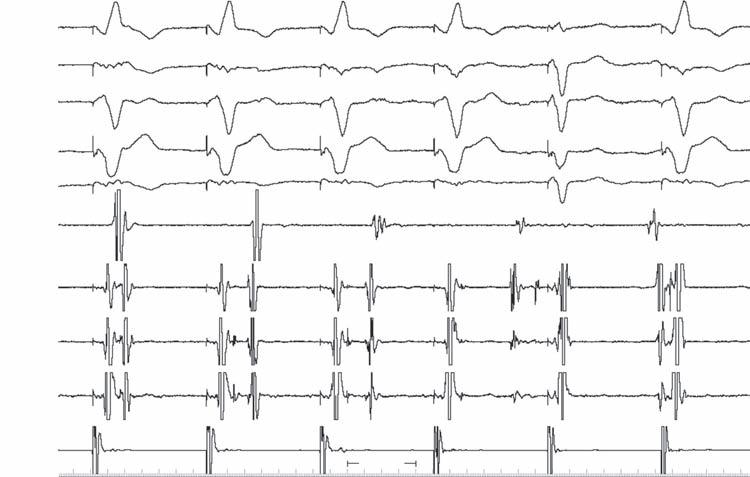
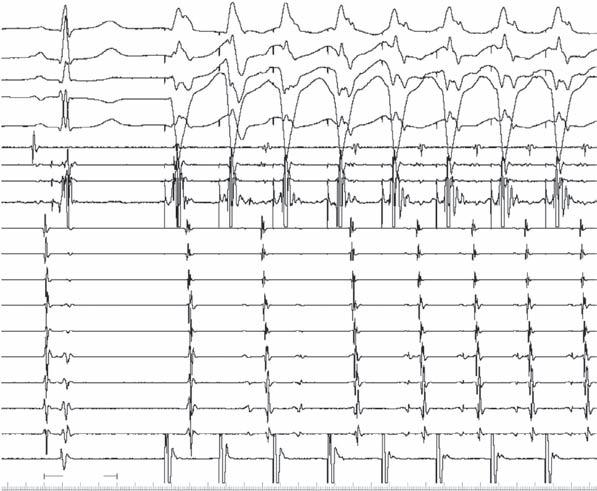
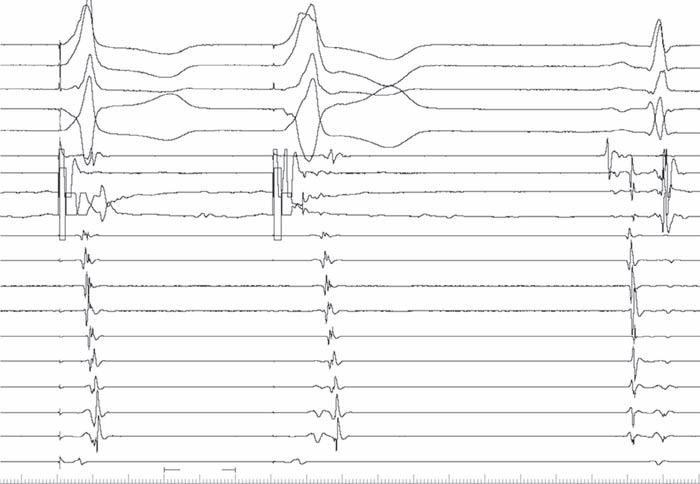
The last part of the syncope evaluation consists of programmed ventricular stimulation. As shown in Fig. 1-9, standard stimulation (here, with triple extrastimuli, S2 to S4) initiates a rapid, hemodynamically unstable ventricular tachycardia (CL 250 ms) that stopped spontaneously after 15 seconds. Given the presence of a prior MI and “serious” syncope, this arrhythmia was deemed a reasonable candidate for the cause of his syncope. He received a dual-chamber ICD later that day. Note that a His potential is seen on occasion but not with every complex—excluding bundle branch reentry as a possible cause of the tachycardia (SA 5 atrial stimulus).
Summary
n This man had syncope in the presence of structural heart disease—which always needs further evaluation.
n Multiple potential causes of syncope may be present in the same patient; in this case, n Sinus node dysfunction
n His-Purkinje dysfunction
n Ventricular tachycardia
n Judgment must be used to determine which possible cause(s) of syncope should be treated and how.
A 48-year-old woman had a history of palpitations for ~5 years. Her episodes started and stopped suddenly, lasted 1 to 2 minutes, and were associated with lightheadedness. She came to a local emergency room with a prolonged episode: ECG showed a narrow QRS tachycardia (by report; no ECG available) that was terminated with adenosine. She was treated with oral diltiazem and metoprolol but continued to have supraventricular tachycardia (SVT) episodes. She had a normal physical exam; non-invasive evaluation showed no structural heart disease. She was referred for catheter ablation of her SVT.
Baseline ECGs and Intracardiac Recordings
Baseline ECG
Fig. 2-1 demonstrates normal sinus rhythm without delta waves, fractionation, or prolongation of the P wave or QRS and normal QT. ECG is normal.
2-1
Figure
2-2
V1
V6
HRA
Hisprox
Hisdist
CSprox
CSmid
CSdist RV
Baseline Intracardiac Recording
Fig. 2-2 shows normal intracardiac intervals (AH, HV); there is no evidence of preexcitation on intracardiac recordings. Normal progression of atrial activation is seen from right atrium to His to coronary sinus proximal to distal.
Ventricular Pacing
Ventricular Pacing (600 ms)
2-3
HRA
Hisprox V1 V6
Hisdist
CSprox
CSmid
CSdist RV S S S
In Fig. 2-3, with ventricular pacing at 600 ms, retrograde conduction is present with a concentric activation pattern; a retrograde His potential (arrow) is seen between stimulus artifact and local ventricular electrogram.
Figure
Figure
HRA
Hisprox
Hisdist
CSprox
CSmid
CSdist RV
Ventricular Pacing (470-460 ms)
With more rapid ventricular pacing (470–460 ms) the same activation sequence is seen in Fig. 2-4, with a longer VA interval—most consistent with AV nodal conduction. 1 S S S S 200 ms 2
Ventricular Pacing (280 ms)
CSdist
In Fig. 2-5, with the sudden onset of ventricular pacing (280 ms), a His “out the back” (arrow) is seen after second stimulus, with atrial activation dependent on His (ie, no bypass tract). Retrograde block occurs after the third stimulus likely because of block in the His-Purkinje system, which recovers by the fourth stimulus (after which 1:1 retrograde conduction resumes).
Figure 2-4
Figure 2-5
ECGs Compared
2-6
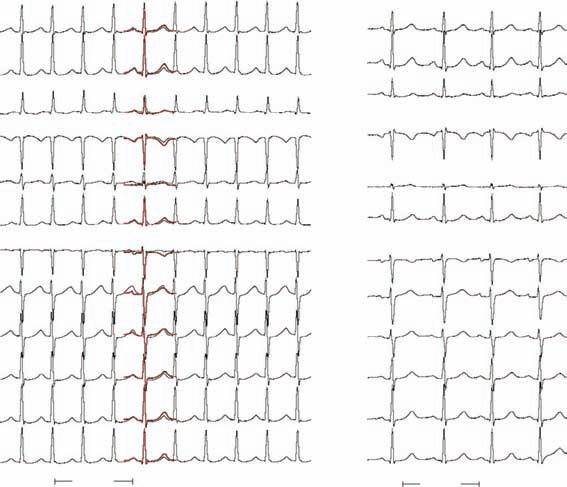
SVT was induced ((left); sinus rhythm is shown at right in Fig. 2-6. A superimposed sinus complex (red) overlaid on SVT shows no clear difference, implying that the P wave must be hidden within the QRS complex.
Ventricular Pacing in SVT
Hisprox
Hisdist
2-7
Ventricular Pacing
In Fig. 2-7, ventricular pacing during SVT conducts retrogradely to atrium with the same activation pattern as during SVT. During SVT that resumes on cessation of pacing, atrial activation appears concentric and within (even before) the QRS complex, excluding orthodromic SVT. The long pause after pacing suggests conduction down an AV nodal slow pathway. The “VAV” response is consistent with typical atrioventricular nodal reentry (AVNRT), not atrial tachycardia (AT).
Figure
Figure
Hisdist CSprox
CSmid
CSdist RV
Ventricular Pacing
Fig. 2-8 is a faster sweep speed of Fig. 2-7, showing the same findings.
Para-Hisian Pacing
Para-Hisian Pacing 1 2 3
2-8
HRA
Hisprox V1 V6
Hisdist CSprox
CSmid
The complex at right of Fig. 2-9 shows a normal sinus complex. The complex in middle has a wide QRS suggesting pure ventricular capture. Retrograde conduction is evident. The complex at left is relatively narrow, indicating some element of His capture, though not pure His capture (His 1 V capture); retrograde conduction is evident with the same pattern as during the wider complex and S-A interval is 90 ms; in the wide complex (V capture only), the S-A interval is 210 ms, indicating conduction only over AV node. The retrograde His is visible (H), with HA still 90 ms.
2-9
Figure
Figure
Ventricular Extrastimuli in Sinus Rhythm
V1
V6
HRA
Hisprox
Hisdist
2-10
CSprox
CSmid
CSdist RV
Ventricular Extrastimuli
A single ventricular extrastimulus at a drive of 600 ms is shown in Fig. 2-10. A retrograde His (blue arrow) is seen before the local ventricular electrogram on drive complexes, whereas the His is “out the back” (red arrow) after the extrastimulus complex, as a result of block in the right bundle branch with transseptal conduction to and then up the left bundle to the His. If this relationship (atrial activation dependent on prior His activation) remains constant over a range of coupling intervals, a bypass tract is excluded.
Ventricular Extrastimuli in SVT
Figure 2-11
V1
V6
HRA
Hisprox
Hisdist CSprox
CSmid
CSdist RV
In Fig. 2-11, a ventricular extrastimulus is given during SVT. The A-A interval surrounding the extrastimulus is shorter than the rest of the A-A intervals, but the His was not refractory (blue arrow
PVC in SVT
Figure
shows where it would be expected if not for the extrastimulus). Advancement of the timing of atrial activation surrounding a His-refractory ventricular extrastimulus demonstrates the existence of a path of conduction extrinsic to the normal conduction system (bypass tract). If the extrastimulus occurs at a time when the His is not refractory (as here), it is feasible that conduction could occur through the His to the AV node and atrium, and would not implicate a bypass tract.
Atrial and Ventricular Pacing and Extrastimuli During SVT
Atrial Overdrive During SVT
CSmid
CSdist
Overdrive atrial pacing during SVT is shown in Fig. 2-12. At first glance, the third QRS complex appears to result from the third stimulus. On closer inspection, it is clear that the third stimulus causes the fourth QRS complex because the V-V interval there is the same as the paced cycle length (350 ms). This indicates the presence of slow AV nodal conduction (no surprise, because this type of AV nodal reentry uses an anterograde slowly conducting pathway).