Overview of the Circulation and Blood
OBJECTIVES
1. Describe the general structure of the cardiovascular system.
2. Compare the compositions and functions of the blood vessels.
3. Compare the relationship of the vascular cross-sectional area to the velocity of blood flow in the various vascular segments.
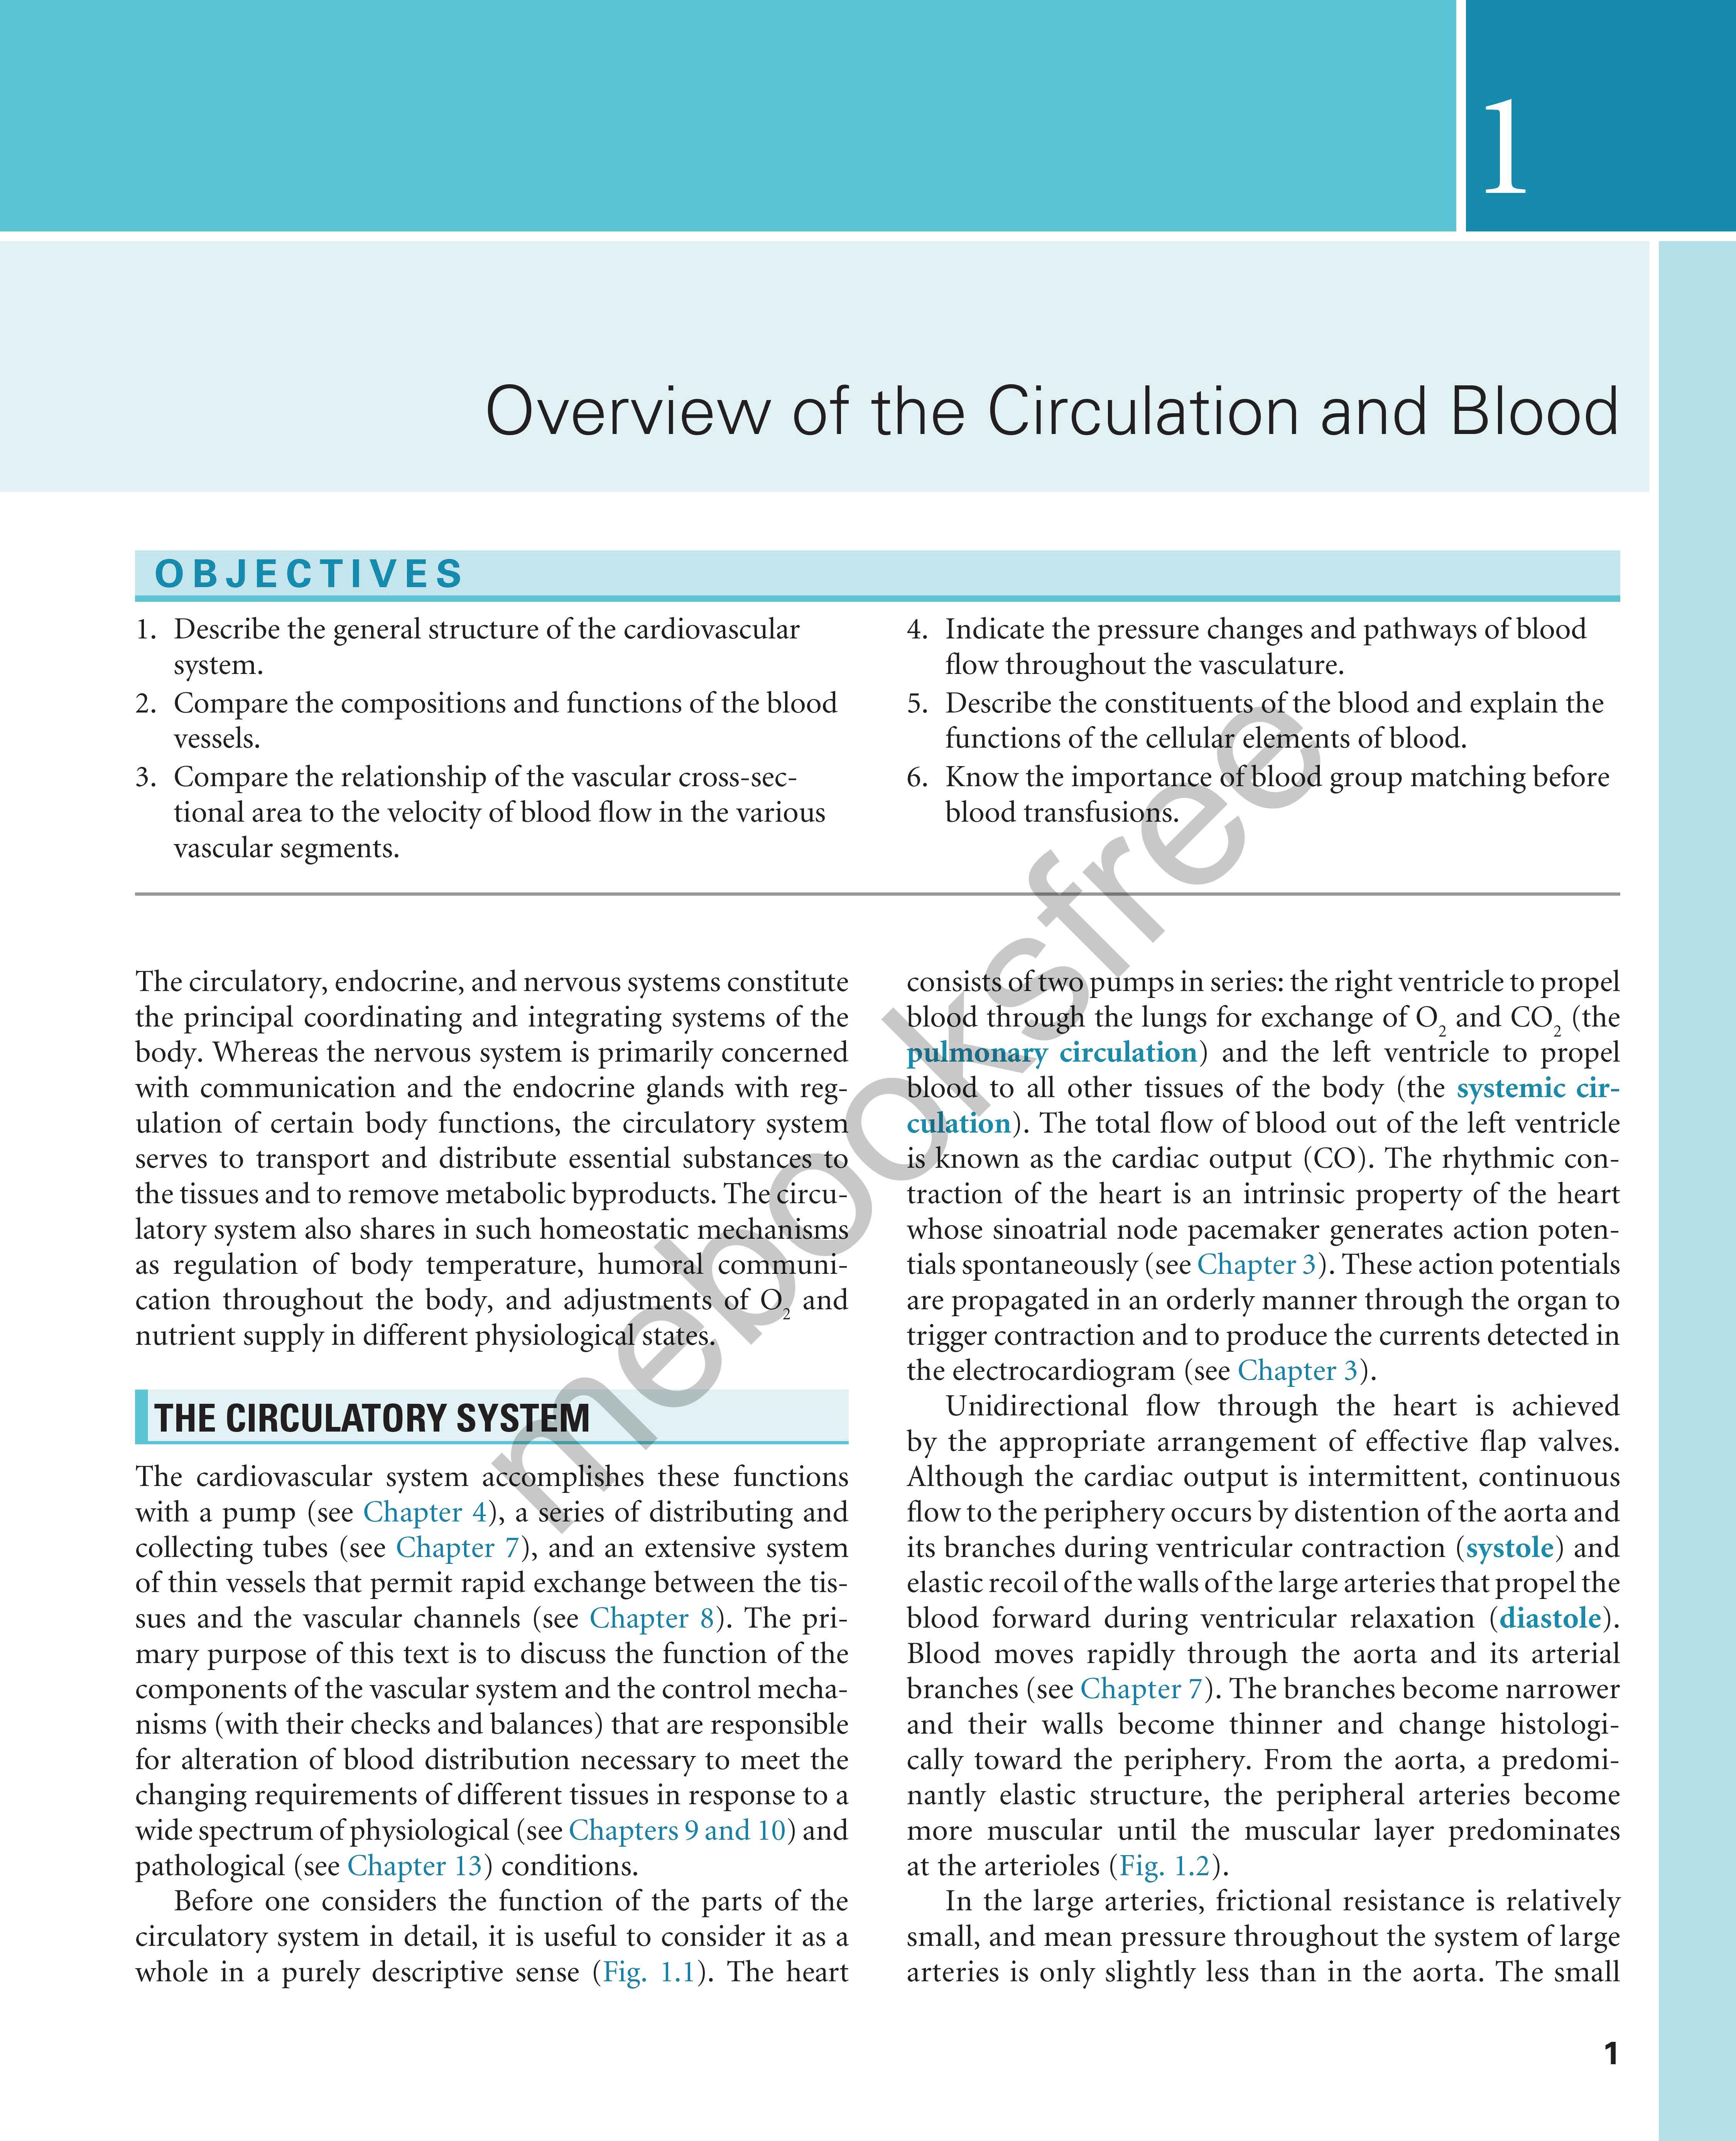
The circulatory, endocrine, and nervous systems constitute the principal coordinating and integrating systems of the body. Whereas the nervous system is primarily concerned with communication and the endocrine glands with regulation of certain body functions, the circulatory system serves to transport and distribute essential substancF to the tissues and to remove metabolic byproducts. The circulatory system also shares in such homeostatic mechanisms as regulation of body temperature, humoral communication throughout the body, and adjustments of 0 2 and nutrient supply in different physiologica1 states.
4. Indicate the pressure changes and pathways of blood flow throughout the vasculature.
5. Describe the constituents of the blood and explain the functions of the cellula elements of blood.
6. Know the importance 0f blooa. group matching before blood transfusions.
The cardiovascular system accomp ishes these functions with a pump (see Chapter 4 ), a sec·es of distributing and collecting tubes (see Chapter 7 ), and an extensive system of thin vessels that permit rapid exchange between the tissues and the vascular channels (see Chapter 8 ). The primary purpose of this text is to discuss the function of the components of the vascular system and the control mechanisms (with their checks and balances) that are responsible for alteration of blood distribution necessary to meet the changing requirements of different tissues in response to a wide spectrum of physiological (see Chapters 9 and 10 ) and pathological (see Chapter 13 ) conditions.
Before one considers the function of the parts of the circulatory system in detail, it is useful to consider it as a whole in a purely descriptive sense ( Fig. 1. 1) . The heart
consists of two pumps in series: the right ventricle to propel blood througH the lungs for exchange of 0 2 and CO 2 (the p u l mona ry circulation ) and the left ventricle to propel blood to all other tissues of the body (the systemic circul ation ) . The total flow of blood out of the left ventricle is known as the cardiac output (CO). The rhythmic contraction of the heart is an intrinsic property of the heart whose sinoatrial node pacemaker generates action patentials spontaneously (see Chapter 3 ). These action potentials are propagated in an orderly manner through the organ to trigger contraction and to produce the currents detected in the electrocardiogram (see Chapter 3 ).
Unidirectional flow through the heart is achieved by the appropriate arrangement of effective flap valves. Although the cardiac output is intermittent, continuous flow to the periphery occurs by distention of the aorta and its branches during ventricular contraction (systole ) and elastic recoil of the walls of the large arteries that propel the blood forward during ventricular relaxation (diastole ). Blood moves rapidly through the aorta and its arterial branches (see Chapter 7 ). The branches become narrower and their walls become thinner and change histologically toward the periphery. From the aorta, a predominantly elastic structure, the peripheral arteries become more muscular until the muscular layer predominates at the arterioles ( Fig. 1.2 ).
In the large arteries, frictional resistance is relatively small, and mean pressure throughout the system of large arteries is only slightly less than in the aorta. The small
Veins Ar teries
Venules
Capillaries
Arm ar teries
Pulmonar y ar ter y
Right atrium
Venae cavae
Right ventricle
Hepatic vein
Peritubular capillaries
Ar terioles
Head and neck ar teries
Pulmonar y veins
Bronchial ar teries
Aor ta Left atrium
Left ventricle
Coronar y ar teries
Splenic ar tery
Trunk ar teries
Hepatic ar tery
Por tal vein
Mesenteric ar teries
Ef ferent ar terioles
Glomeruli
Pelvic ar teries
Renal ar teries
Af ferent ar terioles
Leg ar teries
Fig. 1.1 Schematic diagram of the parallel and series arrangement of the vessels composing the circulatory system. The capillary beds are represented by thin lines connecting the arteries (on the right) with the veins (on the left) The crescent-shaped thickenings proximal to the capillary beds represent the arterioles (resistance vessels). (Redrawn from Green, H. D. (1944). In O. Glasser (Ed.). Medical physics (Vol 1); Chicago: Mosby-Year Book.)
arteries and arterioles serve to regulate flow to individual tissues by varying their resistance to flow. The small arteries offer moderate resistance to blood flow, and this resistance reaches a maximal level in the arterioles, sometimes referred to as the stopcocks of the vascular system. Hence the pressure drop is significant and is greatest in the small arteries and in the arterioles (Fig. 1.3). Adjustments in the degree of contraction of the circular muscle of these small vessels permit regulation of tissue blood flow and aid in the control of arterial blood pressure (see Chapter 9).
In addition to a sharp reduction in pressure across the arterioles, there is also a change from pulsatile to steady flow as pressure continues to decline from the arterial to the venous end of the capillaries (see Fig. 1.3). The pulsatile arterial blood flow, caused by the phasic cardiac ejection, is damped at the capillaries by the combination of distensibility of the large arteries and frictional resistance in the arterioles.
CLINICAL BOX
In a patient with hyperthyroidism (Graves disease), the basal metabolism is elevated and is often associated with arteriolar vasodilation. This reduction in arteriolar resistance diminishes the dampening effect on the pulsatile arterial pressure and is manifested as pulsatile flow in the capillaries, as observed in the fingernail beds of patients with this ailment.
Many capillaries arise from each arteriole to form the microcirculation (see Chapter 8), so that the total cross-sectional area of the capillary bed is very large, despite the fact that the cross-sectional area of each capillary is less than that of each arteriole. As a result, blood flow velocity becomes quite slow in the capillaries (see Fig. 1.3), analogous to the decrease in velocity of flow seen at the wide regions of a river. Conditions in the capillaries are ideal for the exchange of diffusible substances between blood and tissue, because the capillaries are short tubes whose walls are only one cell thick and because flow velocity is low.
On its return to the heart from the capillaries, blood passes through venules and then through veins of increasing size with a progressive decrease in pressure until the blood reaches the vena cava (see Fig. 1.3). As the heart is approached, the number of veins decreases, the thickness and composition of the vein walls change (see Fig. 1.2), the total cross-sectional area of the venous channels diminishes, and the velocity of blood flow increases (see Fig. 1.3). Note that the velocity of blood flow and the cross-sectional area at each level of the vasculature are essentially mirror images of each other (see Fig. 1.3).
Data indicate that between the aorta and the capillaries the total cross-sectional area increases about 500-fold (see Fig. 1.3). The volume of blood in the systemic vascular system (Table 1.1) is greatest in the veins and small veins (64%). Of the total blood volume only about 6% is in the capillaries and 14% in the aorta, arteries, and arterioles. In contrast, blood volume in the pulmonary vascular bed is about equal between arteries and capillaries; venous vessels display a slightly larger percentage of pulmonary blood volume. The cross-sectional area of the venae cavae is larger than that of the aorta. Therefore the velocity of flow is slower in the venae cavae than that in the aorta (see Fig. 1.3).
Fig. 1.2 Internal diameter, wall thickness, and relative amounts of the principal components of the vessel walls of the various blood vessels that compose the circulatory system. Cross sections of the vessels are not drawn to scale because of the huge range from aorta and venae cavae to capillary. (Redrawn from Burton, A. C. (1954). Relation of structure to function of the tissues of the wall of blood vessels. Physiological Reviews, 34(4), 619–642.)
Blood entering the right ventricle via the right atrium is pumped through the pulmonary arterial system at a mean pressure about one-seventh that in the systemic arteries. The blood then passes through the lung capillaries, where CO2 is released and O2 taken up. The O2-rich blood returns via the four pulmonary veins to the left atrium and ventricle to complete the cycle. Thus in the normal intact circulation the total volume of blood is constant, and an increase in the volume of blood in one area must be accompanied by a decrease in another. However, the distribution of the circulating blood to the different body organs is determined by the output of the left ventricle and by the contractile state of the arterioles (resistance vessels) of these organs (see Chapters 9 and 10). In turn, the cardiac output is controlled by the rate of heartbeat, cardiac contractility, venous return, and arterial resistance. The circulatory system is composed of conduits arranged in series and in parallel (see Fig. 1.1).
It is evident that the systemic and pulmonary vascular systems are composed of many blood vessels arranged in series and parallel, with respect to blood flow. The total resistance to blood flow of the systemic blood vessels is known as the total peripheral resistance (TPR), and the total resistance of the pulmonary vessels is known as the total pulmonary resistance. Total peripheral resistance and cardiac output determine the mean pressure in the large arteries, through the hydraulic resistance equation (see Chapter 7).
The main function of the circulating blood is to carry O2 and nutrients to the various tissues in the body and to remove CO2 and waste products from those tissues.
Furthermore, blood transports other substances, such as hormones, white blood cells, and platelets, from their sites of production to their sites of action. Blood also aids in the distribution of fluids, solutes, and heat. Hence blood contributes to homeostasis, the maintenance of a constant internal environment.
A fundamental characteristic of normal operation of the cardiovascular system is the maintenance of a relatively constant mean (average) blood pressure within the large arteries. The difference between mean arterial pressure (Pa ) and the pressure in the right atrium (P ra) provides the driving force for flow through the resistance (R) of blood vessels of the individual tissues. Thus when the circulatory system is in steady-state, total flow of blood from the heart (cardiac output, CO) equals total flow of blood returning to the heart. The relation among these variables is described in the following hydraulic equation:
The cardiovascular system, together with neural, renal, and endocrine systems, maintains Pa at a relatively constant level, despite the large variations in cardiac output and peripheral resistance that are required in daily life. If the Pa is maintained at its normal level under all circumstances, then each individual tissue will be able to obtain the necessary blood flow required to sustain its functions. Because blood flow to the brain and the heart cannot be interrupted for even a few seconds without endangering life, maintenance of the Pa is a critical function of the cardiovascular system. Endothelium
Pa Pra = CO × R (1.1)
(Pulmonary artery)
15
7
Fig. 1.3 Phasic pressure, velocity of flow, and cross-sectional area of the systemic circulation. The important features are the major pressure drop across the small arteries and arterioles, the inverse relationship between blood flow velocity and crosssectional area, and the maximal cross-sectional area and minimal flow rate in the capillaries (Reproduced with permission of Taylor & Francis from Levick, J. R. (2010). An introduction to cardiovascular physiology, 5th ed. London: Hodder Arnold.)
BLOOD
Blood consists of red blood cells, white blood cells, and platelets suspended in a complex solution (plasma) of various salts, proteins, carbohydrates, lipids, and gases. The circulating blood volume accounts for about 7% of the body weight. Approximately 55% of the blood is plasma; the protein content is 7 g/dL (about 4 g/dL of albumin and 3 g/dL of plasma globulins).
Erythrocytes
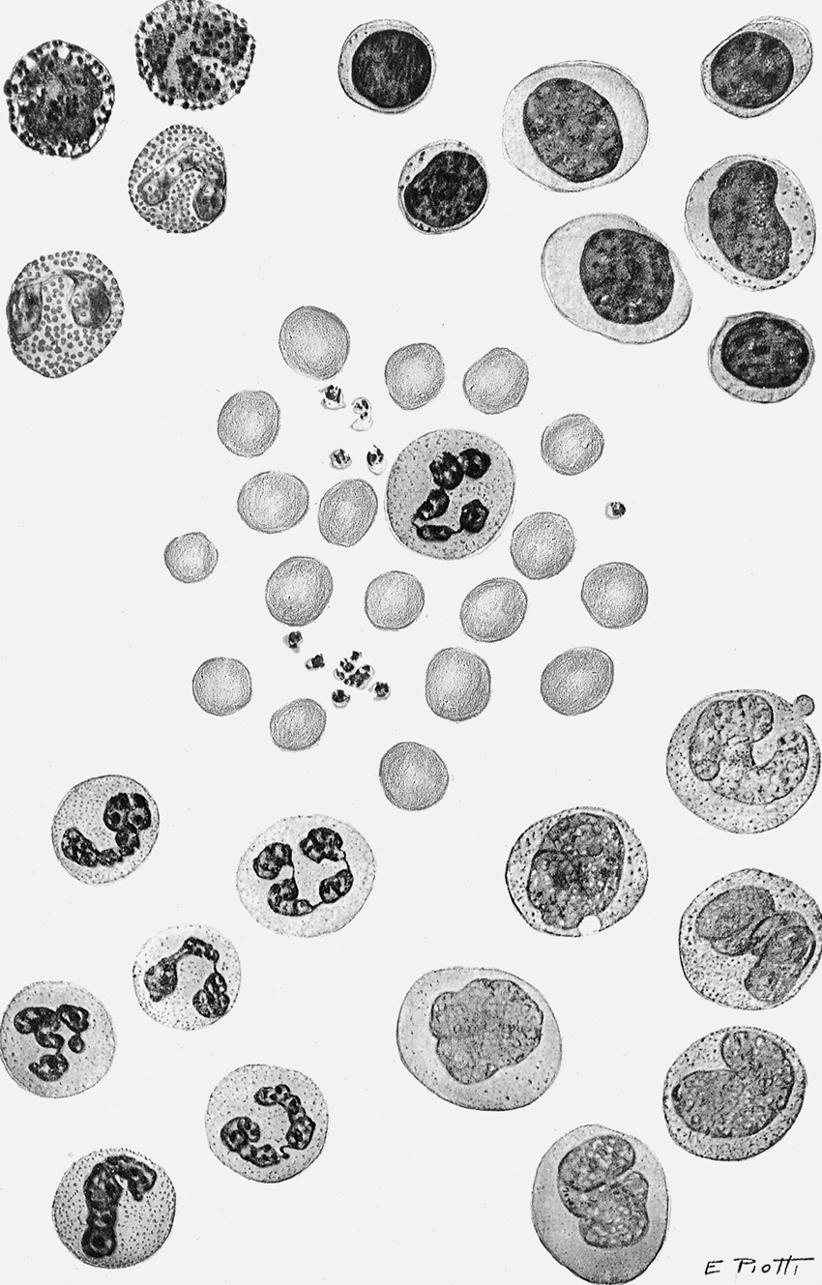
The erythrocytes (red blood cells) are flexible, biconcave disks that transport oxygen to the body tissues (Fig. 1.4). Mammalian erythrocytes are unusual in that they lack a nucleus. The average erythrocyte is 7 μm in diameter, and these cells arise from pluripotential stem cells in the bone marrow. All of the cells in the circulating blood are derived
Aorta LargearteriesResistance vesselsCapillariesVenules VeinsVenacava
from these stem cells. Most of these immature cells develop into various forms of mature cells, such as erythrocytes, monocytes, megakaryocytes, and lymphocytes. The erythrocytes lose their nuclei before they enter the circulation, and their average life span is 120 days. Approximately 5 million erythrocytes are present per microliter of blood. However, a small fraction of the pluripotential stem cells remains in the undifferentiated state.
Hemoglobin (about 15 g/dL of blood) is the main protein in the erythrocytes. Hemoglobin consists of heme, an iron-containing tetrapyrrole. Heme is linked to globin, a protein composed of four polypeptide chains (two α and two β chains in the normal adult). The iron moiety of hemoglobin binds loosely and reversibly to O2 to form oxyhemoglobin. The affinity of hemoglobin for O2 is a steep function of the partial pressure of O2 (Po2)
Vena cava
Vena cava
TABLE 1.1 Distribution of Blood Volume*
*Values apply to a 70-kg woman; increase values by 10% for a 70-kg man.
Data from Boron, W. F., & Boulpaep, E. L. (2016). Medical physiology, 3rd ed. Philadelphia: Elsevier.
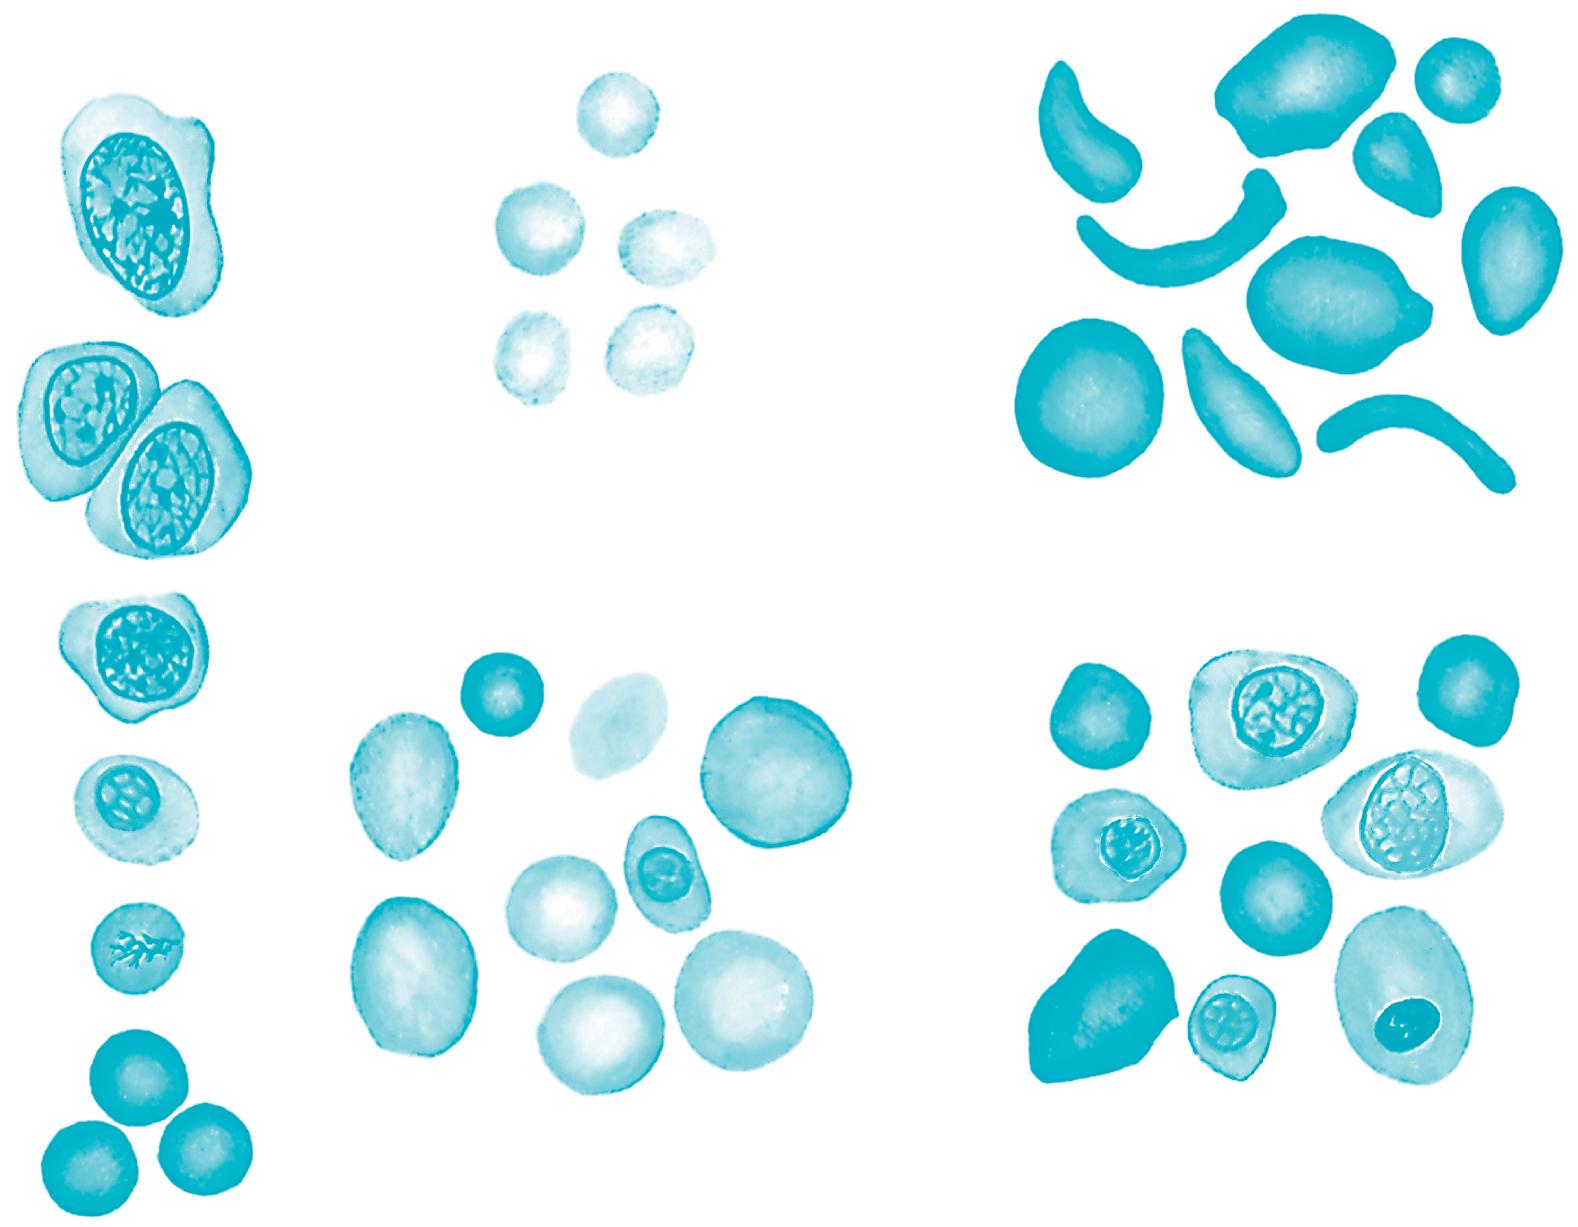
Fig. 1.4 The morphology of blood cells. 1, Normal red blood cell; 2, platelet; 3, neutrophil; 4, neutrophil, band form; 5a, eosinophil, two lobes; 5b, eosinophil, band form; 6a, basophil, band form; 6b, metamyelocyte, basophilic; 7, lymphocyte, small; 8, lymphocyte, large; 9, monocyte, mature; 10, monocyte, young. (From Daland, G. A. (1951). A color atlas of morphologic hematology. Cambridge, MA: Harvard University Press.)
Fig. 1.5 Oxyhemoglobin dissociation curve showing the saturation of hemoglobin as a function of the partial pressure of O2 (Po2) in the blood. Oxygenation of hemoglobin at a given Po2 is affected by temperature and the blood concentration of metabolites, CO2, 2,3-diphosphoglyerate (2,3-DPG), and H+. P50, the partial pressure where hemoglobin is 50% saturated with O2 (From Koeppen, B. M., & Stanton, B. A. (2017). Berne and Levy physiology, 7th ed. Philadelphia: Mosby Elsevier.)
at Po2 less than 60 mm Hg (Fig. 1.5). This allows ready diffusion of O2 from hemoglobin to tissue. The binding of O2 to hemoglobin is affected by pH, temperature, and 2,3-diphosphoglycerate concentration. These factors affect O2 transport particularly at Po2 less than 60 mm Hg.
Changes in the polypeptide subunits of globin affect the affinity of hemoglobin for O2. For example, fetal hemoglobin has two γ chains instead of two β chains. This substitution increases its affinity for O2. Changes in the polypeptide subunits of globin may induce certain serious diseases, such as sickle cell anemia and erythroblastosis fetalis (Fig. 1.6). Sickle cell anemia is a disorder associated with the presence of hemoglobin S, which is an abnormal form of hemoglobin in the erythrocytes. Many of the erythrocytes in the bloodstream of patients with sickle cell anemia have a sicklelike shape (see Fig. 1.6). Consequently, many of the abnormal cells cannot pass through the capillaries and, therefore, cannot deliver adequate O2 and nutrients to the local tissues. Thalassemia is also a genetic disorder of the globin genes; α and β forms exist. In either case, the disorder leads ultimately to a microcytic (small cell), hypochromic (inadequate quantity of hemoglobin) anemia (see upper central panel of Fig. 1.6).
The number of circulating red cells normally remains fairly constant. The production of erythrocytes (erythropoiesis) is regulated by the glycoprotein erythropoietin, which is secreted mainly by the kidneys. Erythropoietin enhances erythrocyte production by accelerating the differentiation of stem cells in the bone marrow. This substance
is often used clinically to increase red blood cell production in anemic patients.
Leukocytes
There are normally 4000 to 10,000 leukocytes (white blood cells) per microliter of blood. Leukocytes include granulocytes (65%), lymphocytes (30%), and monocytes (5%). Of the granulocytes, about 95% are neutrophils, 4% are eosinophils, and 1% are basophils. White blood cells originate from the primitive stem cells in the bone marrow. After birth, granulocytes and monocytes in humans continue to originate in the bone marrow, whereas lymphocytes originate in the lymph nodes, spleen, and thymus.
CLINICAL BOX
Anemia and chronic hypoxia are prevalent in people who live at high altitudes, and such conditions tend to stimulate erythrocyte production and can produce polycythemia (an increased number of red blood cells). When the hypoxic stimulus is removed in subjects with altitude polycythemia, the high erythrocyte concentration in the blood inhibits erythropoiesis. The red blood cell count is also greatly increased in polycythemia vera, a disease of unknown cause. The elevated erythrocyte concentration increases blood viscosity, often enough that blood flow to vital tissues becomes impaired.
Granulocytes and monocytes are motile, nucleated cells that contain lysosomes that have enzymes capable of digesting foreign material such as microorganisms, damaged cells, and cellular debris. Thus leukocytes constitute a major defense mechanism against infections. Microorganisms or the products of cell destruction release chemotactic substances that attract granulocytes and monocytes. When migrating leukocytes reach the foreign agents, they engulf them (phagocytosis) and then destroy them through the action of enzymes that form O2-derived free radicals and hydrogen peroxide
Lymphocytes
Lymphocytes vary in size and have large nuclei. Most lymphocytes lack cytoplasmic granules (see Fig. 1.5). The two main types of lymphocytes are B lymphocytes, which are responsible for humoral immunity, and T lymphocytes, which are responsible for cell-mediated immunity. When lymphocytes are stimulated by an antigen (a foreign protein on the surface of a microorganism or allergen), the B lymphocytes are transformed into plasma cells, which synthesize and release antibodies (gamma globulins). Antibodies are carried by the bloodstream to a site of infection, where they “tag” foreign invaders for destruction by other components of the immune system.
GENESIS OF RBC
Proerythroblast
Basophil erythroblast
Polychromatophil erythroblast
Orthochromatic erythroblast
Reticulocyte
Microcytic, hypochromic anemia
Sickle cell anemia
Erythrocytes
Megaloblastic anemia
Erythroblastosis fetalis
Fig. 1.6 Genesis of red blood cells (RBCs), and red blood cells in different types of anemias. (From Guyton, A. C., & Hall J. E. (2016). Textbook of medical physiology, 13th ed. Philadelphia: WB Saunders.)
CLINICAL BOX
The main T cells are cytotoxic and are responsible for long-term protection against some viruses, bacteria, and cancer cells. They are also responsible for the rejection of transplanted organs.
Platelets
Platelets are small (3 μm) anucleate cell fragments of megakaryocytes, which reside in the bone marrow. Upon maturation, megakaryocytes fragment into platelets, which enter the circulation.
Platelets are important in hemostasis. Damage to the endothelium of a blood vessels causes platelets to adhere to the site of injury where they release adenosine diphosphate (ADP) and thromboxane A2 (TAX2), which cause adhesion of more platelets. Platelet aggregation may continue in this fashion until some of the small blood vessels become occluded by the aggregated platelet mass. Platelets are prevented from aggregating along the length of a normal vessel
by the antiaggregation action of prostacyclin (PGI2). This substance is released from normal endothelial cells in adjacent uninjured segments of the blood vessel. Platelets also release 5-hydroxytryptamine (serotonin), which causes vasoconstriction, and thromboplastin, which accelerates blood coagulation.
CLINICAL BOX
Bleeding is an important clinical problem, and trauma is its most common cause. Bleeding such as from the gastrointestinal tract can cause severe anemia or cardiovascular shock. Occult bleeding in the stool can be the first sign of peptic ulcer or intestinal bleeding. When the platelet count is abnormally low, as in thrombocytopenic purpura, tiny hemorrhages (petechiae) or larger hemorrhages (ecchymoses) may appear in the skin and mucous membranes. Bleeding occurs into the tissues, especially the joints, in hemophilia, a hereditary disease. This disease occurs only in males, but the genetic abnormality is carried by females.
Blood Is Divided Into Groups by Antigens Located on Erythrocytes
Four principal blood groups, designated O, A, B, and AB, prevail in human subjects. Each group is identified by the type of antigen that is present on the erythrocyte. People with type A blood have A antigens; those with type B blood have B antigens; those with type AB have both A and B antigens, and those with type O have neither antigen. The plasma of group O blood contains antibodies to A, B, and AB.
Group A plasma contains antibodies to B antigens, and group B plasma contains antibodies to A antigens.
CLINICAL BOX
An Rh-negative person can develop antibodies to Rhpositive red blood cells if exposed to Rh-positive blood. This can occur during pregnancy if the mother is Rhnegative and the fetus is Rh-positive (inherited from the father). In this case Rh-positive red blood cells from the fetus enter the maternal bloodstream at the time of placental separation and induce Rh-positive antibodies in the mother’s plasma. The Rh-positive antibodies from the mother can also reach the fetus via the
SUMMARY
• The cardiovascular system is composed of a heart, which pumps blood, and blood vessels (arteries, capillaries, veins) that distribute the blood to all organs.
• The greatest resistance to blood flow, and hence the greatest pressure drop, in the arterial system occurs at the level of the small arteries and the arterioles.
• Pulsatile pressure is progressively damped by the elasticity of the arteriolar walls and the functional resistance of the arterioles, so that capillary blood flow is essentially nonpulsatile.
• Velocity of blood flow is inversely related to the cross-sectional area at any point along the vascular system.
• Most of the blood volume in the systemic vascular bed is located in the venous side of the circulation.
KEYWORDS AND CONCEPTS
Diastole
Erythrocytes
Hemoglobin
Homeostasis
Humoral immunity
Lymphocytes
Megakaryocytes
Group AB plasma has no antibodies to O, A, or B antigens. In blood transfusions, crossmatching is necessary to prevent agglutination of donor red cells by antibodies in the plasma of the recipient. Because plasma of groups A, B, and AB has no antibodies to group O erythrocytes, people with group O blood are called universal donors. Conversely, persons with AB blood are called universal recipients because their plasma has no antibodies to the antigens of the other three groups. In addition to the ABO blood grouping, there are Rh (Rhesus factor)–positive and Rh-negative groups.
placenta and agglutinate and hemolyze fetal red blood cells (erythroblastosis fetalis, a hemolytic disease of the newborn). Red blood cell destruction can also occur in Rh-negative individuals who have previously had transfusions of Rh-positive blood and have developed Rh antibodies. If these individuals are given a subsequent transfusion of Rh-positive blood, the transfused red blood cells will be destroyed by the Rh antibodies in their plasma.
• Blood consists of red blood cells (erythrocytes), white blood cells (leukocytes and lymphocytes), and platelets, all suspended in a solution containing salts, proteins, carbohydrates, and lipids.
• There are four major blood groups: O, A, B, and AB. Type O blood can be given to people with any of the blood groups because the plasma of all of the blood groups lacks antibodies to type O red cells. Hence people with type O blood are referred to as universal donors. By the same token, people with AB blood are referred to as universal recipients because their plasma lacks antibodies to red cells of all of the blood groups. In addition to O, A, B, and AB blood groups, there are Rh-positive and Rh-negative blood groups.
Monocytes
Pluripotential stem cells
Pulmonary circulation
Pulsatile arterial blood flow
Rh (Rhesus factor)–positive
Systemic circulation
Systole
ADDITIONAL READING
Adams RH. Molecular control of arterial-venous blood vessel identity. J Anat. 2003;202:105.
Christensen KL, Mulvany MJ. Location of resistance arteries. J Vasc Res. 2001;38:1.
Conway EM, Collen D, Carmeliet P. Molecular mechanisms of blood vessel growth. Cardiovasc Res. 2001;49:507.
Secomb TW, Pries AR. The microcirculation: physiology at the mesoscale. J Physiol. 2011;589:1047.
Reid ME, Lomas-Francis C. Molecular approaches to blood group identification. Curr Opin Hematol. 2002;9:152.
Urbaniak SJ, Greiss MA. RhD haemolytic disease of the fetus and the newborn. Blood Rev. 2000;14:44.
CASE 1.1
After a knife wound to the groin, a man develops a large arteriovenous (AV) shunt between the iliac artery and vein.
1. Which of the following changes will occur in his systemic circulation?
a. Blood flow in the capillaries of the fingernail bed becomes pulsatile.
b. The circulation time (antecubital vein to tongue) is decreased.
c. The arterial pulse pressure (systolic minus diastolic pressure) is decreased.
d. The greatest velocity of blood flow prevails in the vena cava.
e. Pressure in the right atrium is greater than in the inferior vena cava.
Excitation: The Cardiac Action Potential
OBJECTIVES
1. Characterize the types of cardiac action potentials.
2. Define the ionic basis of the resting potential.
3. Define the ionic basis of cardiac action potentials.
Experiments on "animal electricity" conducted by Galvani and Volta more than two centuries ago led to the discovery that electrical phenomena were involved in the spontaneous contractions of the heart. In 1855 Kolliker and Muller observed that when the nerve of an innervated skeletal muscle preparation contacted the surface of a frog's heart, the muscle twitched with each cardiac contraction.
The electrical events that normally occur in the heart initiate its contraction. Disorders in electrical activity can induce serious and sometimes lethal rhythm disturbances.
CARDIAC ACTION POTENTIALS CONS ST OF SEVERAL PHASES
The potential changes recorded from a typical ventricular muscle fiber are illustrated in Fig. 2.l A. Wn'en two microelectrodes are placed in an elect olyte solution near a strip of quiescent cardiac muscle, no potential difference (time a) is measurable between the two electrodes. At point b, one microelectrode was inserted into the interior of a cardiac muscle fiber. Immediately the voltmeter recorded a potential difference (Vm) across the cell membrane; the potential of the cell interior was about 90 mV lower than that of the surrounding medium. Such electronegativity of the resting cell interior is also characteristic of skeletal and smooth muscles, nerves, and indeed most cells within the body.
At point c, an electrical stimulus excited the ventricular cell. The cell membrane rapidly depolarized and the potential difference reversed (positive overshoot), such that the potential of the interior of the cell exceeded that of the exterior by about 20 m V. The rapid upstroke of the
4. Describe the characteristics of the fast- and slowresponse action potentials.
5. Explain the temporal changes in cardiac excitability.
action potential is designated phase 0. Immediately after the upstroke, thBre was a brief period of partial repolarization (phase 1), followed by a plateau (phase 2) of sustained depolarization that ersisted for about 0.1 to 0.2 seconds (s). The otential then became progressively more negative (P,hase 3), until the resting state of polarization was again at hu med (at point e). Repolarization (phase 3) is a much slower process than depolarization (phase O). The interval from the end of repolarization until the beginning of the next action potential is designated phase 4.
The temporal relationship between the action potential and cell shortening is shown in Fig. 2.2 Rapid depolarization (phase O) precedes cell shortening, repolarization is complete just before peak shortening is attained, and the duration of contraction is slightly longer than the duration of the action potential.
The Principal Types of Cardiac Action Potentials Are the Slow and Fast Types
Two main types of action potentials are observed in the heart, as shown in Fig. 2.1. One type, the fast response, occurs in the ordinary atrial and ventricular myocytes and in the specialized conducting fibers (Purkinje fibers ). The other type of action potential, the slow response, is found in the sinoatrial (SA) node , the natural pacemaker region of the heart, and in the atrioventricular (AV) node , the specialized tissue that conducts the cardiac impulse from atria to ventricles.
As shown in Fig 2 1, the membrane resting potential (phase 4) of the fast response is considerably more negative than that of the slow response. Also, the slope of the upstroke (phase 0), the action potential amplitude, and the overshoot of the fast response are greater than those
Millivolts
Fig. 2.1 Changes in transmembrane potential recorded from fast-response (A) and slow-response (B) cardiac fibers in isolated cardiac tissue immersed in an electrolyte solution from phase 0 to phase 4. (A) At time a, the microelectrode was in the solution surrounding the cardiac fiber. At time b, the microelectrode entered the fiber. At time c, an action potential was initiated in the impaled fiber. Time c to d represents the effective refractory period (ERP); time d to e represents the relative refractory period (RRP). (B) An action potential recorded from a slow-response cardiac fiber. Note that in comparison with the fast-response fiber, the resting potential of the slow fiber is less negative, the upstroke (phase 0) of the action potential is less steep, and the amplitude of the action potential is smaller; also, phase 1 is absent, and the RRP extends well into phase 4, after the fiber has fully repolarized.
fast-response fibers. Slow conduction increases the likelihood of certain rhythm disturbances.
CLINICAL BOX
Fast responses may change to slow responses under certain pathological conditions. For example, in patients with coronary artery disease, when a region of cardiac muscle is deprived of its normal blood supply, the K+ concentration in the interstitial fluid that surrounds the affected muscle cells rises because K+ is lost from the inadequately perfused (ischemic) cells. The action potentials in some of these cells may then be converted from fast to slow responses (see Fig. 2.18). An experimental conversion from a fast to a slow response through the addition of tetrodotoxin, which blocks fast Na+ channels in the cardiac cell membranes, is illustrated in Fig. 2.3
Fig. 2.2 Temporal relationship between the changes in transmembrane potential and the cell shortening that occurs in a single ventricular myocyte. (From Pappano A: Unpublished record, 1995.)
of the slow response. The action potential amplitude and the steepness of the upstroke are important determinants of propagation velocity, as explained later. Hence, conduction velocity is much slower in slow-response fibers than in
The Ionic Basis of the Resting Potential
The various phases of the cardiac action potential are associated with changes in cell membrane permeability, mainly to Na+, K+, and Ca++. Changes in cell membrane permeability alter the rate of ion movement across the membrane. The membrane permeability to a given ion defines the net quantity of the ion that will diffuse across each unit area of
the membrane per unit concentration difference across the membrane. Changes in permeability are accomplished by the opening and closing of ion channels that are selective for individual ions.
Just as with all other cells in the body, the concentration of K+ inside a cardiac muscle cell, [K+]i, greatly exceeds the concentration outside the cell, [K+]o, as shown in Fig. 2.4. The reverse concentration gradient exists for free Na+ and
for free Ca++ (not bound to protein). Estimates of the extracellular and intracellular concentrations of Na+, K+, and Ca++, and of the equilibrium potentials (defined later) for these ions, are compiled in Table 2.1.
The resting cell membrane is relatively permeable to K+ but much less so to Na+ and Ca++. Hence K+ tends to diffuse from the inside to the outside of the cell, in the direction of the concentration gradient, as shown on the right side of the cell in Fig. 2.4.
Fig. 2.3 Effect of tetrodotoxin on the action potential recorded in a calf Purkinje fiber perfused with a solution containing epinephrine and 10.8 mM K+. The concentration of tetrodotoxin was 0 M in A, 3 × 10⁻⁸ M in B, 3 × 10⁻⁷ M in C, and 3 × 10⁻⁶ M in D and E; E was recorded later than D. (Redrawn from Carmeliet E. & Vereecke, J. [1969]. Adrenaline and the plateau phase of the cardiac action potential. Importance of Ca++, Na+ and K+ conductance. Pflügers Archive, 313, 300-315.)
Any flux of K+ that occurs during phase 4 takes place through certain specific K+ channels. Several types of K+ channels exist in cardiac cell membranes. Some of these channels are controlled (i.e., opened and closed) by the transmembrane voltage, whereas others are controlled by some chemical signal (e.g., a neurotransmitter). The specific K+ channel through which K+ passes during phase 4 is a voltage-regulated channel called iK1, which is an inwardly rectifying K+ current, as explained later (Fig. 2.5). Many of the anions (labeled A ) inside the cell, such as the proteins, are not free to diffuse out with the K+ (see Fig. 2.4). Therefore as the K+ diffuses out of the cell and the A remains behind, the cation deficiency causes the interior of the cell to become electronegative.
Therefore two opposing forces regulate K+ movement across the cell membrane. A chemical force, based on the concentration gradient, results in the net outward diffusion of K+. The counterforce is electrostatic; the positively charged K+ ions are attracted to the interior of the cell by the negative potential that exists there, as shown on the left side of the cell in Fig. 2.4. If the system comes into equilibrium, the chemical and electrostatic forces are equal.
This equilibrium is expressed by the Nernst equation for K+, as follows:
= 61. 5log K
Fig. 2.4 The balance of chemical and electrostatic forces acting on a resting cardiac cell membrane, based on a 30:1 ratio of the intracellular to extracellular K+ concentrations and the existence of a nondiffusible anion (A inside but not outside the cell.)
The term to the right of the equals sign represents chemical potential difference at the body temperature of 37°C. The term to the left, EK, called the potassium equilibrium potential, represents the electrostatic potential difference
aThe intracellular concentrations are estimates of the free concentrations in the cytoplasm. Modified from Ten Eick, R. E., Baumgarten, C. M., & Singer, D. H. (1981). Ventricular dysrhythmias: Membrane bias, or, of currents, channels, gates, and cables. Progress in Cardiovascular Diseases, 24, 157-188.
TABLE 2.1 Intracellular and Extracellular Ion Concentrations and Equilibrium Potentials in Cardiac Muscle Cells
that would exist across the cell membrane if K+ were the only diffusible ion.
An experimental disturbance in the equilibrium between electrostatic and chemical forces imposed by voltage clamping would cause K+ to move through the K+ channels (see Fig. 2.5). If the transmembrane potential (Vm) were clamped at a level negative to EK, the electrostatic force would exceed the diffusional force, and K+ would be attracted into the cell (i.e., the K+ current would be inward). Conversely, if Vm were clamped at a level positive to EK, the diffusional force would exceed the electrostatic force, and K+ would leave the cell (i.e., the K+ current would be outward).
When the measured concentrations of [K+]i and [K+]o for mammalian myocardial cells are substituted into the Nernst equation, the calculated value of EK equals about −94 mV (see Table 2.1). This value is close to, but slightly more negative than, the resting potential actually measured in myocardial cells. Therefore the electrostatic force is slightly weaker than the chemical (diffusional) force, and K+ tends to leave the resting cell.
The balance of forces acting on Na+ is entirely different from that acting on the K+ in resting cardiac cells. The intracellular Na+ concentration, [Na+]i, is much lower than the extracellular Na+ concentration, [Na+]o. At 37°C,
the sodium equilibrium potential, ENa, expressed by the Nernst equation is as follows:
Fig. 2.5 The K+ currents recorded from a rabbit ventricular myocyte when the potential was changed from a holding potential of −80 mV to various test potentials. Positive values along the vertical axis represent outward currents; negative values represent inward currents. The V m coordinate of the point of intersection (open circle) of the curve with the X-axis is the reversal potential; it denotes the Nernst equilibrium potential (EK) at which the chemical and electrostatic forces are equal. (Redrawn from Giles, W. R., & Imaizumi, Y. (1988). Comparison of potassium currents in rabbit atrial and ventricular cells. The Journal of Physiology, 405, 123-145.)
For cardiac cells, ENa is about 70 mV (see Table 2.1). Therefore at equilibrium a transmembrane potential of about +71 mV would be necessary to counterbalance the chemical potential for Na+. However, the actual voltage of the resting cell is just the opposite. The resting membrane potential of cardiac cells is about −90 mV (see Fig. 2.1A). Hence both chemical and electrostatic forces favor entry of extracellular Na+ into the cell. The influx of Na+ through the cell membrane is small because the permeability of the resting membrane to Na+ is very low. Nevertheless, it is mainly this small inward current of Na+ that causes the potential of the resting cell membrane to be slightly less negative than the value predicted by the Nernst equation for K+.
The steady inward leak of Na+ would gradually depolarize the resting cell were it not for the metabolic pump that continuously extrudes Na+ from the cell interior and pumps in K+. The metabolic pump involves the enzyme Na+, K+-ATPase, which is located in the cell membrane. Pump operation requires the expenditure of metabolic energy because the pump moves Na+ against both a chemical gradient and an electrostatic gradient. Increases in [Na+]i or in [K+]o accelerate the activity of the pump. The quantity of Na+ extruded by the pump exceeds the quantity of K+ transferred into the cell by a 3:2 ratio. Therefore the pump itself tends to create a potential difference across the cell membrane, and thus it is termed an electrogenic pump. If the pump is partially inhibited, as by digitalis, the resting membrane potential becomes less negative than normal.
The dependence of the transmembrane potential, Vm, on the intracellular and extracellular concentrations of K+ and Na+ and on the conductances (gK and gNa, respectively) of these ions is described by the chord conductance equation, as follows:
For a given ion (X), the conductance (gx) is defined as the ratio of the current (ix) carried by that ion to the difference between the V m and the Nernst equilibrium potential (Ex) for that ion; that is,
The chord conductance equation reveals that the relative, not the absolute, conductances to Na+ and K+ determine the resting potential. In the resting cardiac cell, gK is about 100 times greater than gNa. Therefore the chord
Fig. 2.6 The transmembrane potential (Vm) of a cardiac muscle fiber varies inversely with the potassium (K+) concentration of the external medium (curved line). The straight line represents the change in transmembrane potential predicted by the Nernst equation for EK. (Redrawn from Page, E. (1962). The electrical potential difference across the cell membrane of heart muscle. Biophysical considerations. Circulation, 26, 582-595.)
conductance equation reduces essentially to the Nernst equation for K+
When the ratio [K+]o/[K+]i is increased experimentally by a rise in [K+]o, the measured value of Vm (Fig. 2.6) approximates that predicted by the Nernst equation for K+. For extracellular K+ concentrations above 5 mM, the measured values correspond closely with the predicted values. The measured levels of V m are slightly less negative than those predicted by the Nernst equation because of the small but finite value of gNa. For values of [K+]o below 5 mM, the effect of the Na+ gradient on the transmembrane potential becomes more important, as predicted by Eq. 2.3. This increase in the relative importance of gNa accounts for the greater deviation of the measured Vm from that predicted by the Nernst equation for K+ at very low levels of [K+]o (see Fig. 2.6).
The Fast Response Depends Mainly on Voltage-Dependent Sodium Channels
Genesis of the Upstroke
Any process that abruptly depolarizes the resting membrane to a critical potential value (called the threshold) induces a propagated action potential. The characteristics of fast-response action potentials are shown in Fig. 2.1A The initial rapid depolarization (phase 0) is related almost exclusively to Na+ influx by virtue of a sudden increase in gNa. The action potential overshoot (the peak of the potential during phase 0) varies linearly with the logarithm of [Na+]o, as shown in Fig. 2.7. When [Na+]o is reduced from
External Na concentration (% of normal)
Fig. 2.7 The concentration of sodium in the external medium is a critical determinant of the amplitude of the action potential in cardiac muscle (upper line) but has relatively little influence on the resting potential (lower line). (Redrawn from Weidmann, S. (1956). Elektrophysiologie der herzmuskelfaser. Bern, Switzerland: Verlag Hans Huber.)
its normal value of about 140 mM to about 20 mM, the cell is no longer excitable.
Specific voltage-dependent Na+ channels (often called fast Na + channels ) exist in the cell membrane. These channels can be blocked selectively by the puffer fish toxin tetrodotoxin (see Fig. 2.3) and by local anesthetics. A voltage-gated Na+ channel is depicted in Fig. 2.8; it contains an α subunit composed of four domains (I–IV) and two β subunits (only one is shown). Each domain has six transmembrane α-helical segments linked by external and internal peptide loops. Transmembrane segment 4 serves as a sensor whose conformation changes with applied voltage and is responsible for channel opening (activation). The intracellular loop that connects domains III and IV functions as the inactivation gate. After depolarization, this loop swings into the mouth of the channel to block ion conductance. The extracellular portions of the loops that connect helices 5 and 6 in each domain form the pore region and participate in the determination of ion selectivity. The Ca++ channels that form the basis of the slow response (see later) are similar in overall structure to Na+ channels but have a different ion selectivity.
The physical and chemical forces responsible for the transmembrane movements of Na+ are explained in Fig. 2.9. The regulation of Na+ flux through the fast Na+
Fig. 2.8 Schematic structure of a voltage-gated Na+ channel. The α subunit is composed of 4 domains (I–IV), each of which has 6 transmembrane helices; the N and C termini are cytoplasmic. Transmembrane segment 4 is a voltage sensor whose conformation changes with applied voltage. The 4 domains are arranged around a central pore lined by the extracellular loops of transmembrane segments 5 and 6. The β2 subunit is shown on the left. P, phosphorylation sites; ScTX, scorpion toxin binding site. (Redrawn from Squire, L. R., Roberts, J. L., &, Spitzer, N. C., et al. (2002). Fundamental neuroscience, 2nd ed. San Diego, CA: Academic Press.)
channels can be understood in terms of the “gate” concept. One of these gates, the m gate, tends to open as Vm becomes less negative than the threshold potential and is therefore called an activation gate. The other, the h gate, tends to close as V m becomes less negative and hence is called an inactivation gate. The m and h designations were originally employed by Hodgkin and Huxley in their mathematical model of ionic currents in nerve fibers.
Panel A in Fig. 2.9 represents the resting state (phase 4) of a cardiac myocyte. With the cell at rest, Vm is −90 mV and the m gates are closed while the h gates are wide open. The electrostatic force in Fig. 2.9A is a potential difference of 90 mV, and it is represented by the white arrow. The chemical force, based on the difference in Na+ concentration between the outside and inside of the cell, is represented by the dark arrow. For an Na+ concentration difference of about 130 mM, a potential difference of 60 mV (inside more positive than the outside) is necessary to counterbalance the chemical, or diffusional, force, according to the Nernst equation for Na+ (Equation 2). Therefore we may represent the net chemical force favoring the inward movement of Na+ in Fig. 2.9 (dark arrows) as equivalent to a potential of 60 mV. With the cell at rest, the
total electrochemical force favoring the inward movement of Na+ is 150 mV (panel A). The m gates are closed, however, and the conductance of the resting cell membrane to Na+ is very low. Hence, the inward Na+ current is negligible.
Any process that makes Vm less negative tends to open the m gates and thereby activates the fast Na+ channels so that Na+ enters the cell (see Fig. 2.9B) via the chemical and electrostatic forces. Thus activation of the fast channels is a voltage-dependent phenomenon. The precise potential at which the m gates swing open is called the threshold potential. The entry of Na+ into the interior of the cell neutralizes some of the negative charges inside the cell and thereby diminishes further the transmembrane potential, Vm (see Fig. 2.9B).
The rapid opening of the m gates in the fast Na+ channels is responsible for the large and abrupt increase in Na+ conductance, gNa, coincident with phase 0 of the action potential (see Fig. 2.12). The rapid influx of Na+ accounts for the steep upstroke of Vm during phase 0. The maximal rate of change of Vm (dVm/dt) varies from 100 to 300 V/s in myocardial cells and from 500 to 1000 V/s in Purkinje fibers. The actual quantity of Na+ that enters the cell is so small and occurs in such a limited portion of the cell’s
A, During phase 4, the chemical (60 mV) and electrostatic (90 mV) forces favor influx of Na+ from the extracellular space Influx is negligible, however, because the activation (m) gates are closed.
B, If Vm is brought to about 65 V, the m gates begin to swing open, and Na+ begins to enter the cell. This reduces the negative charge inside the cell. The change in Vm also initiates the closure of inactivation (h) gates, which operate more slowly than the m gates
C, The rapid influx of Na+ rapidly decreases the negativity of Vm As Vm approaches 0, the electrostatic force attracting Na+ into the cell is neutralized. Na+ continues to enter the cell, however, because of the substantial concentration gradient, and Vm begins to become positive.
D, When Vm is positive by about 20 mV, Na+ continues to enter the cell, because the diffusional forces (60 mV) exceed the opposing electrostatic forces (20 mV). The influx of Na+ is slow, however, because the net driving force is small, and many of the inactivation gates have already closed.
E, When Vm reaches about 30 mV, the h gates have now all closed, and Na+ influx ceases The h gates remain closed until the first half of repolarization, and thus the cell is absolutely refractor y during this entire period. During the second half of repolarization, the m and h gates approach the state represented by panel A, and thus the cell is relatively refractor y.
Fig. 2.9 The gating of a sodium channel in a cardiac cell membrane during phase 4 (A) and during various stages of the action potential upstroke (B to E). The positions of the m and h gates in the fast Na+ channels are shown at the various levels of Vm. The electrostatic forces are represented by the white arrows, and the chemical (diffusional) forces by the dark arrows
volume that the resulting change in the intracellular Na+ concentration cannot be measured precisely. The chemical force remains virtually constant, and only the electrostatic force changes throughout the action potential. Hence the lengths of the dark arrows in Fig. 2.9 remain constant at 60 mV, whereas the white arrows change in magnitude and direction.
As Na+ enters the cardiac cell during phase 0, it neutralizes the negative charges inside the cell and Vm becomes less negative. When Vm becomes zero (see Fig. 2.9C), an electrostatic force no longer pulls Na+ into the cell. As long as the fast Na+ channels are open, however, Na+ continues to enter the cell because of the large concentration gradient. This continuation of the inward Na+ current
causes the cell interior to become positively charged (see Fig. 2.9D). This reversal of the membrane polarity is the overshoot of the cardiac action potential. Such a reversal of the electrostatic gradient tends to repel the entry of Na+ (see Fig. 2.9D). However, as long as the inwardly directed chemical forces exceed these outwardly directed electrostatic forces, the net flux of Na+ is still inward, although the rate of influx is diminished.
The inward Na+ current finally ceases when the h (inactivation) gates close (see Fig. 2.9E). The opening of the m gates occurs very rapidly, in about 0.1 to 0.2 milliseconds (ms), whereas the closure of the h gates is slower, requiring 10 ms or more. Inactivation of the fast Na+ channels is completed when the h gates close. The h
Fig. 2.10 The changes in action potential amplitude and slope of the upstroke as action potentials are initiated at different stages of the relative refractory period of the preceding excitation. (Redrawn from Rosen, M. R., Wit, A. L., & Hoffman, B. F. (1974). Electrophysiology and pharmacology of cardiac arrhythmias. I. Cellular electrophysiology of the mammalian heart. American Heart Journal, 88, 380-385.)
gates remain closed until the cell has partially repolarized during phase 3 (at about time d in Fig. 2.1A). From time c to time d, the cell is in its effective refractory period and does not respond to excitation. This mechanism prevents a sustained, tetanic contraction of cardiac muscle that would interfere with the normal intermittent pumping action of the heart. A period of myocardial relaxation, sufficient to permit the cardiac ventricles to fill with venous blood during each cardiac cycle, is as essential to the normal pumping action of the heart as is a strong cardiac contraction.
About midway through phase 3 (time d in Fig. 2.1A), the m and h gates in some of the fast Na+ channels resume the states shown in Fig. 2.9A. Such channels are said to have recovered from inactivation. The cell can begin to respond again to excitation (Fig. 2.10). Application of a suprathreshold stimulus to a region of normal myocardium during phase 3 evokes an action potential. As the stimulus is delivered progressively later during the course of phase 3, the slopes of the action potential upstrokes and the amplitudes of the evoked action potentials progressively increase. Throughout the remainder of phase 3, the cell completes its recovery from inactivation. By time e in Fig. 2.1A, the h gates have reopened and the m gates have reclosed in the remaining fast Na+ channels, as shown in Fig. 2.9A.
Statistical Characteristics of the “Gate” Concept
The patch clamp technique has made it possible to measure ionic currents through single membrane channels. The individual channels open and close repeatedly in a
random manner. This process is illustrated in Fig. 2.11, which shows the current flow through single Na+ channels in a myocardial cell. To the left of the arrow, the membrane potential was clamped at −85 mV. At the arrow, the potential was suddenly changed to −45 mV, at which value it was held for the remainder of the record.
Fig. 2.11 indicates that immediately after the membrane potential was made less negative, one Na+ channel opened three times in sequence. It remained open for about 2 or 3 ms each time and closed for about 4 or 5 ms between openings. In the open state, it allowed 1.5 pA of current to pass. During the first and second openings of this channel, a second channel also opened, but for periods of only 1 ms. During the brief times that the two channels were open simultaneously, the total current was 3 pA. After the first channel closed for the third time, both channels remained closed for the rest of the recording, even though the membrane was held constant at −45 mV.
The overall change in ionic conductance of the entire cell membrane at any given time reflects the number of channels that are open at that time. Because the individual channels open and close randomly, the overall membrane conductance represents the statistical probability of the open or closed state of the individual channels. The temporal characteristics of the activation process then represent the time course of the increasing probability that the specific channels will be open, rather than the kinetic characteristics of the activation gates in the individual channels. Similarly, the temporal characteristics of inactivation reflect the time course of the decreasing probability that the channels will be open and not the kinetic characteristics of the inactivation gates in the individual channels.
Genesis of Early Repolarization
In many cardiac cells that have a prominent plateau, phase 1 constitutes an early, brief period of limited repolarization between the end of the action potential upstroke and the beginning of the plateau (Fig. 2.12). Phase 1 reflects the activation of a transient outward current, ito, mostly carried by K+. Activation of these K+ channels leads to a brief efflux of K+ from the cell because the interior of the cell is positively charged, and because the internal K+ concentration greatly exceeds the external concentration (see Table 2.1). This brief efflux of K+ brings about the brief, limited repolarization (phase 1).
Phase 1 is prominent in Purkinje fibers (see Fig. 2.3) and in epicardial fibers from the ventricular myocardium (Fig. 2.13); it is much less developed in endocardial fibers. When the basic cycle length at which the epicardial fibers are stimulated is increased from 300 to 2000 ms, phase 1 becomes more pronounced and the action potential duration is increased substantially. The same increase in basic
Channel #1 current
Channel #2 current
Fig. 2.11 The current flow (in picoamperes) through two individual Na+ channels in a cultured cardiac cell, recorded by the patch-clamping technique. The membrane potential had been held at −85 mV but was suddenly changed to −45 mV at the arrow and held at this potential for the remainder of the record. (Redrawn from Cachelin, A. B., DePeyer, J. E., & Kokubun, S., et al. (1983). Sodium channels in cultured cardiac cells.
Journal of Physiology, 340, 389.)
Kir2.1/2.2
Kv4.2/4.3
Kv1.4/1.7
HERG
KCND2/3
KCNA4
KCNH2 KCNJ2
Kv (LQT1) KCNQ1
Fig. 2.12 Changes in depolarizing (upper panels) and repolarizing ion currents during the various phases of the action potential in a fast-response cardiac ventricular cell. The inward currents include the fast Na+ and L-type Ca++ currents. Outward currents are IK1, Ito, and the rapid (IKr) and slow (IKs) delayed rectifier K + currents. The clones and respective genes for the principal ionic currents are also tabulated. (Redrawn from Tomaselli, G., & Marbán, E. (1999). Electrophysiological remodeling in hypertrophy and heart failure. Cardiovascular Research, 42, 270-273.)
cycle length has no effect on the early portion of the plateau in endocardial fibers, and it has a smaller effect on the action potential duration than it does in epicardial fibers (see Fig. 2.13).
Genesis of the Plateau
During the plateau (phase 2) of the action potential, Ca++ enters the cell through calcium channels that activate and inactivate much more slowly than do the fast Na+ channels.
During phase 2 (see Fig. 2.12), this influx of Ca++ is balanced by the efflux of an equal amount of K+. The K+ exits through various specific K+ channels, as described in the next section.
Ca++ Conductance During the Plateau
The Ca++ channels are voltage-regulated channels that are activated as V m becomes progressively less negative during the upstroke of the action potential. Two types of Ca++
Fig. 2.13 Action potentials recorded from canine epicardial and endocardial strips driven at basic cycle lengths (BCLs) of 300 and 2000 ms. (From Litovsky, S. H., & Antzelevitch, C. (1989). Rate dependence of action potential duration and refractoriness in canine ventricular endocardium differs from that of epicardium: Role of the transient outward current. Journal of the American College of Cardiology, 14, 1053-1066.)
Fig. 2.14 Effects of isoproterenol on the Ca++ currents conducted by T-type (upper panel) and L-type (lower panel) Ca++ channels in canine atrial myocytes. Upper panel, Potential changed from −80 to −20 mV; lower panel, potential changed from −30 to + 30 mV. (Redrawn from Bean, B. P. (1985). Two kinds of calcium channels in canine atrial cells: Differences in kinetics, selectivity, and pharmacology. The Journal of General Physiology, 86, 1-30.)
channels (L-type and T-type) have been identified in cardiac tissues. Some of their important characteristics are illustrated in Fig. 2.14, which displays the Ca++ currents
Fig. 2.15 The effects of diltiazem, a Ca++ channel blocking drug, on the action potentials (in millivolts) and isometric contractile forces (in millinewtons) recorded from an isolated papillary muscle of a guinea pig. The tracings were recorded under control conditions (C) and in the presence of diltiazem, in concentrations of 3, 10, and 30 μmol/L. (Redrawn from Hirth, C., Borchard, U., & Hafner, D. (1983). Effects of the calcium antagonist diltiazem on action potentials, slow response and force of contraction in different cardiac tissues. Journal of Molecular and Cellular Cardiology, 15, 799-809.)
generated by voltage-clamping an isolated atrial myocyte. Note that when V m is suddenly increased to + 30 mV from a holding potential of −30 mV (lower panel), an inward Ca++ current (denoted by a downward deflection) is activated. After the inward current reaches maximum (in the downward direction), it returns toward zero very gradually (i.e., the channels inactivate very slowly). Thus current that passes through these channels is long-lasting, and they have been designated L-type channels. They are the predominant type of Ca++ channels in the heart, and they are activated during the action potential upstroke when Vm reaches about −30 mV. The L-type channels are blocked by Ca++ channel antagonists, such as verapamil, nifedipine, and diltiazem.
The T-type (transient) Ca++ channels are much less abundant in the heart. They are activated at more negative potentials (about −70 mV) than are the L-type channels. Note in Fig. 2.14 (upper panel) that when Vm is suddenly increased to −20 mV from a holding potential of −80 mV, a Ca++ current is activated and then is inactivated very quickly.
Opening of the Ca++ channels is reflected by an increase in Ca++ current (ICa,L) that begins during the later phase of the upstroke of the action potential (Fig. 2.15). When the Ca++ channels open, Ca++ enters the cell throughout the plateau, because the intracellular Ca++ concentration is much less than the extracellular Ca++ concentration
(see Table 2.1). The Ca++ that enters the myocardial cell during the plateau is involved in excitation–contraction coupling, as described in Chapter 4
Neurohumoral factors may influence gCa. An increase in gCa by catecholamines, such as isoproterenol and norepinephrine, is probably the principal mechanism by which catecholamines enhance cardiac muscle contractility. Catecholamines interact with β-adrenergic receptors located on cardiac cell membranes. This interaction stimulates the membrane-bound enzyme, adenylyl cyclase, which raises the intracellular concentration of cyclic AMP (adenosine monophosphate) (see Fig. 4.8). This change enhances the voltage-dependent activation of the L-type Ca++ channels in the cell membrane (see Fig. 2.14, lower panel) and thus augments Ca++ influx into the cells from the interstitial fluid. However, catecholamines have little effect on the Ca++ current through the T-type channels (see Fig. 2.14, upper panel).
The Ca++ channel antagonists decrease gCa during the action potential. By reducing the amount of Ca++ that enters the myocardial cells during phase 2, these drugs diminish cardiac contractility and are negative inotropic agents (see Fig. 2.15). These drugs also diminish the contraction of the vascular smooth muscle by suppressing Ca++ entry caused by depolarization or by neurotransmitters such as norepinephrine, and thereby induce arterial vasodilation. This effect reduces the counterforce (afterload) that opposes the propulsion of blood from the ventricles into the arterial system, as explained in Chapters 4 and 5. Hence vasodilator drugs, such as the Ca++ channel antagonists, are often referred to as afterload reducing drugs. This ability to diminish the counterforce enables the heart to provide a more adequate cardiac output, despite the direct depressant effect that these drugs exert on myocardial fibers.
K+ Conductance During the Plateau
During the plateau of the action potential, the concentration gradient for K+ between the inside and outside of the cell is virtually the same as it is during phase 4, but the Vm is positive. Therefore the chemical and electrostatic forces greatly favor the efflux of K+ from the cell during the plateau (see Fig. 2.12). If gK1 were the same during the plateau as it is during phase 4, the efflux of K+ during phase 2 would greatly exceed the influx of Ca++, and a plateau could not be sustained. However, as Vm approaches and attains positive values near the end of phase 0, gK1 suddenly decreases, as does IK1 (see Fig. 2.12).
The changes in gK1 during the different phases of the action potential may be appreciated through an examination of the current-voltage relationship for the IK1 channels (the channels that mainly determine gK during phase 4). An example of this relationship in an isolated ventricular
myocyte is shown in Fig. 2.5. Note that the current-voltage curve intersects the voltage axis at a Vm of about −80 mV. The absence of ionic current flow at the intersection indicates that the electrostatic forces must have been equal to the chemical (diffusional) forces (see Fig. 2.4) at this potential. Thus, in this isolated ventricular cell, the Nernst equilibrium potential (EK) for K+ was −80 mV; in a myocyte in the intact ventricle, EK is normally about −95 mV.
When the membrane potential was clamped at levels negative to −80 mV in this isolated cell (see Fig. 2.5), the electrostatic forces exceeded the chemical forces and an inward K+ current was induced (as denoted by the negative values of K+ current over this range of voltages). Note also that for V m more negative than −80 mV, the curve has a steep slope. Thus, when Vm equals or is negative to EK, a small change in Vm induces a substantial change in K+ current; that is, gK1 is large. During phase 4, the Vm of a myocardial cell is slightly less negative than EK (see Fig. 2.6).
When the transmembrane potential of this isolated myocyte was clamped at levels less negative than −70 mV (see Fig. 2.5), the chemical forces exceeded the electrostatic forces. Therefore the net K+ currents were outward (as denoted by the positive values along the corresponding section of the Y axis).
During phase 4 of the cardiac cycle, the driving force for K+ (the difference between Vm and EK) favored the efflux of K+, mainly through the iK1 channels. Note that for V m values positive to −80 mV, the curve is relatively flat; this is especially pronounced for values of Vm positive to −40 mV. A given change in voltage causes only a small change in ionic current (i.e., gK1 is small). Thus gK1 is small for outwardly directed K+ currents but substantial for inwardly directed K+ currents; that is, the iK1 current is inwardly rectified. The rectification is most marked over the plateau (phase 2) range of transmembrane potentials (see Figs. 2.5 and 2.12). This characteristic prevents excessive loss of K+ during the prolonged plateau, during which the electrostatic and chemical forces both favor the efflux of K+.
The delayed rectifier K+ channels, which conduct the iK current, are also activated at voltages that prevail toward the end of phase 0. However, activation proceeds very slowly, over several hundreds of milliseconds. Hence activation of these channels tends to increase IKr (see next section) slowly and slightly during phase 2. These channels play only a minor role during phase 2, but they do contribute to repolarization (phase 3), as described in the next section. The action potential plateau persists as long as the efflux of charge carried by certain cations (mainly K+) is balanced by the influx of charge carried by other cations (mainly Ca++). The effects of altering this balance are demonstrated by administration of diltiazem, a calcium channel antagonist. Fig. 2.15 shows that with increasing concentrations of diltiazem, the plateau voltage becomes