7.7 Receptors for Steroid and Thyroid Hormones, for Retinoids and Vitamin D 321
7.8 Cyclic GMP Dependent Pathways and Effects of Nitric Oxide (NO) 322
7.8.1 Membrane Bound Guanylate Cyclases 323
7.8.2 Soluble Guanylate Cyclases and Their Activation by Nitric Oxide (NO) 323
7.8.3 Protein Kinase G 323
8 Immune System 325
Ernst Peter Rieber
8.1 Components of the Immune System 325
8.1.1 Innate, Non Adaptive Immune System 325
8.1.2 Specific, Adaptive Immune System 328
8.1.3 Development and Maturation of the Cellular Components 328
8.1.4 Antigen Receptor of B Lymphocytes, Antibodies 330
8.1.5 Complement System 334
8.1.6 Antigen Receptor of T Lymphocytes 336
8.1.7 Antigen Presentation by MHC Molecules 337
8.1.8 Cytokines, Chemokines and Receptors 338
8.2
Generation of a Specific Immune Response 343
8.2.1 Activation of T Cells 343
8.2.2 CD4+ T Effector Cells, Regulation of the Immune Response 344
8.2.3 Activation of B Cells 345
8.2.4 Lymphocyte Circulation and Generation of Cellular and Humoral Immune Responses in Lymphoid Tissue 345
8.2.5 Cellular Cytotoxicity and Apoptosis 347
8.2.6 Interactions between the Immune System and the Neuroendocrine System 350
8.2.7 Immunological Tolerance 350
8.2.8 Induction of Specific Immune Responses against Pathogens 351
8.3 Pathologic Immune responses 352
8.3.1 IgE-Mediated Hypersensitivity of the Immediate Type 352
8.3.2 Autoimmunity 353
8.4 Adhesion of Leukocytes 354
Anton Haselbeck
9
Blood Coagulation and Fibrinolysis 357
Peter Müller
9.1 Hemostasis 357
9.2 Initial Reactions 358
9.2.1 Reactions Initiated by the Tissue Factor 358
9.2.2 Contact Activation 358
9.2.3 Generation of Binding Surfaces 358
9.3 Coagulation Propagation and Control 359
9.3.1 Requirements for Protease Activity 359
9.3.2 Pathways Leading to Thrombin 359
9.3.3 Key Events 359
9.3.4 Controlled Propagation 360
9.3.5 Generation of Fibrin 361
9.4 Platelets (Thrombocytes) 362
9.5 Fibrinolysis 364
9.5.1 Pathways of Plasminogen Activation 364
9.5.2 Control of Fibrinolysis 365
10 Biochemical Networks, Bioinformatics and Systems Biology 366
Dietmar Schomburg
10.1 Systems Biology and Networks 366
10.2 Modeling of Metabolic Fluxes 366
10.3 Biochemical Pathways Information Resources 366
10.3.1 Overview 366
10.3.2 Detailed Description of Some Databases 367
Index 374
From the Preface to the First Edition
This book is not intended to be a textbook of biochemistry in the conventional sense. There is no shortage of good biochemistry textbooks. which outline how biochemical knowledge has been gained, trace the logical and experimental developments in this field and present advances in their historical sequence.
In contrast, this book tries to condense important aspects of current knowledge. Its goal is to give concise information on the metabolic sequences in the pathways, the chemistry and enzymology of conversions, the regulation of turnover and the effect of disorders. This concentration on the sequence of facts has entailed the omission of researchers’ names, experimental methods and the discussion of how results have been obtained. For information on these aspects, and for an introduction to the fundamentals of biological science, it is necessary to consult textbooks.
The scope of this book is general biochemistry, encompassing bacteria (and to some extent archaea), plants, yeasts and animals. Although a balanced representation is intended, personal interest naturally plays a role in the selection of topics. In a number of cases, the chemistry of the reactions is given in more detail, especially at metabolic key and branching points. Human metabolism, its regulation and disorders as a result of disease is a frequent topic. On the other hand, some chapters are especially devoted to bacterial metabolism.
This book grew out of my interest in metabolic interrelationships and regulation which was stimulated by my professional work at Boehringer Mannheim GmbH, Germany. Previously, this interest led me to compile the ‘Biochemical Pathways’wall chart, the first edition of which appeared 40 years ago. Three more editions followed, which have been widely distributed. As a result of this experience, I developed a preference for the graphic presentation of scientific facts. In contrast to texts, illustrations allow the simultaneous display of different aspects, such as structural formulas, enzyme catalysis and its regulation, the involvement of cofactors, the occurrence of enzymes
in various kingdoms of biology, etc. This form of presentation facilitates a rapid overview. A standard set of conventions is used in all illustrations (representation of formulas, symbols for proteins, the use of colors, the shape of arrows, etc. - the rare exceptions are indicated), and this assists in finding the facts quickly.
Tables have been added to provide more detailed information. They list additional properties of the system components, homologies, etc. The text plays only a supportive role. It gives a concise description of the reactions and their regulation, and puts them into the general metabolic context.
In many cases, current knowledge focuses on a limited in number of species. A rough classification of the occurrence of pathways is given by the color or the reaction arrows in the illustrations, but both generalizations and specialization are expected to be found in the future, which will necessitate modification of the picture.
The literature references have been limited in number and they usually cite recent review articles and books, if possible, from readily accessible sources. They were selected to provide more detailed information on new developments and additional references for the interested reader. There are no references to long-established biochemical facts which can be found in any textbook. I hope that this restriction will be acceptable to readers, since a complete listing of all sources for the statements presented here would take up a major portion of this volume. To compensate for the omission of such general references, a special chapter on electronic data banks and major printed sources has been added at the end of the book.
Most of all I want to thank my wife Dea, who has often encouraged me during the long time required to fiish this work. She has given me valuable advice and support in checking the text of the English edition. Without her understanding and her help this book would not have been brought to completion.
Gerhard Michal
Contributors
Helmut Burtscher, Roche Diagnostics GmbH, D-82372 Penzberg
Antje Chang, Enzymeta GmbH, D-50374 Erftstadt
Petra Dersch, Helmholtz Center for Infection Research, Dept. of Molecular Infection Biology, D-38124 Braunschweig
Julia Garbe, Institute for Microbiology, Technische Universität, D-38106 Braunschweig
Anton Haselbeck, MAB Discovery GmbH, D-82061 Neuried
Elmar Heinzle, Technical Biochemistry, Universität des Saarlandes, D-66123 Saarbrücken
Dieter Jahn, Institute for Microbiology, Technische Universität, D-38106 Braunschweig
Martina Jahn, Institute for Microbiology, Technische Universität, D-38106 Braunschweig
Wilhelm Just, Biochemistry Center, University, D-69120 Heidelberg
Peter Müller, Helmholtz Centre for Infection Research, Dept. Gene Regulation & Differentiation, D-38124 Braunschweig
Gerhard Niederfellner, Roche Diagnostics GmbH, D-82372 Penzberg
Dieter Oesterheldt, Max-Planck Institute for Biochemistry, D-82152 Martinsried
Susanne Peifer, Technical Biochemistry, Universität des Saarlandes, D-66123 Saarbrücken
Ernst Peter Rieber, Institute for Immunology, Technische Universität, D-01011 Dresden
Stefan Ries, Roche Diagnostics GmbH, D-82372 Penzberg
Max Schobert, Institute for Microbiology, Technische Universität, D-38106 Braunschweig
Dietmar Schomburg, Institute of Biochemistry, Biotechnology & Bioinformatics, Technische Universität, D-38106 Braunschweig
Ida Schomburg, Enzymeta GmbH, D-50374 Erftstadt
Annika Steen, Institute for Microbiology, Technische Universität, D-38106 Braunschweig
Josef Wachtveitl, Institute for Physical and Theoretical Chemistry, University, D-60438 Frankfurt/M.
Röbbe Wünschiers, Biotechnology/Computational Biology, University of Applied Sciences, D-09648 Mittweida
1.1 Organization of This Book
1 Introduction and General Aspects Gerhard
Michal and Dietmar Schomburg
This book deals with the chemistry of living organisms. However, this topic cannot be considered in an isolated way, but has to be placed into a more general context. In two introductory chapters, a short outline of interconnections with neighboring sciences is given.
Chapter 1 deals with the organic chemistry of important components present in living organisms and with the physical chemistry of reactions.
Chapter 2 describes the overall organization of cells and their organelles as well as the structure of proteins and nucleic acids. This is followed by a discussion of enzyme function, which depends on the protein structure and regulates almost all biological processes.
The topics of Chapter 3 are various aspects of metabolism, showing the complex network with multiple interconnections.
Sections 3.1 … 3.6 are devoted to general metabolism, focusing on small molecules (carbohydrates, amino acids, tetrapyrroles, lipids including glycolipids, steroids, nucleosides and nucleotides).
Figures 1.1-1 … 1.1-3 give a simplified survey of the main metabolic pathways in order to allow quick location of the detailed descriptions in this book. The decimal classification numbers in the various boxes refer to chapters and sections. Figure 1.1-1, which abstracts Chapter 3, shows only biosynthetic pathways and sequences passed through in both directions (amphibolic pathways). This avoids a complicated presentation. (In the text, however, the degradation pathways of these compounds are usually discussed immediately following the biosynthesis reactions.) Most of the compounds mentioned here are ‘key compounds’, which appear in the detailed figures later in this book either at the beginning or at the end of the reaction sequences. The classification of these compounds into chemical groups is indicated by the color background of
Key to the background colors:
green = carbohydrates; blue = amino acids; red = lipids including steroids; orange = nucleotides; brown = tetrapyrroles; none = compounds involved in general interconversions. The colors of the frames are for easy differentiation only.
the names. Section 3.7 deals with cofactors and vitamins, which are involved in many reactions of general metabolism. Sections 3.8 and 3.9 describe the metabolism of DNA in bacteria and eukarya and the repair systems of these essential information carriers. The special metabolism of bacteria (including energy aspects), the biosynthesis and the effects of antibiotics are topics of Section 3.10. Aerobic respiration and its central role in energy turnover, as well as the photosynthetic reactions that are the source of almost all compounds in living beings, are discussed in Sections 3.11 and 3.12. Many special metabolic reactions take place in plants. These are summarized inSection 3.13.
The biosynthesis of proteins in bacteria and eukarya, and their consecutive modification, as well as the cell cycle, are discussed in Chapter 4.Figure 1.1-2 gives a short outline of these reactions, subdivided into bacterial reactions (left) and eukaryotic reactions (right).
Abbreviations for amino acids are listed in Figure 1.3.2, abbreviations for sugars in Figure 4.4.1-1.
1.2 Carbohydrate Chemistry and Structure
Carbohydrate monomers are of the general formula (CH2O)n. They have the chemical structure of aldehydes or ketones with multiple hydroxyl groups (aldoses and ketoses, respectively). A common name of monomers and dimers is ‘sugar’.
The large number of reactive groups, together with the stereoisomers causes a multiplicity of structures and reaction possibilities. Besides ‘pure’ carbohydrate monomers, oligomers (3.1.4) and polymers (3.1.2), carboxylic (3.1.5.1…2) and amino (3.1.7) derivatives, polyalcohols (3.1.5.5), deoxy sugars (3.1.5.6) etc., exist in nature.
Carbohydrates are the primary products of photosynthesis (3.12.2) and function as energy storage forms (e.g., starch, glycogen, 3.1.2), as part of nucleic acid and nucleotide molecules (3.6.1, 3.6.2), in glycoproteins (4.4) and glycolipids (4.4) and as structural elements in cell walls of bacteria (3.10.1), plants (3.4) and in the exoskeleton of arthropods (3.1). They are the most abundant chemical group in the biosphere.
1.2.1 Structure and Classification
The simplest carbohydrates are the trioses (C3 compounds) glyceraldehyde (an aldose) and dihydroxyacetone (glycerone, a ketose). Larger molecules are tetroses (C4), pentoses (C5), hexoses (C6), heptoses (C7) etc.; the C5 and C6 molecules are most common.
Glyceraldehyde is the smallest aldose with an asymmetric C-atom (chirality center). Therefore there are two stereoisomers (enantiomers), which cause right and left rotation of polarized light. By the Fischer convention, they are named D- and L-form, respectively. For details, see organic chemistry textbooks. Tetroses and larger carbohydrate monomers are classified (by comparison of the asymmetric center most distant to the aldehyde or keto group with D- or L-glyceraldehyde) as the D- and L-series of enantiomers (Fig. 1.2-1). With n-carbon aldoses, a total of 2n−2 stereoisomers exist, and with n-carbon ketoses there are 2n−3 stereoisomers. Epimers are stereoisomers, which differ in configuration at only one asymmetric C-atom. Most physiological sugars are of the D-configuration.
Aldopentoses, aldohexoses and ketohexoses (and higher sugars) can form cyclic structures (hemiacetals and hemiketals) by intramolecular reaction of their aldehyde or keto groups respectively with an alcohol group. This results in pyranoses (6-membered rings) and furanoses (5-membered rings, Fig. 1.2-2). In equilibrium, the cyclic structure is more prevalent as compared to the open structure. The ring closure produces another asymmetric C-atom; the respective stereoisomers are named anomers (a- and b-forms).
The nonplanar pyranose rings can assume either boat (in 2 variants) or chair conformation. The substituents extend either parallel to the perpendicular axis (axial, in Fig. 1.2-3 printed in red) or at almost right angles to it (equatorial, printed in green). The preferred
1.2-2.
Figure 1.2-1. Nomenclature of Carbohydrates
The compounds printed in green are formally obtained by epimerization at the indicated positions. The L-enantiomers are the mirror images at the perpendicular mirror plane.
Figure 1.2-3. Chair and Boat Conformations of Hexoses (Top) and Half-Chair (Envelope) Conformation of Pentoses (Bottom)
Figure
Ring Closure of Carbohydrates
conformation depends on spatial interference or other interactions of the substituents.
Although the bond angles of a furanose ring would permit an almost planar structure, the interference of substituents with each other causes a slight bending (puckering), e.g., to a half-chair (= envelope) structure in nucleotides and nucleic acids (Fig. 1.2-3).
The linear form of carbohydrates is usually shown as Fischer projection (ligands drawn horizontally are in front of the plane, ligands drawn vertically are behind the plane, e.g., in Fig. 1.2-1). The ring form is either drawn as Haworth formula (Fig. 1.2-2, disregarding the bent ring structure) or as boat/chair formula.
1.2.2 Glycosidic Bonds (Fig. 1.2-4)
If the hemiacetal or hemiketal hydroxyl of a sugar is condensed with an alcoholic hydroxyl of another sugar molecule, a glycosidic bond is formed and water is eliminated. Since this reaction between free sugars is endergonic (DG¢ 0 = 16 kJ/mol), the sugars usually have to be activated as nucleotide derivatives (3.1.2.2) in order to be noticeably converted. Depending on the configuration at the hemiacetal/ hemiketal hydroxyl (1.2.1), either a- or b-glycosides are formed. Sugar derivatives, which contain a hemiacetal or a hemiketal group (e.g., uronic acids) are also able to form glycosidic bonds.
Since sugar molecules contain several alcoholic groups, various types of bonds are possible. Frequently, 1 Æ 4 or 1 Æ 6 bonds occur. With oligo- or polysaccharides, both linear and branched structures are found. Bond formation may also take place with alcoholic, phenolic or other groups of non-sugar molecules (aglycons).
Literature:
Organic chemistry textbooks.
1.3 Amino Acid Chemistry and Structure
All amino acids present in proteins carry a carboxyl- and an amino group, hydrogen and variable side chains (R) at a single (a-)carbon atom. Thus, this Ca-atom is asymmetric (compare 1.2.1), with the exception of glycine, where R = H. Almost all of the proteinogenic amino acids occurring in nature are of the L-configuration. (The ‘L’ is assigned by comparison with L- and D-glyceraldehyde, which are taken as standards, Fig. 1.3-1). A number of D-amino acids are found in bacterial envelopes (3.10) and in some antibiotics (3.10).
Figure 1.2-4. Examples of Glycosidic Bonds
Unless otherwise stated, all amino acids discussed in the following sections are of the L-configuration.
Chains of amino acids form proteins and peptides. As enzymes, regulatory, mobility and structural compounds, they are the central components in all living beings. Therefore they are the topic of most of this book. Protein synthesis is described in Chapter 4. Their structure is discussed in Section 2.3, which also gives a short listing of their functions.
a) Non-polar, aliphatic amino acids. The non-polar side chains undergo hydrophobic interactions in protein structures. While the small glycine molecule allows high flexibility, the bulky proline confers enhanced rigidity to the structures.
b) Polar, uncharged residues R. These functional groups are hydrophilic and can form hydrogen bonds with water or other polar compounds. Cysteine can easily be oxidized, resulting in intra- or intermolecular interconnections by disulfide bonds.
c) Aromatic residues R. The aromatic side chains are hydrophobic, while the hydroxyl group of tyrosine and the ring nitrogen of tryptophan form hydrogen bonds, which often play a role in enzyme catalysis.
e) Negatively charged side chains R. The charged groups contribute in many cases to catalytic mechanisms and are also of influence to the protein structure.
L-ASPARATE (Asp, D) L-GLUTAMATE (Glu, E)
d) Positively charged side chains R. The charged groups contribute in many cases to catalytic mechanisms and also influence the protein structure.
L-PYRROLYSINE (Pyl, O) f) Special amino acids using unusual genetic codes and found only in a small number of proteins (3.10.6.2, 4.1.3.4).
Figure 1.3-2. Amino Acids With Their 3- and 1-Letter Codes
L-SELENOCYSTEINE (Sec, U)
Figure 1.3-1. Asymmetric Center of Amino Acids
1.4.7 Steroids
Steroids are derivatives of the hydrocarbon cyclopentanoperhydrophenanthrene (Fig. 1.4-6).
Figure 1.4-6. Structure of Cyclopentanoperhydrophenanthrene
Biologically important steroids carry many substituents: generally there is a hydroxy or oxo group at C-3. In addition, several methyl, hydroxy and oxo, in some cases also carboxy, groups are found. In many cases, there is a larger residue bound to C-17. Frequently, some double bonds are present. In a few cases, ring A is aromatic. Substituents below the ring system are designated a and above the ring system b (see Fig. 3.5.1-5).
Steroids are membrane components and participants as well as regulators of metabolism. A detailed description is given in Section 3.5.
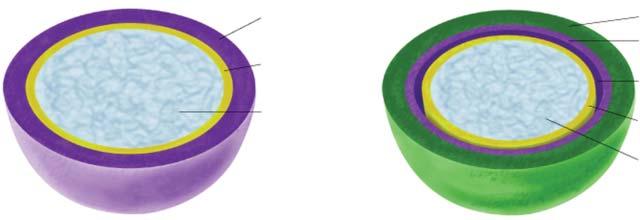
1.4.8 Lipoproteins
The major function of lipoproteins is the transport of lipids. They contain non-polar lipids (triacylglycerols, cholesterol esters) in their core, surrounded by a layer of polar compounds (glycerophospholipids, cholesterol, proteins, Fig. 6.2-1). This group of compounds is discussed in context with their transport function in 6.2.
1.5 Physico-Chemical Aspects of Biochemical Processess
Some readers may be less inclined to deal with a fairly large number of mathematical formulas. However, formulas are necessary to describe biochemical processes quantitatively. Considering this, the mathematical part of this book has been concentrated into this section, while usually other chapters refer to it.
Only the most important equations required for discussion of biochemical reactions are presented. In order to facilitate their use, companion equations are given, which show the numerical values of the factors and the dimensions of the terms. For derivation of
Table 1.5-1. Measures and Constants (Selection)
the equations, refer to physical chemistry textbooks. The units and constants used in the following paragraphs are listed in Table 1.5-1.
1.5.1 Energetics of Chemical Reactions
To each component of a system, an amount of free energy G is assigned, which is composed of the enthalpy H (internal energy + pressure * volume) and of the entropy S (measure of disorder). While the absolute values are not of importance, the change of G (DG) is decisive for chemical reactions:
A reaction proceeds spontaneously only if DG is negative.
In biochemistry, DG of reactions are usually listed as DG¢0, which is obtained at standard conditions of 298 K (25 °C), pH 7.0 and a reactant concentration of 1 mol/l each except for water, where the normal concentration of 55.55 mol/l and gases, where a pressure of 101.3 kPa (= 1 atm) are taken as unity and thus do not appear in the formula.
If the reactant concentrations (henceforth written as [X]) of a reaction A + B + … = Z + Y + … differ from 1 mol/l each, DG can be calculated by:
DG = DG 0 ¢ + R * T * 2.303 * log [Z] * [Y] *… [A] * [B] *… (end products) (starting comp.) [1.5-2] or
Reaction sequences can be calculated by addition of DG’s of the individual reactions.
A reaction is at equilibrium if DG = 0. Then the equilibrium constant K = [Z] * [Y] * … [A] * [B] * … (end products) (starting comp.) [1.5-3] can be calculated as follows: DG¢ 0 = −R * T * 2.303 * log K;
or DG¢ 0 [kJ * mol−1] = −0.00831 * T * 2.303 *
MeasureUnitEquivalents / Value of ConstantsEquivalents in SI Basic Units
Lengthmeter (m)1 mm = 10−3 m, 1 μm = 10−6 m, 1 nm = 10−9 m, 1 Å (Ångström) = 10−10 mSI basic unit
Volumecubic meter (m3)1 l (liter) = 10−3 m3; 1 ml = 10−3 l, 1 μl = 10−6 lDerived SI unit
Masskilogram (kg)1 g (gram) = 10−3 kg; 1 mg = 10−3 g, 1 μg = 10−6 gSI basic unit
Time (t)second (s)1 ms = 10−3 s, 1 μs = 10−6 s, 1 ns = 10−9 s, 1 ps = 10−12 sSI basic unit
Temperature (T)Kelvin (K)0 K = −273.16 °CSI basic unit
Quantity of matterMol1 mol = 6.0221 * 1023 [molecules or ions] 1 mmol = 10−3 mol, 1 μmol = 10−6 mol, 1 nmol = 10−9 mol, 1 pmol = 10−12 mol This unit is also applied to photons. 1 Einstein = 1 mol photons.
Electric currentAmpere (A)
SI basic unit
SI basic unit
ForceNewton (N)1 N = 1 [m * kg * s−2 ]1 N = 1 [m * kg * sec−2 ]
PressurePascal (Pa)1 Pa = 1 N * m−2, 1 kilopascal (kPa) = 103 Pa, 1 atm = 101.325 kPa1 Pa = 1 [m−1 * kg * sec−2 ]
In calculations in this book, usually l, g, kJ and mV are used. Since the constants have then to be expressed in these units, their numerical value changes by the factor 10−3 or 10−6 in the respective formulas.
Enzymes cannot shift the equilibrium, they only increase the reaction velocity. The kinetics of enzyme catalyzed reactions are discussed in 1.5.4.
1.5.2 Redox Reactions
Redox reactions are reactions where one compound is reduced (electron acceptor A) while its reaction partner is oxidized (electron donor B) by transfer of n electrons:
An+ ox + Bred = Ared + Bn+ ox
The change of free energy during such a reaction is described by a formula, which is analogous to Eq. [1.5-2]:
DG = DG 0 ¢ + R * T * 2.303 * log [Ared] * [B ox n+] [Aoxn+] * [Bred] (end products) (starting comp.) [1.5-5] or
w expresses the work gained by transferring n mol charges (= n Faraday, F) across a potential difference of DE = Eend − Ebegin
w = −n * F * DE.
[1.5-6]
Since a positive amount of work diminishes the free energy of the system
w = −n * F * DE = −DG [1.5-6a] or
DG [kJ * mol−1] = n * 0.0965 * DE [mV], [1.5-6b]
equation [1.5-5] can also be written as:
DE = DE 0 ¢ + R * T n * F * 2.303 * log [Ared] * [B ox n+] [Aoxn+] * [Bred] (end products) (starting comp.) [1.5-7] or
DE [mV] = DE 0 ¢ + 0.00831 * T n * 0.0965 * 2.303 * log [Ared] * [B ox n+] [Aoxn+] * [Bred] [1.5-7a]
DE 0 ¢ is the difference of the redox potentials of this reaction (or the electromotive force across membranes, 1.5.3) under biochemical standard conditions (298 K = 25°C, pH 7.0 and a reactant concentration of 1 mol/l each). Only water, which is present in a concentration of 55.55 mol/l and gases, with a pressure of 1 atm are taken as unity.
Redox potentials: The reaction can be divided into two half reactions (e = electrons):
Ared = An+ ox + n e and Bred = Bn+ ox + n e
The zero value of the redox potential is by convention assigned to the potential of the half reaction 2 H+ + 2 e = H2 at a platinum electrode at pH = 0, 298 K (25°C) and a hydrogen pressure of 101.3 kPa (= 1 atm). Thus, under the standard conditions used in biochemistry (pH = 7.0), E 0 ¢ (2H+/H2) = −410 mV.
Correspondingly, the half reactions can be expressed as:
EA = (E 0 ¢ )A + R * T n * F * 2.303 * log [Aoxn+] [Ared] [1.5-8] or EA [mV] = (E 0 ¢ )A + 0.00831 * T n * 0.0965 * 2.303 * log [Aoxn+] [Ared] [1.5-8a]
and analogously for B.
Various redox potentials can be combined this way: DE = EB − EA (A being the electron acceptor and B being the electron donor). The reactions proceed spontaneously only if DE is negative, i.e., when the potential changes to a more negative value.
Redox potentials are usually plotted with the minus values on top. A spontaneous reaction proceeds in such a plot from top to bottom (e.g., Fig. 3.12-6).
In the literature, the definition of DE is not uniform. In a number of textbooks it is defined in opposite order to the above: DE = Ebegin − Eend Therefore, DE and DE0 have to be replaced by −DE and −DE¢ 0, respectively. This affects Eqs. [1.5-6] … [1.5-8a] and has to be considered when making comparisons.
1.5.3 Transport Through Membranes
Uncharged molecules: If an uncharged compound A is present on both sides of a permeable membrane in different concentrations, its passage through the membrane is accompanied by a change of free energy. In biochemistry, this situation occurs mostly at cellular membranes (or membranes of organelles). For import into cells, the following equation applies:
DG = R * T * 2.303 * log [Ainside] [Aoutside] [1.5-9] or
Thus, the transport occurs spontaneously only at negative DG, (when [Ainside] < [Aoutside]), i.e, from higher to lower concentrations. Correspondingly, for export from cells, the quotient is reversed
DG = R * T * 2.303 * log [Aoutside] [Ainside] [1.5-9b]
Charged molecules: The situation is more complicated if there is a potential difference DY across the membrane (e.g., by nonpenetrable ions)
DY = Yinside − Youtside [1.5-10] and the compounds passing through the membrane carry Z positive charges/molecule (or −Z negative charges/molecule). The contribution of the charges to DG (with the prefix of Z corresponding to the + or − charge of the ions) is expressed by:
DGcharge transport = Z * F * DY [1.5-11] or
DGcharge transport [kJ * mol−1] = Z * 0.0965 * DY [mV]. [[1.5-11a]
Thus, for an import process, Eq. [1.5-9] and Eq. [1.5-11] have to be combined:
DG = R * T * 2.303 * log [Ainside] [Aoutside] + Z * F * DY [1.5-12] or
DG [kJ * mol−1] = 0.00831 * T * 2.303 * log [Ains.] [Aouts.] + Z * 0.0965 * DY [mV]. [1.5-12a]
Correspondingly, for an export process,
DG = R * T * 2.303 * log [Aoutside] [Ainside] − Z * F * DY [1.5-12b]
The prefix of the last term in this equation is the opposite one of Eq. [1.5-12], since the membrane potential (Eq. 1.5-10) has the opposite effect on the energy situation.
An equilibrium exists if DG = 0. Then the equilibrium potential DY0 [mV] can be obtained by the Nernst equation:
DY0 = − R * T Z * F * 2.303 * log [Ainside] [Aoutside] [1.5-13] or DY0 [mV] = − 0.00831 * T Z * 0.0965 * 2.303 * log [Ainside] [Aoutside] [1.5-13a]
An extension of this formula to the equilibrium potential of several ions is the Goldman equation (see 7.2.1).
Literature:
Physical chemistry textbooks.
1.5.4 Enzyme Kinetics
The biochemical base of enzyme catalysis is discussed in 2.4. In the following, the mathematical treatment of the kinetics is given in some more detail.
Velocity of reactions: The reaction rate v for conversion of a single compound A Æ product(s) (first order reaction) is proportional to the concentration of this compound [A], while for a two-compound reaction A + B Æ product(s) (second order reaction) it depends on the number of contacts and thus on the concentration of both components (Eq. [1.5-14] and Eq. [1.5-15]). The proportionality factor k is termed rate constant.
Eq. [1.5-15] can also be applied for the formation of a complex and Eq. [1.5-14] for the decomposition of this complex. This includes substrate-enzyme complexes (see below), ligand-receptor complexes (7.1-2), antigen-antibody complexes (8.1.4) etc.
v = − d [A] dt = k * [A][1.5-14]
v = − d [A]
dt = − d [B] dt = k * [A] * [B]
[1.5-15]
Enzyme catalyzed one-substrate reaction: The theory of the enzymecatalyzed conversion of a single reactant (the substrate, S) is based on the assumption that the enzyme (the catalyst, E) and this substrate form a complex (ES) by a reversible reaction. This step is kinetically treated like a two-compound reaction (rate constants k1 and k−1 for formation and decomposition, respectively). The complex is then converted into the product (P) with the rate constant k2. The conversion into P is considered to be irreversible at the beginning of the reaction, when practically no product is present.
E + S k1 ´ k−1 ES Æ E
Therefore, for the formation of the enzyme-substrate complex, Eq. [1.5-15] has to be applied, while for its decomposition into its components, as well as for its conversion to the products, Eq. [1.5-14] is valid. There is actually an intermediate step ES Æ EP before the product is released. Its rate constant is not treated as a separate entity in most discussions of kinetic behavior, but is combined with the dissociation step to k2. This is also done in the following considerations.
Usually, the substrate is in large excess over the enzyme. In this case, after a short ‘transient phase’, [ES]can be considered to be sufficiently constant (steady-state assumption). Disregarding the reverse reaction by using the situation immediately after the transient phase (see above) one obtains
If one assumes that the rate determining process is the reaction ES Æ E + P, the initial reaction rate v0 can be written as a function of [ES], which is analogous to Eq. [1.5-14]
v0 = k2 * [ES].
[1.5-14a]
By using a term for the total concentration of enzyme [Et] = [E] + [ES], by expressing the maximum reaction rate Vmax, which is obtained when all of the enzyme is saturated with substrate ([ES] = [Et]) as V max = k2 * [Et], [1.5-14b] and by introducing the Michaelis constant KM
KM = k−1 + k2 k1 ,
one obtains the so-called Michaelis-Menten equation
v0 = V max * [S] KM + [S] ,
1.5-1. Reaction Velocity of an Enzyme Catalyzed Reaction The velocity at [S] = n * KM is shown.
[1.5-18]
[1.5-19]
which shows the dependency of the reaction rate on the substrate concentration (first-order reaction). The plot of reaction rate vs. substrate concentration is a rectangular hyperbola (Fig. 1.5-1).
These formulas describe only the forward reaction. If the reverse reaction is included, the equivalent to Eq. [1.5-19] is
where (Vmax)f and (KM)f are identical to V max and KM in Eq. [1.5-19], while the terms (Vmax)r and (KM)r = (k−1 + k2)/k−2 are formed analogously for the reverse reaction.
Michaelis constant: As can be derived from Eq. [1.5-19], the Michaelis constant KM equals the substrate concentration at half the maximal reaction rate. Most of them are in the range of 10−5…10−1 mol/l (Fig. 10.3-3).
Instead of obtaining this value from a plot according to Figure 1.5-l, it is more convenient to use the reciprocal of the Michaelis-Menten equation, which yields a linear plot (at least in the ideal case, Lineweaver-Burk plot, Fig. 1.5-2a):
1 v0 = KM V max * [S] + 1 V max
[1.5-21]
If 1/v0 is plotted vs. 1/[S], then the intersections of this line with abscissa and ordinate allow the determination of KM and V max
A disadvantage of the Lineweaver-Burk plot is the accumulation of measuring points near the ordinate (see the markings on the abscissa of Fig. 1.5-2a). Therefore other ways of plotting have been proposed. Hanes used another transformation of the Michaelis-Menten equation: [S] v0 = KM V max + [S] V max
[1.5-21a]
The plot of [S]/v0 vs. [S] yields a line with the abscissa intersection −KM and the ordinate intersection KM/Vmax. The slope equals 1/Vmax (Fig. 1.5-2 b).
Still another method, the so-called ‘direct plot’, has been proposed by Eisenthal and Cornish-Bowden. The Michaelis-Menten equation is rearranged as follows: V max = v0 + v0 [S] * KM
[1.5-21b]
For each individual measurement, −[S] is marked on the abscissa and v0 on the ordinate and a line is drawn through both points. The intersection of these lines has the abscissa value KM and the ordinate value V max (Fig. 1.5-2 c).
However, the most accurate method is the statistical evaluation of the measurements. In spite of this, the Lineweaver-Burk plot will be used in the following graphical representations, since it is the best known one.
Characterization of enzyme activities: The enzyme activity is defined as the quantity of substrate turned over per time unit in the presence of a given amount of enzyme. Thus the standard dimension would be [mol * sec−1] = katal. For practical reasons, usually the
Figure
mechanisms yield a series of lines, which intersect left of the ordinate (above or below the abscissa), while ping-pong mechanisms yield parallel lines.
Dependence of reactions on temperature and activation energy: A more refined consideration of the reaction sequence Eq. [1.5-16] shows that only collisions of the reactants above a certain energy level will lead to the formation of complexes, e.g., ES and EP. Also, the reaction ES Æ EP requires an initial energy input. Thus, the reaction has to cross ‘energy hills’, which represent metastable states (Fig. 2.4-1). They are called transition complexes Xπ and can either return to the original components or progress towards the products of the reaction, quickly achieving equilibrium in both cases. Among the ‘energy hills’ mentioned above, the highest one represents obviously the rate determining step of the reaction and has to be the one considered further. (It takes the place of [ES] in the previous equations.) Thus, the equilibrium for formation of this complex can be described analogously to Eq. [1.5-3] by
K = [X*] [A] * [B]
[1.5-30]
The energy required for its formation is called activation energy DGπ, which can be calculated from this equilibrium by applying Eq. [1.5-4] as
According to Eq. [1.5-14] the reaction rate for formation of the product(s) from this complex is expressed by v0 = k * [Xπ]. When combining this equation with Eq. [1.5-31], one obtains the following formula for the temperature and DGπ dependence:
v0 = const. * [A] * [B] * 10 DGπ / 2,303 * R * T [1.5-32]
The increase of the reaction rate with rising temperature is limited, however. When the enzyme becomes thermally denatured, the rate drops (Fig. 2.4-4).
Fractal enzyme kinetics: The above considerations assume ‘ideal’ conditions; purified enzymes, low concentrations, free movement of the reactants. However, in vivo the situation is different. Based on a
power-law derivation it has been shown that, e.g., restrictions in space require the introduction of non-integer powers > 1 to the concentration terms in Eq. [1.5-17]:
The consecutive equations change analogously. This system is called fractal kinetics. Its main implications are:
• KM is dependent on the enzyme concentration; it decreases with increasing enzyme concentration.
• The plot of enzyme activity vs. substrate concentration has a tendency towards a sigmoid shape even with monomeric enzymes.
• The velocity of the reaction increases if the movements are, e.g., restricted to surface interfaces (e.g., 3.4.3.2) or to one dimension (e.g., by sliding along nucleic acid strands, 3.8.1.2, 4.2.3.2 or by ‘substrate channeling’, 3.2.7.1).
• In sequences of reactions, the flux responses are faster and the accumulation of intermediates is lower as compared to the Michealis-Menten assumption.
In some respects, fractal kinetics resemble allosteric situations (2.5.2). Velocity calculations according to this theory have a tendency to yield higher values as according to the Michaelis-Menten theory, which represents a borderline case of a more general treatment, but is still of value for understanding the basic principles of enzyme catalysis.
Literature:
Cornish-Bowden, A., Wharton, C.W. Enzyme Kinetics. Oxford: IRL Press; 1988.
Fersht, A. Structure and Mechanism in Protein Science. New York: W.H. Freeman & Company; 1999.
Freeman (1985). Savageau, M.A. J. Theor. Biol. 1995;176:115–124. Sigman, D.S., Boyer, P.D. (Eds.). The Enzymes. 3rd Ed. Vols. 19 and 20. Waltham (MA): Academic Press; 1990 and 1992.
2 The Cell and Its Contents
Gerhard Michal and Dietmar Schomburg
This chapter presents selected information on the structure and organization of living organisms and their major components to serve as a background for the biochemical text of this book. For more details, refer to biology textbooks.
2.1 Classification of Living Organisms
Life is associated with a number of characteristics such as propagation, metabolism, response to environmental influences, and evolution. Cells are the basic unit of organization for all living beings. Whereas unicellular organisms exist as separate entities, the various cells of multicellular organisms fulfill different functions, and the organism depends on mutual cellular interaction.
There are several systems of classification of living organisms. From a phylogenetic viewpoint, the classification into the three domains; bacteria, archaea and eukarya (which are further subdivided) appears most justified (Table 2.1-1). When common aspects of eubacteria and archaea are discussed, the term prokarya is used.
The metabolic reactions in this book are indicated by colored arrows. Since frequently the occurrence of the reactions is known only for a few species and also in order to prevent an ‘overloading’ of the figures with too much detail, the arrow colors have been combined into (black) general metabolism, (red) bacteria and archaea, (green) plants, fungi and protists, (blue) animals.
Living organisms exhibit a high degree of order. The sum of all endogenous life processes results in a steady decrease of free energy
Table 2.1-1. Some Typical Properties of Living Organisms (Exceptions exist)
(1.5.1). Therefore, life can only be kept up by an energy input from the environment, either as light energy or by uptake of oxidizable compounds. Another essential requirement of life is the availability of an adequate carbon source. Living beings can be classified according to the mode of energy uptake and the carbon source used (Table 2.1-2).
During the oxidation of compounds, electrons are released, which have to be taken up by a terminal electron acceptor. Energy wise, oxygen is most favorable (3.11): previous to its appearance in the primeval atmosphere, living organisms had to use other acceptors. This is still the case in oxygen-free habitats (Table 2.1-3).
Literature:
Fox, GE. et al.: Science 1980;209:457–463.
Holt, JG. et al.: Bergey’s Manual of Descriptive Bacteriology (9th Ed.). Williams and Wilkins (1994).
Margulis, L., Schwartz, K.V.: Five Kingdoms. 2nd. Ed. Freeman (1987).
Woese, CR. et al.: Structure of Cells. Proc. Natl. Acad. Sci. USA 1990;87:4576–4579.
2.2 Structure of Cells
2.2.1 Prokaryotic Cells (Fig. 2.2-1)
The genetic information is stored in a single, circular double helix of deoxyribonucleic acid (DNA, 2.6.4). It is located in the central portion of the cell in a densely packed form (nucleoid), but without
DomainsBacteriaArchaeaEukarya
KingdomsBacteriaArchaeaProtists1
PlantsFungiAnimals
Nucleusno (common term prokarya)Yes
Genomecircular, ca.106 … 5 * 107 kb, extra plasmidslinear, 107 … > 1011 kb, organized in several chromosomes
RNA polymeraseone typeseveral types
Starting amino acid for translation formylmethioninemethionine
Reproductionbinary scissionasexual/sexual
Cellular organizationunicellular (some are aggregated)mostly unicellularmulticellularuni-/multicellularmulticellular
Nutrition (Table 2.1-2) chemoorganotrophic, photoautotrophic or photoheterotrophic
chemolithotrophic, photoautotrophic or chemoorganotrophic.
chemoorganotrophic or photoautotrophic
photoautotrophicchemoheterotrophic including saprobiontic chemoheterotrophic
Size of cells average 1 … 5 μm, wide variationaverage 10 … 100 μm, wide variation
Cell membranesrigid, contain peptidoglycans rigid, without peptidoglycans rigid or softrigid, contain cellulose and lignin rigid, contain chitin soft, lipid bilayer only
Internal membranesno yes, they enclose organelles /vesicles
1 Algae, protozoa, fungi-related. The exact demarcation is under discussion.
Table 2.1-2. Sources of Carbon and of Energy
Phototrophy (Energy input by light)
Autotrophy (only CO2 needed as carbon source) green plants, some protists, photosynthesizing bacteria (3.12)
Chemotrophy (Energy provided by oxidizable compounds from the environment)
Prokarya (mainly archaea). Oxidation of inorganic material (chemolithotrophy, 3.10.7)
Heterotrophy (organic compounds needed as carbon source) some prokaryaAll animals and fungi, non-green plants, many protists and prokarya. Oxidation of organic material (chemoorganothrophy). Included are saprobionts (use decaying organic material) and parasites (feed from living beings)
Table 2.1-3. Terminal Electron Acceptors for Oxidation Reactions
Atmospheric Oxygen
Not requiredRequired
Energy obtained by anaerobic respiration (3.10.6) fermentation (3.10.5) aerobic respiration (3.11)
a special separation from the rest of the cell. Its replication and the translation of the information into protein structures are described in 3.8 and 4.1.
In prokarya, frequently a number of plasmids may occur, which also consist of circular DNA and replicate independently of the main DNA. They carry only a few genes. Although plasmids are not usually essential for survival, they are involved in DNA transfer during conjugation, provide resistance to antibiotics, etc. Some plasmids can be reversibly integrated into the main DNA (episomes). Similar properties are exhibited by DNA viruses and retroviruses (5.2, 5.4). The translocation of genetic material is not discussed here.
The cytoplasm is a semifluid, concentrated solution of proteins, metabolites, nucleotides, salts, etc. It also contains several thousand ribosome particles involved in translation (4.1.2). It is the site of most metabolic reactions and exchanges material in a controlled way with the environment (3.10.1 … 4).
Prokaryotic cells are surrounded by an envelope (3.10.1, Fig. 2.2-2). It not only has an enclosing and protective function. Rather, a number of metabolic reactions take place at transmembrane proteins (e.g., respiration and ATP synthesis) or at membrane associated proteins. In bacteria, the sequence of membrane components from the interior outwards is:
• The plasma membrane, a lipid bilayer with embedded proteins
• The rigid cell wall, which in the case of bacteria consists of either multiple layers (Gram positive bacteria) or a single layer (Gram negative bacteria) of peptidoglycans (murein).
• An additional outer membrane (only in Gram negative bacteria).
• An additional gelatinous capsule is frequently superimposed on the cell wall. It consists mainly of polysaccharides (polymerized glucose, rhamnose, uronic acids etc.). There may also be mucus layers.
Extensions of the cell envelope are pili and flagella, which provide for cellular contact, conjugation, propulsion, etc.
The composition of an E. coli cell by weight is H2O about 70 %, protein 15 %, DNA 1 %, RNA 6 %, polysaccharides 3 %, lipids 2 % (both are mainly present in the envelope), small organic molecules 1 %, inorganic molecules 1 %.
Mycoplasms are a group of bacteria which lack a cell wall. Among them are the smallest self-reproducing organisms (0.10 … 0.25 μm diameter).
Archaea differ from bacteria by
• A different composition and arrangement of rRNAs
• Differences in the RNA polymerase and in the translation mechanism (Table 2.1-1)
• Different composition of the cellular envelope. e.g., murein (3.10.1) is absent, acylglycerols are replaced by branched chain glycerol ethers (3.4.3.3)
• Unusual pathways of metabolism and habitats (methanogens, 3.10.6.2, halobacteria, 3.12.1, thermophiles, etc.)
Figure 2.2-1: General Structure of a Bacterial Cell The colors are for easy differentiation only. After Campbell, N.A.: Biology 4th Ed. Benjamin/Cummings 1996.
2.2.2 General Characteristics of Eukaryotic Cells
(Fig. 2.2-3)
Compared to prokaryotic cells, eukaryotic cells exhibit a much more complicated structure. Inside the plasma membrane there are the nucleus and the cytoplasm, which encompass the fluid cytosol and many organelles. These are compartments enclosed by individual membranes, which are devoted to specific functions.
Nucleus: All eukaryotic cells show the presence of a separate nucleus, which contains the major portion of the genetic material of the cell. (The rest is present in mitochondria and chloroplasts, see below.) The nuclear DNA is organized in a number of chromosomes. Each double helix of chromosomal DNA (2.6.3) can be present once (in haploid organisms) or twice (in diploid organisms). During cell division (4.3), the condensed chromosomes arrange themselves separately. Otherwise they are combined with proteins as a ball of chromatin with an elaborate fine structure (2.6.4).
The number of chromosomes present in the various species differs widely (from 4 to > 500; humans have 46 in the diploid set). While bacterial genomes contain < 106 … 5 * 107 bp, the diploid set of eukaryotic DNA varies between ca. 107 bp (some fungi) and > 1011 bp (lungfish, some algae). The diploid human genome contains ca. 5.8 * 109 bp (2 * 2,900,000 bp).
In addition to the DNA the nucleus also contains the nuclear matrix, which is composed of the enzymes and factors required for DNA replication, DNA repair, transcription, and processing of the transcription products (3.9, Chapter 4).
The nucleus is surrounded by a double membrane of lipid bilayers with integrated proteins. Nuclear pores (4.5.3, ca. 125 nm diameter) span the nuclear membrane and enable the transport of proteins, rRNA etc. The inner surface of the nuclear membrane is covered by nuclear lamina, a net of protein fibers which stabilizes the structure
Figure 2.2-2. Structure of the Bacterial Envelope After Voet, D. and J.G, Pratt, C.W.: Fundamentals of Biochemistry. John Wiley & Sons 2002, Figure 8-14.
While some chloroplast proteins originate from their own protein synthesis system, the majority are nuclear encoded and are imported by a special mechanism into the stroma and the thylakoid space (4.5).
Analogous to mitochondria (2.2.2), chloroplasts resemble bacteria in several aspects (protein synthesis, membrane structure, reproduction etc.). Likewise the endosymbiont theory refers to them. Possible precursors of chloroplasts could be photoautotrophic cyanobacteria.
Vacuoles: Although vacuoles also occur in other kingdoms (e.g., protists), they are most prominent in plants. Young plant cells contain several vacuoles, which originate in vesicles released from the endoplasmic reticulum and the Golgi apparatus. In mature plant cells they combine to form a single central vacuole, which is enclosed by a membrane (tonoplast).
The central vacuole can occupy up to 90 % of the total cell volume and is a storage space for inorganic salts, saccharose, proteins, pigments and waste. The accumulation of these compounds causes the inflow of water by osmosis and keeps up the internal pressure (turgor).
2.2.4 Special Structures of Animal Cells
Animal cell membrane and extracellular matrix (Fig. 2.2-6): The actual cell membrane consists only of the lipid bilayer. However, it is covered by a complex, gelatinous extracellular matrix, which is formed by glycoproteins secreted from the cell. Its main component is collagen (2.3.1). The collagen fibers are enclosed by a network of carbohydrate rich proteoglycans (2.9.1.2). Tasks of the extracellular
matrix are the interconnection and anchoring of the cells, the support of the structure and to a certain extent also the localization of cells (e.g., during embryonic development).
Depending on their organ-specific structure, they allow the passage of fluids and dissolved material at varying degrees (e.g., filtration effects in the glomerulus of the kidney). The components of the extracellular matrix are connected via linker proteins (mostly fibronectin) with membrane-spanning proteins (integrins). The integrins, in turn, are associated at the interior side of the membrane with microfilaments of the cytoskeleton.
Interconnection between cells (Fig. 2.2-7): Neighboring cells (especially epithelial cells) are interconnected in several different ways. Tight junctions firmly attach the cells to each other and prevent any fluid passage between them. Point desmosomes (also frequently occurring in plants) are firm interconnections of neighboring cells via a network of glycoprotein filaments. They are reinforced on the inside of the cells by filaments of the cytoskeleton. Small channels known as gap junctions pass through both membranes of neighboring cells. They allow the exchange of small molecules and ions (7.2.3) and represent an equivalent of plant plasmodesmata (2.2.3). Pores, channels, transporters and receptors involved in material and signal passage through individual membranes are described elsewhere (7.1.2, 7.2.3, 6.1).
Literature:
de Duve, C. A Guided Tour of the Living Cell. Scientific American Books, 1984.
Textbooks of biology, e.g., Campbell, N.A. Biology 4th Ed. The Benjamin/Cummings Publ. Co, 1996.
2.3 Protein Structure and Function
While the two previous sections dealt with the cellular structures, the rest of this chapter describes properties of the two most important classes of macromolecules: proteins and nucleic acids.
Proteins and peptides are linear polymers which are built from the 22 naturally occurring proteinogenic L-amino acids (1.3 and 3.2, including selenocysteine and pyrrolysine, 4.1.3.4) and are linked by peptide bonds (1.3.2, Fig. 2.3-1). Peptides containing D-amino acids
Figure 2.3-1. Amino Acid Composition of Proteins (gray = aliphatic, red = acidic, green = small hydroxy, blue = basic, black = aromatic, white = amide, yellow = sulfur). After UniProtKB/Swiss-Prot protein knowledgebase (see references).
Figure 2.2-7. Types of Contact between Cells
Figure 2.2-6. Structure Elements of the Extracellular Matrix
are less frequent. They occur mostly in microorganisms. Chains of up to about 50 amino acid residues are usually named ‘oligo-(or poly-) peptides’, larger ones are termed ‘proteins’. However, the expression ‘peptides’ is frequently also used for the whole class of compounds containing peptide bonds. The average protein sequence length listed in UniProtKB (Chapter 10) is 352 amino acids, the longest sequence has 35,213 amino acids.
The average amino acid distribution in proteins is far from even, some amino acids occur much more frequently than others. Leucine is found nine times as often as tryptophan (Fig. 2.3-1).
All polypeptides and proteins are synthesized by ribosomal synthesis, using mRNA as the source of information for the sequence of amino acids (4.1.2, 4.2.2). However, a number of small peptides are formed by a non-ribosomal sequence of specific enzyme reactions, e.g., glutathione (3.2.5.7), the penicillin precursor peptide (3.10.8) and many peptide antibiotics.
After formation of the peptide chain, additional post-ribosomal modifications of the amino acid components may take place, e.g., hydroxylation (3.2.3, 3.2.5.2), carboxylation (3.2.2.2, 3.7.13), methylation (e.g., of glutamate during chemotactic mechanisms), acylation (acetylation, myristoylation, palmitoylation, 4.4), phosphorylation (2.5.2, 7.5), glycosylation (4.4.2) and formation of disulfide bonds between the -SH groups of cysteine (4.5.1).
In a number of cases, a long peptide is cleaved after synthesis, e.g., to be activated for a special function. Examples are hormones (7.1.3, 7.1.5), digestive enzymes (2.5.1) and blood coagulation factors (9.2 … 5).
2.3.1
Levels of Organization
The amino acid sequence contains all the information necessary to determine the three-dimensional structure of the protein which is assumed to be the thermodynamically most stable one among the kinetically possible ways of folding (4.5). Several levels of structural organization can be distinguished:
Primary structure (Fig. 2.3-2): This is the amino acid sequence. The CO–NH bond is fairly rigid and usually assumes the trans configuration. To a limited extent, rotations are possible around both other bonds of the peptide backbone (torsion angles F and Y). Steric restrictions are caused by the side chains of the amino acids and the oxygen atom of the CO group.
looking along the axis of the helix from the N to the C terminus, the chain turns clockwise). One turn is formed by 3.6 residues, the pitch amounts to 0.54 nm. a-Helices occur both in globular and in fibrous proteins and are found in almost all transmembrane sections.
The b-pleated sheet forms slightly twisted planes. This structure is also stabilized by hydrogen bonds, however, between different strands. Between 2 … 15 strands may arrange themselves in parallel or antiparallel directions. The side chains of consecutive amino acids extend sideways in opposite directions.
Tertiary structure is a term which refers to larger arrangements, describing the location (x,y,z coordinates) of all atoms in space. Additional levels are frequently used:
Supersecondary structures are combinations of secondary structure elements, such as the coiled-coil a-helices (e.g., in many fibrillar proteins) or barrels (in globular proteins) or nucleotide-binding structures. A number of structural motifs occur in these superfolds.
Two or more a-helices can associate into an antiparallel arrangement, which allows interactions of their side chains (aa motif). This is an essential element of fibrous proteins (e.g., in a-keratin, Fig. 2.3-7 and in the segments of spectrin, which is present in erythrocytes), but does also occur in globular proteins (e.g., in hemoglobin, Fig. 2.3-6).
A number of common motifs occurring in globular proteins are caused by the turns of the peptide backbone at the end of b-pleated sheets (Fig. 2.3-4): Antiparallel b-pleated sheets frequently form b-loops (also called hairpin loops), which are stabilized by hydrogen bonds between a CO group and the third NH group of the sequence. A series of such turns can form a b-meander. Another arrangement of turns is the so-called ‘Greek key’. Parallel b-pleated sheets require crossover connections, which often assume right-handed helix structures (bab motif). These loops and crossover connections frequently occur on the outside of globular proteins.
Figure 2.3-2. Primary Structure of a Polypeptide Chain in Extended Conformation
The distances (in nm = 10 Å) and the bond angles are shown. The green quadrangles indicate the rigid structure of the peptide bonds. Y and F are the angles characterizing the rotation around the Ca-CO and N-Ca bonds (in this figure Y = F = 180°). The formation of hydrogen bonds leading to a helices is indicated.
Secondary structure (Fig. 2.3-3): These are regular arrangements of the backbone of the polypeptide chain, which are stabilized by hydrogen bonds between amide and carboxyl groups of the peptide and by sterically favorable backbone torsion angles. Frequently occurring secondary structures are the a-helix and the b-pleated sheet (Fig. 2.3-3). In globular proteins, a variable portion (often below 40 %, sometimes up to 100 %) is arranged in less regular loop structures, which are frequently found on the outside of water-soluble proteins.
The a-helix is a rod-like structure, which is formed by hydrogen bonds between a CO group and the fourth following NH group of the sequence (shown in Fig. 2.3-2). Helices formed by hydrogen bonds between other CO–NH pairs are rare. There are also van der Waals bonds across the helix. The side chains of the amino acids point to the outside. All a helices occurring in nature are right-handed (i.e., when
Figure 2.3-3. `-Helix (Top) and Antiparallel a-Pleated Sheet Structure (Bottom) C = black, O = red, N = blue, H = white, side chains = grey.