No part of this publication may be reproduced or transmitted in any form or by any means, electronic or mechanical, including photocopying, recording, or any information storage and retrieval system, without permission in writing from the publisher. Details on how to seek permission, further information about the Publisher’s permissions policies and our arrangements with organizations such as the Copyright Clearance Center and the Copyright Licensing Agency, can be found at our website: www.elsevier.com/ permissions.
This book and the individual contributions contained in it are protected under copyright by the Publisher (other than as may be noted herein).
ISBN 978-0-323-46121-4
eISBN 978-0-323-46122-1
Notices
Knowledge and best practice in this field are constantly changing. As new research and experience broaden our understanding, changes in research methods, professional practices, or medical treatment may become necessary.
Practitioners and researchers must always rely on their own experience and knowledge in evaluating and using any information, methods, compounds or experiments described herein. Because of rapid advances in the medical sciences, in particular, independent verification of diagnoses and drug dosages should be made. To the fullest extent of the law, no responsibility is assumed by Elsevier, authors, editors or contributors for any injury and/or damage to persons or property as a matter of products liability, negligence or otherwise, or from any use or operation of any methods, products, instructions, or ideas contained in the material herein.
For Elsevier
Content Strategist: Russell Gabbedy
Content Development Specialist: Joshua Mearns
Project Manager: Andrew Riley
Designer/Design Direction: Christian Bilbow
Printed in China
The publisher’s policy is to use paper manufactured from sustainable forests
Preface
Optical coherence tomography (OCT) continues to occupy an ever-expanding role in the ophthalmic community. OCT is widely available and forms a requisite portion of the comprehensive ophthalmic evaluation, particularly as it pertains to the retina. Although still a relatively young technology that continues to evolve, OCT has become widely accepted. This acceptance is due to its non-invasive nature, ease of image acquisition, and wealth of information that it affords. The quantity of information conveyed within a typical OCT scan is immense, which can be daunting to both the beginner and experienced clinician.
Atlas of Retinal OCT grew out of the success of Handbook of Retinal OCT. The Atlas expands on the images and material in the handbook, while maintaining a similar and consistent layout that will be familiar to the reader. This atlas was created to serve as a supplement to the original text, although the atlas certainly
can stand alone as an independent reference. We sought to include a breadth of retinal conditions with a focus on those most applicable to everyday clinical practice. However, a wide array of pathology is included to also illustrate unique, less common OCT findings. Each condition is illustrated with numerous, large, high-quality OCT images to highlight disease pathology and aid in disease identification. Additional imaging modalities, such as fundus photographs and fluorescein angiograms, are included to supplement OCT images where appropriate.
Atlas of Retinal OCT provides the reader with a high quality, easy-to-follow visual aid to incorporating OCT scans into the evaluation and care of your patients. The atlas is designed to make OCT more comprehensible for both the novice and expert clinician. We hope that the reader finds this to be a handy and practical addition to your everyday reference armamentarium.
Acknowledgments
A project such as this requires contributions from many different groups and individuals to be successful. First and foremost, the images used in this atlas would not be possible without our many patients. We are very grateful to these individuals who trust their care in our hands on a daily basis. Additionally, we rely on the talented photographers and technical staff at both the New England Eye Center at Tufts Medical Center and Retina Group of Florida to obtain the majority of the included OCT images. Their expertise is reflected in the volume of high quality images available for inclusion in this project. We would
also like to thank the many co-authors who have contributed to various chapters throughout the atlas. Additionally, thanks are due to our fellows whose archive of cases and interesting images were invaluable to this project. Specifically, we would like to thank Dr. Chris Or, who provided invaluable feedback on the final chapters. Lastly, the professionalism and expertise of the staff at Elsevier is unmatched. We want to thank the entire team at Elsevier who were critical to the completion of this project, in particular Russell Gabbedy, Humayra Rahman Khan, Joshua Mearns, and Andrew Riley.
Dedications
To the memory of my dear sister Candice, whose love, strength and determination live on in all that she touched. And to my daughter, Rona, who has added immeasurable joy to our lives.
D.R.G.
To Jujie, Memsie and Ammi, without whom none of this would have been possible.
N.K.W.
To my colleagues at the New England Eye Center who have assisted me in bringing innovation to eye care for over 3 decades.
J.S.D.
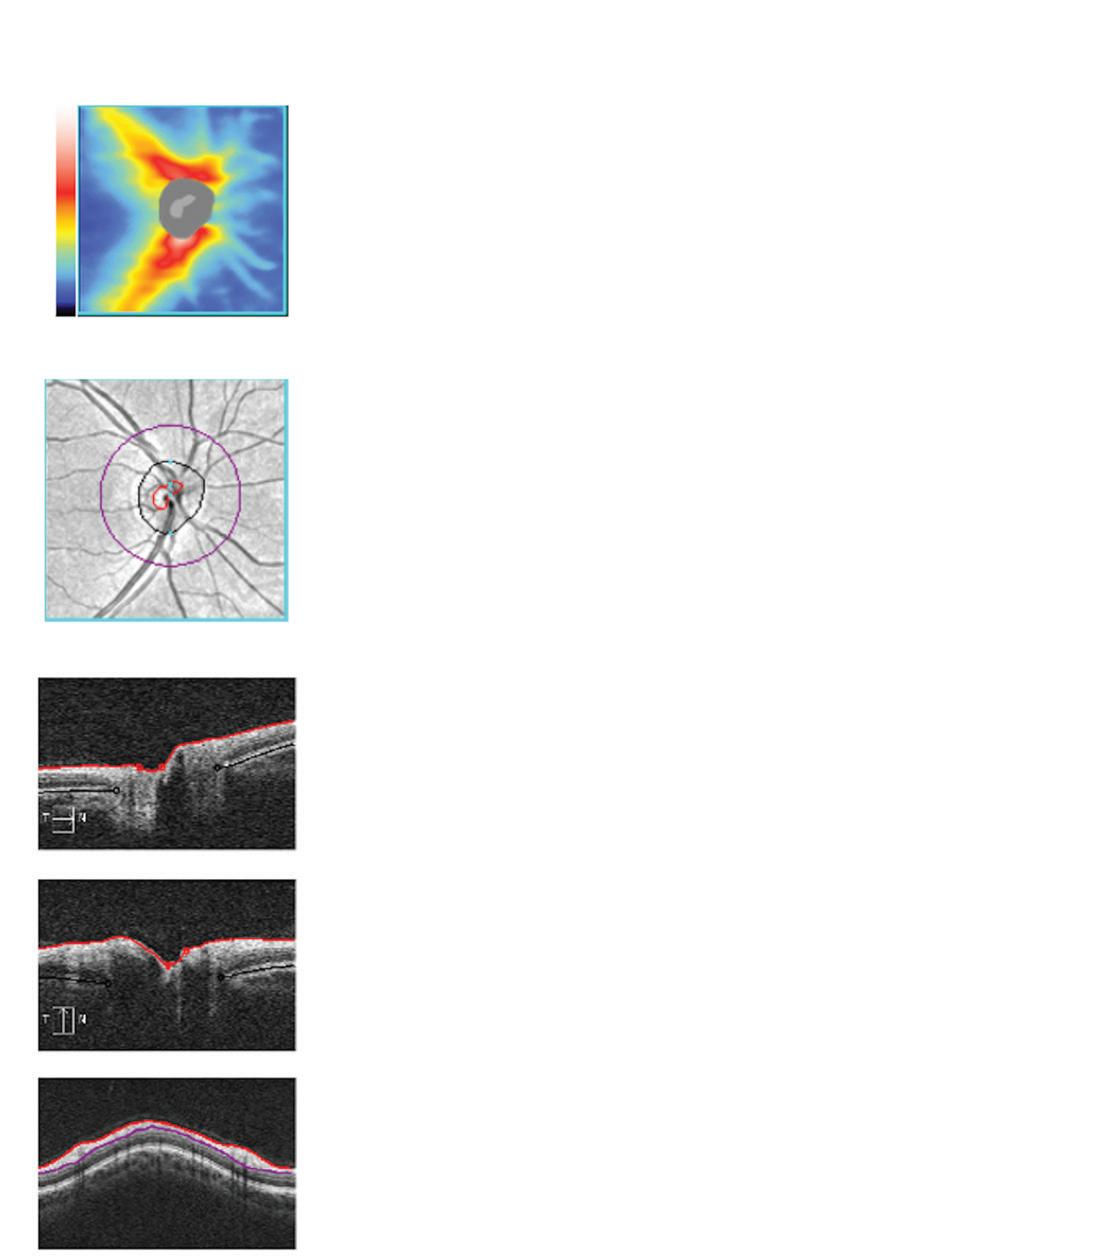
Thickness Map
Deviation Map
FIG. 1. Normal peripapillary RNFL, neuroretinal rim thickness, and disc area measurements using SD-OCT.
Summary
In spectral domain OCT (SD-OCT), a spectral interference pattern between the reference beam and the sample beam is obtained simultaneously by a spectrometer and an array detector. Unlike time domain (TD)-OCT, SD-OCT does not require a physically moving reference mirror, instead using frequency information to produce interference patterns. This allows for much faster acquisition and higher quality images than those with TD-OCT.
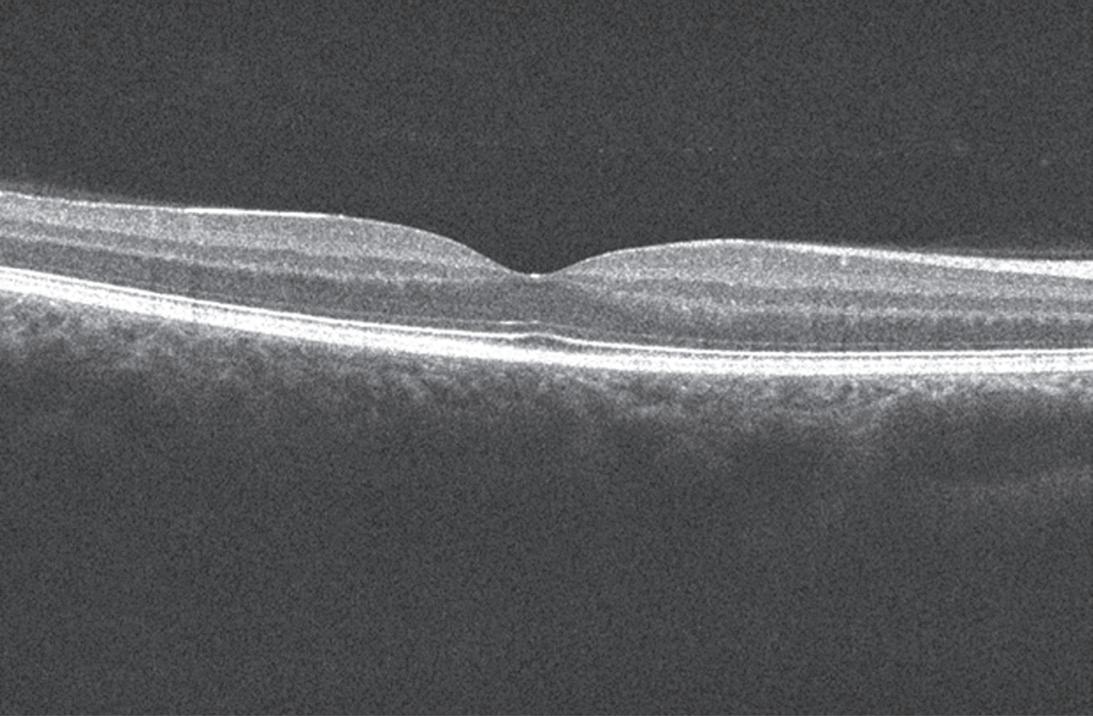
The high resolution provided by SD-OCT allows for visualization of the microscopic anatomy of the retina (Fig. 1) with more detail than with TD-OCT.
Spectral Domain OCT
Carlos A. Moreira Neto | Carl Rebhun
2.2
Because the retinal pigment epithelium (RPE) is highly hyperreflective with OCT imaging, there is limited penetration of light beyond it, decreasing the resolution of the choroid (Schuman, Fujimoto & Duker 2013). Normal mean central foveal thickness is approximately 225 ± 17 µm as measured by SD-OCT, although this varies with age and retinal status.
REFERENCE
Schuman J, Fujimoto J, Duker J. Optical Coherence Tomography of Ocular Diseases. 3rd ed. Thorofare NJ: Slack Inc.; 2013.
Ganglion cell layer
Inner plexiform layer
Choriocapillaris
RPE/Bruch’s complex
Photoreceptors outer segments Myoid
External limiting membrane
FIG. 1. Normal macula imaged using SD-OCT. IS/OS/EZ, Inner segment/outer segment/ellipsoid zone; RPE, retinal pigment epithelium.
Summary
Swept source OCT (SS-OCT) is a modified Fourier-domain and depth-resolved technology that offers potential advantages over SD-OCT, including reduced sensitivity roll-off with imaging depth, higher detection efficiencies, improved imaging range, and better
Choriocapillaris
Choroidal larger vessels
Inner plexiform layer
Inner nuclear layer
IS/OS/ EZ
External limiting membrane
2.3 Swept-Source OCT
Carlos A. Moreira Neto | Carl Rebhun
penetration of the choroid (Fig. 1). In SS-OCT, a narrow-band light source is rapidly swept through a wide range of frequencies. The interference pattern is detected on a single or small number of receivers as a function of time.
FIG. 1. Normal retina imaged using SS-OCT. EZ, ellipsoid zone; IS, inner segments; OS, outer segments; RPE, retinal pigment epithelium.
Summary
Until recently, the anatomy of the vitreous could not be imaged in vivo. With the use of OCT, a better view and understanding of vitreous structure has become possible. Along with normal structure, abnormal vitreous processes such as vitreomacular traction have been revealed (Duker et al. 2013). High dynamic range imaging as well as enhanced vitreous imaging techniques, present on most commercially available OCT devices, allow visualization of the fluid-filled spaces as well as the collagenous and cellular structure of the vitreous. Secondary features of vitreous debris are also often identifiable on SD-OCT (Fig. 1).
Normal Vitreous
Nadia K. Waheed
Key OCT Features
In OCT of a normal retina the following vitreous structures may be observed:
• Retrohyaloid space: Created after posterior vitreous detachment (Fig. 2).
• Premacular bursa: Liquid space overlying the macula, caused by liquefaction of the vitreous (Fig. 3).
REFERENCE
Duker JS, Kaiser PK, Binder S, et al. The International Vitreomacular Traction Study Group classification of vitreomacular adhesion, traction, and macular hole. Ophthalmology. 2013;120(12):2611–2619.
FIG. 1. Vitreous opacity (arrows) demonstrates shadowing on SS-OCT.
Posterior cortical vitreous (posterior hyaloid)
Retrohyaloidal space
FIG. 2. Posterior hyaloid and retrohyaloid spaces.
Vitreous
Premacular bursa Vitrepapillary adhesion
FIG. 3. Premacular bursa in a normal patient using SD-OCT.
OCT: Artifacts and Errors
Carlos A. Moreira Neto | Carl Rebhun
Artifacts can occur during image acquisition or analysis because of patient, operator, or software factors. Accurate image interpretation depends on the quality of the image and an understanding of the various artifacts that can affect an OCT image (Duker, Waheed & Goldman 2014).
Mirror Artifact
• Occurs only on spectral domain (SD)-OCT.
• Occurs when the area of interest crosses the zero-delay line and results in an inverted image.
• Reasons
1. OCT device is pushed too close to the eye.
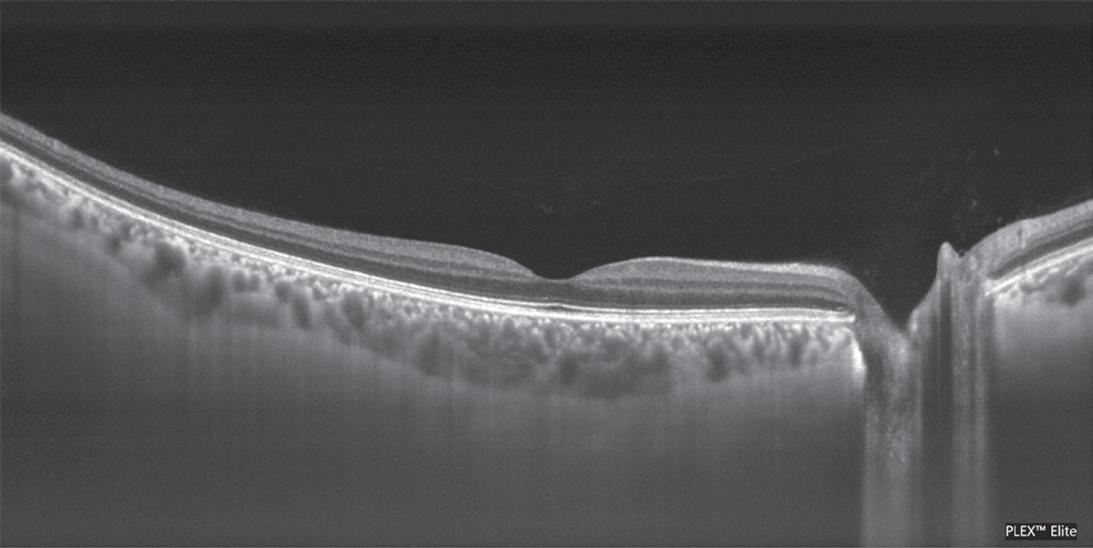
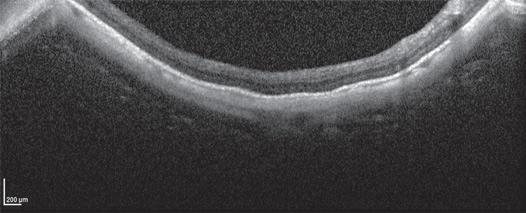
2. Conditions in which the curvature of the retina is such that it crosses the zero-delay line, such as retinoschisis, retinal detachment, an elevated choroidal lesion, or high myopia (Fig. 1).
Vignetting
• Occurs when the iris blocks a part of the OCT beam.
• Loss of signal is seen over one side of the image (Fig. 2).
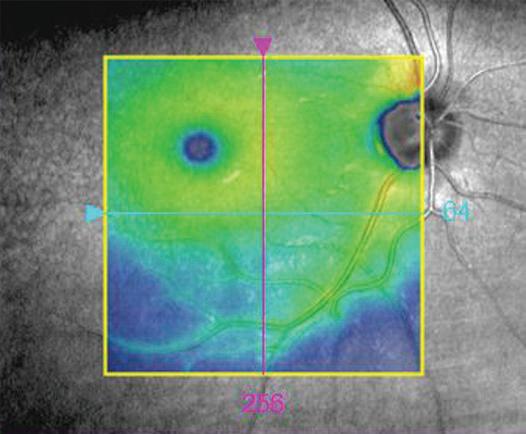
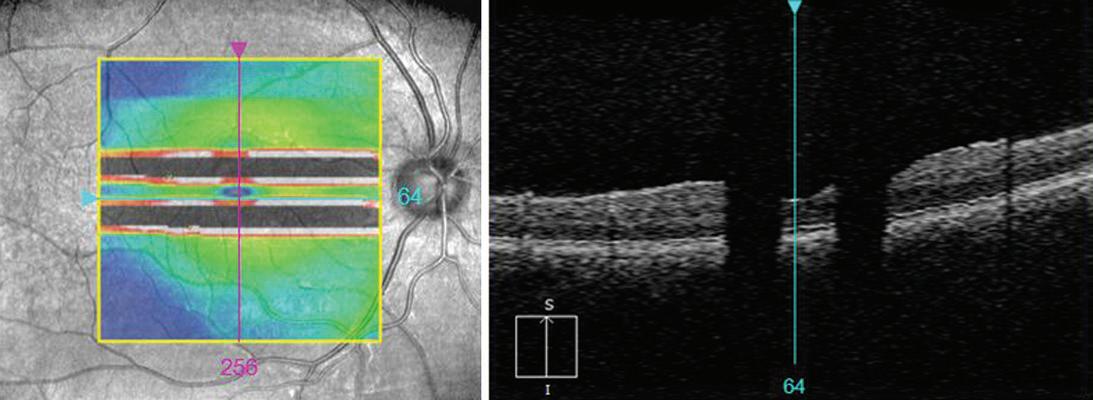
Misalignment
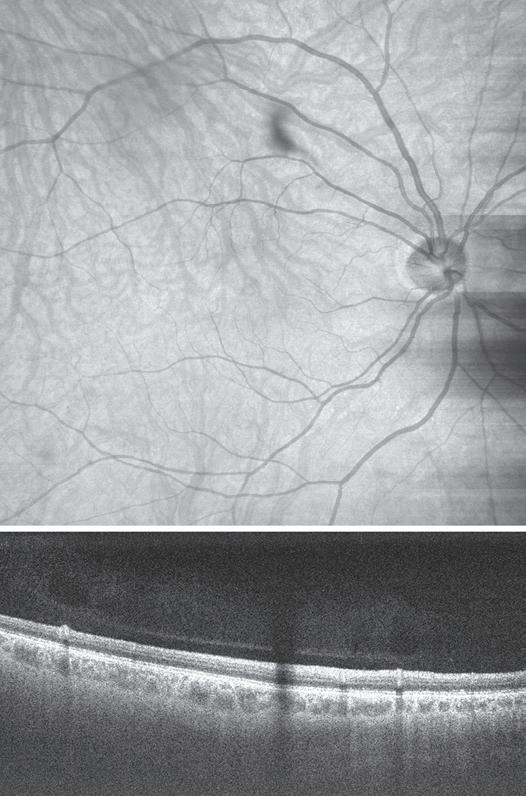
• This occurs when the fovea is not centered during the volumetric scan (Fig. 3).
• Most common reason is a patient with poor fixation or incorrect placement of fixation target by operator.
• The Early Treatment Diabetic Retinopathy Study (ETDRS) grid usually can be moved to obtain an accurate measure of the foveal thickness.
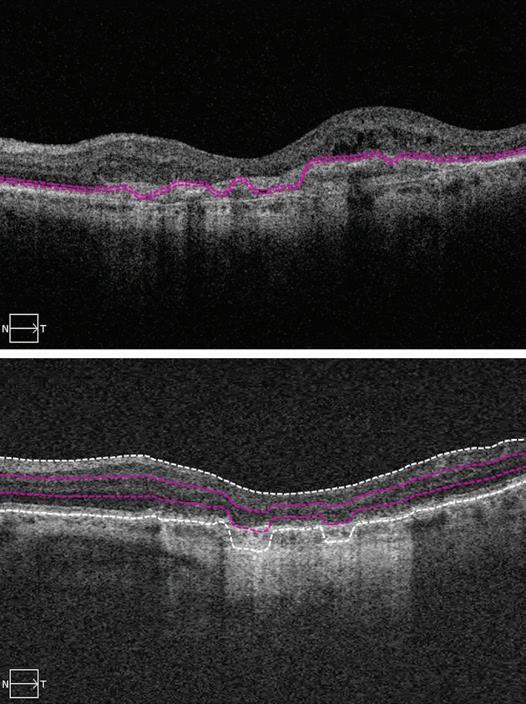
Software Breakdown
• OCT segmentation lines are incorrectly drawn because there is misidentification of the inner or outer retinal boundaries.
• Vitreomacular surface disorders (epiretinal membrane, vitreomacular traction) could cause inner line breakdown.
• Outer retinal/retinal pigment epithelium disorders (age-related macular degeneration, cystoid macular edema) might cause outer line breakdown (Fig. 4).
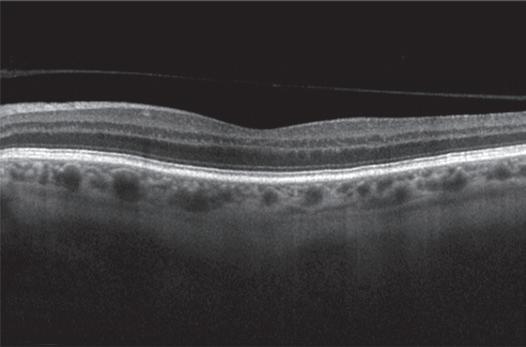
Blink Artifact
• If a patient blinks during image acquisition, loss of data occurs.
• OCT scans and volumetric maps both show black or white bars (Fig. 5).
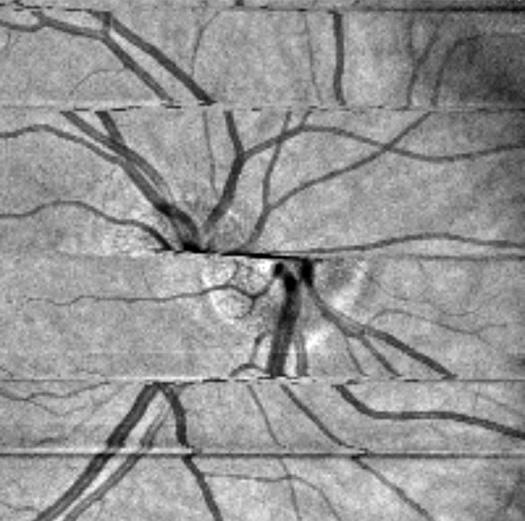
Motion Artifact
• Occurs when there is movement of the eye during scan acquisition.
• OCT image shows distortion or double scanning of the same area.
• Blood vessels are misaligned (Fig. 6).
• The fovea may be duplicated.
• This is much less common due to better eye tracking software on current OCT machines.
Real image
Mirror image
FIG. 1. Mirror artifact occurring in a high myopic eye.
FIG. 2. Vignetting: Loss of signal over the left side of the image.
Fovea
FIG. 3. Misalignment error. The fovea is not centered because of an eccentric fixation.
FIG. 4. Software breakdown caused by choroidal neovascularization (A) and geographic atrophy (B).
Blink artifact
FIG. 5. Blink artifact.
FIG. 6. Motion artifact.
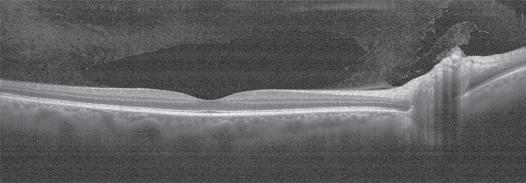
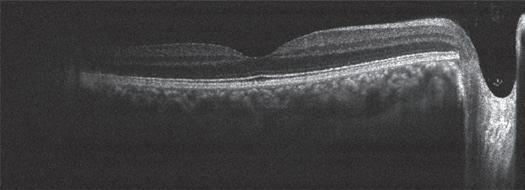
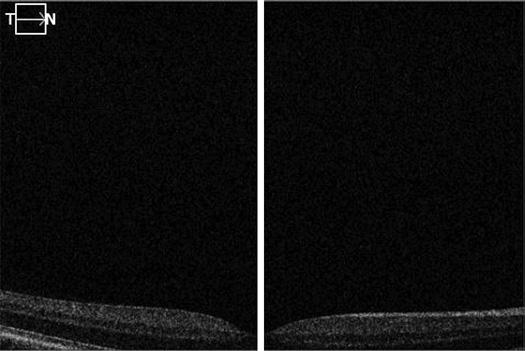
Out of Range Error
• Occurs when the B-scan is not centered in the preview screen, resulting in it being shifted out of the scanning range.
• A section of the OCT scan is cut off (Fig. 7).
REFERENCE
Duker JS, Waheed NK, Goldman DR. Artifacts on OCT. Handbook of Retinal OCT. St Louis: Elsevier; 2014.
7. Out-of-range error. Due to improper positioning of the machine during image acquisition, the outer retina and the choroid are cut off.