Charles P. Lyman Professor of Biology Director, Concord Field Station, Harvard University
Sheila N. Patek
Associate Professor of Biology, Duke University
Great Clarendon Street, Oxford, OX2 6DP, United Kingdom
Oxford University Press is a department of the University of Oxford. It furthers the University’s objective of excellence in research, scholarship, and education by publishing worldwide. Oxford is a registered trade mark of Oxford University Press in the UK and in certain other countries
The moral rights of the authors have been asserted
First Edition published in 2003
Second Edition published in 2018
Impression: 1
All rights reserved. No part of this publication may be reproduced, stored in a retrieval system, or transmitted, in any form or by any means, without the prior permission in writing of Oxford University Press, or as expressly permitted by law, by licence or under terms agreed with the appropriate reprographics rights organization. Enquiries concerning reproduction outside the scope of the above should be sent to the Rights Department, Oxford University Press, at the address above
You must not circulate this work in any other form and you must impose this same condition on any acquirer
Published in the United States of America by Oxford University Press 198 Madison Avenue, New York, NY 10016, United States of America
British Library Cataloguing in Publication Data
Data available
Library of Congress Control Number: 2018933083
ISBN 978–0–19–874315–6 (hbk.)
ISBN 978–0–19–874316–3 (pbk.)
DOI: 10.1093/oso/9780198743156.001.0001
Printed and bound by CPI Group (UK) Ltd, Croydon, CR0 4YY
Links to third party websites are provided by Oxford in good faith and for information only. Oxford disclaims any responsibility for the materials contained in any third party website referenced in this work.
2.10
3.5
3.6
5.6
5.7
5.8
5.9
7.4
7.5
7.6
7.7
7.8
7.9
8.5
8.6
9.1
Preface
The goal of this book is to provide a synthesis of the physical, physiological, evolutionary, and biomechanical principles that underlie animal locomotion. An understanding and full appreciation of animal locomotion requires the integration of these principles. Throughout this book, we present, as broadly as possible and within a reasonable amount of space, a discussion of animal locomotion that is accessible to undergraduates, yet also of value to more advanced graduate students and professionals. Toward this end, we provide the necessary introductory foundation that will allow a more in-depth understanding of the physical biology and physiology of animal movement. In so doing, we hope that this book will illuminate the fundamentals and breadth of these systems, while inspiring our readers to look more deeply into the scientific literature and investigate new features of animal movement.
Animal locomotion is so rich and diverse that it is daunting to try to write an introductory book, even at an upper-level undergraduate or graduate level. The scales of locomoting animals range from microscopic to house-sized and the habitats extend from the moist surface of delicate leaves to the depths of the open ocean. The study of animal locomotion itself extends back thousands of years as humans have performed observational and experimental studies of animal capabilities, whether due to simple fascination or with the desire to emulate nature’s capabilities. This is a big, historic field offering a wealth of inspiration, yet the field is grounded in a set of physical rules that unites much of the diversity and allows us to write a concise book about the core principles of animal locomotion.
Several themes run through this book. The first is that by comparing the modes and mechanisms by which animals have evolved the capacity for move-
ment, we can understand the common principles that underlie each mode of locomotion. A second is that size matters. One of the most amazing aspects of biology is the enormous spatial and temporal scale over which organisms and biological processes operate. Within each mode of locomotion, animals have evolved designs and mechanisms that effectively contend with the physical properties and forces imposed on them by their environment. Understanding the constraints of scale that underlie locomotor mechanisms is essential to appreciating how these mechanisms have evolved and how they operate. A third theme is the importance of taking an integrative and comparative evolutionary approach in the study of biology. Organisms share much in common. Much of their molecular and cellular machinery is the same. They also must navigate similar physical properties of their environment. Consequently, an integrative approach to organismal function that spans multiple levels of biological organization provides a strong understanding of animal locomotion. By comparing across species, common principles of design emerge. Such comparisons also highlight how certain organisms may differ and point to strategies that have evolved for movement in diverse environments. Finally, because convergence upon common designs and the generation of new designs result from historical processes governed by natural selection, it is also important that we ask how and why these systems have evolved.
When we decided to write the second edition of this book, which was first published more than a decade ago, our goal was to bring the first edition up to date, increase the diversity of animals covered in the book, and to address the burgeoning fields of evolutionary analysis of locomotion and the application of animal locomotor mechanisms to the development
of novel engineering devices. Naturally, the fundamental rules of physics have not changed, yet the depth of knowledge and development of impressive technical approaches to the study of these systems have moved quickly in particular areas. Some areas covered in the first edition could be written in the span of a few paragraphs, and now an entire chapter of new discoveries could be devoted to the topic. Without a doubt, the biggest challenge of writing and synthesizing this new edition was keeping the book straightforward and focused on guiding, fundamental principles, while trying to figure out how to navigate all of the fabulous discoveries that we simply could not fit in this short volume. As in the first edition, our foremost goal was to capture the fundamentals underling the study of animal locomotion, even if it meant leaving out much of the research and history of this vibrant field.
We have re-organized the book in multiple ways, both in terms of the coverage of the chapters and the topics of the chapters. The book begins with a chapter on the fundamentals of motion, and quickly moves to a chapter focused on muscles, a source of motion unique to animals, and how muscles interact with animal skeletons to transmit force for movement and support. We next consider the energetics of locomotion, focusing on how the metabolic cost of terrestrial movement varies with animal size and speed, and compares with the cost of flying and swimming. We then examine the principles of locomotion through a series of chapters that explore three major habitats - land, water, and air. The seventh chapter probes a suite of locomotor modes that transcend particular habitats and these modes include jumping, suspensory locomotion and adhesion. The eighth chapter examines the neuromuscular control of movement, providing an overview of sensory-motor pathways and motor recruitment that
are central to the dynamic nature of complex locomotor systems. We wrap up the book with a chapter on the evolution of locomotion that examines the broad trends in the evolution of locomotion, as well as the methods and levels of analysis for examining locomotor diversity. It is clear that between the first and second edition of this book, there has been exceptional growth in the comparative biomechanics and physiology of animal locomotion.
We have many people to thank for helping with both the first and second editions of this book. We are grateful to our students and colleagues with whom we have shared the fascination and love of animal movement, physiology and biomechanics. These interactions that have come from our work and discussions are the best part of science. For their insights on the first edition of the book, we thank George Lauder, Bob Shadwick, Gary Gillis, Ty Hedrick, Jim Usherwood, Bob Full, Tom Roberts, and Peter Weyand. Michael Dickinson and Bret Tobalske provided feedback on both editions. We thank Walter Federle for his assistance with synthesizing the field of adhesion in this second edition. We thank the students of Duke University’s “How Organisms Move” course and Brown University’s “Animal Locomotion” course taught by Sharon Swartz for their feedback on the second edition, especially Sarah Beaverson, Aakash Jain and Suzanne Ou. We are grateful to Rachel Crane and Grace Farley for their editorial assistance. We thank our editors for their assistance with the process of writing the first and second editions. Most of all, we are grateful to our families for their support and patience. This book is dedicated to Dick Taylor, Beth Brainerd, Farish Jenkins, Jr. and Karel Liem, whose unbounded enthusiasm for comparative physiology and love of animal locomotion are an inspiration to so many students and scientists.
A area, m2
List of Variables
A wavelength amplitude, m
A m muscle cross-sectional area, or ‘physiological’ cross-sectional area (PCSA) of a pinnate muscle, m2
Af fiber cross-sectional area, m2
AR aspect ratio, dimensionless
a acceleration, m s−2
α incline slope or angle of support (o, degree)
b (wing) span, m and scaling exponent, dimensionless
β duty factor, dimensionless
BL body length, m
BM body mass, kg
BW body weight, N
C a added mass coefficient, dimensionless
C
d coefficient of drag, dimensionless
Cl lift coefficient, dimensionless
CM center of mass, kg
Cnet net cost of transport, J m−1
Ctot total cost of transport, J m−1
c cost coefficient, J N−1
c' (wing) chord, m
c s slipping coefficient, dimensionless
D diameter, m
D drag, N
d local drag, N
dL limb displacement, m
ΔL muscle shortening, m
ds muscle shortening, m
d(θ) change in joint angle, rad or deg
E Young’s modulus or elastic modulus, Pa
E* total energy, J
Emetab metabolic energy rate, J s−1
Eff energetic efficiency, % (dimensionless)
EMA effective mechanical advantage or lever arm ratio, dimensionless
ε strain, dimensionless
ε0 maximum operating strain, dimensionless
F force, N
F0 isometric muscle force, N
Fadd adductor force, N
F ar acceleration reaction force, N
Ffrict static frictional grip, N
Flat laterally directed force, N
F m force of muscle fibers, N
Fr Froude number, dimensionless
f frequency, Hz
fnat natural frequency, Hz
fs stride frequency, s−1 or Hz
F t tendon force, N
F tan tangent force, N
G ground reaction force, N
GH horizontal fore-aft ground reaction force, N
GML medio-lateral ground reaction force, N
g acceleration due to gravity, m s−2
GV vertical ground reaction force, N
Γ circulation (line integral of velocity flow), m2 s−1
h height, m
η coefficient of friction, dimensionless
η ’ wave efficiency, dimensionless
I' moment of inertia, kg m2
k spring stiffness, N m−1
KE kinetic energy, J
kleg leg spring stiffness, N m−1
l or L length, m
L lift force, N
L c step length, m
LCM distance that center of mass is accelerated, m
lf muscle fiber length, m
Ll limb length traveled during landing, m
L pect lift force produced by pectoral fins, N
L s sarcomere length or stride length, m
L t limb length traveled during takeoff, m
L tot maximum jump length, m
λ wavelength (body undulation), m
m, M mass, kg
μ viscosity, Pa s
P power, W or J s−1
P* mass-specific power output, W kg−1
PE potential energy, J
PPE potential energy power, W or J s−1
ϕ collision angle, rad or deg
r and R moment arm, m
R resultant propulsive force, N
Re Reynolds number, dimensionless
ρ density of fluid, kg m−3
RQ respiratory quotient, dimensionless
S surface area, m2
S strength or maximum stress, N m−2
s position of moving object or projectile, m
σ force per unit area or stress, N m−2
σ0 maximum operating stress, N m−2
σf failure stress, N m−2
T thrust, N
T' torque, N m
T s stride duration or time, s
t time, s
tair time airborne during a jump, s
t c time of limb ground contact or time required to take off, s
θ various angles (joint, limb, heading, glide, grip), rad or deg
U* amount of strain energy absorbed per unit volume of material, J m−3
V ˙ O2max rate of oxygen consumption, ml O2 s−1
V volume of accelerated fluid, m3
v velocity, m s-1
vflap velocity of flapping wing, m s−1
v g glide velocity, m s−1
vh horizontal velocity or component of take-off velocity, m s−1
v max maximum velocity, m s−1
v r resultant velocity (of a wing), m s−1
v s sinking speed (of a glider), m s−1
vt take-off velocity, m s−1
v v vertical component of take-off velocity, m s-1
v w water velocity, m s−1
v * muscle’s intrinsic shortening velocity, lengths s−1
W work, J
Wf work of fracture, J m−2
CHAPTER 1
Physical and Biological Properties and Principles Related to
Animal Locomotion
Observations of the beauty, grace and sheer athleticism of locomoting animals inspire human fascination with movement. Which aspects of flight do darting hummingbirds and bumblebees share in common? How do they differ from a soaring petrel? Which principles of design are shared by a racing antelope, a scurrying lizard or a running cockroach, and in what ways do they differ? The grand scale of biological sizes and evolutionary diversity yields an impressive range of locomotor mechanisms. Yet, underlying this amazing diversity are fundamental principles of biological organization that can explain most of these locomotor systems. Studies of animal locomotion depend on an understanding of the physical principles that govern how animals move and properties of the media through which they move. These studies, in turn, explain why certain biological devices, such as a wing or a fin, share features that have evolved for movement within their particular fluid environments.
This book is about how animals move. It addresses basic physical principles and properties of the media in which animals move, seeking to explain the mechanical design and locomotor function of animals within these media. It also attempts to capture the amazing diversity of animal design and movement. Much of this diversity arises from the enormous range of sizes—from microscopic swimmers to the largest whales (1015 orders of magnitude in mass)—and the breadth of environments that animals inhabit. In this first chapter, we lay the groundwork for the more focused subsequent chapters. We examine the role of the environment
and the fundamentals of loading and forces in animal mechanics. We offer a quick review of scaling analyses as well as the key dimensions and units used in this book.
1.1 Environmental media
Land, air and water constitute the physical world of organisms. To a large extent, the properties of these media dictate the locomotor mechanisms that animals have evolved. For animals that move on land and fly, the properties of the air and gravity dominate their physical world. For most aquatic animals, however, gravity is of little concern. In addition, air and water play an important role as respiratory media and therefore affect locomotor design in terms of how energy is supplied for powering and sustaining movement. The capacity to move between physical environments is also important to many animals. This is the case for flying animals that must also be capable of movement on land or through water, as well as for terrestrial animals that live near the shore where locomotion in air and water are both required.
1.1.1 Physical properties of media
A few, key physical properties of air and water impact nearly any animal movement and locomotor mechanism (Table 1.1). Air and water are both fluids: fluid movement past the body of organisms is fundamental to nearly all forms of animal locomotion—even burrowing. Recent studies of burrowing
Table 1.1 The physical properties of air and water that influence the mechanisms of locomotion.
in granular media, such as sand, demonstrate an intriguing mix of fluid and solid properties and associated locomotor strategies. Of all the fluid properties, however, density varies the most: water density exceeds that of air by more than 800-fold. The difference in viscosity, though smaller in magnitude, also has an important influence on how fluid moves past an organism in motion.
Even though aerial flight and aquatic locomotion depend on the same fluid dynamic principles, the difference in density of these two media has significant implications for respiratory design and the capacity for flight, swimming and terrestrial locomotion of land animals. Oxygen content and the heat capacity of air versus water indirectly influence locomotor systems by affecting their thermal and respiratory function. As we will see, the locomotor capacity and strategy of animals depends on the delivery of oxygen to their tissues, especially the muscles, in order to generate metabolic energy in the form of adenosine triphosphate (ATP). Temperature and the availability of oxygen supply from the environment are critical to locomotor design.
1.1.2
Impact of physical media on locomotor function
Because of its much lower density and viscosity, air imposes proportionately smaller resistive (drag) forces for flying and terrestrial animals than for aquatic animals. The main problem for terrestrial animals therefore lies in overcoming mass-related gravitational forces as they move. The low density of air also means that flying animals must generate sufficient aerodynamic force (lift) to support their
weight, in addition to aerodynamic thrust to overcome drag associated with moving in a forward direction. Aquatic animals, on the other hand, need not worry much about supporting their weight, because the density of their bodies nearly matches that of water. Most aquatic animals therefore are neutrally, or slightly negatively, buoyant in water. The higher density and viscosity of water, however, means that drag poses a formidable obstacle to their movement. Consequently, drag reduction is critical, particularly at moderate to large size.
Differences in the oxygen content and heat capacity of the two media also affect the activity levels and locomotor strategies of animals. The greater oxygen content of air generally affords higher levels and broader strategies of activity for flying and running animals versus swimming animals. The higher heat capacity of water further constrains the locomotor capacities of swimming animals by making it more difficult for them to maintain a warmer body temperature than their surrounding environment. However, there are many exceptions to these general rules. Aquatic and cold-acclimated animals have evolved, and can adaptively express, metabolic enzymes that work well at low temperatures, enabling them to compensate for a colder environment. In addition, differing metabolic pathways for energy production afford animals varied locomotor strategies for daily activity that enable equally successful performance compared with that achieved by warmer animals.
1.2 Physics and energetics of movement
Animals move by exerting forces (F, measured in S.I.1 units of Newtons, N) on their external environment,
whether it is a solid substrate, air, or water. By Newton’s First Law:
a =
where m is the mass (in kilograms, kg) of the body moved and a is its acceleration (m/sec2). Therefore, an animal’s weight is a force produced by the acceleration of Earth’s gravity acting on its mass (m g). To move its body, an animal must do work (W):
where d is the distance (in meters, m) that the animal’s body moves as a result of the net force acting on it, in reaction to the forces that the animal transmits to the environment. Work (in Joules, J) represents the mechanical energy required to move the animal’s body. The amount of mechanical energy required to move per unit time, PW tF dt Fv == = //
represents the mechanical power (P, in Watts) of locomotion, and thus can be related to the forces that an animal exerts as it moves a given distance per unit time, or the velocity (v) of its movement.
The energetic efficiency (Eff) of an animal’s movement can be calculated by comparing the metabolic energy consumed (energy input) to the mechanical work (energy output) performed over a given period of time:
Eff = EnergyOut/Energ yIn (1.4)
= Work/MetabolicEnergy (1.5)
or equivalently, the mechanical power output versus the metabolic power input (/) PP outin . Typically, locomotor efficiencies are determined by comparing the oxygen consumption of an animal with the mechanical work performed over an integral number of strides. Because all animals must ultimately balance their energy needs by means of aerobic (oxygen-dependent) metabolism, measurements of oxygen consumption are commonly used to assess the energy supply of ATP needed for sustainable locomotor activity. Typically, a value of 20.1 kJ/liter O2 is used. This value assumes that ATP is produced by means of aerobic glycolysis (the breakdown of glycogen into glucose and its transformation via glycolysis and the Kreb’s cycle into ATP production
within the mitochondria by electron transport and oxidative phosphorylation).
1.3 Biomechanics of locomotor support
The forces required for locomotion are typically generated by the motor proteins within muscles, which are transmitted to the external environment by means of a skeleton. These forces cause deformations in the structures that transmit them. The ability of a structure to resist deformation when subjected to a given force is a measure of its stiffness and is the slope of a structure’s force-length relationship (Fig. 1.1a). Linearly elastic structures are defined as having a linear forcelength relationship, typical of a simple spring that is stretched. Although linear elasticity is easier to analyze, many biological structures exhibit nonlinear elasticity. Because larger structures can support larger forces, engineers commonly normalize for differences in the size of structures by dividing the force acting on a structure by the structure’s cross-sectional area (A, Fig. 1.1b). When normalized in this way, a force is defined as a stress (Greek sigma, σ):
= FA / (1.6)
Common units of stress relevant to the musculoskeletal systems of animals during locomotion are N/mm2 ( ==101622 N/mMN/m , or 1 MPa), or N/cm2 ( = 102 kN/m , or 10 kPa). Because these units of stress may be new to many readers, and also counterintuitive, a useful example is that the weight of an apple (about 1 N, certainly an apropos definition of a Newton!) balanced on the end of a toothpick (of 1 mm2 cross-sectional area) exerts a stress of 1 MPa. Whereas forces act on structures, stresses can be thought of as being transmitted through the structure. Large structures also undergo larger deformations than smaller structures. Once again, in order to account for differences in size, deformations or changes in length are normalized by dividing by the structure’s resting (unloaded) length (Fig. 1.1b,c), and are defined as a strain (Greek epsilon, ε):
ε =∆LL / (1.7)
As engineering terms, therefore, stress and strain have quite distinct meanings. However, whereas strain represents the real physical deformation of a structure in response to being loaded, the stress acting within the material represents a conceptualization
Figure 1.1 The mechanical properties of structures can be defined by how they deform in relation to different applied loads. (a) When a force (F) is applied to a structure with cross-sectional area (A), it deforms a given length (∆L). In linearly elastic structures, such as this spring which is lengthened linearly with the application of a force, the slope of force versus deformation represents the spring stiffness (k). (b) The response of a structure to a load varies in relation to its size. Size can be measured in terms of length or cross-sectional area. Structural properties, such as stiffness, k, in (a), do not account for size and thus vary across these examples. In contrast, material properties account for size by incorporating relative length or cross-sectional area; these examples are equivalent in terms of stress and strain. (c) Stress and strain are normalized for differences in size and thus reflect the material properties of a structure. The slope of stress versus strain represents the elastic modulus (E) of a material.
of the intensity of force transmission. Finally, by considering the size-independent properties of a material, stress and strain have an equivalent relationship to that of force and length (Fig. 1.1c), in which the stiffness of the material is the slope of the stress-strain relation, and is defined as the elastic modulus (also known as “Young’s modulus,” E):
E = σε / (1.8)
The force that causes a structure to break (Fig. 1.1a) corresponds to the strength, or maximum stress (Fig. 1.1c) that a structure can bear before failing. This also defines the strain at failure. The area under the force-length curve represents the amount of energy ( 12 / Fd × , for linearly elastic elements) that is absorbed by a structure when it is loaded (Fig. 1.2a). Similarly, the area under the stress-strain curve represents the amount of strain energy absorbed per unit volume of material ( U */ = 12 σε; Fig. 1.2b). If a structure is unloaded before breaking, this energy can be recovered elastically (much like a rubber
ball or an elastic band) and may be used to do work. Elastic structures exist within animals that can be used to store and recover elastic strain energy and thus reduce the work and metabolic cost of locomotion.
The elastic modulus and the energy absorbed before failure defines whether a material is “rigid” or “compliant” and “brittle” versus “tough.” Rigid materials deform little when loaded and have a high elastic modulus, whereas compliant materials undergo considerable strain for a given load and have a low modulus. Tough materials absorb considerable elastic strain energy before failing, whereas brittle materials, such as glass, absorb very little (Fig. 1.2c). Generally, tough materials are not as rigid—i.e. they have a lower elastic modulus—as brittle materials. On the other hand, although brittle materials may have a high failure strength and elastic modulus, they often fail relatively easily, especially when subjected to impact loads. Consequently, the amount of energy absorbed to failure is a measure
‘Brittle’ ‘Rigid’
Figure 1.2 The response of materials and structures to force and deformation yields information about stored energy, failure, and overall behavior during loading. (a) The energy absorbed by a structure when loaded is equal to the area under its force-deformation curve (for linearly elastic structures this is 1 / 2F × ∆1). The structure will break if force (Ff ) or deformation (Lf ) reach the threshold for failure. (b) The area under a material’s stress-strain curve also represents the energy absorbed per unit volume (U*; hatched area represents energy absorbed to failure and gray area represents energy absorbed at a maximum operating stress (σo) and strain (εo)). Typically, σ o and ε o of a material are much less than its failure stress (σf) and failure strain (εf). The ratio of a material’s failure stress relative to its operating stress (σf /σo) is often used to define the safety factor of a material or a structure. (c) The slopes of stress-strain curves can be used to compare the response of a material to loading. When stress increases rapidly with a small amount of strain, the material is “brittle”. In contrast, slow accumulation of stress with increasing strain indicates a compliant material. Tough materials store a much larger amount of energy (U*2) compared to brittle materials (U*1).
of the material’s “toughness.” Because biological structures are often subjected to dynamic loads, their ability to absorb strain energy is often the critical factor determining whether they break. In general, most biomaterials have evolved designs that enable them to be tough, so that they can absorb a considerable amount of energy before breaking. As a result, rigid biomaterials, such as bone or insect cuticle, exhibit a stress-strain relationship intermediate to brittle and compliant materials (Fig. 1.2c).
1.3.1 Modes of loading
The mechanical loading of support structures consists of four types of loads: 1) axial tension, 2) axial compression, 3) bending, and 4) torsion (Fig. 1.3). When subjected to axial loads, the stress developed depends only on the structure’s cross-sectional area relative to the magnitude of the applied load. Tension is defined as an axial load that elongates a structure, whereas compression is defined as a load
that shortens the structure along a given axis. When subjected to bending, both tensile and compressive stresses act within a structure (Fig. 1.3b). Compression occurs on the concave surface and tension on the convex surface, with the greatest stress acting at the surfaces in the plane of bending. Consequently, there is a gradient of stress (and strain) from maximum compression on one surface to maximum tension on the opposite surface (Fig. 1.3c). This means that midway through the structure’s cross-section a neutral plane exists where stress and strain are zero. If a structure is subjected to bending and axial compression or tension, this will cause a shift in the neutral plane, displacing it from the midpoint of the section. Unlike axial compression or tension, stresses due to bending depend on the shape of the crosssection as well as its size. This is because material located near the neutral plane of bending experiences lower stresses.
Beam-like elements with hollow, rather than solid, cross-sections therefore provide much better resistance
‘Tough’ ‘Compliant’
Figure 1.3 Biological (and synthetic) structures are subjected to a variety of loading modes. Whereas (a) long-axis (axial) tension and compression result in uniform stress or strain distributions across the cross-section of a beam, (b) bending and torsion produce non-uniform gradients of stress and strain. (c) In the case of bending, maximum tension and compression occur on opposing surfaces with a plane of zero strain across the beam’s midsection (neutral plane of bending). (d) In torsion, the location of zero strain is an axis running through the center of the beam. Typically, bending and torsion produce much greater strains, with the possibility of failure, than when a structure is loaded in tension or compression.
to bending for a given weight (Fig. 1.3c). This is why bicycle frames and many other structures (tent poles) are constructed with a tubular design. For the more ambitious reader, the mechanical basis of this shape factor, termed the second moment of area, is provided in engineering texts (e.g. Beer and Johnston, 1981; Wainwright et al., 1976). A symmetric tubular shape is favored when a range of bending loads in various directions are likely to act on the structure. Finally, the stresses developed in bending depend not only on the magnitude of the bending force (Fb), but the bending moment ( FL b / × 2 , in the case of bending stresses developed at a midpoint of a beam, Fig. 1.3b left; and FL b × , in the case of stresses at the base of a beam subjected to cantilever bending, Fig. 1.3b right). This means that longer beams,
such as the long bones of a vertebrate limb, are more likely to experience large bending-induced stresses than short elements, such as the vertebrae. In addition to axial loading and bending, structures may also be loaded in torsion, which involves a rotational moment applied about the long axis of a beam-like structure (Fig. 1.3d). As with bending, cross-sectional shape also influences how well torsion is resisted. In this case, shape depends on the distribution of material away from the neutral axis of torsion (for a circular beam this is the midpoint of the cross-section). In general, biological structures that effectively resist bending also provide effective resistance to torsional loads. Strong twisting of the body about a structural member is not common in the natural movements of most animals, but there are contexts when enabling twisting can reduce failure, such as in coral arms that twist in response to flow, or accommodate failure, such as in long insect legs that twist slightly or buckle when launching rapidly (Bayley et al., 2012; Etnier, 2003; Vogel, 2007). When twisting happens suddenly and without mechanisms to reduce stresses, such as when a ski’s binding fails to release in response to a twisting motion of the skier’s body, unfortunate consequences often result!
1.3.2 Safety factors
Like human-engineered devices, biological structures are designed (by means of natural selection) to have a “factor of safety” in order to reduce their risk of failure. Safety factors are often defined in terms of the ratio of a structure’s strength relative to the maximum stress that it is likely to experience over its lifetime of use ( σσfo / , Fig. 1.2b). Engineered structures are typically built to have safety factors as high as ten. This means that the maximum anticipated load would not exceed one-tenth of the structure’s maximum load capacity. With a safety factor of ten, the chance of failure is quite low; a comforting fact when using an elevator to move up several floors of a tall building! With more stringent performance requirements (such as aircraft, which must minimize weight) or a lower cost for failure, the safety of a structure may be less. Safety factors might also be defined in terms of toughness and strain energy. However, because these are often much more diffi-
cult to measure, stress is most often used to define a structure’s safety factor.
Biological safety factors are generally less than the safety factors of engineered buildings and mechanical devices; more often ranging between two and eight. For example, in order for the tibia of a gazelle, which has failure strength of 200 MPa, to maintain a safety factor of four during fast galloping or jumping, the size of its tibia and its manner of loading must ensure that the maximal stresses developed within the bone do not exceed 50 MPa during these activities. The lower safety factors of biological structures are likely due, in part, to the fact that animals must also pay a price for maintaining and transporting the mass of their tissues when they move. This cost is likely balanced against the benefit of a reduced risk of failure (Alexander, 1981). Finally, it is likely that the failure of structures that would most reduce an animal’s fitness, such as a primary limb bone versus a distal phalanx or a feather shaft, would favor a higher safety factor. The relative incidence of bone fracture within thoroughbred race-horses appears to provide evidence of this: fracture is highest in the distal limb bones, lower in the proximal femur and humerus, and lowest in the vertebral column and skull (Currey, 1981).
1.4 Scaling: the importance of size
Size is arguably one of the most important variables affecting the function and form of organisms. This is because changes in size during growth and over evolutionary time impose changes in the relative dimensions of organisms that have important functional consequences. Many physiological processes and mechanical properties depend on key structural dimensions, such as surface area or thickness, which change dramatically with changes in size. When differently sized structures retain the same shape, they are considered to scale isometrically, or to be “geometrically similar.” For geometrically similar structures (Fig. 1.4), all linear dimensions scale in proportion to one another. That is, Lengths (L) are proportional to diameters (D); areas (A) are proportional to L2 or D2, and to volume (V)2/3
As a result, area-dependent processes change at a different rate with respect to processes that are linear- or volume-dependent. This is important for both the physiological and mechanical functions of organisms. For example, the capacity of animals to sustain activity depends on their ability to transport oxygen and fuel substrates to the mitochondria inside their muscle fibers. Ultimately, this depends on the rate of diffusion across cellular and mitochondrial
Figure 1.4 Geometric scaling strongly influences the relative dimensions of differently sized animals. For example, while length dimensions scale linearly across different animals, area (A) scales with the square of length.
membranes, which in turn depends on the surfacearea of exchange surfaces. However, if the energy demand or work required to move the animal depends on its mass (or volume), this poses a scaledependent constraint of energy supply relative to energy demand that is proportional to A/V or VM1313 // () equivalentto for geometrically similar animals. In other words, a 100-fold increase in size can be expected to impose nearly a five-fold reduction in an animal’s capacity to fuel its activity. This would mean that an animal’s mass-specific metabolism , defined as the amount of energy that each gram of its tissue requires to meet its metabolic needs, would decrease five-fold due to the decrease in surface area relative to volume at a larger size. The effect of size on energy metabolism associated with fueling locomotor activity is discussed at length in Chapter 3.
A similar area versus volume constraint operates with respect to mechanical support. This is because stress depends on force per unit area, which means that stresses are likely to increase with size (again, for a 100-fold increase in mass, weight-related stresses can be expected to increase nearly five-fold). Unless the tissue strength of the skeleton increases in a similar fashion, the risk of failure may become exceedingly high. For animals built of similar materials, this means that they must either evolve mechanisms for reducing the weight-related forces generated within their musculoskeletal systems or drastically restrict their performance.
To a certain extent, animals may deviate from geometric similarity, in order to compensate for the scale effects of size. When this happens distortions of shape, or allometric changes in structural and functional properties, occur with size. Allometric
Figure 1.5 Scaling of morphological and physiological features can be compared on arithmetic or logarithmic coordinates. The shape and variation in scaling relationships are illustrated in terms of (a) area versus volume and (b) length versus volume on arithmetic coordinates and (c) on logarithmic coordinates. The isometric scaling pattern is depicted as a grey line in each graph and the allometric relationship is shown as dark line. Scaling of area vs volume is positively allometric and length vs volume is negatively allometric. (d) Given the typical scatter of biological data, a least-squares linear regression fit of the logarithmically-transformed data is used to determine the scaling exponent (slope, b) and coefficient (y-intercept, a) of the exponential relationship: Y = aXb.
scaling might reflect, for example, either a relative shortening or lengthening of an element or its relative thickening or thinning for a given mass or area. When the scaling change is greater than that expected for isometry, it is defined as positive allometry; when less than the isometric expectation, it is defined as negative allometry. Even moderate allometric scaling requires substantial distortions in shape when size changes over several orders of magnitude (Fig. 1.5). A good example of positive allometry is the scaling of mammalian lung surface area (Fig. 1.6a), in which lung surface area was found to scale with a slope of 0.92 when plotted on logarithmic axes. This indicates that the lungs of larger mammals are much more finely partitioned than would be expected if geometrically similar to the lungs of small mammals. The observed scaling of lung surface area also suggests a greater aerobic capacity for locomotion than if the lungs of larger animals remained isometric in design (see Chapter 3). In a more recent re-analysis of morphometric data for respiratory surface area of both ectothermic and endothermic air and water breathers that incorporated phylogenetic effects (Gillooly et al., 2016), similar positive allometric scaling was found for endothermic respiratory surface area slope = () 089 , which exceeded the scaling of respiratory surface area in ectotherms ( slope = 078 ; Fig. 1.6b). This provides an example in which the scaling of a key structural feature of the lungs, important to diffusive gas exchange, can be related to the metabolic demand for gas exchange. If, on the other hand, differently sized animals retain a similar shape (i.e. scale close to geometric similarity) alternative mechanisms must evolve to compensate for functional constraints of size. We will see how size affects locomotor mechanisms. Indeed, much of the locomotor diversity of animals reflects this fundamental aspect of their biology.
1.4.1 Allometric equation
Geometric or allometric scaling of physiological functions and structural dimensions can be related to changes in size by the exponential equation,
Ya X b = (1.9)
where b is termed the “scaling exponent” and a is the “scaling coefficient” relating changes in variable Y to changes in variable X. This equation can be linearized by means of logarithmic transformation: logloglog Ya bX =+ (1.10)
in which case, the scaling exponent becomes the slope, b, and log a is the Y-intercept of the line relating log Y to log X (Fig. 1.5d). Frequently, base-10 logarithms are used to linearize the exponential relationships describing the structural and physiological scaling of organisms (as in Fig. 1.6a). However, natural logarithms (ln, base e) are sometimes also used (as in Fig. 1.6b). The linear relationship described by Eq. 1.10 has the benefit of allowing data to be graphed over several orders of magnitude and the use of regression methods for statistical evaluation of empirically determined relationships between two variables. Such “bivariate plots” commonly have scatter around the predicted scaling line, which provides a measure of how strongly correlated the two variables are with respect to each other. Deviations from the observed scaling pattern may also provide important insight into how a particular species has evolved a distinctive functional design. Chapter 9 (Evolution) discusses in greater detail how scaling analyses are performed across the phylogenetic relationships of animals.
1.5 Dimensions and units
It is important (and of practical use) to distinguish between dimensions and units in describing and analyzing the design of organisms. Dimensions represent the fundamental physical features of a variable. Variables such as force (F) are defined in terms of mass (M) and the mass’ acceleration (a). Similarly, velocity is defined in terms of the dimensions length (L) per unit time (T). The quantitative measure of dimensions is expressed in terms of units. Consequently, depending on the set of units used to measure them, variables will have different values. Units for force may be a dyne, a Newton, or pound. Units of length may be inches, centimeters, or meters. The Standard International (SI) system of units has been adopted throughout the scientific community and is the system that will be used in this book. Because it is a metric system, forces are measured in Newtons,
Slope = 0.92 (isometry predicts 0.67)
(kg)
Figure 1.6 The scaling of respiratory surface area with body mass in vertebrates exhibits positively allometric slopes, indicating strong selection for pulmonary diffusion capacity so that oxygen uptake meets the increased metabolic demand for oxygen delivery at larger size. (a) For terrestrial mammals, lung alveolar surface area scales with as slope of 0.92. Adapted from Gehr et al. (1981). (b) When accounting for phylogeny and considered more broadly across endothermic birds and mammals, respiratory surface area scales similarly to the non-phylogenetic analysis shown in (a). The slope for endotherms (0.89) exceeds the slope for ectothermic vertebrates (0.78). Isometric or geometrically similar scaling would predict a slope of 2/3 (or 0.67). Adapted from Gillooly et al. (2016).
Eland Wildebeest
Gazelle
Dik-dik
Genet cat Suni
Dwart mongoose
Sheep Goat
Camel Zebu cattle
Giraffe
lengths in meters, and velocities in meters per second (m/s).
All biological and physical variables can be defined in terms of three fundamental dimensions: length, mass and time. Several variables with their commonly used dimensions and fundamental dimensions are shown in Table 1.2. These dimensions provide a means for ensuring that equations are dimensionally correct (which is of equal, if not greater, importance than being quantitatively correct; as quantitative accuracy depends on dimensional accuracy). This, in turn, can often help to identify a key variable that may be missing from the equation, if the equation is found to be dimensionally incorrect.
1.6 Summary
In this first, foundational chapter of Animal Locomotion, we launched a series of key ideas that will reappear throughout the book. The media in which animals locomote are important not only to the generation of locomotor forces, but also to the ability to acquire enough oxygen to power the motion.
Table 1.2 The dimensions of key biological variables used for dimensional analysis.
Variable Common dimensions Fundamental dimensions
Force Mass and acceleration
Velocity Distance and time
Work Force and distance
Stress Force and area
MLT−2
LT−1 (equivalent in this case)
ML2T−2
ML−1T−2
The contrast in density between water and air has major consequences for the large drag forces that must be overcome in water, as well as for heat transfer and oxygen access. In order to generate forces, animal structures must resist and accommodate loads. The characterization of load on biological structures therefore revolves around force, length changes, cross-sectional area and the mode of loading, such as bending. In addition, biological structures and materials must accommodate energy without failure, which is measured in terms of compliance, toughness, rigidity and brittleness, and also in terms of safety factors, which represent the factor above normal loads that an animal can withstand without breaking. Scaling is fundamental to locomotion—not just in terms of the size and forces of locomotion, but also the access to oxygen across sizes given the substantial differences in the way that surface area and volume scale relative to length. These basic principles will appear throughout the book as we explore the media through which animals locomote as well as the scaling, biomechanics and energetics that accompany the diversity of locomotor mechanisms and environments.
Additional reading
Alexander, R. M. (1983). Animal Mechanics, 2nd ed. London: Blackwell Scientific. Vogel, S. (2013). Comparative Biomechanics: Life’s Physical World. Princeton, Princeton University Press. Wainwright, S. A., Biggs, W. D., Currey, J. D. and Gosline, J. M. (1976). Mechanical Design in Organisms London: Arnold.
CHAPTER 2
Muscles and Skeletons
The Building Blocks of Animal Movement
Animal locomotion depends on the organization, physiology and biomechanical properties of muscles and skeletons. Musculoskeletal systems encompass the mechanical interactions of muscles and skeletal elements that ultimately transmit force for movement and support. Muscles not only perform work by contracting and shortening to generate force, they can also operate as brakes to slow the whole body or a single appendage. Muscles can also function as struts (rod-like) to maintain the position of a joint and facilitate elastic energy storage and recovery. Skeletal muscles share a basic organization and all rely on the same protein machinery for generating force and movement. Variation in muscle function, therefore, depends on the underlying mechanical and energetic components, enzymatic properties and activation by the nervous system. Muscles require an internal, external or hydrostatic skeletal system to transmit force for movement and support. In the vertebrates and arthropods, muscle force transmission occurs through jointed skeletal segments and levers. The variation and mechanics of musculoskeletal systems enable animals to support themselves and move through their diverse environments.
2.1 Muscles
In order to function as biological motors, muscles generate movement by doing work. Muscles do this by exerting force (F) while shortening (change in length, ΔL). Hence, the term “muscle contraction.” The product of force and length change equals work
() WF L=∆ , which is measured in terms of joules Nm () . Muscles most commonly change length over distances of millimeters, so that the work they perform is given in millijoules (mJ). Work per unit time, in turn, equals the power ( PF Lt=∆ ∆ / , 11 WattJ/s = ) produced by a muscle. By definition, muscles produce positive power when they shorten (decreases in length are defined as being positive). However, as we will see, muscles can also function to generate force with little or no change in length, in which case the contraction is referred to as isometric. Ideal isometric contractions result in zero work and power. Muscles can also maintain a constant force while changing length (isotonic contraction). Other muscles may lengthen as they generate force (e.g. lowering a barbell during a biceps workout), thereby absorbing energy and doing negative work (ΔL is defined as negative in this case).
2.2 Molecular organization: mechanism of force generation and shortening
In skeletal muscles, overlapping sets of actin and myosin filaments are arranged in repeating units called sarcomeres along a muscle fiber’s length (Fig. 2.1). Each sarcomere is comprised of two sets of actin filaments extending from either end (z-disc) of the sarcomere. The actin filaments overlap by interdigitating with the myosin filaments that extend from the sarcomere midline. The sarcomeres are organized in series (joined together at neighboring z-discs) and form a myofibril that runs end to end within the muscle fiber. This regular patterning and
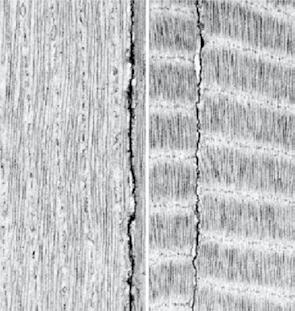
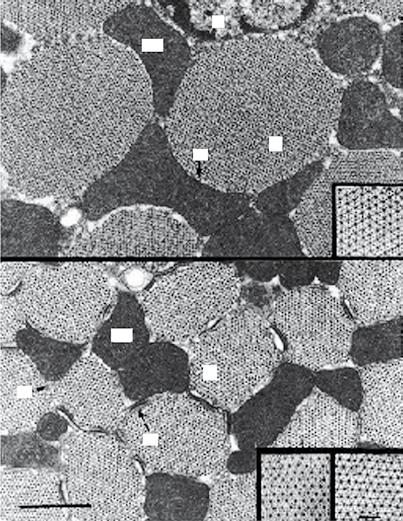
Figure 2.1 Cross-striated and obliquely-striated muscles are formed by hierarchical structuring and organization of actin and myosin filaments into sarcomeres. (a) Striated muscle is made of muscle fibrils within which the filaments [thin (actin) and thick (myosin)] form sarcomeres. The actin thin filaments connect to the Z-disks and form a characteristic banding pattern with the lighter I band around each Z-disk, where the actin filaments attach, and the darker A band which extends the length of the myosin filaments. Muscles are powered by ATP produced by the mitochondria that are spread throughout muscle cells. The transverse tubules (T-tubules) conduct an arriving stimulus from a motorneuron to stimulate Ca2+ ion release from the sarcoplasmic reticulum and trigger cross-bridge cycling and muscle contraction. Reprinted from Loeb and Gans (1986) with permission from Elsevier. (b) In these transmission electron micrographs (TEM) of squid (Loligo pealei) the tentacle fibers exhibit a cross-striated appearance (right image) whereas the arm muscles have obliquely-striated fiber arrangements (left image). Scale bar 1 μm. Image from Kier and Curtin (2002) with permission of the Company of Biologists Ltd. (c–e) The hexagonal organization of myosin and actin filaments can be seen in cross-section with insets (d–e) showing higher magnification images of the myofilament arrays. Synchronous insect flight muscle, large scale bar = 1 μm, small scale bar = 0.1 μm; reproduced from Josephson et al. (2000) with permission of the Company of Biologists Ltd. Abbreviations: SR, sarcoplasmic reticulum; M, myofilaments; t, tracheole; d, dyad (connection between SR and t-tubule).
organization of sarcomeres within the myofibrils creates a striped appearance when viewed under a microscope. Therefore, these skeletal muscles are often referred to as striated muscle (in contrast to smooth muscles found in arteries, the gut and elsewhere, which lack sarcomeric organization). In addition to the cross-striated vertebrate and invertebrate muscles, obliquely striated muscles are found in annelids and cephalopods.
During a muscle contraction, myosin cyclically attaches to and detaches from actin (cross-bridge cycling) so that the actin and myosin filaments move past each other in opposite directions. The flexible heads of the myosin molecules, projecting from the myosin filament, form the cross-bridges that attach and detach in a cyclical fashion at binding sites along the actin filaments. Myosin filaments are made of a polymeric chain of myosin protein elements, each consisting of a heavy chain and two light chains that form a pair of globular domains at the myosin’s “head” end. Each myosin head is flexible and capable of undergoing conformational rotation in the presence of ATP. ATP binds to each cross-bridge and allows the myosin to release from the actin binding
site and re-attach to another binding site along the actin filament. The actin filaments are comprised of actin monomers organized into an extended double helical chain. A recent study indicates that the number of myosin heads binding during contraction can be modulated based on the load; high loads stretch the thick filament increasing the number of additional myosin heads that may form cross-bridges (Linari et al., 2015).
Each cross-bridge cycle involves the hydrolysis (splitting) of one ATP molecule. Chemical energy released from ATP is converted into the force and rotational movement of the myosin head. As a result, myosin is both a machine that transforms chemical energy into mechanical work and an enzyme (myosin-ATPase) that hydrolyzes ATP. ATP hydrolysis occurs at the final step of the crossbridge cycle when the myosin head detaches from actin and is then free to seek another binding site. ATP binding energizes the actin-myosin complex, enabling the subsequent conformational rotation of the myosin head. Rates of cross-bridge cycling (and ATP hydrolysis) that underlie the speed of muscle shortening and force development, therefore, can