New pedagogical features include revised/new figures and photographs that provide improved graphic illustration of ideas and issues. Data and concepts are updated throughout the text, including the addition of critical terms to the glossary and a review of the appendices. This edition is closely tied to online resources in Connect, which support studying and learning for students as well as teaching and grading for instructors. Resources on Connect include figures, animations, movie clips, data analysis exercises, online quizzes, and course management software.
Specific Changes to Chapters
∙ Prologue A discussion of the contributions of Arab navigators in exploring and opening the Indian Ocean to trade is included.
∙ Chapter 1
∙ Chapter 2
∙ Chapter 3 The discussion of marine clays has been revised and several images have been replaced.
∙ Chapter 4 The discussion of the speed of sound in seawater and the sofar channel have been revised.
∙ Chapter 5
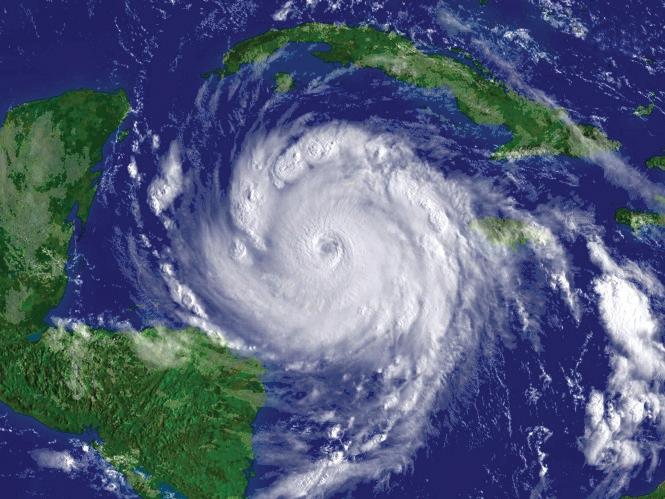
∙ Chapter 6 New figures have been added for several topics and the discussion of hurricanes has been updated.
∙ Chapter 7 Information on the Antarctic circumpolar current has been updated, a discussion of the Pacific decadal oscillation has been expanded, and a discussion of the Atlantic multidecadal oscillation has been added.
∙ Oceanography from Space was updated to include the latest generation of satellites, with a new section on the future of satellite oceanography.
∙ Chapter 8 The discussion of rogue (or episodic) waves has been updated and new figures added.
∙ Chapter 9
∙ Chapter 10 There are several new images of primary and secondary coasts as well as beach types.
∙ Chapter 11 was restructured to better represent the information for the chapter. A new section on adaptations to pressure was added, and several images were added. A new Diving In box on the use of environmental DNA was added, and more content on biodiversity was added
∙ Chapter 12 was restructured to better represent the information for the chapter. A new Diving In box on harmful algal blooms was added, and several figures were updated or replaced.
∙ Chapter 13 New figures were added or replaced, and the content was updated. More information about noise pollution was included.
∙ Chapter 14 More emphasis on organism adaptations to the environment was included.
∙ Chapter 15 Content was updated. New information about the Pacific garbage patch and about marine protected areas and fishing was added.
∙ Chapter 16 Content was updated. A new Diving In box on the Intergovernmental Panel on Climate Change was included.
Acknowledgments
As a book is the product of many experiences, it is also the product of many people working hard to produce an excellent text. We owe very special thanks to the McGraw-Hill team of professionals who created the book you have in your hands:
Managing Director: Thomas Timp
Brand Manager: Michelle Vogler
Product Developer: Jodi Rhomberg
Director of Development: Rose Koos
Marketing Manager: Danielle Dodds
Content Project Manager: Laura Bies
Buyer: Susan Culbertson
Designer: Tara McDermott
Photo Researcher: Carrie Burger
Reviewers
In addition we would like to particularily thank the following people who authored Diving In special interest boxes.
American Public University System, Robert McDowell
Cornell University, Charles Greene
Florida SouthWestern State College, Joseph F. van Gaalen
Metropolitan State University of Denver, Beth Simmons
Northern Illinois University, Ross Powell
Palm Beach State College, Waweise Schmidt
University of Findlay, Gwynne Stoner Rife
University of Massachusetts-Amherst, Julie Brigham Grette
University of Texas, Austin, G. Christopher Shank
University of Texas, Dallas, Ignacio Pujana
University of Washington, Eddie Bernard
We would also like to thank the following individuals who wrote and/or reviewed learning goal-oriented content for LearnSmart
American Public University System, Robert McDowell
Broward College, David Serrano
Broward College, Nilo Marin
Northern Arizona University, Sylvester Allred
Jessica Miles
Roane State Community College, Arthur C. Lee
University of North Carolina at Chapel Hill, Trent McDowell
University of Wisconsin, Milwaukee, Gina S. Szablewski
Our thanks and gratitude go out to the following individuals who provided valuable input vital for this text.
American Public University System, Robert McDowell
Appalachian State University, Ellen A. Cowan
Bellevue College & North Seattle Community College, Gwyneth Jones
Blinn College, Amanda Palmer Julson
Blinn College, Michael Dalman
Boise State University, Jean Parker
Bowie State University, William Lawrence
Brevard Community College, Ashley Spring
Brevard Community College, Eric Harms
Broward College, Jay P. Muza
California Polytechnic State University, Randall Knight
California State University Fullerton, Wayne Henderson
California State University Monterey Bay, Cecile Mioni
California State University Northridge, Karen L. Savage
Citrus College, George M. Hathaway
City University of Seattle, Gregory W. Judge
Coastal Carolina University, Angelos K. Hannides
Coastal Carolina University, Eric D. Rosch
Coastal Carolina University, Erin J. Burge
Coastal Carolina University, George E. Boneillo
Coastal Carolina University, Keith Walters
College of San Mateo, John Paul Galloway
College of the Atlantic, Sean Todd
College of the Desert, Robert E. Pellenbarg
Columbia College, Glen White
Columbia River Estuary Study Taskforce, Micah Russell
Columbus State University, William James Frazier
Concordia University, Sarah B. Lovern
Diablo Valley College, Maya Yamato
Dickinson College, Jeff Niemitz
Dixie State College of Utah, Jennifer Ciaccio
Eastern Illinois University, Diane M. Burns
Eastern Illinois University, James F. Stratton
Eastern Kentucky University, Walter S. Borowski
East Los Angeles College, Steven R. Tarnoff
East Stroudsburg University, James C. Hunt
Eckerd College, Joel Thompson
Edgewood College, Dan E. Olson
Edison State College, Rozalind Jester
Fairleigh Dickinson University, Shane V. Smith
Farmingdale State College, Michael C. Smiles
Fitchburg State University, Elizabeth S. Gordon
Florida Gulf Coast University, Toshi Urakawa
Florida Gulf Coast University, James G. Douglass
Florida State College, Rob Martin
George Mason University, E. C. M. Parsons
Hartnell College, Phaedra Green Jessen
Howard Community College, Jill Nissen
Indiana State University, Jennifer C. Latimer
Johnson State College, Tania Bacchus
Kent State University, Carrie E. Schweitzer
Kent State University, Elizabeth M. Griffith
Lincoln Land Community College, Samantha Reif
Lock Haven University, Khalequzzaman
Louisana State University, Lawrence J. Rouse
Lynchburg College, David Perault
Madison College, Steven Ralser
Manhattanville College, Wendy J. McFarlane
Marian University, Ronald A. Weiss
Massachusetts Institute of Technology, Raffaele Ferrari
Metropolitan State University of Denver, Beth Simmons
Metropolitan State University of Denver, Thomas C. Davinroy
Millersville University, Ajoy Kumar
MiraCosta College, Oceanside, Patty Anderson
Monterey Peninsula College, Alfred Hochstaedter
New College of Florida, Sandra L. Gilchrist
Northern Illinois University, Reed P. Scherer
Oberlin College, Steven Wojtal
Old Dominion University, Shannon L. Wells
Palm Beach Atlantic University, Donald W. Lovejoy
Palm Beach State College, Waweise Schmidt
Pasadena City College/California Institute of Technology, Martha House
Philadelphia University, Jeffrey Ashley
Pima Community College, Nancy Schmidt
Princeton University, Danielle M. Schmitt
Purdue University, Jim Ogg
Rollins College, Kathryn Patterson Sutherland
Saint Paul College, Maggie Zimmerman
Southwestern College, Ken Yanow
Spring Hill College, Charles M. Chester
Suffolk County Community College, Jean R. Anastasia
SUNY Maritime College, Marie de Angelis
Tarrant County College—Southeast Campus, Christina L. Baack
Texas A&M University, Douglas Biggs
Texas A&M University, Mary Jo Richardson
Texas Southern University, Astatkie Zikarge
Texas State University, San Marcos, Richard W. Dixon
University of California, Davis, Anthony J. Menicucci
University of California, Davis, Tessa M. Hill
University of Findlay, Gwynne Stoner Rife
University of Hawaii, Evelyn F. Cox
University of Kansas, G. L. Macpherson
University of Maryland University College; Northern Virginia Community College; The Johns Hopkins University, T. John Rowland
University of Michigan, Michela Arnaboldi
University of Michigan, Robert M. Owen
University of Nebraska, Lincoln, John R. Griffin
University of New England, Stephan I. Zeeman
University of Northern Colorado, William H.Hoyt
University of Puget Sound, Michael Valentine
University of Richmond, Roni J. Kingsley
University of Seattle, Gregory W. Judge
University of South Carolina, Michelle L. Hardee
University of South Florida, Chantale Bégin
University of Texas, Austin, G. Christopher Shank
University of Texas, Permian Basin, Lori L. Manship
University of West Georgia, David M. Bush
University of Wisconsin-Madison, Harold J. Tobin
Victor Valley College, Walter J. Grossman
Waubonsee Community College, George Bennett
Wenatchee Valley College, Rob Fitche
Wester Connecticut State University, J. P. Boyle
Western Michigan University, Michelle Kominz
Western New England University, Alexander Wurm
Whatcom Community College, Doug McKeever
Wheaton College, Stephen O. Moshier
Windward Community College, Michelle Smith
Wright State University, Paul J. Wolfe
Students—study more efficiently, retain more and achieve better outcomes. Instructors—focus on what you love—teaching.
SUCCESSFUL SEMESTERS INCLUDE CONNECT
For Instructors
You’re in the driver’s seat.
Want to build your own course? No problem. Prefer to use our turnkey, prebuilt course? Easy. Want to make changes throughout the semester? Sure. And you’ll save time with Connect’s auto-grading too.
Make it simple, make it affordable.
They’ll thank you for it.
Adaptive study resources like SmartBook® help your students be better prepared in less time. You can transform your class time from dull definitions to dynamic debates. Hear from your peers about the benefits of Connect at www.mheducation.com/highered/connect
Connect makes it easy with seamless integration using any of the major Learning Management Systems Blackboard®, Canvas, and D2L, among others to let you organize your course in one convenient location. Give your students access to digital materials at a discount with our inclusive access program. Ask your McGraw-Hill representative for more information.
Solutions for your challenges.
A product isn’t a solution. Real solutions are affordable, reliable, and come with training and ongoing support when you need it and how you want it. Our Customer Experience Group can also help you troubleshoot tech problems although Connect’s 99% uptime means you might not need to call them. See for yourself at status.mheducation.com
For Students
Effective, efficient studying.
Connect helps you be more productive with your study time and get better grades using tools like SmartBook, which highlights key concepts and creates a personalized study plan. Connect sets you up for success, so you walk into class with confidence and walk out with better grades.
“ I really liked this app it made it easy to study when you donʼt have your textbook in front of you.”
—Jordan Cunningham, Eastern Washington University
No surprises.
The Connect Calendar and Reports tools keep you on track with the work you need to get done and your assignment scores. Life gets busy; Connect tools help you keep learning through it all.
Study anytime, anywhere.
Download the free ReadAnywhere app and access your online eBook when it’s convenient, even if you’re offline. And since the app automatically syncs with your eBook in Connect, all of your notes are available every time you open it. Find out more at www.mheducation.com/readanywhere
Learning for everyone.
McGraw-Hill works directly with Accessibility Services Departments and faculty to meet the learning needs of all students. Please contact your Accessibility Services office and ask them to email accessibility@mheducation.com, or visit www.mheducation.com/about/accessibility.html for more information.
PROLOGUE
The History of Oceanography
Prologue Outline Learning Outcomes
After studying the information in this chapter students should be able to:
1. discuss the interaction of early civilizations with the oceans,
2. sketch the major seafaring routes of the great voyages of discovery in the fifteenth and sixteenth centuries, James Cook’s voyages of discovery, and the scientific voyages of Charles Darwin and the Challenger expedition,
3. list the major discoveries of the Challenger expedition,
4. compare and contrast the methods of making scientific measurements in the nineteenth and twentieth centuries, and
5. describe the difference in both the quantity of oceanographic data and the density of that data available to oceanographers now compared to the nineteenth century.
P.1 The Early Times 4
P.2 The Middle Ages 7
P.3 Voyages of Discovery 8
P.4 The Importance of Charts and Navigational Information 10
P.5 Ocean Science Begins 12
P.6 Early Expeditions of the Nineteenth and Twentieth Centuries 14
Diving In: The Voyage of the Challenger, 1872–76 15
P.7 Ocean Science in Modern Times 17
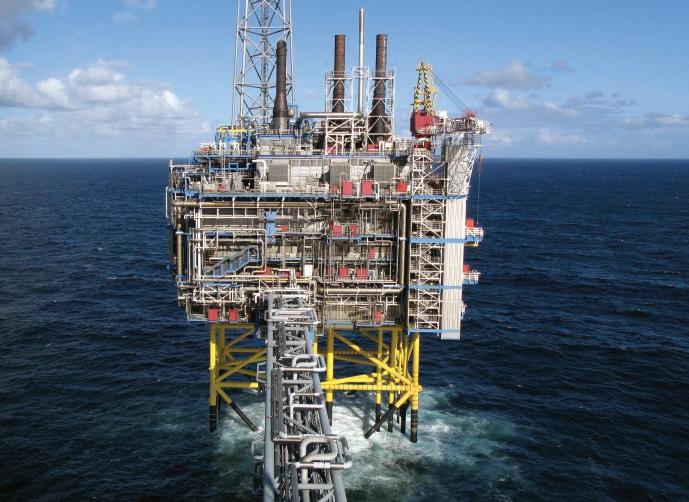
Diving In: “FLIP,” the FLoating Instrument Platform 19
Diving In: Ocean Social Science 24
Summary 26
A sextant and marine charts. The sextant is an early navigational aid first constructed by John Bird in 1759.
Oceanography is a broad field in which many sciences are focused on the common goal of understanding the oceans. Geology, geography, geophysics, physics, chemistry, geochemistry, mathematics, meteorology, botany, and zoology have all played roles in expanding our knowledge of the oceans. Oceanography is often broken down into a number of subdisciplines.
Geological oceanography includes the study of Earth at the sea’s edge and below its surface, and the history of the processes that form the ocean basins. Physical oceanography investigates the causes and characteristics of water movements such as waves, currents, and tides and how they affect the marine environment. It also includes studies of the transmission of energy such as sound, light, and heat in seawater. Marine meteorology (the study of heat transfer, water cycles, and air-sea interactions) is often included in the discipline of physical oceanography. Chemical oceanography studies the composition and history of the water, its processes, and its interactions. Biological oceanography concerns marine organisms and the relationship between these organisms and the environment in the oceans. Ocean engineering is the discipline that designs and plans equipment and installations for use at sea.
The study of the oceans was promoted by intellectual and social forces as well as by our needs for marine resources, trade and commerce, and national security. Oceanography started slowly and informally; it began to develop as a modern science in the mid-1800s and has grown dramatically, even explosively, in the last few decades. Our progress toward the goal of understanding the oceans has been uneven and progress has frequently changed direction. The interests and needs of nations as well as the scholarly curiosity of scientists have controlled the ways we study the oceans, the methods we use to study them, and the priority we give to certain areas of study. To gain perspective on the current state of knowledge about the oceans, we need to know something about the events and incentives that guided people’s previous investigations of the oceans.
P.1 The Early Times
People have been gathering information about the oceans for millennia, accumulating bits and pieces of knowledge and passing them on by word of mouth. Curious individuals must have acquired their first ideas of the oceans from wandering the seashore, wading in the shallows, and gathering food from the ocean’s edges. During the Paleolithic period, humans developed
the barbed spear, or harpoon, and the gorge. The gorge was a double-pointed stick inserted into a bait and attached to a string. At the beginning of the Neolithic period, the bone fishhook was developed and later the net. Metal fishhooks were first produced by the Egyptians. When this happened is still a question being studied, but most sources date this at 2500 to 2000 B.C
The remains of shells and other refuse, in piles known as kitchen middens, have been found at the sites of ancient shore settlements. These remains show that our early ancestors gathered shellfish, and fish bones found in some middens suggest that they also used rafts or some type of boat for offshore fishing. The artifacts that have been found probably give us only an idea of the minimum extent of ancient shore settlements. Drawings on the walls of the tomb of Ti (a high-ranking Egyptian official in the Fifth Dynasty, about 2400 B.C.) show fishermen using nets. As long ago as 1200 B.C. or earlier, dried fish were traded in the Persian Gulf; in the Mediterranean, the ancient Greeks caught, preserved, and traded fish, while the Phoenicians founded fishing settlements, such as “the fisher’s town” Sidon, that grew into important trading ports.
Early information about the oceans was mainly collected by explorers and traders. These voyages left little in the way of recorded information. Using descriptions passed down from one voyager to another, early sailors piloted their way from one landmark to another, sailing close to shore and often bringing their boats up onto the beach each night.
Some historians believe that seagoing ships of all kinds are derived from early Egyptian vessels. The first recorded voyage by sea was led by Pharaoh Snefru about 3200 B.C. In 2750 B.C., Hannu led the earliest documented exploring expedition from Egypt to the southern edge of the Arabian Peninsula and the Red Sea.
The Phoenicians, who lived in present-day Lebanon from about 1200 to 146 B.C., were well known as excellent sailors and navigators. While their land was fertile it was also densely populated, so they were compelled to engage in trade to acquire many of the goods they needed. They accomplished this by establishing land routes to the east and marine routes to the west. The Phoenicians were the only nation in the region at that time that had a navy. They traded throughout the Mediterranean Sea with the inhabitants of North Africa, Italy, Greece, France, and Spain. They also ventured out of the Mediterranean Sea to travel north along the coast of Europe to the British Isles and south to circumnavigate Africa in about 590 B.C.
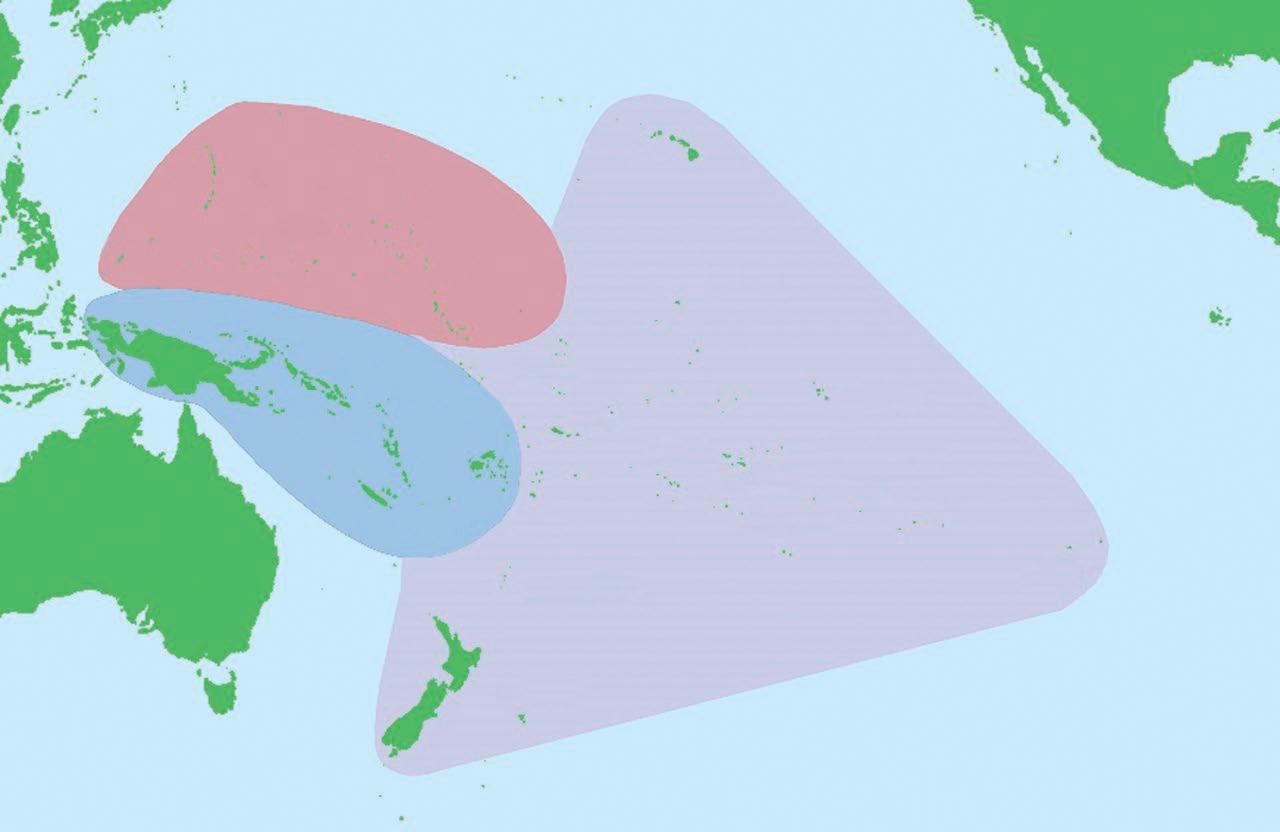
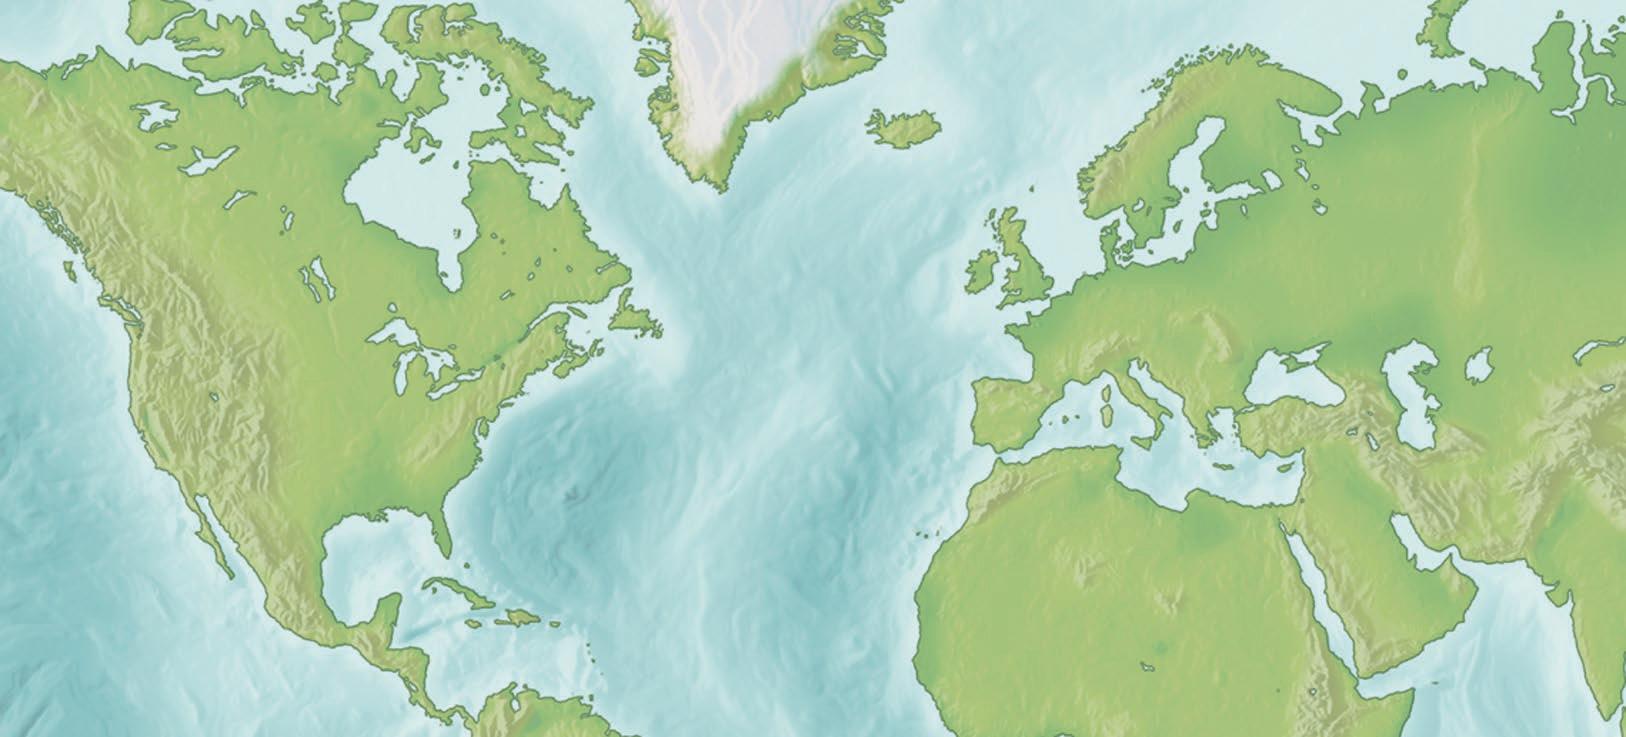
Evidence from anthropology and archaeology suggests that the people who first explored and populated the Pacific and Indian Ocean basins migrated from Asia to the island of Taiwan and then to the main island of Luzon in the north Philippines sometime between 4500 and 2500 B.C. (fig. P.1a). These people are known as the Austronesians. Over the next 1000 years they moved progressively south through the rest of the Philippines and the nearby islands of the Celebes Sea, Borneo, and Indonesia. This was relatively easy because of the comparatively short distances between islands in the far southwestern Pacific region. The Austronesians would travel west into the Indian Ocean basin and east further into the Pacific Ocean basin. Those who traveled west reached present day Sulawesi, Java, and Sumatra around
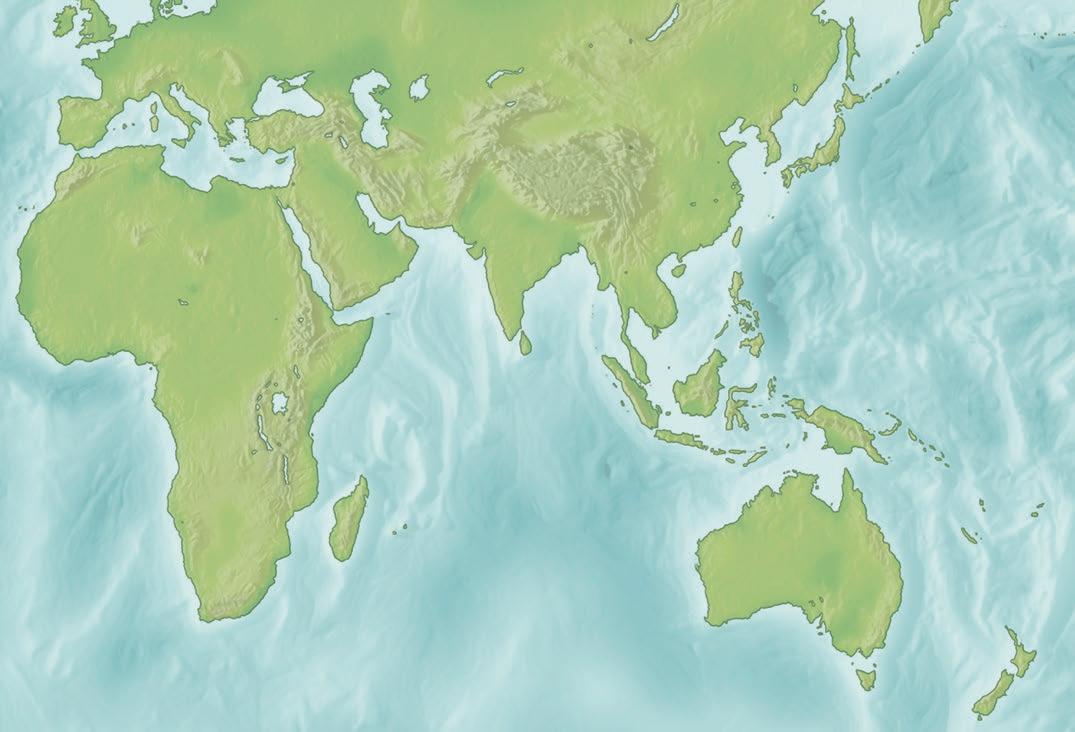
Figure P.1 (a) The migration of people across the Indian and Pacific Ocean basins. Specific dates are estimates from current research but may change with further study. The pale dashed red border shows the maximum extent of known Austronesian migration. Austronesians migrated from Asia into the far western Pacific by 2500 B.C. They then moved west into the Indian Ocean and east into the Pacific Ocean. (b) The regions of Melanesia and Micronesia in the Pacific Ocean were populated between 2000 and 1500 B.C. Polynesia was populated by 1000 B.C., and the Polynesians later extended their voyages throughout a triangular-shaped region bounded by Easter Island to the east, the Hawaiian Islands to the north, and New Zealand to the south.
3000 B.C. and later, sometime between A.D. 400 and 1100, Madagascar (fig. P.1a). The Austronesians who traveled east populated the islands of Melanesia and Micronesia (fig. P.1b) between 2000 and 1500 B.C. They then continued east and began populating the islands of Polynesia by 1000 B.C., leading to the development
of the distinctive Polynesian culture. Polynesians embarked on more extensive voyages, where the distances between islands grew from tens of kilometers in the western Pacific to thousands of kilometers in the cases of voyages to the Hawaiian Islands and Easter Island. There is some uncertainty about when they settled specific regions. It is thought they reached and colonized Easter Island around A.D. 300 and the Hawaiian Islands by about A.D. 400, and they arrived in New Zealand around A.D. 1280. By the early thirteenth century, Polynesians had colonized every habitable island in a triangular region roughly twice the size of the United States, bound by Hawaii to the north, New Zealand to the southwest, and Easter Island to the east (fig. P.1b).
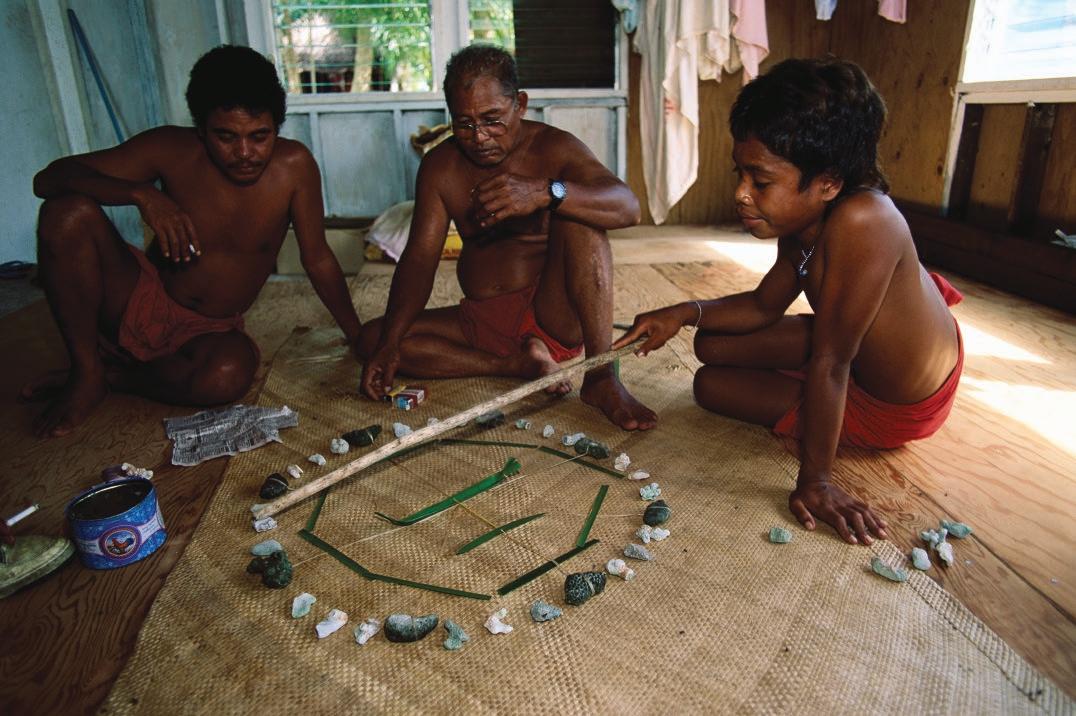
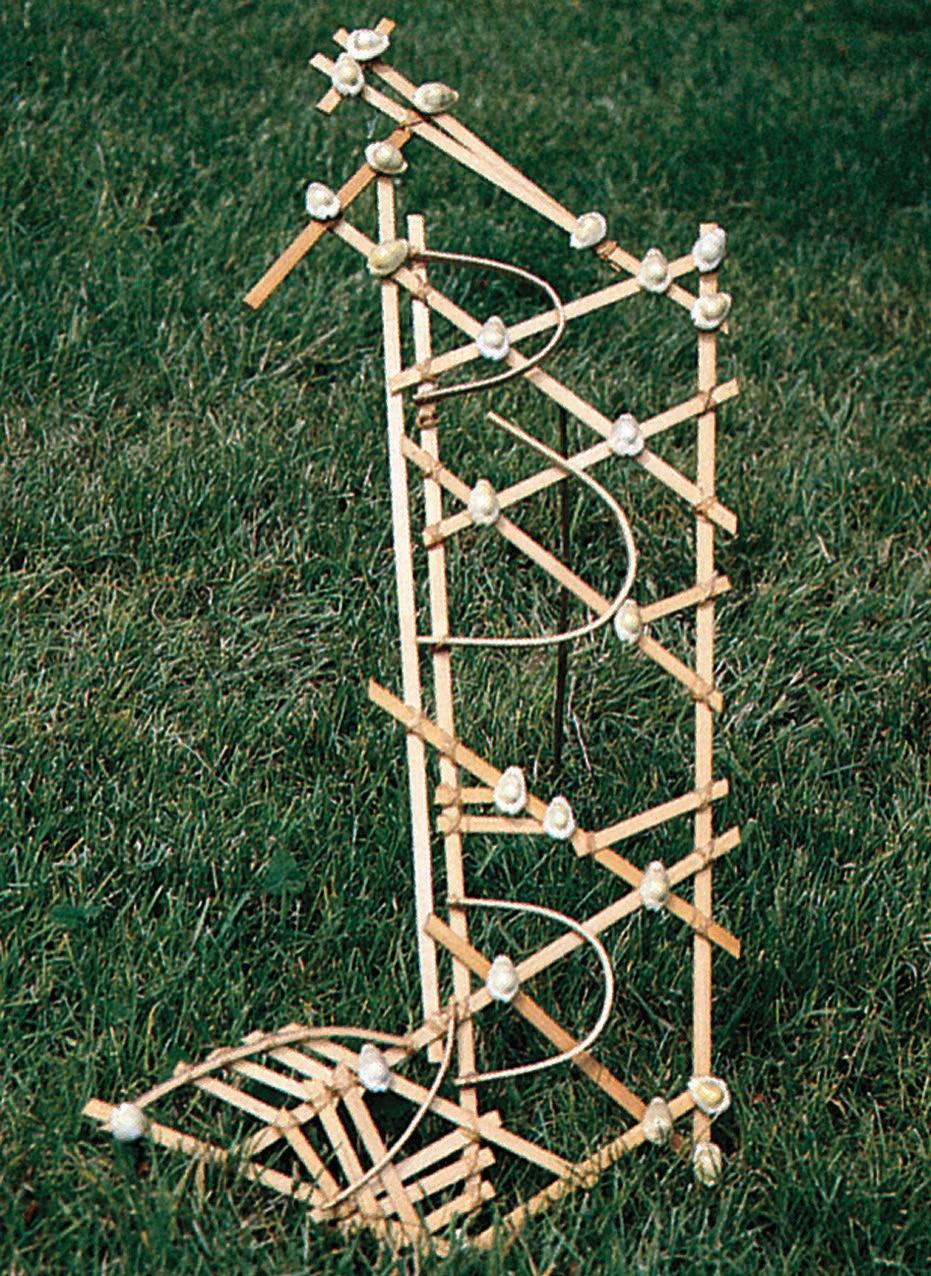
A basic component of navigation throughout the Pacific was the careful observation and recording of where prominent stars rise and set on the horizon. Observed near the equator, the stars appear to rotate from east to west on a north-south axis. Some rise and set farther to the north and some farther to the south, and they do so at different times. Navigators created a “star structure” by dividing the horizon into thirty-two segments where their known stars rose and set. These directions form a compass and provide a reference for recording information about the direction of winds, currents, waves, and the relative positions of islands, shoals, and reefs (fig. P.2). The Polynesians also navigated by making close observations of waves and cloud formations. Observations of birds and distinctive smells of land such as flowers and wood smoke alerted them to possible landfalls. Once islands were discovered, their locations relative to one another and to the regular patterns of sea swell and waves bent around islands could be recorded with stick charts constructed of bamboo and shells (fig. P.3).
(a)
(b)
P.2 On Satawal Island, master navigator Mau Piailug teaches navigation to his son and grandson with the help of a star compass. The compass consists of an outer ring of stones, each representing a star or a constellation when it rises or sets on the horizon, and an inner ring of pieces of palm leaf representing the swells, which travel from set directions, and together with the stars, help the navigator find his way over the sea. In the center of the ring, the palm leaves serve as a model outrigger canoe.
As early as 1500 B.C., Middle Eastern peoples of many different ethnic groups and regions were exploring the Indian Ocean. In the seventh century A.D., they were unified under Islam and controlled the trade routes to India and China and consequently the commerce in silk, spices, and other valuable goods. (This monopoly wasn’t broken until Vasco da Gama defeated the Arab fleet in 1502 A.D. in the Arabian Sea.)
The Greeks called the Mediterranean “Thalassa” and believed that it was encompassed by land, which in turn was surrounded by the endlessly circling river Oceanus. In 325 B.C., Alexander the Great reached the deserts of the Mekran Coast, now a part of Pakistan. He sent his fleet down the coast in an apparent effort to probe the mystery of Oceanus. He and his troops had expected to find a dark, fearsome sea of whirlpools and water spouts inhabited by monsters and demons; they did find tides that were unknown to them in the Mediterranean Sea. Pytheas (350–300 B.C.), a navigator, geographer, astronomer, and contemporary of Alexander, made one of the earliest recorded voyages from the Mediterranean to England. From there, he sailed north to Scotland, Norway, and Germany. He recognized a relationship between the tides and the Moon, and made early attempts at determining latitude and longitude. These early sailors did not investigate the oceans; for them, the oceans were only a dangerous road, a pathway from here to there, a situation that continued for hundreds of years. However, the information they accumulated slowly built into a body of lore to which sailors and voyagers added each year. While the Greeks traded and warred throughout the Mediterranean, they observed the sea and asked questions. Aristotle (384–322 B.C.) believed that the oceans occupied the deepest parts of Earth’s surface; he knew that the Sun evaporated water from the sea surface, which condensed and returned as rain. He also began to catalog marine organisms. The brilliant Eratosthenes (c. 276–195 B.C.) of Alexandria, Egypt, invented the study of
of the Marshall Islands. Sticks represent a series of regular wave patterns (swells). Curved sticks show waves bent by the shorelines of individual islands. Islands are represented by shells.
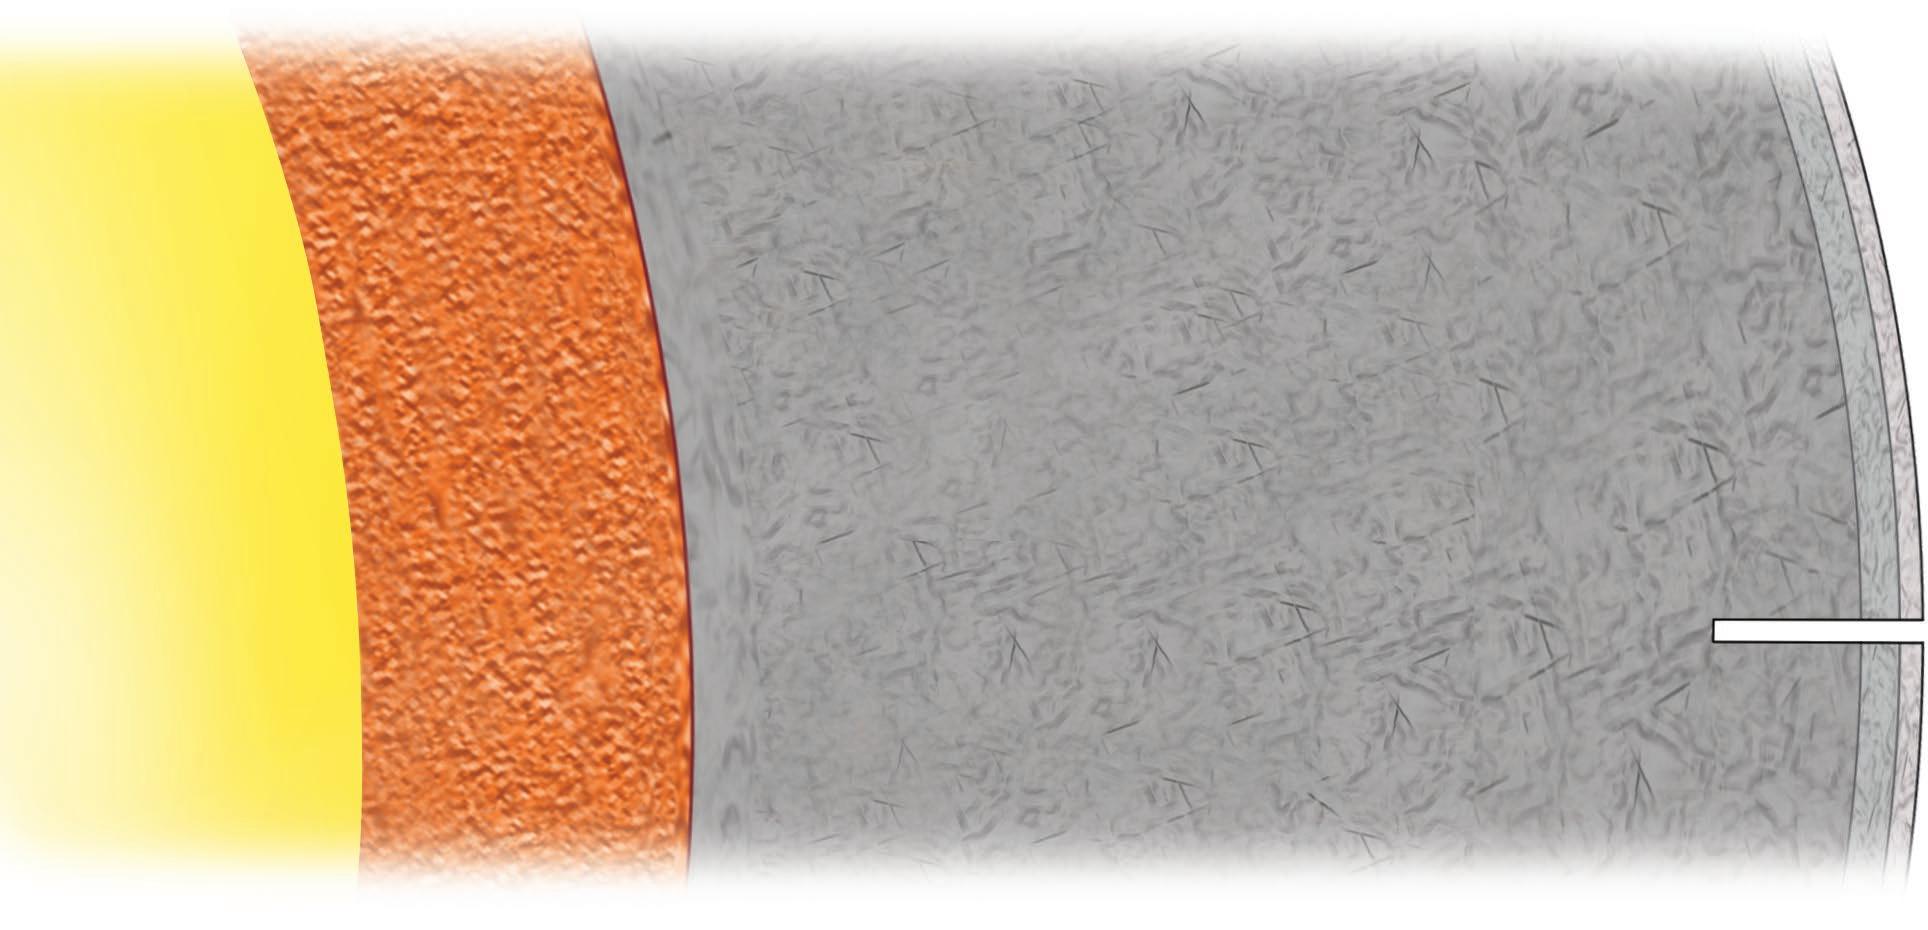
geography as well as a system of latitude and longitude. He was the first person to calculate the tilt of Earth’s axis. One of his greatest achievements was his calculation of Earth’s circumference; he accomplished this without ever leaving Egypt (fig. P.4). Eratosthenes knew that at local noon on the summer solstice, the Sun would be directly overhead in the city of Syene, located on the Tropic of Cancer at 23½°N. On that day and at that time, the Sun’s rays would shine down into a well in the city and illuminate the bottom of the well. At the same time and day, the Sun’s rays would cast a shadow behind a pole in his home city of Alexandria due north of Syene. By measuring the height of the pole and the length of the shadow, Eratosthenes could calculate the angle away from perpendicular of the Sun’s elevation in Alexandria, which he determined to be about 7.2°, or roughly 1/50 of a circle. Assuming that the distance between the Sun and Earth is so large that all of the Sun’s rays of light are parallel to each other when they reach Earth, Eratosthenes could say that the angle between Syene and Alexandria was also about 7.2°, or roughly 1/50 of a circle. Repeated surveys of the distance between Syene and Alexandria yielded a distance of 5000 stadia, so Eratosthenes concluded that Earth’s circumference was 252,000 stadia. The length of an Egyptian stadion was 157.5 m, so Eratosthene’s estimate of Earth’s circumference was 39,690 km (24,662 mi), an error of only about 1% compared to today’s accepted average value of about 40,030 km (24,873 mi). Posidonius (c. 135–50 B.C.) reportedly measured an ocean depth of about 1800 m (6000 ft) near the island of Sardinia, according to the Greek geographer Strabo (c. 63 B.C.–A.D. 21).
Figure P.3 A navigational chart (rebillib)
Courtesy of Sea and Shore Museum, Port Gamble, WA
Figure
Figure P.4 Eratosthenes used geometry to calculate Earth’s circumference. By careful measurement, he was able to estimate Earth’s circumference to within about 1% of today’s value. (The diagram is not drawn to scale.)
Pliny the Elder (c. A.D. 23–79) related the phases of the Moon to the tides and reported on the currents moving through the Strait of Gibraltar. Claudius Ptolemy (c. A.D. ~85–161) produced the first world atlas and established world boundaries: to the north, the British Isles, Northern Europe, and the unknown lands of Asia; to the south, an unknown land, “Terra Australis Incognita,” including Ethiopia, Libya, and the Indian Sea; to the east, China; and to the west, the great Western Ocean reaching around Earth to China. His atlas listed more than 8000 places by latitude and longitude, but his work contained a major flaw. He had accepted a value of 29,000 km (18,000 mi) for Earth’s circumference. This value was much too small and led Columbus, more than 1000 years later, to believe that he had reached the eastern shore of Asia when he landed in the Americas.
QUICK REVIEW
1. Name the subfields of oceanography.
2. What did early sailors use for guidance during long ocean voyages?
3. What kind of “compass” did the Polynesians use for navigation?
4. How long ago was Earth’s circumference first calculated, and how was it done?
5. How did Ptolemy’s atlas contribute to a greater understanding of world geography, and how did it produce confusion?
P.2 The Middle Ages
After Ptolemy, intellectual activity and scientific thought declined in Europe for about 1000 years. However, shipbuilding improved during this period; vessels became more seaworthy and easier to sail, so sailors could make longer voyages. The Vikings (Norse for piracy) were highly accomplished seamen who engaged in extensive exploration, trade, and colonization for nearly three centuries
from about 793 to 1066 (fig. P.5). During this time, they journeyed inland on rivers through Europe and western Asia, traveling as far as the Black and Caspian Seas. The Vikings are probably best known for their voyages across the North Atlantic Ocean. They sailed to Iceland in 871, where as many as 12,000 immigrants eventually settled. Erik Thorvaldsson (known as Erik the Red) sailed west from Iceland in 982 and discovered Greenland. He lived there for three years before returning to Iceland to recruit more settlers. Icelander Bjarni Herjolfsson, on his way to Greenland to join the colonists in 985–86, was blown off course, sailed south of Greenland, and is believed to have come within sight of Newfoundland before turning back and reaching Greenland. Leif Eriksson, son of Erik the Red, sailed west from Greenland in 1002 and reached North America roughly 500 years before Columbus.
To the south, in the region of the Mediterranean after the fall of the Roman Empire, Arab scholars preserved Greek and Roman knowledge and continued to build on it. The Arabic writer El-Mas’údé (d. 956) gives the first description of the reversal of the currents due to the seasonal monsoon winds. Using this knowledge of winds and currents, Arab sailors established regular trade routes across the Indian Ocean. In the 1100s, large Chinese junks with crews of 200 to 300 sailed the same routes (between China and the Persian Gulf) as the Arab dhows.
During the Middle Ages, knowledge of navigation increased. Harbor-finding charts, or portolanos, appeared. These charts carried a distance scale and noted hazards to navigation, but they did not have latitude or longitude. With the introduction of the magnetic compass to Europe from Asia in the thirteenth century, compass directions were added.
Although tides were not understood, the Venerable Bede (673–735) illustrated his account of the tides with data from the British coast. His calculations were followed in the tidal observations collected by the British Abbot Wallingford of Saint Alban’s Monastery in about 1200. His tide table, titled “Flod at London Brigge,” documented the times of high water. Sailors made use of Bede’s calculations until the seventeenth century.
As scholarship was reestablished in Europe, Arabic translations of early Greek studies were translated into Latin and thus became available to European scholars. The study of tides continued to absorb the medieval scientists, who were also interested in the saltiness of the sea. By the 1300s, Europeans had established successful trade routes, including some partial ocean crossings. An appreciation of the importance of navigational techniques grew as trade routes were extended.
QUICK REVIEW
1. What advances occurred during the Middle Ages that allowed longer ocean voyages?
2. During the tenth century, which oceans were explored and by which cultures?
3. Where did the Vikings establish a large colony in the North Atlantic?
P.3 Voyages of Discovery
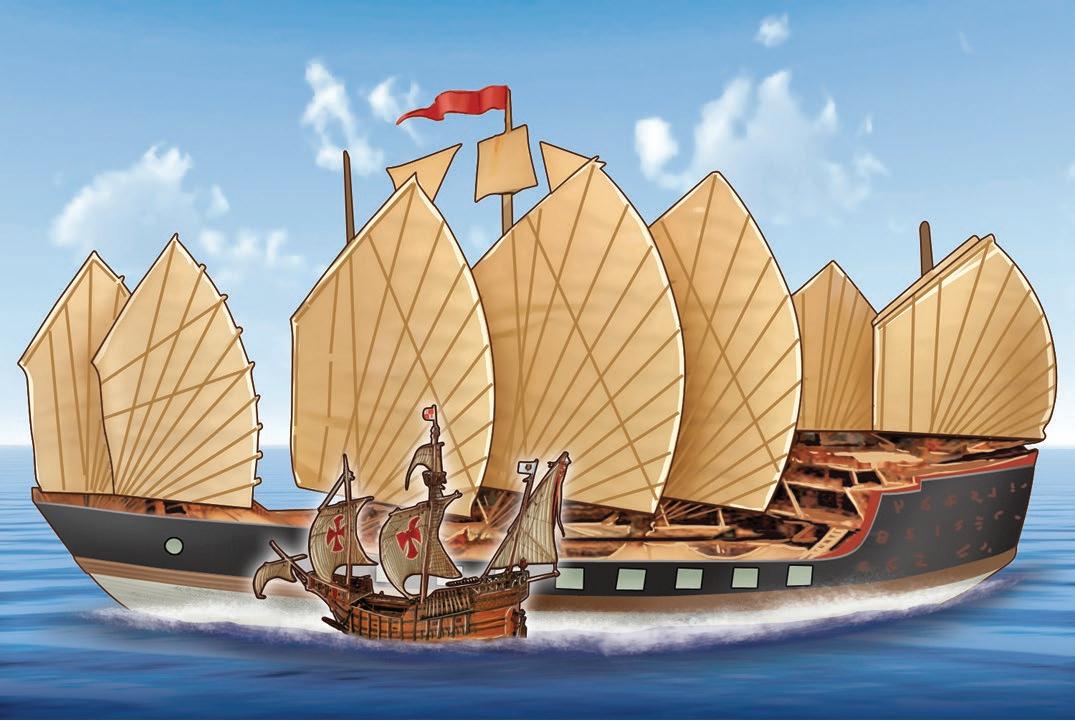
From 1405 to 1433, the great Chinese admiral Zheng He conducted seven epic voyages in the western Pacific Ocean and across the Indian Ocean as far as Africa. Zheng He’s fleet consisted of over 300 ships. The fleet is believed to have included as many as sixty-two “treasure ships” thought to have been as much as 130 m (426 ft) long and 52 m (170 ft) wide; this was ten times the size of the ships used for the European voyages of discovery during this period of time (fig. P.6). The purpose of these voyages remains a matter of debate among scholars. Suggested reasons include the establishment of trade routes, diplomacy with other governments, and military defense. The voyages ended in 1433, when their explorations led the Chinese to believe that other societies had little to offer, and the government of China withdrew within its borders, beginning 400 years of isolation.
In Europe, the desire for riches from new lands persuaded wealthy individuals, often representing their countries, to underwrite the costs of long voyages to all the oceans of the world. The individual most responsible for the great age of
Viking Routes
Earliest Erik the Red Leif Eriksson Ingvar
P.6 (a) Admiral Zheng He’s “treasure ships” were over 130 m long. In comparison, Christopher Columbus’s flagship, the Santa Maria, is estimated to have been about 18 m long. (b) Zheng He’s probable route from China along the coast of the Indian Ocean to Africa.
Zheng He’s route
Figure
(b)
Figure P.5 Major routes of the Vikings to the British Isles, to Asia, and across the Atlantic to Iceland, Greenland, and North America.
and Christopher Columbus’s first voyage.
European discovery was Prince Henry the Navigator (1394–1460) of Portugal. In 1419, his father, King John, made him governor of Portugal’s southernmost coasts. Prince Henry was keenly interested in sailing and commerce, and studied navigation and mapmaking. He established a naval observatory for the teaching of navigation, astronomy, and cartography about 1450. From 1419 until his death in 1460, Prince Henry sent expedition after expedition south along the west coast of Africa to secure trade routes and establish colonies. These expeditions moved slowly due to the mariners’ belief that waters at the equator were at the boiling point and that sea monsters would engulf ships. It wasn’t until twenty-seven years after Prince Henry’s death that Bartholomeu Dias (1450?–1500) braved these “dangers” and rounded the Cape of Good Hope in 1487 in the first of the great European voyages of discovery (fig. P.7). Dias had sailed in search of new and faster routes to the spices and silks of the East.
Portugal’s slow progress along the west coast of Africa in search for a route to the east finally came to fruition with Vasco da Gama (1469–1524) (fig. P.7). In 1497, he followed Bar tholomeu Dias’s route to the Cape of Good Hope and then continued beyond along the eastern coast of the African continent. He successfully mapped a route to India but was challenged along the way by Arab ships. In 1502, da Gama returned with a flotilla of fourteen heavily armed ships and defeated the Arab fleet. By 1511, the Portuguese controlled the spice routes and had access to the Spice Islands. In 1513, Portuguese trade extended to China and Japan.
Christopher Columbus (1451–1506) made four voyages across the Atlantic Ocean in an effort to find a new route to the East Indies by traveling west rather than east. By relying on inaccurate estimates of Earth’s size, he badly underestimated the distances involved and believed he had found islands off the coast of Asia when, in fact, he had reached the New World (fig. P.7).
Italian navigator Amerigo Vespucci (1454–1512) made several voyages to the New World (1499–1504) for Spain and Portugal , exploring nearly 10,000 km (6000 mi) of South American coastline. He accepted South America as a new continent not part of Asia, and in 1507, German cartographer Martin Waldseem ü ller applied the name “America” to the continent in Vespucci’s honor. Vasco Núñez de Balboa (1475–1519) crossed the Isthmus of Panama and found the Pacific Ocean in 1513, and in the same year, Juan Ponce de León (1460?–1521) discovered Florida and the Florida Current. All claimed the new lands they found for their home countries. Although these men had sailed for fame and riches, not knowledge, they more accurately documented the extent and properties of the oceans, and the news of their travels stimulated others to follow.
Ferdinand Magellan (1480–1521) left Spain in September 1519 with 270 men and five vessels in search of a westward passage to the Spice Islands. The expedition lost two ships before finally discovering and passing through the Strait of Magellan and rounding the tip of South America in November 1520. Magellan crossed the Pacific Ocean and arrived in the Philippines in March 1521, where he was killed in a battle with the natives on April 27, 1521. Two of his ships sailed on and reached the Spice Islands in November 1521, where they loaded valuable spices for a return home. In an attempt to guarantee that at least one ship made it back to Spain, the two ships parted ways. The Victoria continued sailing west and successfully crossed the Indian Ocean, rounded Africa’s Cape of Good Hope, and arrived back in Spain on September 6, 1522, with eighteen of the original crew. This was the first circumnavigation of Earth (fig. P.8). Magellan’s skill as a navigator makes his voyage probably the most outstanding single contribution to the early charting of the oceans. In addition, during the voyage, he established the length of a degree of latitude and measured the circumference of Earth. It is said that Magellan tried to test the mid-ocean depth of the Pacific with a hand line, but this idea seems to come from a nineteenth-century German oceanographer; writings from Magellan’s time do not support this story.
The great Arabian navigator and cartographer Ahmad ibn Majid is known as “The Lion of the Sea.” Ibn Majid wrote several books on marine science and navigation, perhaps the most important being Book of Useful Information on the Principles and Rules of Navigation, which he wrote in about 1490. It is a comprehensive accumulation of navigational knowledge, open-ocean and coastal sailing, the location of important ports in the Indian Ocean, and details of the monsoon and other seasonal winds. Ibn Majid and other Arab navigators were not limited to sailing along
B. Dias 1487C. Columbus 1492 (First voyage)V. da Gama 1497–1502
Figure P.7 The routes of Bartholomeu Dias and Vasco da Gama around the Cape of Good Hope
F. Magellan 1519–22
F. Drake 1577–80
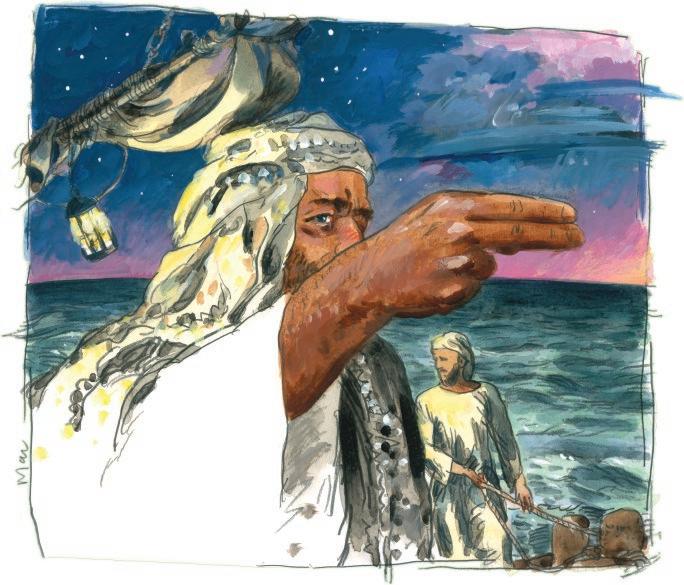
Figure P.9 Depiction of an Arabian navigator measuring latitude by determining the height of the Pole Star above the horizon using the number of “finger widths” at arm’s length.
the coast but could sail in the open ocean by maintaining a course along a constant line of latitude (see the discussion of latitude in section 1.4 of chapter 1). They determined their latitude by measuring the height of the Pole Star above the horizon either by using the number of “finger widths” at arm’s length between the star and the horizon (fig. P.9) or by using a simple device called a kamal if they wanted to sail along the latitude of a specific port. A kamal was a small rectangle of wood attached to a cord that had unequally spaced knots. Each knot marked the latitude of a specific port. Navigators piloted their ship along the latitude of a chosen port by holding the knot for that port between their teeth and aligning the bottom of the kamal with the horizon and the top with the Pole Star.
By the latter half of the sixteenth century, adventure, curiosity, and hopes of finding a trading shortcut to China spurred efforts to find a sea passage around North America. Sir Martin Frobisher (1535?–94) made three voyages in 1576, 1577, and 1578, and Henry Hudson (1565?–1611) made four voyages (1607, 1608, 1609, and 1610), dying with his son when set adrift in Hudson Bay by his mutinous crew. The Northwest Passage continued to beckon, and in 1615 and 1616, William Baffin (1584–1622) made two unsuccessful attempts.
While European countries were setting up colonies and claiming new lands, Francis Drake (1540–96) set out in 1577 with 165 crewmen and five ships to show the English flag around the world (fig. P.8). He was forced to abandon two of his ships off the coast of South America. He was separated from the other two ships while passing through the Strait of Magellan. During the voyage Drake plundered Spanish shipping in the Caribbean and in Central America and loaded his ship with treasure. In June 1579, Drake landed off the coast of present-day California and sailed north along the coast to the present United States–Canadian border. He then turned southwest and crossed the Pacific Ocean in two months’ time. In 1580, he completed his circumnavigation and returned home in the Golden Hind with a cargo of Spanish gold, to be knighted and treated as a national hero. Queen Elizabeth I encouraged her sea captains’ exploits as explorers and raiders because, when needed, their ships and knowledge of the sea brought military victories as well as economic gains.
QUICK REVIEW
1. Why do you think Zheng He’s epic voyage followed a route along the coast?
2. What stimulated the long voyages of the fifteenth and sixteenth centuries?
3. Who was Amerigo Vespucci, and how was he honored?
4. Why was Magellan’s voyage of such great importance?
5. What is the Northwest Passage, and why was there so much interest in finding it?
P.4 The Importance of Charts and Navigational Information
As colonies were established far from their home countries and as trade, travel, and exploration expanded, interest was renewed in developing more accurate charts and navigational techniques.
As early as 1530, the relationship between time and longitude had been proposed by Flemish astronomer Gemma Frisius, and in 1598, King Philip III of Spain offered a reward of 100,000 crowns to any clockmaker building a clock that
Figure P.8 The sixteenth-century circumnavigation voyages by Magellan and Drake.
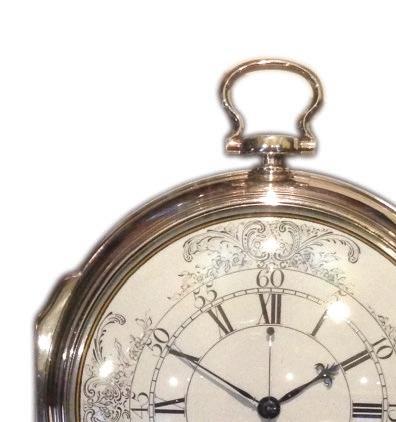
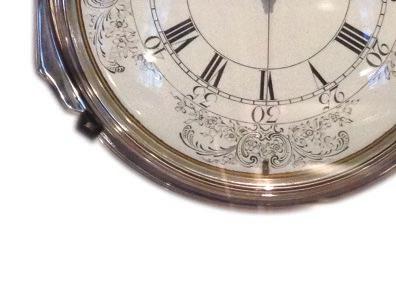
would keep accurate time onboard ship (see the discussion of longitude and time in section 1.4). In 1714, Queen Anne of England authorized a public reward for a practical method of keeping time at sea, and the British Parliament offered 20,000 pounds sterling for a seagoing clock that could keep time with an error not greater than two minutes on a voyage to the West Indies from England. A Yorkshire clockmaker, John Harrison, built his first chronometer (high-accuracy clock) in 1735, but not until 1761 did his fourth model meet the test, losing only fifty-one seconds on the eighty-one-day voyage. Harrison was awarded only a portion of the prize after his success in 1761, and it was not until 1775, at the age of eighty-three, that he received the remainder from the reluctant British government. In 1772, Captain James Cook took a copy of the fourth version of Harrison’s chronometers to calculate longitude more precisely (fig. P.10). This allowed him to produce accurate charts of new areas and correct previously charted positions.
Cook’s second voyage 1772–75
Cook’s third voyage 1776–79
Captain James Cook (1728–79) made his three great voyages to chart the Pacific Ocean between 1768 and 1779 (fig. P.11). In 1768, he left England in command of the Endeavour on an expedition to chart the transit of Venus; he returned in 1771, having circumnavigated the globe, and explored and charted the coasts of New Zealand and eastern Australia. Between 1772 and 1775, he commanded an expedition of two ships, the Resolution and the Adventure, to the South Pacific. On this journey, he charted many islands, explored the Antarctic Ocean, and, by controlling his sailors’ diet, prevented vitamin C deficiency and scurvy, the disease that had decimated crews that spent long periods of time at sea. Cook sailed on his third and last voyage in 1776 in the Resolution and Discovery. He spent a year in the South Pacific and then sailed north, discovering the Hawaiian Islands in 1778. He continued on to the northwest coast of North America and into the Bering Strait, searching for a passage to the Atlantic. He returned to Hawaii for the winter and was killed by natives at Kealakekua Bay on the island of Hawaii in 1779. Cook takes his place not only as one of history’s greatest navigators and seamen but also as a fine scientist. He made soundings to depths of 400 m (1200 ft) and accurate observations of winds, currents, and water temperatures. Cook’s careful and accurate observations produced much valuable information and made him one of the founders of oceanography.
In the United States, Benjamin Franklin (1706–90) became concerned about the time required for news and cargo to travel between England and America.
P.10 John Harrison’s chronometer. A copy of this chronometer was used by Captain James Cook on his 1772 voyage to the southern oceans.
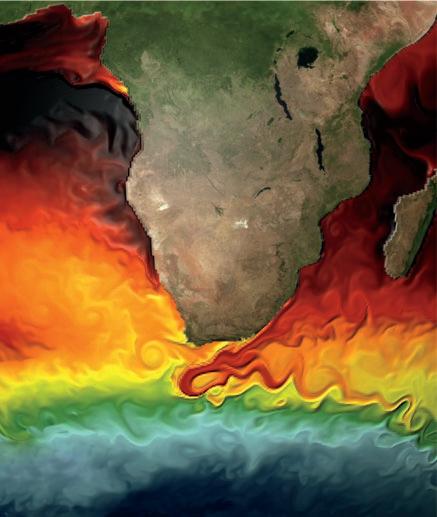
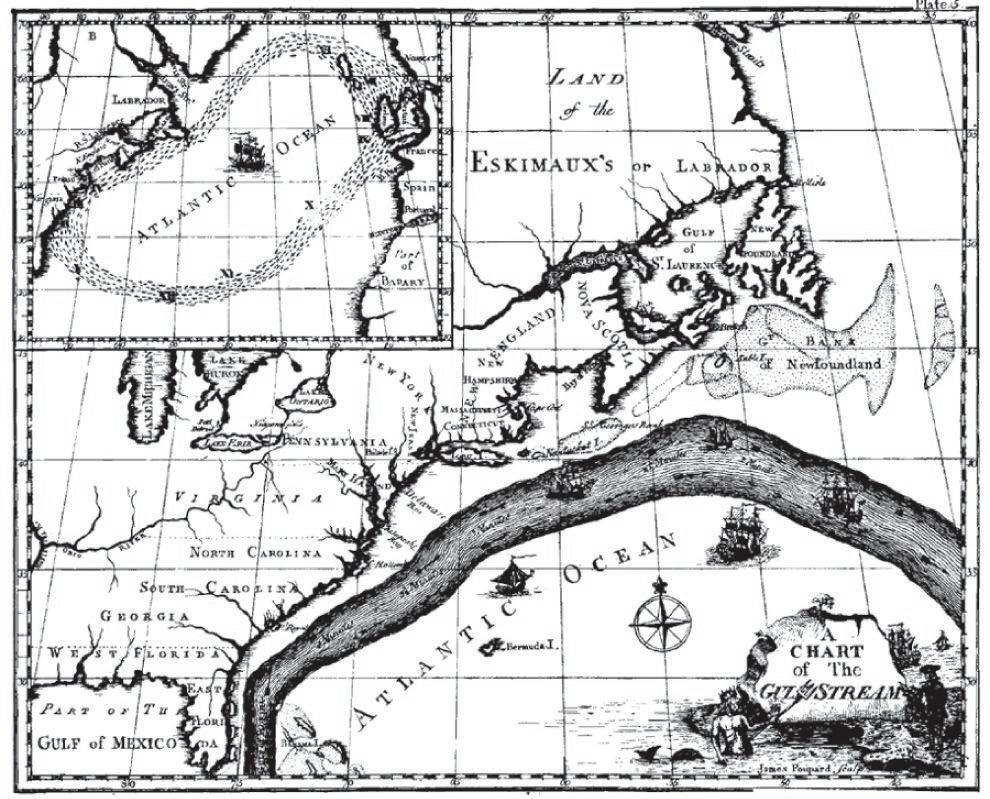
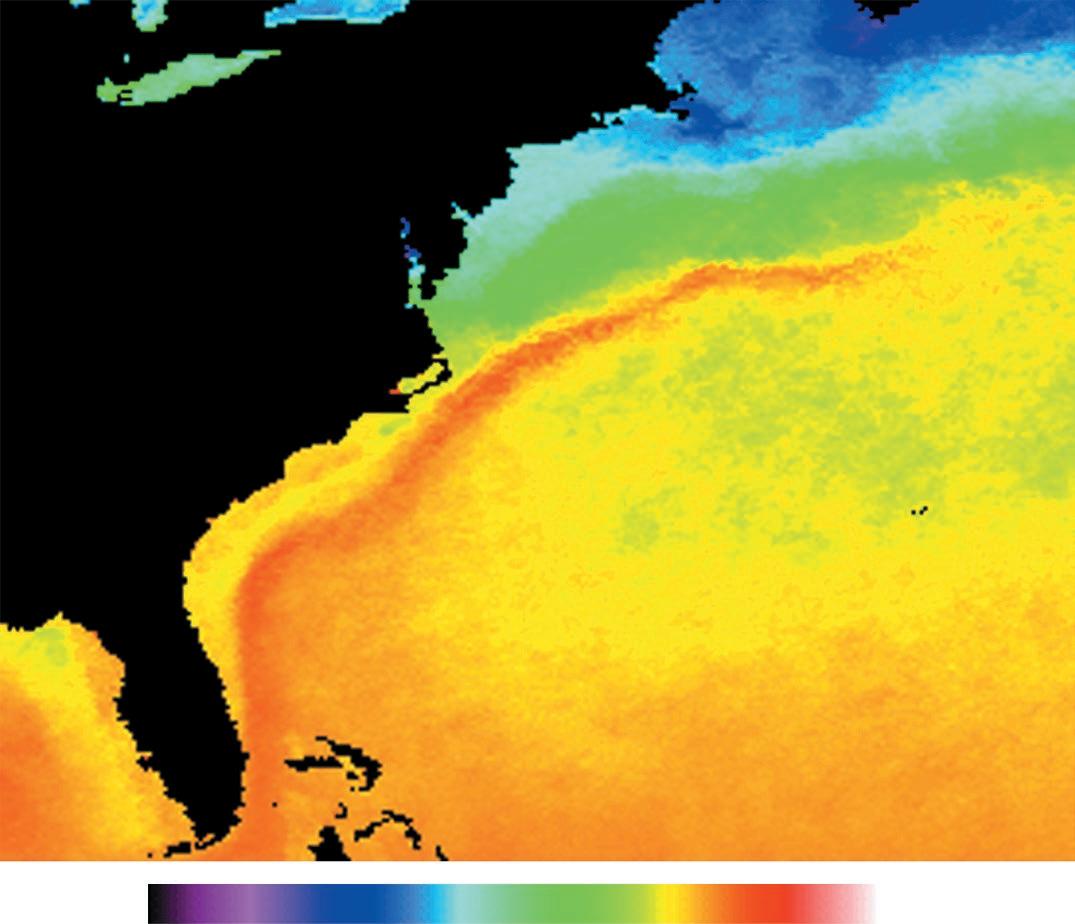
With Captain Timothy Folger (Franklin’s cousin and a whaling captain from Nantucket), he constructed the 1769 FranklinFolger chart of the Gulf Stream current (fig. P.12). When published, the chart encouraged captains to sail within the Gulf Stream en route to Europe and return via the trade winds belt and follow the Gulf Stream north again to Philadelphia, New York City, and other ports. Since the Gulf Stream carries warm water from low latitudes to high latitudes, it is possible to map its location with satellites that measure sea surface temperature. Compare the Franklin-Folger chart in figure P.12 to the map of the Gulf Stream shown in figure P.13 based on the average sea surface temperature during 1996. In 1802, Nathaniel Bowditch (1773–1838), another American, published the New American Practical Navigator. In this book, Bowditch made
Figure P.11 The three voyages of Captain James Cook.
Figure P.12 The Franklin-Folger map of the Gulf Stream, 1769. Compare this map with figure P.13. Source: National Oceanic and Atmospheric Administration (NOAA) Central Library
0 –35102025303515 SST (°C)
Figure P.13 Annual average sea surface temperature for 1996. The red-orange streak of 25° to 30°C water shows the Gulf Stream. Compare with figure 7.26. Source: NASA
the techniques of celestial navigation available for the first time to every competent sailor and set the stage for U.S. supremacy of the seas during the years of the Yankee clippers.
In 1807, the U.S. Congress, at the direction of President Thomas Jefferson, formed the Survey of the Coast under the Treasury Department, later named the Coast and Geodetic Survey and now known as the National Ocean Survey. The U.S. Naval Hydrographic Office, now the U.S. Naval Oceanographic Office, was set up in 1830. Both were dedicated to exploring the oceans and producing better coast and ocean charts. In 1842, Lieutenant Matthew F. Maury (1806–73), who had worked with the Coast and Geodetic Survey, was assigned to the Hydrographic Office and founded the Naval Depot of Charts. He began a systematic collection of wind and current data from ships’ logs. He produced his first wind and current charts of the North Atlantic in 1847. At the 1853 Brussels Maritime Conference, Maury issued a plea for international cooperation in data collection, and from the ships’ logs he received, he produced the first published atlases of sea conditions and sailing directions. His work was enormously useful, allowing ships to sail more safely and take days off their sailing times between major ports around the world. The British estimated that Maury’s sailing directions took thirty days off the passage from the British Isles to California, twenty days off the voyage to Australia, and ten days off the sailing time to Rio de Janeiro. In 1855, he published The Physical Geography of the Sea. This work includes chapters on the Gulf Stream, the atmosphere, currents, depths, winds, climates, and storms, as well as the first bathymetric chart of the North Atlantic with contours at 6000, 12,000, 18,000, and 24,000 ft. Many marine scientists consider Maury’s book the first textbook of what we now call oceanography and consider Maury the first true oceanographer. Again, national and commercial interests were the driving forces behind the study of the oceans.
QUICK REVIEW
1. Why was John Harrison’s clock important to openocean navigation?
2. What did Captain James Cook’s voyages contribute to the science of oceanography?
3. Why was Benjamin Franklin interested in the Gulf Stream?
4. Who was Matthew F. Maury, and what was his contribution to ocean science?
P.5 Ocean Science Begins
As charts became more accurate and as information about the oceans increased, the oceans captured the interest of naturalists and biologists. Baron Alexander von Humboldt (1769–1859) made observations on a five-year (1799–1804) cruise to South America; he was particularly fascinated with the vast numbers of animals inhabiting the current flowing northward along the western coast of South America, the current that now bears his name. Charles Darwin (1809–82) joined the survey ship Beagle and served as the ship’s naturalist from 1831 to 1836 (fig. P.14). He described, collected, and classified organisms from the land and sea. His theory of atoll formation is still the accepted explanation.
At approximately the same time, another English naturalist, Edward Forbes (1815–54), began a systematic survey of marine life around the British Isles and in the Mediterranean and Aegean Seas. He collected organisms in deep water and, on the basis of his observations, proposed a system of ocean depth zones, each characterized by specific animal populations. However, he also mistakenly theorized that there was an azoic, or lifeless, environment below 550 m (1800 ft). His announcement is curious, because twenty years earlier, the Arctic explorer Sir John Ross (1777–1856), looking again for the Northwest Passage, had taken bottom samples at over 1800 m (6000 ft) depth in Baffin Bay and had found worms and other animals living in the mud. Ross’s nephew, Sir James Clark Ross (1800–62), took even deeper samples from Antarctic waters and noted their similarity to the Arctic species recovered by his uncle. Still, Forbes’s systematic attempt to make orderly predictions about the oceans, his enthusiasm, and his influence make him another candidate as a founder of oceanography.
Christian Ehrenberg (1795–1876), a German naturalist, found the skeletons of minute organisms in seafloor sediments and recognized that the same organisms were alive at the sea surface; he concluded that the sea was filled with microscopic life and that the skeletal remains of these tiny organisms were still being added to the sea floor. Investigation of the minute drifting plants and animals of the ocean was not seriously undertaken until German scientist Johannes Mü ller (1801–58) began his work in 1846. He used an improved fine-mesh tow net similar to that used by Charles Darwin to collect these organisms, which he examined microscopically. This work was continued by Victor Hensen (1835–1924), who improved the M üller net, introduced the quantitative study of these minute drifting sea organisms, and gave them the name plankton in 1887.
Although science blossomed in the seventeenth and eighteenth centuries, there was little scientific interest in the sea except as we have seen for the practical reasons of navigation, tide prediction, and safety. In the early nineteenth century, ocean scientists were still few and usually only temporarily attracted to the sea. Some historians believe that the subject and study of the oceans were so vast, requiring so many people and such large amounts of money, that government interest and support were required before oceanography could grow as a science. This did not happen until the nineteenth century in Great Britain. In the last part of the nineteenth century, laying transatlantic telegraph cables made a better knowledge of the deep sea a necessity. Engineers needed to know about seafloor conditions, including bottom topography, currents, and organisms that might dislodge or destroy the cables. The British began a series of deep-sea studies stimulated by the retrieval of a damaged cable from more than 1500 m (5000 ft) deep, well below Forbes’s azoic zone. When the cable was brought to the surface, it was found to be covered with organisms, many of which had never been seen before. In 1868, the Lightning dredged between Scotland and the Faroe Islands at depths of 915 m (3000 ft) and found many animal forms. The British Admiralty continued these studies with the Porcupine during the summers of 1869 and 1870, dredging up animals from depths of more than 4300 m (14,000 ft). Charles Wyville Thomson (1830–82), like Forbes, a professor of natural history at Edinburgh University, was one of the scientific leaders of these two expeditions. On the basis of these results, he wrote The Depths of the Sea, published in 1873, which became very popular and is regarded by some as the first book on oceanography.
English biologist Thomas Henry Huxley (1825–95), a close friend and supporter of Charles Darwin, was particularly
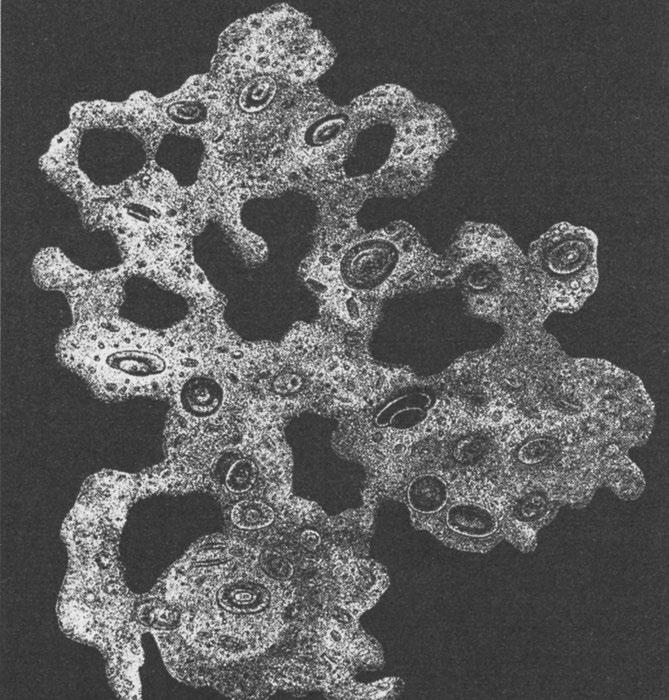
interested in studying the organisms that inhabit the deep sea. Huxley was a strong supporter of Darwin’s theory of evolution and believed that the organisms of the deep sea could supply evidence of its validity. In 1868, while examining samples of mud recovered from the deep-sea floor of the Atlantic eleven years before and preserved in alcohol, Huxley noticed that the surface of the samples was covered by a thick, mucus-like material with small embedded particles. Under the microscope it appeared as if these particles moved, leading him to conclude that the mucus was a form of living protoplasm. Huxley named this “organism” Bathybius haeckelii after the noted German naturalist Ernst Haeckel (fig. P.15). Haeckel, also a strong supporter of
Voyage of the Beagle 1831–36
Figure P.14 The voyage of Charles Darwin and the survey ship HMS Beagle, 1831–36.
Figure P.15 Bathybius haeckelii. English biologist Thomas Huxley believed this to be a primoridial protoplasm covering the ocean floor. Source: National Oceanic
(NOAA)
the theory of evolution, viewed this protoplasm as the primordial ooze from which all other life evolved. He believed it blanketed the deep-sea floor and provided an inexhaustible supply of food for higher-order organisms of the deep ocean. One of the primary scientific objectives of the Challenger expedition, described in the next section, was to study the distribution of Bathybius haeckelii.
QUICK REVIEW
1. How did Edward Forbes advance understanding of the oceans, and in what way was he mistaken?
2. How were the discoveries of John Ross and James Clark Ross similar? How did they differ?
3. How did the desire to improve communication between the United States and Europe help to advance oceanography?
P.6
Early Expeditions of the Nineteenth and Twentieth Centuries
The Challenger Expedition
With public interest running high, the Circumnavigation Committee of the British Royal Society was able to persuade the British Admiralty to organize the most comprehensive oceanographic expedition yet undertaken, using the Challenger . The
Challenger sailed from Portsmouth, England, for a voyage that was to last nearly three-and-a-half years (fig. P.16). The first leg of the voyage took the vessel to Bermuda, then to the South Atlantic island of Tristan da Cunha, around the Cape of Good Hope, and east across the southernmost part of the Indian Ocean. It continued on to Australia, New Zealand, the Philippines, Japan, and China. Turning south to the Marianas Islands, the vessel took its deepest sounding at 8180 m (26,850 ft) in what is now known as the Challenger Deep in the Marianas Trench. Sailing across the Pacific to Hawaii, to Tahiti, and through the Strait of Magellan, it returned to England on May 24, 1876.
The numerous dredges of deep-sea sediments obtained during the expedition failed to find any evidence of Bathybius haeckelii in fresh samples. One of the naturalists noticed, however, that when alcohol was added to a sample, something similar to Bathybius haeckelii was produced. Rather than being the primitive life-form from which all other organisms evolved, Bathybius haeckelii was shown to be a chemical precipitate produced by the reaction of the sediment with alcohol.
The work of organizing and compiling information continued for twenty years. William Dittmar (1833–92) prepared the information on seawater chemistry. He identified the major elements present in the water and confirmed the findings of earlier chemists that in a seawater sample, the relative proportions of the major dissolved elements are constant. Oceanography as a modern science is usually dated from the Challenger expedition. More information about this historic expedition is given in “Diving In: The Voyage of the Challenger 1872–76.”
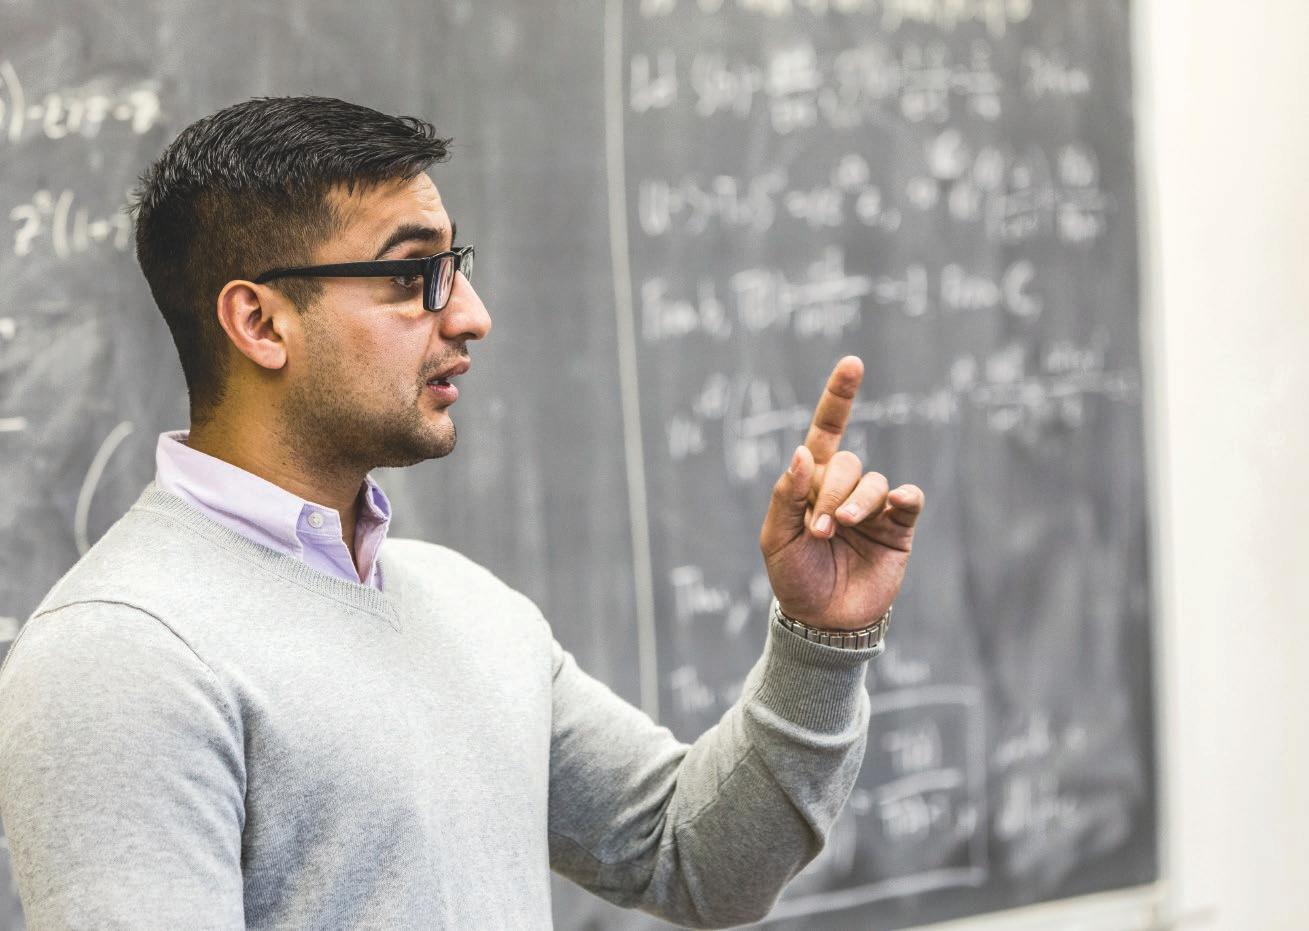
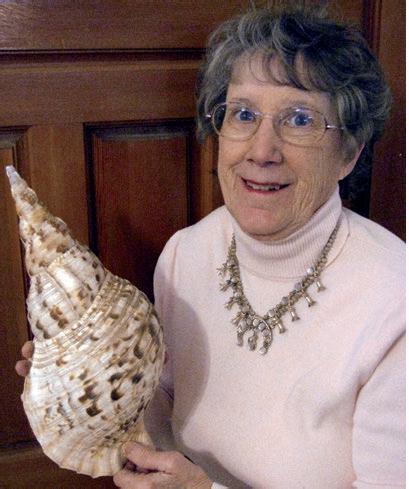
Dr. Beth Simmons, professor at Metropolitan State College of Denver, teaches basic oceanography to landlubbers in Colorado. Enrolled in over a dozen sections per semester, both online and in the classroom, Metro students—some from as far away as Hawaii, Florida, and California—take their first step toward a lifelong dream of a career in some phase of marine science.
Courtesy of Beth Simmons, Metropolitan State University Denver
During the Victorian Era, the British ruled the seas. After Charles Darwin made famous the four-year voyage of Her Majesty’s Ship [HMS] Beagle (1832–36), British scientists clamored the government for more voyages in the name of oceanic science (box fig. 1a). So, much like the American space program of the twentieth century, the British government initiated an oceanographic research program beginning with two test cruises. Scientific probes made during the voyages of the HMS Lightning, an old naval paddle-steamer, in 1868, and on four voyages of the HMS Porcupine in 1869 and 1870 throughout the North Atlantic and Mediterranean Seas, tested equipment and sampling techniques in preparation for a global expedition.
On earlier experimental voyages in the 1840s, pioneering oceanographers had noticed the existence of life zones (layers of life) along the shorelines and into the depths of the seas. One scientist, Edwin Forbes, predicted that because of lack of sunlight and intense pressures, life could not exist below 300 fathoms (1800 feet). Dredge hauls from the Porcupine and Lightning proved that life, albeit in strange forms, existed at all depths in the sea. The scientists wanted to know more!
To satisfy their interest and further map the ocean, the Royal Navy replaced sixteen of the guns on HMS Challenger, a Pearl-class corvette (a small, maneuverable, lightly armed warship), with miles of sampling rope, wire, thermometers, water bottles, and bottom samplers. The ship sported a steam engine capable of holding the ship in position during sampling and when there was a lack of wind in its sails. Below deck were stateof-the-art natural history, chemical, and physical testing laboratories (box fig. 1b). Charles Wyville Thomson, one of Forbes’s former students—who was a professor of natural history at University of Scotland at Edinburgh and the lead scientist for the previous oceanic research voyages—was the logical scientist to head the extensive Challenger expedition. The unique scientific equipment developed for the voyage was as technically advanced for its time as one of NASA’s space probes 100 years later.
Sailing into familiar waters, HMS Challenger cast off from the dock at Sheerness, England, on December 21, 1872, with six scientists (Charles W. Thomson, Henry Moseley, Rudolf von Willemoes-Suhm, John Buchanan, John Murray, and official artist J. J. Wild) aboard the world’s most modern floating laboratory. The ship’s commanding officer, Captain George Nares; twenty naval officers, including surgeons and engineers; and 200 crew members supported the operation.
The Challenger’s mission was to answer fundamental questions about the ocean. How deep is the sea? Is there really a mountain
Box Figure 1a “H.M.S. Challenger—Shortening Sail to Sound,” decreasing speed to take a deep-sea depth measurement.
Source: Challenger Expedition: Dec. 21, 1872 – May 24, 1876. Engravings from Challenger Reports, vol. 1, 1885
Box Figure 1b Zoological laboratory on the main deck.
Source: Challenger Expedition: Dec. 21, 1872 – May 24, 1876. Engravings from Challenger Reports, vol. 1, 1885
range under the ocean? What is the salinity of the oceans? Is the chemistry of ocean water constant? What was the green mud that Ross had brought up from the depths of the Antarctic Ocean? What was its extent on the ocean floor? And, of course, the Royal Navy wanted to know—where did the oceanic currents flow? Where should ships navigate to avoid hitting reefs or underwater volcanoes?
To keep the British public informed about the progress of the threeyear-long adventure into this new scientific realm, ships returning to England from ports along the way toted samples, specimens, and reports back to the motherland. As soon as the communiqués reached London, wellestablished scientist and author Thomas Huxley spread the facts about