CompositesPartA
journalhomepage: www.elsevier.com/locate/compositesa
A fiber-segmentationalgorithmforcompositesimagedusingX-ray
microtomography:Developmentandvalidation
PeterJ.Crevelinga,WilliamW.Whitacreb,MichaelW.Czabaja,⁎
a DepartmentofMechanicalEngineering,UniversityofUtah,SaltLakeCity,UT84112,UnitedStates
b DraperLaboratory,Cambridge,MA02140,UnitedStates
ARTICLEINFO
Keywords:
A.Polymer-matrixcomposites
B.Microstructures
C.Micro-mechanics
D.CTanalysis
ABSTRACT
Thisstudyproposesanewalgorithmforthree-dimensionalsegmentationof fibersinmulti-directional fiberreinforcedcomposites(FRCs)imagedusingX-raymicrotomography(µCT).Theproposedalgorithmusessynthetic fiber-templatesandtemplatematchingtodetect fibersin2D.Detectionsareusedtotrackindividual fibers in3DusingaKalman-filterestimator.Validationofthealgorithmwasperformedusingsyntheticimagestacks, whichmimickedthequalityandresolutionofexistingstate-of-the-artX-raysystems.Segmentationofsynthetic imagesrevealedthattheproposedalgorithmestimatesthetotalnumberof fibers,the3Dpositionsof fibercrosssectionalcentroids,and fiberlengthswithanerrorlessthan7%whentheimageresolutionisgreaterthan9 pixelsperaverage fiberdiameter.However,thesegmentationalgorithmwasfoundtounderestimate fibercrosssectionalareasduetobeam-hardeningartifacts.Thisstudyconcludesbydemonstratingtheversatilityofthe algorithmonamulti-directionalFRCimagedusingX-rayµCT.
1.Introduction
Inrecentyears,high-resolutionX-raymicrotomography(X-rayµCT) hasemergedasapopularmethodfornon-destructivethree-dimensional (3D)imagingof fiber-reinforcedcomposites(FRCs)attheconstituent lengthscale.ModernX-rayµCTsystemswithsub-micronresolution capabilities(e.g.,ZeissVersa-520)areprovidinganunprecedentedinsightintomicroscalestructuresofindividual fibers,manufacturing-inducedimperfections,anddamage [1–9].Additionally,recentadvances insynchrotron-basedhigh-speedX-rayµCThaveenabled4D(i.e., spatialandtemporal)imagingofdeformationandfailureforabroad rangeofcompositesystems,loadingconditions,andenvironments [9–13].DespitetheincreasingpopularityofX-rayµCT,oneofthe outstandingchallengesassociatedwiththeeffectiveuseofthismethod isthelargeamountofimagedatagenerated.Dependingonthedesired qualityofdata(e.g.,image-stackspacingorimagebit-depth),asingle X-rayµCTscancanproduceanimagestackthatismultiplegigabytesin size,makingitdifficulttovisualize,letaloneanalyze.
ThesheeramountofdataderivedfromX-rayµCT,coupledwith inherentlycomplexmicrostructuresofFRCs,hascreatedapressing needtodeveloptoolsforautomaticsegmentation(i.e.,classification)of physicalfeaturesfrom2Dimagesor3Dimagestacks.Accurateextractionofthereduced-ordersegmentationdatafromhigh-resolutionXrayµCTimagesisnecessarytoinvestigatetherelationshipsamong
⁎ Correspondingauthor.
E-mailaddress: m.czabaj@utah.edu (M.W.Czabaj).
https://doi.org/10.1016/j.compositesa.2019.105606
manufacturing,resultingmicrostructure,andperformanceofFRCs. Additionally,segmentationofX-rayµCTimagesisneededtocreate high-fidelity3D finite-element-basedmicromechanicalmodelsofasmanufacturedFRCs.Thesemodelsareexpectedtobecomeanintegral partoffuturemultiscale “virtualtesting” tools,whichholdpromisefor reducingourrelianceonpureempiricismindesignandcertificationof FRCstructures,andmayenabledevelopmentofrevolutionarystructural-lifeprognosistoolsliketheAirframeDigitalTwin [14]
FormostFRCsystemsimagedusingX-rayµCT,imagesegmentation entailsidentificationofpixels/voxelsassociatedwithindividual fibers, pre-existing flaws(e.g.,voids),anddamage(e.g.,matrixcracksor fiber breaks).Ifthecontrastbetweenindividualfeaturesisadequatelyhigh, segmentationisoftenperformedusingsimplegray-scalethresholding algorithms,whichareavailableinseveralopen-sourceorcommercially availablesoftwarepackagessuchasImageJ,Avizo,orDragonfly. However,ifthecontrastbetweenfeaturesislow,segmentationbased ongray-scalethresholdingisinadequate.ForFRCsystemsthatexhibit lowcontrastbetweenindividualphases(e.g.,carbon/epoxyorSiC/SiC composites),segmentationofindividual fibersisparticularlydifficult dueto:(1)smallnumberofpixelsrepresenting fibercross-sections;(2) densepackingof fibersandtheresultingblurredboundariesbetween adjacent fibers;and(3)varyingsize,orientation,andcurvatureofindividual fibers.
Giventheseinherentissues,high-fidelity3Dsegmentationof
Received12June2019;Receivedinrevisedform20August2019;Accepted21August2019
Availableonline24August2019
1359-835X/©2019ElsevierLtd.Allrightsreserved.
individual fibersrequiresapproachesthataremoreadvanced,andtypicallycompriseoftwodistinctsteps.The firststepinvolves “detection” ofindividual fibercross-sectionsineachX-rayµCTimage(i.e.,tomogram)oftheentiretomographicimagestack.Ingeneral,thisinvolves identifyingsizeandlocationoffeaturesthatareeithercircularorelliptical,dependingontheorientationof fibersrelativetotheX-rayµCT scanaxis.Anon-comprehensivelistofmethodsusedfordetectionof fibercross-sectionsincludes:(1)Bayesianinferences [15],(2)templatematching(TM) [16,17],(3)trained fibercentroidcharacteristicdictionaries [18,19],(4)Houghtransforms [19–22],and(5)convolutional neuralnetworks [22].Alloftheaforementionedmethodscanbeusedto estimatecentroidsofindividual fibers,butonlyafewarecapableof determiningindividual fiberdiametersandlocal fiberorientationsrelativetothescanaxis [19,20,22].Thesecondstepin fibersegmentation involvestheconversionof2D fiberdetectionsintocontinuous3D fiber “tracks.” ANearestNeighborSearch(NNS)isthemostcommonmethod ofestablishing3D fibertracks [18,19,23,24].TheNNSmethodisrelativelystraightforwardtoimplementandcanbecomputationallyefficient;however,itcanalsoresultinnon-smoothandnon-continuous tracksifthe fiber-detectiondatacontainsspuriousand/ormissinginformation.Toaddressthisissue,oneapproachistouseamorecomputationally-intensivetrackingalgorithmbasedonaKalman filter [16,20,22] ,whichresultsinsmoothandcontinuoustracks,evenif someofthe fiber-detectiondataisspuriousand/ormissing.Other methodsincludehighorientationgradients [25],heavyballmethod [26],normalizedcorrelationcoefficientandBayesianinferences [15], and3DstructuringelementswithintheFijipluginF3D [17]
Despitethewiderangeofavailableapproachesfordetectingand trackingcross-sectionsofindividual fibersimagedusingX-rayµCT, thereiscurrentlynoconsensusintheliteratureregardingwhich methodismostsuitableforthebroadestrangeofpossibleFRCsystems, scanresolutions,andqualityofimagedata.Consequently,theapplicabilityofexisting fibersegmentationmethodsappearstobelimitedto datatypesforwhichtheyweredeveloped.Additionally,inmostcases, the accuracyoftheexistingsegmentationmethodshavenotbeensystematicallyvalidated,whichmakesselectionanduseofanyone methoddifficult.Ofnotableexceptionisthestudyperformedby Emerson etal., whereimagesofaglass-fiberreinforcedpolymerwere acquiredatvaryingspatialresolutionsusingX-rayµCT,opticalmicroscopy,andscanningelectronmicroscopy [19].Theseimageswereused tovalidatetheaccuracyofestimatingunidirectional fiberdiameters andpositionsusingacircularHoughtransformandprobabilisticfeaturelabeling.ThestudybyEmersondemonstratedthat fibercrosssectionscouldbedetectedwithhighprecision,particularlyforlowresolutionimagedata.However,thisstudyvalidatedthealgorithm withunidirectional fiberorientations,anditsperformancefordetecting andtrackingmulti-directional fibersin3Dremainstobeseen.
Inviewoftheabovediscussion,thisstudyaimstoadvancethe currentstate-of-the-artin fibersegmentationfromX-rayµCTimagesby (1)developinganew3D fibersegmentationalgorithmwhichestimates, withhigh-accuracy,diameterandorientationofindividual fibersin multi-directionalFRCmicrostructures;and(2)proposinganewmethodologyforevaluating fibersegmentationalgorithmsusingsyntheticXrayµCTimagedata.Thenewsegmentationalgorithmdevelopedherein isanextensiontotheexistingapproachproposedbyCzabaj etal. that usedTMtodetect fibercross-sections,andaKalman filtertoestimate (orsegment)individual fibersin3D [16].TheTMalgorithmpresented inRef. [16] wasbasedonmanualselectionof “real” fiber-templates,
whichmadeestimationof fiberdiametersorlocal fiberorientationsnot possible,limitingitsapplicationtounidirectionalcompositeswith constant fiberradii.Thenewalgorithmremovesthislimitationbyusing “synthetic” fiber-templates,whichenablesdetectionof fibercentroids, diameters,andlocal fiberorientationsrelativetothescan-axis.Thenew algorithmalsoincludesproceduresfor fiber-tracksmoothing,track stitching,andoverlapremoval,whichminimizeserrorsassociatedwith theuseoflow-contrastandlow-resolutionX-rayµCTimagedata.The new fiberdetectionandtrackingalgorithmisevaluatedusingsynthetic X-rayµCTimagedatathataredevelopedtomimictheresolutionand qualitythatcanbeobtainedwithexistingstate-of-the-arthigh-resolutionsystems(e.g.,theZeissUltra-810,ZeissVersa-520,orAdvanced LightSourceBeamLine8.3.2).Thebenefitofusingsyntheticimage data,asopposedtorealhigh-resolutiondatafromotherimaging sources(e.g.,see [20]), isthatallinformationabout fiberpositions, shapes,andsizesareknownprecisely,makingvalidationmore straightforward.
Inwhatfollows,thismanuscriptbeginswithadescriptionofthe new fibersegmentationalgorithm,includingsyntheticTMandKalmanfilter fibertrackingfor3Dsegmentation.Next,theprocessforgeneratingsyntheticX-rayµCTimagesarepresentedandthenusedto evaluateTMand fibertrackingoverarangeofimageresolutionsand fiberarchitectures.Thismanuscriptconcludeswiththesegmentationof arealmulti-directionalX-rayµCTdataset.
2.Fibersegmentationalgorithm
The fibersegmentationalgorithmdescribedhereinhasbeendevelopedspecificallyforcontinuousunidirectionalandmulti-directional carbon/polymercompositesimagedusingX-rayµCT.Theentiresegmentationprocess,depictedusingablockdiagramin Fig.1,iscomprisedfromthreemaincomponents:(1)2DTMtodetectlocationsand radiiofindividual fibercross-sectionsinindividualtomograms;(2)3D fibertrackingtoestimatelocationandsizeof fibersegmentsusinga Kalman filter;and(3)tracksmoothing,trackselection,trackstitching, andoverlapremoval.Eachcomponentoftheproposedalgorithmis describedinthesubsequentsub-sections.Implementationoftheentire algorithmwasperformedinMatlab® .
2.1.2Dtemplate-matching
Foreachimageinatomographicstack,theTMalgorithmisusedto measure/detectcentroidsof fibercross-sections,theirradii,andmagnitudeof fibertiltrelativetotheglobalscanaxisandindependentlyof theimageresolution.Thisinformationislaterpassedontothe3D fiber segmentationalgorithm,whichisdescribedin Section2.2.Inthiswork, theTMalgorithmassumesthatonlytwophases(i.e., fibersandsurroundingmatrix)arepresentwithinawell-consolidated,void-free composite.Withthatassumption,theTMalgorithmgeneratessynthetic fibertemplatesbasedontwoparts:(1)statisticsonthedistributionof allpixelintensitieswithinatomogramand(2) fibergeometry(i.e.,a potentialrangeof fiberdiametersandorientationsofcircularorelliptical fibercross-sections).The firstpartdeterminesthelikelihoodthata givenpixelintensityisassociatedwithoneoftwoGaussiandistributions:onecorrespondingto fibersandonetothesurroundingmatrix,as seenin Fig.2a.ExpectationMaximization(EM) [27] isusedtodeterminethesedistributionsby fittingaGaussianmixturemodeltothe histogramofpixelintensities.Asaresult,therearetwooutputsfrom
template matching 3D Kalman filtering smoothing, selection, stitching, overlap removal μCT images
2D detections
3D fiber tracks
3D digital fibers
Fig.1. Blockdiagramofthe fibersegmentation process.
Fig.2. Template-matchingcombines(a)globalstatisticsonthedistributionofpixelintensitiesand(b)synthetictemplatesofvaryingsizeandorientationtodetect fibercross-sections.
EM:(a)theprobabilityofeachpixelwithintheimagebeinga fiber giventheintensity,(P(F|Cij)),or(b)theprobabilityofapixelselectedat randombeingfromthe fiberdistribution(P(F)).AGMMwasselected basedonpixelintensitydistributionsobservedinhigh-resolutionX-ray µCTimagesofvoid-freeFRCs,wherethedistributionsaretypicallybimodalandcontaintwoapproximatelynormaldistributedpointsets. Notethatforlowerresolution/contrastX-rayµCTimages,othermodels (e.g.,chi-squaredorWeibulldistributions)maybemoreappropriate. Futureworkwillfocusonexpandingthelistofpotentialmodelstobest fitotherdistributionsofpixelintensities.Here Cij denotesapixelvalue inthe ithrowand jthcolumn,and F indicatesapixelbeinga fiber.
Inthesecondpart,aprioriknowledgeofpossible fibergeometries, includingcross-sectionalshapes,orientations,andsizes,isusedto generateasetofsynthetictemplatessimilartoonesshownin Fig.2b. Theredportionofthetemplatepertainstopixelsbeinga fiber,andthe blueportioncorrespondstoeither fibersormatrix,whereeachregionis determinedusingthestatisticscollectedonthedistributionofallpixel intensitieswithintheimage.Theexactconfigurationof fiberpositions isunknown,sothemethodusedinthisworkassumesthattheblue pixelsareeither fibersormatrix.Thisisdonetodetecteventswhenred pixelsfromtwoormoreneighboring fibersaretouching,orifredpixels fromasingle fiberarecompletelysurroundedbythematrix.Thesynthetictemplatesaregeneratedbyspecifyingtherangeofpossible fiber radii,therangeofpossible fiberorientationsin2Dand3D,theallowabledetectionoverlap,andthenumberofEMoptimizationstepstobe performed.Fiberoverlapremovalconsistsofthreesteps.First, fiber cross-sectionsareapproximatedusingtheMATLABfunction inpolygon Second,thefunction quadprog isusedtodeterminewhichcross-sections arethemostlikelysetof fiberswithouttoomuchoverlap.Third,crosssectionsthatoverlaparerotated,translated,and/orhavetheirradius reduceduntiltheremainingoverlapiswithintheallowablethreshold. TheseparameterscanbeestimatedbasedonvisualinspectionoftheXrayµCTimages,ortheycanbemadepurposefullybroadifsuchestimationisnotpossible.Asshownin Fig.2b,theoveralltemplateshape issquarewithdimensionsequaltothelargestellipseused.
Theproceduretodetectindividual fibercross-sectionsistomove eachsynthetictemplateacrossatomogramwhilesimultaneously computingaLog-LikelihoodRatio(LLR)scoreforeachtemplateateach pixellocation.Scoresdeterminehowwelleachtemplatebestexplains thatportionoftheimageusingtheoverallglobalimagestatistics,and thetemplatewiththehighestLLRscoreiskeptforeachpixellocation. Positionsof fibercentroidsareestimatedbydetermininglocalmaxima oftheLLRscoreswithintheimage.ComputingtheLLRscoreisdone
withthefollowingequation:
where RF isusedtodenotetheregionofthetemplateexpectedtobea fiber.Theprimarybenefitsofthesynthetictemplateapproachareas follows:(1)usingmultipletemplatesgivesparametricinformation aboutthe fibers(includingorientationandsize),(2)useofmultiple templatesisstraightforwardwherethescoreisthemaxoverallofthe templates,and(3)ascoreofzeroisanaturalscorethresholdindicating thatthetemplateismorelikelytobecorrectthannot.
2.2.3D fibersegmentation
TMalgorithmisappliedtoeachtomogramwithintheimagestackto generateasetof3D fiberdetections.The3D fibersegmentationalgorithmisusedtoestimatethenumberof fibers,theirposition,andtheir radiifromthesetofdetectedcentroids,radii,andmagnitudeof fibertilt estimatedduringTM.Estimationofthe fiberradius,comparedtopreviouswork [16],wasaddedtothealgorithm(1)toaccountforvariabilityinTMmeasurementsof fibercross-sectionscorrespondingtothe same fiber,and(2)toenableoverlapremovalbetweenneighboring fibersbyadjustingtheirradii.Morespecifically, fibertrackingdeterminesanestimateofthestateofeach fiberforeachtomogram,denotedforthe ithvirtual fiberatimage k as x i,k.Itisassumedherethat the fiberstate, x,iscomposedof2Dposition, p,2Dvelocity, v,and radius, r,foreach fiberandimage.Inthiswork,thevelocityofa fiber trackismeasuredusingthepolarandazimuthalanglesinspherical coordinates,wheretheinitialvelocityisbasedonthe fibertiltmeasuredfromTMinthe firstimageinthestack.Inadditiontothestate estimate,thesegmentationprocessalsogeneratesanassociatederror covarianceforeachvirtual fiberstateforeachimage,denotedforthe ithvirtual fiberatthe kthimageas Pi,k.Generatinga3Dreconstruction oftheFRCmicrostructurefrom2DdetectionsinX-rayCTimages consistsof fivekeysteps:(1)tracking,(2)smoothing,(3)trackselection,(4)trackstitching,and(5)non-overlapping fiberconstraintsatisfaction.Adetaileddescriptionofthesealgorithmsishighlightedin thefollowingsections.
2.2.1.Tracking
Detailsoftrackinghavebeenpreviouslypresentedin [16] andare restatedhereforcompleteness.A fibertrackermakesaforwardpass
update detections possible assignments unassigned detections tracks
gate and score assign
tracks and assigned detections initialize terminate new tracks updated tracks extrapolate prediction
tracks not assigned detections
Fig.3. Blockdiagramofthe fibertrackingprocess.
betweenimageswithinthestackandlinksneighboring2Ddetections intoa3Dtrack.Thisprocessisrepeatedforalldetectionstogenerate multiple3D fibertracks.Thetrackerusesaglobalnearestneighbordata associationscheme [28],todeterminewhich2Ddetectionsbetween imagecross-sectionshavecloseproximity,andperformsestimation usingaKalman filter [29].Thekeystepsofthetrackerareshowninthe blockdiagramin Fig.3 anddescribedfurtherthroughoutthissection.
Asseenin Fig.3,the firststepof fibertrackingistopredictthe locationoftracksusingthe2DdetectionsfromTMforeachimage.For the firstimage, k=1,thedetectioncentroidisusedastheinitialposition,theinitialvelocityisassumedtobezero,andaninitialtrack likelihoodscoreisbasedontheratiooftruedetectionstofalsedetections,whichisdescribedinmoredetaillaterinthissection.Additionally,intheeventanewdetectionappearswithinthe fieldofview (i.e.,a fiberhadamissingdetectiononapreviousimage)orentersthe fieldofviewatsomelaterimage,thesameinitialconditionsareused. Predictionisperformedusingthestateestimateandcovariancematrix foreachtrackfromimage k toimage k+1 usingthestandardKalman filterpropagationgivenas
= =+ + + xx PPQ Φ ΦΦ, ikkikk ikkikk T ,1, ,1, (2) andawhitenoiseconstantvelocitydynamicmodelandradiusareused tomodelthechangein fiberstatefromimagetoimage,where Φ isthe statetransitionmatrix, Q istheprocessnoisecovariance, P istheerror covariancematrix,and x isthestateestimate.Fordetailsondeterminingtheprocessnoisecovarianceandthestatetransitionmatrices,thereaderisdirectedtoSection4.2.2inRef [28].Thestate transitionmatrixisdefinedtobe
withthemeasurementmatrix, H,forposition,velocity,andradiusdefinedas = = = H I H I H I [00], [ 00],and [ 0000], p v r 221 221 (6)
where I2 denotesthe2×2identitymatrix,02 denotesthe2×2zero matrix,01 denotesthe2×1zeromatrix;andthemeasurementerror covariance, R,isassumedtobeconstantforallmeasurementsand images.
Next,forallpossibledetectiontotrackpairings,threelevelsof gatingareusedtodeterminewhichpairingshouldbeconsideredinthe assignmentstep.First,thereisarectangulargatethatcompareseach measurementdimensionindependently.Forapotentialpairingofthe jthmeasurement zj,k+1 totrack i onimage k+1,andforeachdimensionofthemeasurement, ξ,thefollowinginequalitymusthold −⩽ +++ zξzξSξξ (()())4(,) ikkjk ik ,1,1 2 ,1 (7) wheretheparameter4ischosensuchthatthegateisa “2σ” window. Thischoiceofarelativelytightwindowistoensurethatfalsedetections arenotallowedintothetrack.Althoughthisincreasesthepotentialfor misseddetectionsresultinginshortertracks,thisisnotaproblemasthe trackscanbestitchedtogetherandisdiscussedfurtherin Section2.2.4. Potentialpairingsthatpasstherectangulargatearethensubjectedto anellipticalgatebasedonthesquaredMahalanobisdistance, η,given by
= + ++ + η νSν ijk ijk T ik ijk ,1,1,1 1 ,1 (8) wherethemeasurementresidual, νij,k+1,betweenthe ithtrackandthe jthmeasurement,onimage k+1,is
=− +++νzz ijkikjk ,1,1,1 (9)
andtheprocessnoisecovariancetobe
where I denotestheidentity, q istheprocessnoisescalingfactor,and τ isthespacingbetweenimages,whichisanalogoustothetimestepin thetypicaldescriptionofthestatetransitionmatrixandprocessnoise. Thenextstepistogateandscoreallpossiblepairingsofdetections totracks.Thisisperformedbycomputingthepredictedmeasurement z i,k+1,andtheresidualcovariancematrix, Si,k+1,asthefollowing:
Forapotentialpairingtopasstheellipticalgate,thesquared Mahalanobisdistancemustbelessthanathreshold, ηthresh,thatissetto enclose99%oftheprobabilityforadistributionofdegreetwoandis calculatedusingtheMatlab® function chi2inv.The finalgateisbasedon thedeltascore, δ ij,k+1,whichisanegativelog-likelihoodscoreandis computedas
=+ + + + δηπβS 1 2ln(2) ijk ijk ik ,1,1,1 (10) where β isafalsedetectiondensityparameter.Thefalsedetection densityisdeterminedbythenumberoffalsedetectionsperunitof measurementspace.Thesmallerthedeltascore,themorelikelythe pairingiscorrect.Therefore,pairingswhichproduceanegativedelta scorearesavedforpossibleassignmentintheassignmentstep.
Theassignmentstepdeterminesthemostlikelydetection-to-track pairingsusingaGNNassociation.Theassociationmakesanoptimal assignmentacrossallmeasurementsof fibertrackssimultaneouslyfrom thelistofpossiblepairingsandtheirdeltascores.Sincethedeltascore foreachpairingiscomputedasanegativelog-likelihoodscore,the mostlikelysetofdetectiontotrackpairingsisgivenbythesetwiththe lowestcombineddeltascores.Inselectingthemostlikelysetof
detectiontotrackpairings,theassignmentstepmustassignatmostone detectiontoatrackandnodetectiontomorethanonetrack.Solving theassignmentproblemwasperformedusingtheMunkresalgorithm [30]
Eachtrackthatisassignedadetectionintheassignmentstepis updatedwiththestandardKalman filterupdate.Furthermore,each trackhasanassociatedcumulativelikelihoodscorewherethedelta scorefromgatingandscoringisaddedtothetracks′ cumulativelikelihoodscore.Theupdateequationsforthe ithtracktakingthe jthdetectionatimage k+1 arethefollowing:
ij true,iftrackoverlapstrack false,otherwise ij (13)
Notethattheconflictmatrixisoriginallydefinedtocapturethe conflictsbetweenallpossibletracks.However,clusteringisemployed toreducetheproblem.Intheclusteringstep,thesmallestpossible clustersareformedsuchthatanytwotracksthatconflictareinthe sameclusterandthereforepartitionstheconflictmatrixaccordingly. Theselectionoftracksisthenperformedoneachclusteroneatatime, whichreducesonelargeproblemintomultiplesmallerproblems.
The “terminate” stepstopsatrackfrombeingextrapolatedfurther, whichisdonefortracksthathavegonetoolongwithoutanupdate(i.e., theendofa fibertrack).Forthiswork,anytrackmissingmorethanone updateopportunityisterminated.Thisstrictrequirementisimplementedtomaintainpuretracks,andisrequiredduetothenatureof thefalsealarms,whichmayappearrepeatedlyinthesameplace.Asa result,short,puretracksmaybeestimated,butthesetrackscanbe stitchedintolong,continuoustrackslaterasdescribedin Section2.2.4.
Thelaststepistoinitializenewtracksbasedonanydetectionsthat arenotassignedtoanexistingtrack.Thisisperformedtohandledetectionsthatwerenotassignedtoa fibertrack.Initialvaluesforthese tracksareassignedbasedontheinitialconditionsdescribedpreviously inthepredictionstep.
2.2.2.Smoothing
Thetrackerusesthedetectionsonlyinaforwardpass.Oncecompleted,alldetectionsareavailableandcanbeusedtoimprovethe tracksforallimages.Forthiswork,atwo-passsmootherwasimplementedbasedonthealgorithmpresentedinRef. [31].Sincethe forwardpassisperformedbythetracker,onlythebackwardpassis madebythesmoother.Giventhestateestimatesandcovarianceforthe ithtrackfromitsinitialimage, Ni,I,toits finalimage, Ni,F,thesmoothed estimatesaregivenbyrecursiveapplicationofthefollowingbackwards passequationsfor k=Ni,F to Ni,I
T ,11 ,11 1 ,1,11,,11 ,1,11, iF iF iF iF ,,
2.2.3.Trackselection
Trackselectionisusedintwocontextswithinthiswork.Firstisin theselectionamongmultiplepossibletrackstitches,whichisdiscussed furtherin Section2.2.4.Thesecondistodeterminewhichtracksto keepinthecaseofsignificantoverlap,whichisdiscussedfurtherhere. TMmay find fibersattheintersectionofmanyneighboringreal fibers eventhoughthereareno fibersthere.Ifthesefalsedetectionsarefound consistentlyfromimagetoimage,thetrackerwillformthemintorelativelylongcontinuoustracks.Toreconstructthemicrostructureaccurately,overlapping fibersmustbediscarded,whichraisesthequestionofhowtoautomaticallydeterminewhich fibersarerealandwhich arenot.Inthispaper,thisquestionisformulatedasatrackselection problem.Thatis,tracksthatoverlaptoomuchareconsideredtoconflictandcannotbothbereal.Inthiswork,toomuchoverlapwasdefinedas20%ofthe fiberdiameter.However,astatisticalmeasurebased onMahalanobisdistancewouldpotentiallybemoreappropriateand willbeexploredinfuturework.
Toperformthetrackselection,theconflictmatrix, C,isdefined initiallysuchthatthe ijthcomponentisgivenby
Giventheconflictmatrixandthelikelihoodscoresofeachofthe tracksinacluster,solvingforthemostlikelysetofnon-conflicting trackscanbeformulatedformallyasabinaryintegerprogramming problem [32],whichisNP-complete [33].Sincethisproblemis common,particularlyinMultipleHypothesisTracking,multipleapproximationalgorithmshavebeendeveloped [34–36].However,these approximationalgorithmsarespecificallydesignedtobeefficientsolverswhenthetrackselectionproblemisderivedfrommultipleimages, whichisnotthecasehere.Forthatreason,theimplementationofthese algorithmsdidnotseemappropriateorjustified.Hereahybridoftwo approachesisused.Whenthenumberoftracksissmall(<15)the selectionproblemissolvedbybruteforceevaluationofallpossible trackcombinations.Whenthenumberoftracksinagivenclusterexceeds15,thentheproblemissolvedusingthe bintprog functionin Matlab®,whichusesalinearprogrammingbasedbranch-and-bound algorithm.
2.2.4.Trackstitching
Asdescribedinthetrackingselectionstep,trackdeletionparameter settingsfavortrackpurityovertracklengthresultinginpurebutshort tracksthatdonotnecessarilyspantheentirelengthofthescanned volume.Thesetracksmustbelinkedintolongercontinuoustracksina processknownastrackstitching.Trackstitchingiswidelyusedin groundtargettrackingwherepotentiallythousandsoftargetsarebeing trackedwithfrequenttrackdropsduetolineofsightocclusionsor vehiclesstopping.Assuch,severalsophisticatedtrackstitchingapproacheshavebeendeveloped [37–39].Thetrackstitchingproblem facedhereiscomparativelysimple,andtherefore,astraightforward trackstitchingalgorithmisemployed.Thetrackstitchingalgorithm consistsof fivesteps,whicharedescribedfurtherasfollows.
Step1:the firststepisanalogoustothegateandscorestepinthe tracker.Thegoalistodeterminethepossibletrackstitchesandprovide alikelihoodscoreforeach.Thesearchforpossiblestitchesisconstrainedinfourways:(1)onlytracksthat,whenstitchedtogether, fit withintheboundaryofthespecimenareconsidered,(2)the firsttrack mustendbeforethesecondtrackbegins,(3)thenumberofimages betweentheendofthe firsttrackandthestartofthesecondislimited toauser-definedvaluetopreventincorrectstitches,and(4)whenthe firsttrackispropagatedbetweentheendofthe firsttrackandthestart ofthesecond,theirpotentialpairingpassestheellipticalgatedescribed previously.
Step2:aconflict matrixiscomputedanalogouslytotheconflict matrixdiscussedinthetrackselectionstep.Notethattwostitches conflictiftheysharetheendofthe firsttrackorthebeginningofthe secondtrack.
Step3:thethirdstepclustersthepossiblestitchesinthesamewayas tracksdescribedin Section2.2.3.Thepurposeistoreduceasinglelarge problemintomultiplesmallerproblems.Thentheselectionalgorithm cansolveeachclusterseparately.
Step4:theselectionalgorithmdescribedin Section2.2.3 isusedto selectthemostlikelysetofnon-conflictingstitchesineachcluster.
Step5:thechosenstitchesareusedtodeveloparefiltered/smoothed stateestimateforthenowlongertrack.Notethateachofthestitches arepairwise,somultiplestitchescanbeusedtoformasinglelong track.
2.2.5.Non-overlapping fiberconstraintsatisfaction
Asdefinedpreviously,thetrackselectionprocessremovesallvirtual fibersthathavesignificantoverlap.Thisisnormallycausedbythe trackerdevelopingtracksfor fibersthatdonottrulyexist.However, evenwhenallofthevirtual fiberscorrespondtoreal fibers,minor overlapsmaystillexistduetostatisticalerrorsandvariationsin fiber radii.Oneoftheimportantrequirementsfortheresultingdigitalreconstructionisthatitcontainsnooverlapping(orintersecting)virtual fibers.Thisrequirementcanbeformulatedasaconstraintbetweeneach pairof fiberswheretheoverlapremovalistreatedasaconstrained estimationproblem.TheconstraintisappliedtotheestimateaspropagatedbytheKalman filterdefinedbytheworkofJulierandLaViola [40],butisinterpretedhereasaconstraintonthedigitalmicrostructurereturnedfromthe3Dsegmentationroutine.Thesolutionto thisproblemisbasedonthesolutionofamaximumaposteriori(MAP) optimizationandisspecificallydesignedtoremaintractableevenasthe numberofconstraints/tracksgrows.Thisworkemploysanumerical approachbasedonapolygonintersectionapproximationtotheellipses. AMAPestimateissoughtfromtheunconstrainedprobabilitydensity function(pdf)thatsatisfiestheconstraints.Theunconstrainedpdffor thetracksderivedfromtheprevious Sections2.2.1–2.2.4 define p(xi|Zi) asGaussianforeachimageandeach fiberindependently.TheMAP approachseeksthemaximumofthisdistributionthatdoesnotviolate thenon-overlappingconstraint.Thisresultsinaquadraticcostfunction wheretheconstraintisdefinedasthemaximumoverlapdistancebetweenpolygonapproximations.Mathematically,themaximumoverlap distanceiswrittenasthefollowingequation: =∥ ∥
∈ ∈ d pp max(min) pPoly
(14) where d isthemaximumoverlapdistance,and Poly1 and Poly2 aretwo circularorellipticalpolygonapproximationsof fibercross-sections usingpoints pi and pj
2.2.6.Finaltrackradius
Afterperformingtracking,smoothing,trackselection,track stitching,andnon-overlapping fiberconstraintsatisfaction,theradius foranygiventrackmayvaryacrossitslength.Inthisstudy,itisassumedthat fibersmaintainaconstantradius,thustheradiusforeach trackisdeterminedusingtheminimumvaluefromthelistofestimated radii.Theminimumradiusisselectedtoavoidoverlapbetween neighboringtracks.
3.Generationofrealandsyntheticdata
Inthisstudy,realandsyntheticX-rayµCTimagesareusedto evaluatetheperformanceofthesegmentationalgorithm.RealX-ray µCTimageswerecollectedtoprovidebaselineinformationneededto generatesyntheticimagesandwereusedtodemonstratesegmentation ofas-manufacturedmulti-directionalmicrostructures.Syntheticimages wereusedtovalidatetheaccuracyofTMandtrackingalgorithms. Detailsofacquiring/generatingtheseimagedataaredescribedinthe followingsub-sections.
3.1.AcquisitionofrealX-rayµCTdata
RealX-ray μCTimageswereacquiredon1mm×1mmsection extractedfromIM7/8552carbon/epoxylaminate,whichcontained pliesorientedat+45°, 60°,and+60°withindividual fibershavinga nominaldiameterof5.2µm [41].ImagingwasperformedusingaZeiss Xradia520VersaCTmicroscopeovera360°rotationusing4000projections,60kVvoltage,5Wpower,14sexposuretimeperprojection, anda40×objectivelens.Theresultingvoxelsizewasapproximately 410nm,andthetotalscantimewasapproximately16h.Reconstructionofattenuationdatawasperformedusing filteredback-projection producing949cross-sectional,gray-scaleimages.Duetothe
considerablenumberof fiberscontainedwithinthe fieldofview,a smaller205×205×80µmsub-volumewasextractedforthiswork.In additiontothehigh-resolutionscan,fouradditionalscanswereperformedatprogressivelylowerresolutions.Intotal, fivesetsofreal imagedatawereacquired:onetomographicimagestacktoevaluatethe robustnessofthe fibertrackingalgorithm,andfourscanstoformthe rangeofimageresolutionsforsyntheticdatageneration.
3.2.GenerationofsyntheticX-rayµCTdata
SyntheticX-rayµCTdatacanbegeneratedintwopossibleways. The firstmethodinvolvescreatingaphantomFRCmicrostructure, performingaRadontransformtocreatecorrespondingsinograms,and thenreconstructingthesinogramsusing filteredback-projection.The secondmethodinvolvesdirectlycreatingsynthetictomogramsthat mimictheresolutionandqualityofimagesobtainedfromexisting imagingsystems.The firstmethodaccountsforartifactformation causedby filteredbackprojection;however,itdoesnotaccountfor noiseandartifactformationcreatedduringimageacquisition.Given thatthelattereffectwasthoughttohaveastrongerinfluenceonperformanceof fibersegmentationalgorithms,thesecondmethodwas usedinthisstudy.
Generationofsynthetictomogramswasbasedonseveralkeyassumptions.First,itwasassumedthatthedistributionofnoiseinrealXrayµCTdataisGaussian.Ingeneral,theactualdistributionofnoiseis difficulttodetermine,andislikelydependentonthematerialimaged and/ortheX-rayµCTsystem.Second,itwasassumedthatonlytwo constituents(fibersandthesurroundingmatrix)werepresentwithin thesyntheticmicrostructures.Featuressuchascracksorvoidswere excludedfromthesyntheticdataduetothedifficultyinquantifying/ representingtheirgeometriessystematically.Third,itwasassumedthat fibersareperfectlycylindrical,and,whenmimickingthe fibercrosssectionprofile fromX-rayµCTimagedata,itwasassumedthatthepixel intensityprofilehadcircularsymmetry(i.e.,symmetryaboutthe perimeter).Theseassumptionswereusedtoconstructrepresentative2D tomograms,whichweresubsequentlyconvertedinto3Dimagestacks asdescribedinthefollowingtwosub-sections.
3.2.1.Generationof2Dsynthetictomograms
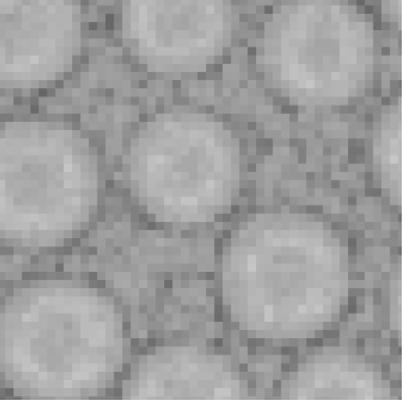
Generationof2Dsynthetictomogramswasperformedin fivesteps. The firststepinvolvedcreatingasingle2D232×209µm16-bit grayscaleimage,witharesolutionof~0.42µm/pixel,thatcontained 1000hexagonally-packed fiberswithrandomlyvaryingdiametersanda fibervolumefractionof Vf =0.81.Theassignmentofrandom fiber diameters,whichhadameanvalueof7.1µmandastandarddeviation of±0.83µm,wasbasedonopticalmeasurementsobtainedfroman AS4/3501–6carbon/epoxysystem [42].Inthisimage,theintensityof pixelscorrespondingto fiberswasinitiallysetto0,whilepixelscorrespondingtothematrixweresettoavalueof35,727.Inthesecond step,38 fibercross-sectionswereremovedatrandomtosimulatematrix-richregions,whichresultedin962hexagonally-packed fiberswith a fibervolumefractionof Vf =0.79.Inthethirdstep, fibercentroids wererandomlyperturbedaccordingtothealgorithmdevelopedby Wongsto etal. [43].Inthefourthstep,amask(i.e.,aprofilethatmimics thedistributionofpixelintensitiesforcarbon fibersimagedusingX-ray µCT)wasappliedtoeach fibercentroid.Togeneratethismask,pixel intensitiesacrossseven fibercross-sectionsfromrealimagedatawere sampledusingtheopen-sourcesoftwareFiji [44],asshownin Fig.4a. Thesamplingofpixelintensitiesfromrealimagedatawasnecessaryto quantifytheextentofbeamhardening [45] thatisobservedonthe peripheryofindividual fibersimagedwithX-rayCT.Theprofilesof pixelintensitiesforindividual fiberswere fittedwithasixth-order polynomialfunctiontoobtainageneralprofileofpixelintensities acrossatypical fiber(see Fig.4b).Thispolynomialfunctionwasusedto generatearowofpixelintensitiesrepresentingageneric fiber,which wassubsequentlyrevolvedaboutthe fibercentroidtoproducethe fiber P.J.Creveling,etal.
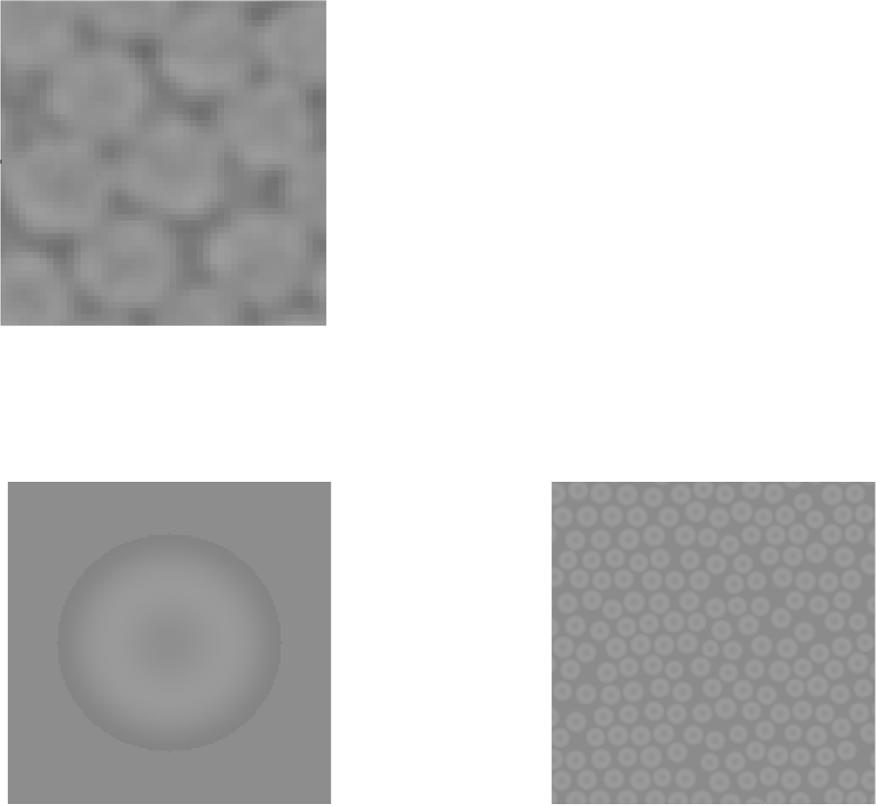
Fig.4. Processofgeneratingsyntheticimagesbasedona fibermaskgenerated fromX-rayµCTdata.
mask,asshownin Fig.4c.Toaccountforvarying fiberdiameters,the polynomialfunctionwasappropriatelyscaledforeachuniquediameter.Auniquemaskwasappliedateach fibercentroidwithinthe syntheticmicrostructureusingthe convn functioninMatlab®,asshown in Fig.4d.Inthe fifthstep,Gaussiannoise,Gaussianblurring,and histogrammatchingwereappliedtothesyntheticimage.Thiswasdone tomimicthehistogramofpixelintensitiesseeninrealimagedata.Both noiseandblurringwereperformedusingFiji,whilehistogrammatching wasperformedusingthefunction imhistmatch inMatlab®.Thesteps mentionedpreviouslydescribethegenerationofasynthetictomogram atoneresolution;however,thesestepscanbeadaptedforanyresolutionandnumberof fibers.
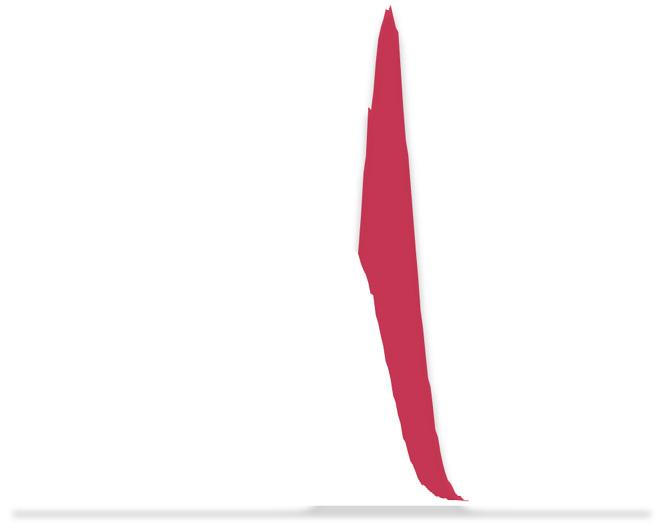
Thehighestresolutionsynthetic2Dtomogramhadaresolutionof 0.417µm/pixel,whichcorrespondsto17pixelsperaverage fiberdiameter(pixels/davg).Togeneratesyntheticdataatlowerresolutions,the “high-resolution ” synthetictomogramwasdownsampledusingbilinear interpolationinFiji,whichwasfollowedbyadditionalblurringand histogrammatching.Inthiswork,tomogramsweregeneratedat4.1, 8.8,14.4,and17pixels/davg.Thesefourresolutionscorrespondtoan existingrangeproducedbystate-of-the-artX-rayµCTsystems. Fig.5 showsthesyntheticimagegenerationappliedto fiberlocationsextractedfromrealX-ray μCTimages,wherepositionsandradiiof fiber cross-sectionsweredeterminedusingresultsfromtheTMalgorithm appliedtoeachrealimage.ThetoprowshowsoriginalX-rayµCT images,themiddlerowshowsthecorrespondingsyntheticimages,and thebottomrowcorrespondstohistogramsofpixelintensitiesextracted fromrealandsyntheticimages.Qualitatively,theproposedmethodfor generatingsynthetictomogramsmimicsthecontrast,noise,andpixel distributionsofrealdataquitewellacrosstherangeofresolutions considered.
3.2.2.Generationof3Dsynthetictomographicstacks
Thehigh-resolution2Dsyntheticimagedescribedintheprevious sectionwasusedtogeneratethreedistinctsynthetic3Dtomographic stacks,eachrepresentingtwo “plies” with0°/0°,±45°,and+45°/ 60° fiberorientations,respectively.Forthe0°/0°dataset,the2D syntheticimagewas firstcroppedtoanewwidth W =125.7µmand height H =125.7µmtoreducethecomputationaltimeassociatedwith 3D fibersegmentation.Next,theplyinterfacebetweenthetwo0°plies wascreatedbyplacingtwo H×W croppedsyntheticimagestogether side-by-side,resultinginanewimagewithawidth 2W andheight H (see Fig.6a).Theentire0°/0°datasetwasgeneratedbyusing
538H×2W images,whereeachimageinthestackhadnoise,blurring, andhistogrammatchingappliedseparately.
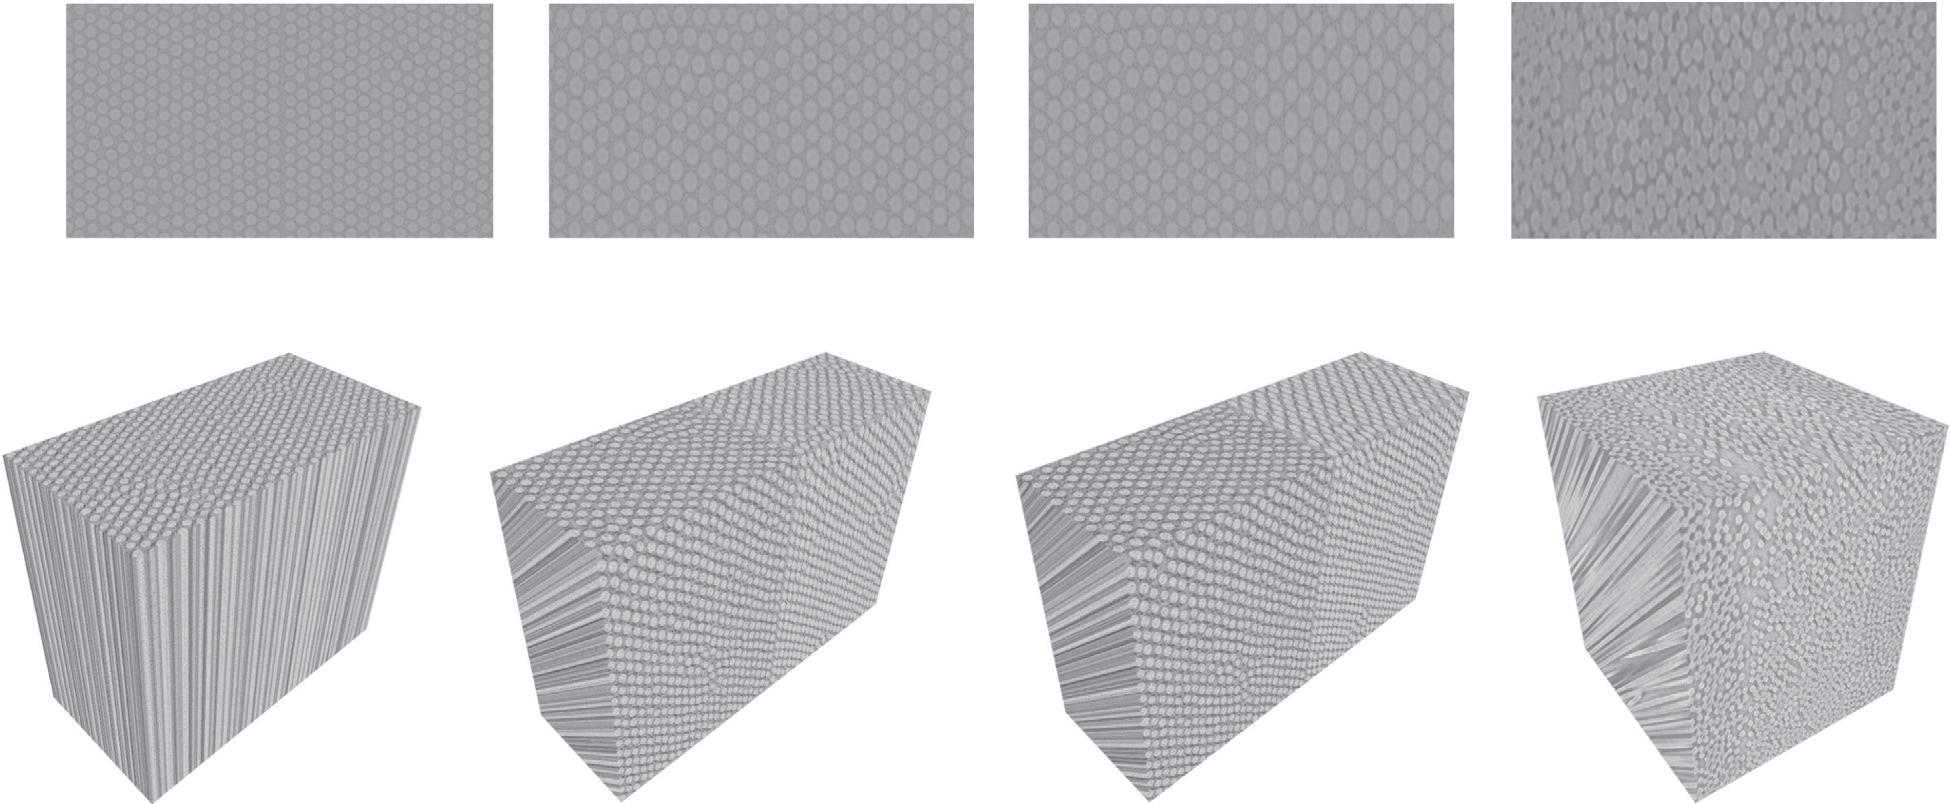
Imagestackswithoff-axis fiberswereproducedbyvertically stretchingtheside-by-side H×W imageswithinthe0°/0°stackto createelliptical fibercross-sectionsthatrepresent+45°or 60° fiber angles.Forthe+45°/ 60°image,thenewlystretchedsidebyside imageswereofsize 2 H×W and2H×W,respectively.Next,images oneithersideoftheinterfaceweretranslatedverticallyusingaMatlab® function imtranslate suchthateachimageinthestackwastranslated furtherthantheprevious.Thiswasrepeatedforallimageslicesinthe stacktogive fibercross-sectionstheappearanceofmovingata “fiber velocity” correspondingtothedesiredorientationofagivenply.For example,inthe+45°/ 60°dataset,left-sideimagesweretranslated verticallyup,andright-sideimagesweretranslatedverticallydown. Aftertranslation,theresultingimagestackresembledaparallelepiped, whichwassubsequentlycroppedtoanewwidth 2W andheight H to producearectangularprism.Examplesofstackscontainingoff-axis fibersaftercroppingareshownin Fig.6bandc.
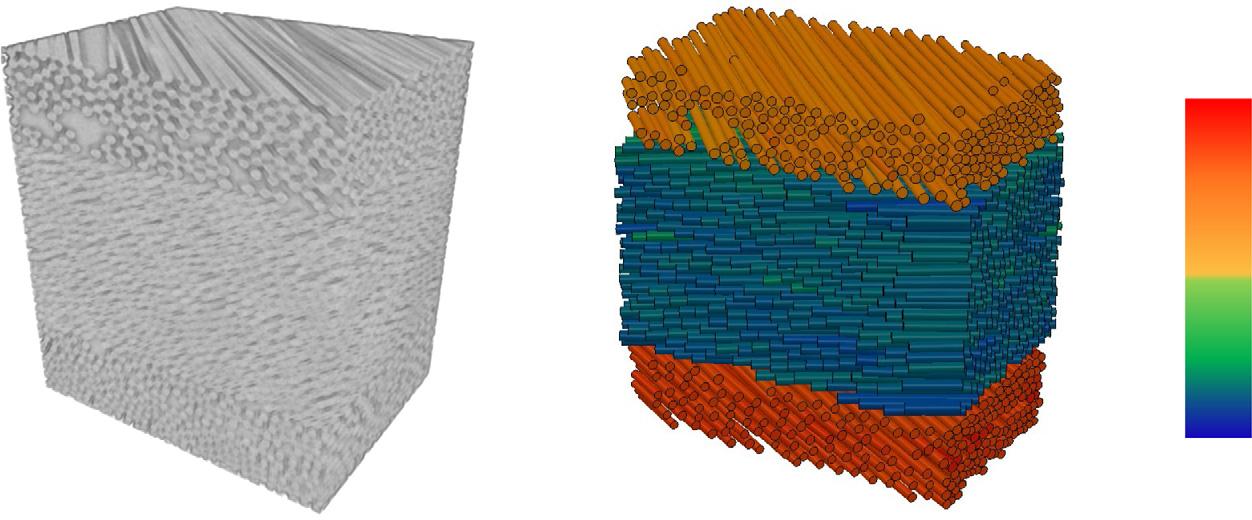
Theresultingsyntheticandrealimagestacksareshownside-by-side in Fig.6e–h.Inthis figure,the0°/0°,±45°,and+45°/-60°synthetic imagestackshaveanaverage fiberdiameterof17pixelsandinclude 538,537,and499images,respectively.Imagestacksin Fig.6e–g contain623,1441,and1408individual fibers,respectively.Theprocessforgenerating3Dtomographicstackswasrepeatedforthreelower resolutionssyntheticimages,4.1,8.8,and14.4pixels/davg,toproduce atotalof12volumetricdatasets.
4.Resultsanddiscussion
Evaluationofthe3D fibersegmentationalgorithmwasperformed byexamininghow:(1)theTMalgorithmdetectsindividual fibercrosssectionsin2Dtomographicimages,and(2)the fibertrackingalgorithm estimatespositionsofindividual fibersin3DbasedontheTMinput. Both2Ddetectionand3Destimationwereperformedonsynthetic imagesoffourseparatespatialresolutions:4.1,8.8,14.4,and17pixels/ davg.
4.1.EvaluationoftheTMalgorithm
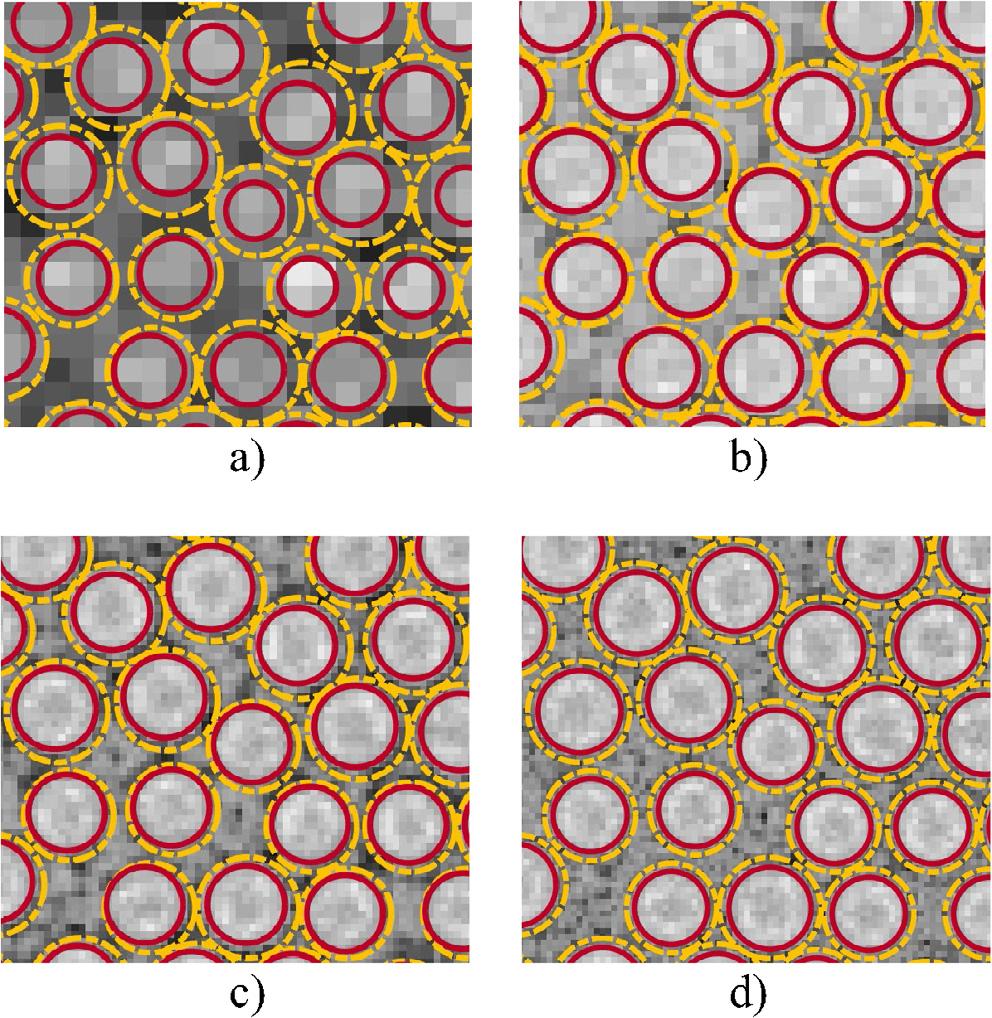
EvaluationoftheTMalgorithmwasperformedusingsynthetic2D imagesdescribedin Sections3.2.1–3.2.2.Forthehighestresolution2D image,TM,whichrequired82uniquetemplates,wascompletedin3.3 wall-clocksecondsbyrunningon14coresinparallelonadesktop workstationwitha14coreIntelXeonE5-2690v4,2.6GHzCPUwith 256GBofRAM. Fig.7 showsasmallsubsetof0° fiberswithTMdetections(red)andcorrespondinggroundtruth(yellow).Fromthis figure,itisevidentthatTMdetectsthelocationof fibersquitewellfor allimageresolutions.However,forallresolutionsconsidered,theTM algorithmunderestimatesthediameterof fibers,particularlyatlowresolution(see Fig.7a).Toquantifythisfurther,theTMalgorithmwas evaluatedbasedonthefollowingthreemetrics:(1)thepercentdetectionofindividual fibers,(2)theaverageerrorbetweentrueandmeasuredpositionsof fibercentroids,and(3)theaveragepercenterror betweentrueanddetected fibercross-sectionalareas.
Resultsfromevaluatingthe firstmetricareshownin Fig.8,where thepercentofdetected fibersisplottedonthey-axis,theimageresolutionisgivenonthex-axis,andthered,green,andbluebarscorrespondto fibersorientedat60°,45°,and0°,respectively.Asseenin this figure,TMperformsquitewelldetectingthetotalnumberof fiber cross-sections,evenatthelowestimageresolution.TMdoesnotdetect anyspurious fibers,whichislikelyduetothedensepackingof fibersin thesyntheticimages(i.e.,spuriousdetectionsusuallyoccurinlarge resin-richareas).Despitetheveryhighrateofdetection,afew fibersin the0°imagesweremissed.Themissed fiberswerenotdetectedbecause theirdiametersweresmallerthanthesmallestpre-definedsynthetic fibertemplate.Thelowrangeofpotential fiberdiameterswasmade
Fig.5. ComparisonbetweenrealX-rayCT(top)andsynthetic(middle)atvariousresolutions.Bottomrowcompareshistogramsofrealandsyntheticimages.
slightlylargerthanthesmallest fiberstoavoiddetectionofspurious fibersintheresin-richareas.Inotherwords,thedetectionofallpossible fiberswassacrificedtogeneratehigh-qualitytruedetections.An alternativeapproachwouldbetoselectarangeoftemplatesthatencompassesall fiberdiameters,generatespuriousdetections,andallow the fibertrackerto filtertheseoutduringtrackselectionandstitching. Resultsofevaluatingthesecondmetricareshownin Fig.9,where theaverageerrorindetecting fibercentroidsiscomputedbytakingthe differencebetweentrueandmeasuredpositionsof fibercentroidsand normalizingthesevaluesbythecorrespondingtrue fiberdiameter.In this figure,theerroranditsstandarddeviation(errorbars)isplottedon
they-axis,theimageresolutionisplottedonthex-axis,andthecolor barscorrespondtothe fiberorientations.Asevidentfor Fig.9,the averageerrorandstandarddeviationdecreasewiththeincreasing imageresolution,andincreasewiththeincreasing fiberangle.Theincreaseoferrorwith fiberanglemayberelatedtothelargervariability ofpixelintensitieswithinanygiven fibercross-section.Fiberswith higherangleshavelargercross-sectionalareas,andthusaremorelikely tocontainnoisypixelswhichareexpectedtodecreasethedetection accuracy.Regardless,forallthree fiberorientationsanalyzed,the highestaverageerrorwas10.4%withastandarddeviationof6.2%, obtainedfromthe60° fibersandaresolutionof4.1pixels/davg.This
Fig.6. Imagesofsynthetic(a–c)andreal(d)2Dcross-sectionsandcorresponding3Dvolumes(e–h)usedtoevaluatetheperformanceofthe3D fibersegmentation algorithm.
Fig.7. TMresults(red)andcorrespondinggroundtruth fibers(yellow)forfour imageresolutions:(a)4.1,(b)8.8,(c)14.4,and(d)17.0pixels/davg.(Forinterpretationofthereferencestocolorinthis figurelegend,thereaderisreferred tothewebversionofthisarticle.)
Fig.9. AverageerrorbetweentrueandTM-measuredpositionsof fibercentroidsversusimageresolution.
Fig.8. Percentdetectionofindividual fibersbytheTMalgorithmversusimage resolution.
errorcorrespondstothedetectedpositionsbeingoff byapproximately 0.42pixels,whichisquitesmallrelativetotheaverage fiberdiameter.
Resultsfromevaluatingthethirdmetricareshownin Fig.10,where theaveragepercenterrorbetweentrueandmeasured fibercross-sectionalareasisplottedonthey-axis,andtheimageresolutionisplotted onthex-axis.Examining Figs.7and10,itisevidentthattheTMalgorithmhaddifficultydetectingthetrueareaof fibercross-sectionsfor allimageresolutions.Atthelowestresolution,theerrorwas53.2%on averageforallthree fiberorientations,andastheresolutionwasincreased,theerrorremainedrelativelyconstantatapproximately33%.
Foreach fiberangle,thestandarddeviationdecreasedfrom8.4%at4.1 pixels/davg to1.9%at17pixels/davg.
Oneexplanationforthelargererrorinmeasuring fiberareamaybe thesimplisticmodelusedtogeneratesynthetictemplates(shownin Fig.2b).Thelimitationofthismodelisillustratedin Fig.11,wherethe
Fig.10. AverageerrorbetweentrueandTM-measured fibercross-sectional areasversusimageresolution.
Fig.11. Thedifferenceindistributionofpixelintensitiesacrossreal/synthetic fibers(dashedline)andthatassumedbythesynthetictemplatesintheTM algorithm(redline).(Forinterpretationofthereferencestocolorinthis figure legend,thereaderisreferredtothewebversionofthisarticle.)
synthetictemplate(solidredline)assumesthereisasharpchangein pixelintensitieswhentransitioningbetweena fiberandthesurroundingmatrix.However, fibersimagedusingX-rayµCTexhibitbeam hardening,whichismanifestedbyagradualdropinpixelintensities aroundtheperimeterofindividual fibers,asshownbythedashedblack linein Fig.11.Thelow-intensitypixelscausedbybeamhardeningare excludedafterEMisperformed;andasaresult,TMunderestimatedthe trueareaof fibercross-sections.Twopossibleremediesforthisissue include:(1)modelingthesynthetictemplatestomodelbeamhardening
artifacts,or(2)artificiallyincreasingtheestimateddiameter/areaof detected fibersbasedonaprioriknowledgeof fibersizes.Thelatter optionwillonlyworkfor fibertypesthatexhibitaconstant fiberdiameter.
Basedontheresultspresentedin Figs.8–10,itcanbeconcluded thattheproposedTMalgorithmisquiteaccuratewhen fiberscontain, onaverage,atleast9pixelsacrossthediameter.Atthisresolution, errorindetectingthenumberandpositionof fibercross-sectionsisless than5%regardlessof fiberorientation.Althoughthiserrorincreases forlowerresolutionimagedata,TMremainsaccurateindetectingthe numberandpositionof fibercross-sections,evenwhenindividual fibers cannotbediscernedvisually.AsurprisingoutcomeofvalidatingtheTM algorithmisthepersistenterrorinmeasuring fibercross-sectionalarea. Correctionofthisissuewillbethesubjectoffuturework.
4.2.Evaluationofthe3D fibertrackingalgorithm
Evaluationofthe fibertrackingalgorithmwasperformedusing syntheticvolumesdescribedin Section3.2.2.Tothisend,foreach syntheticvolume,TMwasappliedtoallimageswithinthestack,the resultingdetectionswerehandedtothe fibertrackingalgorithm,and subsequentlyprocessedasoutlinedintheblockdiagramshownin Fig.3.Thegreatestcomputationalcostwasassociatedwithtrackingthe highestresolution+45°/ 60°dataset,whichtookapproximately1h ofwall-clocktimeonthesamedesktopworkstationdescribedin Section 4.1.Thelowestcomputationcostwas47.5minandcorrespondedtothe 0°/0°datasetatthelowestresolution,whichdoesnotincludethetime takentoevaluatetheresulting fibertracks.Whenexecutingthe fiber trackingalgorithm,thegreatestcomputationalcostisdevotedtothe gatingandscoringsteps.Forafewdatasetsanalyzed, fibertracking producedshort fiber-tracksneartheperipheryofthesyntheticvolumes, whichresultedfromclippedmeasurementsduringTM.Thesetracks, causedbymissingdata,couldnotbestitchedintolongercontinuous tracks,andthuswereremovedfromevaluationofthe fibertracking algorithmdescribedinthesubsequentdiscussion.
The3D fibertrackingalgorithmwasevaluatedbasedonthefollowing fivemetrics:(1)theaveragepercenterrorbetweentrueand estimated fibercentroidpositions,(2)theaveragepercenterrorinestimatedtracklength,(3)theaveragepercenterrorbetweentrueand estimated fibertrackcross-sectionalareas,(4)theaveragepercenterror inestimated fibertrackorientation,and(5)thepercentageofresulting tracksthatcorrespondtotrue fibers.
Resultsfromevaluatingthe first metricareshownin Fig.12.Inthis figure,theaveragepercenterrorindetected fibercentroidpositions after3Destimationforthe+45°/ 60°,±45°,and0°/0°datasetsis plottedonthey-axisusingred,green,andsolidbluebars,respectively. Asin Fig.9,thepositionerrorwasnormalizedbythetrue fiberdiameter,andthestandarddeviationisrepresentedwitherrorbars.In addition,foreachdataset, Fig.12 showstheaverageerrorindetected fibercentroidpositionsafterTMbutpriortotracking,whichisrepresentedusinghatchedbars.Asseenin Fig.12,onaverage,theerror andstandarddeviationdecreasewithincreasingimageresolutionfor allthreedatasets.
WhencomparingresultsofTMto3Destimationforthe+45°/ 60°,±45°datasets,theerrorandstandarddeviationincreasesafter 3D fiberestimationwasperformed,whileforthe0°/0°datasetsthe errorandstandarddeviationdecreasesorremainsconstant.Theincreaseinthepositionerrorafter3Destimationisrelatedtodegradation oftrackqualityneartheboundariesoftheimagevolume.Specifically, fortheoff-axisdatasets,asindividual fibersapproachtheimage boundary,theircross-sectionsareprogressivelyclipped.Forsuchcases, theTMalgorithmattemptsto fitsmallertemplateswithintheclipped cross-sections,whichresultsindetected fibercentroidsthatfollowthe volumeboundary(ratherthanthetrue fibercentroid).Thisprocessis repeatedforall fibersexitingthe fieldofviewuntiltheir fibercrosssectionsarefullyclipped,orthedetecteddiametersofclipped fibersare
4.18.814.417.0 -TM ± Tracker ±
Fig.12. Theaveragepercenterrorbetweentrueandestimated fibercentroid positionsversusimageresolution.
smallerthanthesmallestpre-definedsynthetic fibertemplate.The degradationinthequalityofTMdetectionsneartheboundariesresults indecreasedqualityof fibertracks,whichaffectstheestimationof fiber area,length,andorientation.Tolessenthiseffect,itisrecommended that fibersegmentationbeperformedonslightlylargerimagestack volumes(e.g.,volumesthatareatleastonemajor fiberdiameterlarger thanneededonallsides)andtrackdataattheboundariesbediscarded.
Resultsfromevaluatingthesecondmetricareshownin Table1, whichgivesthemean,µ,andstandarddeviation, σ,ofthepercenterror intheestimatedtracklengthsforeachdataset.Overall,the3Destimationalgorithmdeterminesthetruelengthof fiberswell.Asthe imageresolutionincreases,themeanandstandarddeviationremains roughlyconstantforeachdataset.Forthe+45°/ 60°and+45°datasets,themeanandstandarddeviationvaluesaresimilarregardlessof the imageresolutions,whileforthe0°/0°datasetstheerrorisnearly zero.Asmentionedpreviously,fortheoff-axis fibers,theerrorinthe estimatedtracklengthisrelatedtothedegradationofthe fiber-detectiondataneartheimageboundaries.Specifically,asthe fibertracks begintodivergeneartheboundary,theyareterminatedoncethenext estimatedpositionfailstomeetthegatingandscoringcriterion(see Section2.2.1).
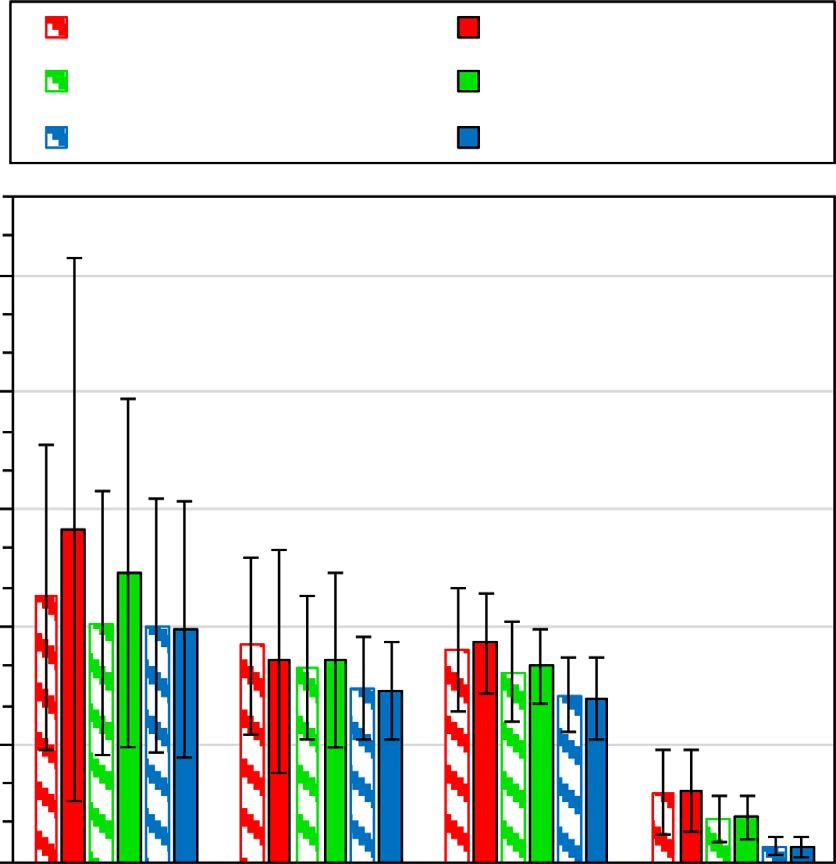
Resultsfromevaluatingthethirdmetricareshownin Fig.13,where theaveragepercenterrorbetweentrueandmeasured fibercross-sectionalareasforthe+45°/ 60°,±45°,and0°/0°datasetsisplottedon they-axisusingred,green,andsolidbluebars,respectively.Standard deviationisrepresentedwitherrorbars,andtheimageresolutionis givenonthex-axis.Examining Fig.13,therearethreeseparatetrends worthnoting.First,forthe8.8,14.4,and17pixels/davg resolutions, increasein fiberangledecreasestheerror,butincreasesthestandard deviation.Second,theerrorincross-sectionalareaforthe0°/0°datasets decreasesmonotonicallywiththeincreasingresolution.Third,theerror incross-sectionalareaforthe±45°and+45°/ 60°datasetsdecreases betweenthetwolowestresolutions,butremainsessentiallyconstant thereafter.Forallthreedatasets,thestandarddeviationalwaysdecreaseswithincreasingimageresolution.
Thetrendsobservedin Fig.13 forallthreedatasetsaredirectly relatedtohowthe final fiberradiusisdeterminedforeachtrack.As describedin Section2.2.6,the fiberradiusisdeterminedbasedonthe
Table1
Themeanandstandarddeviationofthepercenterrorinestimatedtracklength.
Fig.13. Theaveragepercenterrorbetweentrueandestimated fibercrosssectionalareaversusimageresolution.
smallestestimatedradiusalongthelengthofagiventrack,whichis donetoensurenooverlapbetweenadjacent fibers.Forthe0°/0°datasets,the fiberestimationwasnoisyatlowimageresolutions,which translatedintolargeerrorsinthe fibercross-sectionalarea.Astheresolutionwasincreased,theradiusestimationwasmuchsmootherand closertothenominal fiberdiametersmeasuredbyTM.Fordatasets withoff-axis fibers,onaverage,estimationof fiberradiusisalotless noisysinceanincreasedcross-sectionalareaprovidesmorepixelsfrom whichtodeterminetheboundary,resultinginabetteroverallestimation.However,asmentionedbefore,foroff-axis fibersestimationof fiberradiiwasaffectedbydegradationofTMdataneartheimage boundaries,whichinturnresultedinoverallhigherscatterintheestimated fiberarea.Basedontheresultsconcludedin Fig.13,theuseof thesmallestestimatedradiusalonganygiventrackcanbeconsidered overlyconservative.Futureworkwilladdressthisissuebydefiningthe fiberradiusbasedonameanormedianvaluefromthelistofestimated fiberradiiforagiventrackandallowfortheMAPsolution(see Section 2.2.5)toremovetheoverlapbetweenneighboring fibertracks,ifsuch overlapexists.
Resultsfromevaluatingthefourthmetricareshownin Table2,
Table2
Themeanandstandarddeviationofthepercenterrorinorientationof fibertracks.
whichgivesµand σ ofthepercenterrorintheestimatedtrackorientationsforeachdataset.Trackangleiscalculatedusingtheorientationofabest fitstraightlinethroughthecoordinatesofthecorresponding fibertrack.Asseeninthistable,the3Destimation algorithmdeterminestrue fiberorientationquitewell.Thegreatest erroroccurredatthesecondlowestresolutionforthe+45°/ 60°dataset,wherethe fiberorientationerrorhasameanof1.04%anda standarddeviationof4.2%.Thisorientationerrorcorrespondsto fibers beingoff by1.5°onaverage.Similartotheothermetrics,theslight errorinestimating fiberorientationsforoff-axisdatasetsisrelatedto thedegradationof fiberdetectionsneartheboundariesofthetomographicimagestacks.
Resultsfromevaluatingthe fifthmetricareshownin Fig.14,where thepercentageofresultingtracksthatcorrespondtotrue fibersforthe +45°/ 60°,±45°,and0°/0°datasetsisplottedonthey-axisusing red,green,andsolidbluebars,respectively.Thepercentageiscalculatedbasedonthenumberofresultingtracksthatcorrespondtoatrue fiber track,independentoftheirlength,dividedbythetotalnumberof true fibertracks.Asseenin Fig.14,3D fiberestimationperformsquite wellatdeterminingthetotalnumberofexisting fiberswithinthesyntheticimagestacksforalldatasetsanalyzed,particularlyforthe0°/0° datasets.Foreachdatasetandindependentofresolution,3D fiberestimationdeterminedapproximately96.8%oftheexisting fibertracks.A majorityofthemissingtracksforoff-axisdatasetswerequiteshort,and wereremovedduringthetrackdeletionstep(see Section2.2.1).In general,theremovaloftracksoccurredatlocationswhere fibercrosssectionswereclippedduringTM,andwheretracksspannedacross10 imagesorless.
Insummary,the3D fibertrackingalgorithmperformswellatestimatingposition,length,orientationandnumberofexisting fiberswhen fibersanglesaresmallrelativetotheX-rayµCTscanaxis.Estimationof fibercross-sectionalareaistheonlymetricthatimproveswithincreasing fiberangle.Consideringtherelativemagnitudeoferrorforall fivemetrics,3Destimationperformsbestwhenthe fibercross-sections containedatleast9pixelsacrossanygiven fiberdiameter.Atthisresolution,detectionerrorforthepositionof fibercentroidsisonaverage ~5%forall fiberorientationsanalyzed,estimatedtracklengtherroris onaveragelessthan5%, fiberorientationsareestimatedonaverage within1%oftheirtruevalues,andmorethan95%oftheexisting fibers aredetected.ComparingtheresultsobtainedfromevaluationTMand fibertracking,3Destimationisquitesensitivetothequalityofdetections,thustoproducehigh-quality fibertracks,high-qualitydetections
Fig.14. Thepercentageofresultingtracksthatcorrespondtotrue fibersfor3D estimationversusimageresolution.
fromTMareneeded.
4.3.3D fibersegmentationofrealX-rayµCTimagedata
Theinitialevaluationofthe fibersegmentationalgorithmwasfollowedbysegmentationof fibersintheIM7/8552carbon/epoxycompositesystemimagedasdescribedin Section3.1.Resultsofthissegmentationarepresentedin Fig.15,where Fig.15ashowsthe3D renditionoftheactualX-rayCTimagestack; Fig.15bshowstheresultingCADmodelofthesegmented fiberscolor-codedaccordingtothe fiberorientationangle, α:and Fig.15cshowsthepdfof α.In Fig.15b-c, α isdefinedastheanglebetweenagiven fiberandthex-axis.Asdescribedin [16],thedirectionofeach fiberwasapproximatedasa straightlinethatintersectsthe fiberendpoints,andwhichisprojected ontothex–yplane.Asevidentfrom Fig.15band15c,themajorityof fibersarealignedwiththe+45°, 60°,and+60°directions,whichis consistentwiththelaminateplylayupused.Foreachdistinctply,individual fibersdeviatetosomeextentfromthenominal fiberdirections, whichisevidentbythetextureofcolorsseenin Fig.15bandthe standarddeviationofeachmajorpeakin Fig.15c.Inadditiontoprovidinginformationrelatedtothelocationandorientationofindividual fibers,the fibersegmentationalgorithmwasusedtodeterminethe averageareaof fibercross-sections.Forthedatasetshownin Fig.15, theaverage fiberareawas17.52±2.27µm2,whichisapproximately 17.5%smallerthanthenominalareaoftheIM7 fibersreportedbythe manufacturer [41].Asdescribedin Section4.1,thisdifferenceisrelated
tosynthetictemplatesnotaccountingforartifactscausedbybeam hardeningaroundtheperimeterofindividual fibers.Despitethisissue, comparing Fig.15aandc,the fibersegmentationalgorithmprovideda verygoodapproximationoftheimagedmicrostructure.Furtheranalysisofthesegmented,reduced-orderdatashownin Fig.15 wasbeyond thescopeofthiswork,andwillbethesubjectoffutureefforts.
5.Conclusion
Thisstudyaimstoadvancethecurrentstate-of-the-artin fiber segmentationfromX-rayµCTimagesby(1)developinganewalgorithmfor3Dsegmentationofindividual fibersinmulti-directionalFRC microstructures,and(2)proposingamethodologyforevaluating fiber segmentationalgorithmsusingsyntheticX-rayµCTimagedata.The new fibersegmentationalgorithmusessynthetic fiber-templatesand templatematchingtodetect,in2D,centroids,diameters,andorientationsofindividual fibers.The2Ddetectionsareusedtotrackindividual fibersin3DusingaKalman-filterestimator.Toobtainhigh-quality fiber tracksandminimizeerrorsassociatedwithspuriousorsparsedetection data,thesegmentationalgorithmincorporates fiber-tracksmoothing, stitching,andoverlapremoval.Thenewsegmentationalgorithmwas evaluatedusingsyntheticX-rayµCTimagedatathatweregeneratedto mimicthescanqualityandresolutionachievedbyexistingstate-of-thearthigh-resolutionX-rayµCTsystems.Syntheticimagesofunidirectionalandmulti-directionalmicrostructureswereusedtoassesssegmentationqualitybyevaluatingerrorsassociatedwithdetectingcentroidsandareasof fibercross-sections,aswellasorientations,lengths, andtotalnumberof fibersinatomographicimagestack.Finally,the effectivenessofthe fibersegmentationalgorithmwasdemonstratedby analyzingrealX-rayµCTdatacontainingthreedistinctnominal fiber orientations.
Thekey findingsresultingfromthisstudyinclude:
• SyntheticX-rayµCTimagescanbetailoredtoavarietyofimage resolutionsand fiberorientationsandareagoodanalogforreal tomographicimages.
• Theproposed fibersegmentationalgorithmisquiteaccurateinestimatingthenumber,3Dposition,andlengthof fibersinsynthetic imagestacks,especiallywhentheimageresolutionisgreaterthan9 pixelsperaverage fiberdiameter.
• Forallimageresolutionsconsidered,thesegmentationalgorithm exhibitsalargeandsystematicerrorinestimatingthetruecrosssectionalareaofindividual fibers.Thiserrorisrelatedtosimplificationsusedtogeneratesynthetictemplates,whichdonotaccount forbeam-hardeningartifactsoccurringontheperimeterofindividual fibersimagedusingX-rayCT.
• AftersegmentationandanalysisofbothsyntheticandrealX-rayCT imagedata,arequisiteimprovementtotheproposedalgorithmwas identified.Specifically,thesynthetic fiber-templatesusedin
templatematchingalgorithmmustbemodifiedtoincludeanadditionalphaseofpixel-intensities,whichforFPRsimagedusingX-ray CT,correspondstoartifactscausedbybeamhardening.Thismodificationisexpectedtodramaticallydecreasetheerrorassociated withestimating fibercross-sectionalareas,whichwasdeterminedto beequaltoorgreaterthan33%fortheresolutionsconsidered.
• BasedonsegmentationandanalysisofsyntheticX-rayCTimages,it wasobservedthattoobtainaccurateestimatesof fiberorientation andlength,theoverallvolumeofinterestshouldbeincreasedbyat leastone fiberdiameterinalldirections.Thisadditionalvolumecan beusedduringtemplatematchingand fibertrackingbutshouldbe discardedas “lower-quality” inthelaterstagesofanalysis(e.g., duringthegenerationof finiteelementmodels)
6.Dataavailability
Accesstothesyntheticimagedatausedinthisworkhasbeenmade availableusingthefollowingwebaddress:https://hdl.handle.net/ 11256/988.
DeclarationofCompetingInterest
Theauthorsdeclaredthatthereisnoconflictofinterest.
Acknowledgments
ThisworkwassupportedbytheNASALangleyResearchCenter InternalResearchandDevelopmentProgramandtheCenterInnovation FundsponsoredbytheNASASpaceTechnologyMissionDirectorate.
References
[1]Kalfon-CohenE,KoppR,FurtadoC,NiX,ArteiroA,BorstnarG,etal.Synergetic effectsofthinpliesandalignedcarbonnanotubeinterlaminarreinforcementin compositelaminates.ComposSciTechnol2018;166:160 –8. https://doi.org/10. 1016/j.compscitech.2018.01.007
[2]MaireE,WithersPJ.Quantitativex-raytomography.IntMaterRev2014;59:1–43. https://doi.org/10.1179/1743280413Y.0000000023
[3]WrightP,FuX,SinclairI,SpearingSM.Ultrahighresolutioncomputedtomography ofdamageinnotchedcarbon fiber epoxycomposites.JComposMater 2008;42:1993–2002. https://doi.org/10.1177/0021998308092211
[4]GarceaSC,WangY,WithersPJ.X-raycomputedtomographyofpolymercomposites.ComposSciTechnol2018;156:305–19. https://doi.org/10.1016/j. compscitech.2017.10.023
[5]ScottAE,MavrogordatoM,WrightP,SinclairI,SpearingSM.Insitu fibrefracture measurementincarbon-epoxylaminatesusinghighresolutioncomputedtomography.ComposSciTechnol2011;71:1471 –7. https://doi.org/10.1016/j. compscitech.2011.06.004
[6]GarceaSC,SinclairI,SpearingSM,WithersPJ.Mapping fibrefailureinsituin carbon fibrereinforcedpolymersbyfastsynchrotronx-raycomputedtomography. ComposSciTechnol2017;149:81–9. https://doi.org/10.1016/j.compscitech.2017. 06.006
[7]ClaySB,KnothPM.Experimentalresultsofquasi-statictestingforcalibrationand validationofcompositeprogressivedamageanalysismethods.JComposMater 2017;51:1333–53. https://doi.org/10.1177/0021998316658539
[8]ClaySB,KnothPM.Experimentalresultsoffatiguetestingforcalibrationandvalidationofcompositeprogressivedamageanalysismethods.JComposMater 2017;51:2083–100. https://doi.org/10.1177/0021998316670132 .
[9]BaleHA,HaboubA,MacdowellAA,NasiatkaJR,ParkinsonDY,CoxBN,etal.Realtimequantitativeimagingoffailureeventsinmaterialsunderloadattemperatures above1600°C.NatMater2013;12:40–6. https://doi.org/10.1038/nmat3497
[10]LarsonNM,ZokFW.In-situ3Dvisualizationofcompositemicrostructureduring polymer-to-ceramicconversion.ActaMater2018;144:579–89. https://doi.org/10. 1016/j.actamat.2017.10.054
[11]LarsonNM,CuellarC,ZokFW.X-raycomputedtomographyofmicrostructure evolutionduringmatriximpregnationandcuringinunidirectional fiberbeds. ComposPartAApplSciManuf2019;117:243–59. https://doi.org/10.1016/j. compositesa.2018.11.021
[12]FergusonJC,PaneraiF,LachaudJ,MansourNN.Theoreticalstudyonthemicroscaleoxidationofresin-infusedcarbonablators.CarbonNY2017;121:552–62. https://doi.org/10.1016/j.carbon.2017.06.013
[13]FergusonJC,PaneraiF,BornerA,MansourNN.PuMA:theporousmicrostructure analysissoftware.SoftX2018;7:81–7. https://doi.org/10.1016/j.softx.2018.03. 001
[14] TuegelEJ,IngraffeaAR,EasonTG,SpottswoodSM.Reengineeringaircraftstructurallifepredictionusingadigitaltwin.IntJAerospEng2011;2011:1–14. https://
doi.org/10.1155/2011/154798
[15]SencuRM,YangZ,WangYC,WithersPJ,RauC,ParsonA,etal.Generationof micro-scale finiteelementmodelsfromsynchrotronx-rayCTimagesformultidirectionalcarbon fibrereinforcedcomposites.ComposPartAApplSciManuf 2016;91:85–95. https://doi.org/10.1016/j.compositesa.2016.09.010
[16]CzabajMW,RiccioML,WhitacreWW.Numericalreconstructionofgraphite/epoxy compositemicrostructurebasedonsub-micronresolutionx-raycomputedtomography.ComposSciTechnol2014;105:174–82. https://doi.org/10.1016/j. compscitech.2014.10.017
[17]UshizimaDM,BaleHA,BethelEW,ErciusP,HelmsBA,KrishnanH,etal.IDEAL: imagesacrossdomains,experimentsalgorithmsandlearning.JOM 2016;68:2963–72. https://doi.org/10.1007/s11837-016-2098-4
[18]EmersonMJ,JespersenKM,DahlAB,ConradsenK,MikkelsenLP.Individual fibre segmentationfrom3DX-raycomputedtomographyforcharacterisingthe fibre orientationinunidirectionalcompositematerials.ComposPartAApplSciManuf 2017;97:83–92. https://doi.org/10.1016/j.compositesa.2016.12.028
[19]EmersonMJ,DahlVA,ConradsenK,MikkelsenLP,DahlAB.Statisticalvalidationof individual fibresegmentationfromtomogramsandmicroscopy.ComposSci Technol2018;160:208–15. https://doi.org/10.1016/j.compscitech.2018.03.027
[20]BrickerS,SimmonsJP,PrzybylaC,HardieR.Anomalydetectionofmicrostructural defectsincontinuous fiberreinforcedcomposites.IntSocOptPhotonics 2015:94010A. https://doi.org/10.1117/12.2079679
[21]SaneiSHR,BarsottiEJ,LeonhardtD,FertigRS.Characterization,syntheticgeneration,andstatisticalequivalenceofcompositemicrostructures.JComposMater 2017;51:1817–29. https://doi.org/10.1177/0021998316662133
[22]YuH,GuoD,YanZ,LiuW,SimmonsJ,PrzybylaCP,etal.Unsupervisedlearning forlarge-scale fiberdetectionandtrackinginmicroscopicmaterialimages.arXiv Prepr.arXiv1805.10256;2018.
[23]EberhardtCN,ClarkeAR.Automatedreconstructionofcurvilinear fibresfrom3D datasetsacquiredbyx-raymicrotomography.JMicrosc2002;206:41–53. https:// doi.org/10.1046/j.1365-2818.2002.01009.x
[24]RequenaG,FiedlerG,SeiserB,DegischerP,DiMichielM,BuslapsT.3DQuantificationofthedistributionofcontinuous fibresinunidirectionallyreinforced composites.ComposPartAApplSciManuf2009;40:152–63. https://doi.org/10. 1016/j.compositesa.2008.10.014
[25]ViguiéJ,LatilP,OrgéasL,DumontPJJ,RollandduRoscoatS,BlochJF,etal. Finding fibres andtheircontactswithin3Dimagesofdisordered fibrousmedia. ComposSciTechnol2013;89:202–10. https://doi.org/10.1016/j.compscitech. 2013.09.023
[26]Martín-HerreroJ,GermainC.Microstructurereconstructionof fibrousC/CcompositesfromX-raymicrotomography.CarbonNY2007;45:1242–53. https://doi. org/10.1016/j.carbon.2007.01.021
[27] MoonTK.Theexpectation-maximizationalgorithm.IEEESigProcMag 1996:47–60.
[28] BlackmanSS,PopoliRF.DesignandAnalysisofModernTrackingSystems.Artech House;1999
[29]KalmanRE.Anewapproachtolinear filteringandpredictionproblems.JBasicEng 1960;82(1):35–45. https://doi.org/10.1115/1.3662552
[30]MunkresJ.Algorithmfortheassignmentandtransportationproblems.JSocInd ApplMath1957;5:32–8. https://doi.org/10.1137/010500
[31] Bar-ShalomY,LiY,KirubarajanXR.EstimationwithApplicationtoTrackingand Navigation.JohnWileyandSons;2001
[32]MorefieldCL.Applicationof0–1integerprogrammingtomultitargettracking problems.IEEETransAutomatContr1977;22:302–12. https://doi.org/10.1109/ TAC.1977.1101500
[33] KarpRM.Reducibilityamongcombinatorialproblems.Springer;1972.p.85–103
[34]PooreAB,RijavecN,LigginsM,VannicolaVC.Dataassociationproblemsposedas multidimensionalassignmentproblems:problemformulation.OptEngPhotAerosp Sens1993;1954:552–64. https://doi.org/10.1117/12.157786
[35]DebS,YeddanapudiM,PattipaiiK,Bar-ShalomY.AgeneralizedS-Dassignment algorithmformultisensor-multitargetstateestimation.IEEETransAerospElectron Syst1997;33:523–38. https://doi.org/10.1109/7.575891
[36]PattipatiKR,DebS,Bar-ShalomY,WashburnRB.Anewrelaxationalgorithmand passivesensordataassociation.IEEETransAutomatContr1992;37:198–213. https://doi.org/10.1109/9.121621
[37]CastañónG,FinnL.Multi-targettrackletstitchingthroughnetwork flows.2011 Aerosp.Conf.,IEEE;2011. https://10.1109/AERO.2011.5747436
[38] MoriS,ChongC.Performanceanalysisofgraph-basedtrackstitching.16thInt. Conf.Inf.Fusion,IEEE2013.
[39]vanderMerweLJ,deVilliersJP.Track-stitchingusinggraphicalmodelsand messagepassIng.Int.Conf.Inf.Fusion,2013,IEEE;2013.
[40]JulierSJ,LaViolaJJ.OnKalman filteringwithnonlinearequalityconstraints. SignalProcessIEEETrans2007;55:2774–84. https://doi.org/10.1109/TSP.2007. 893949
[41] Hexcel.HexTow ® IM7CarbonFiberDataSheet,2018;1–2. http://www.hexcel. com
[42]Hexcel.HexTow ® AS4CarbonFiberData.Sheet,2018;1–2. http://www.hexcel. com
[43]WongstoA,LiS.MicromechanicalFEanalysisofUD fibre-reinforcedcomposites with fibresdistributedatrandomoverthetransversecross-section.ComposPartA ApplSciManuf2005. https://doi.org/10.1016/j.compositesa.2005.01.010
[44]SchindelinJ,Arganda-CarrerasI,FriseE,KaynigV,LongairM,PietzschT,etal.Fiji: anopensourceplatformforbiologicalimageanalysis.NatMeth2012;9:676–82. https://doi.org/10.1038/nmeth.2019.Fiji
[45]BarrettJF,KeatN.ArtifactsinCT:recognitionandavoidance.RadioGraphics 2004;24:1679–91. https://doi.org/10.1148/rg.246045065
Another random document with no related content on Scribd:
Et son âme s’envola dans la gloire de Dieu.
Hilarem datorem, celui qui se donne en riant, c’est ainsi que l’Église qualifie saint Laurent dans l’office qu’elle lui a consacré.
Ah ! me disais-je, durant la bienheureuse octave où à toutes les heures de la journée, je gardais présente l’image du martyr sur son gril, avec quel rire reconnaissant, mon Dieu, je devrais recevoir les épreuves qu’il vous plaît de m’envoyer pour mon plus grand bien. Saint Laurent obtenez-moi cette grâce !…
Or, il me l’obtint. Et c’est pourquoi je pus reprendre ma croix et la trouver plus légère.
Je vous le demande : comment au souvenir de cette radieuse semaine, ne vouerais-je pas mon affection et mon entière gratitude au Saint qui m’assista de la sorte ?
Saint Pierre crucifié la tête en bas, saint Paul décapité, saint André crucifié et écartelé, saint Jacques le Majeur décapité, saint Jean l’Évangéliste plongé dans l’huile bouillante, saint Thomas lapidé, saint Jacques le Mineur assommé, saint Philippe crucifié et lapidé, saint Barthélemy écorché vif, saint Mathieu percé de la lance, saint Simon et saint Thaddée sciés par le milieu du corps, saint Lin décapité, saint Clet décapité, saint Clément décapité, saint Xyste décapité, saint Corneille décapité, saint Cyprien décapité, saint Laurent brûlé vif, saint Chrysogone décapité, saints Jean et Paul, les jumeaux, décapités, saints Côme et Damien décapités… Je vois cette troupe glorieuse et funèbre se ranger à la gauche du célébrant qui se recueille pour la Consécration ; je vois leurs mains sanglantes offrir à l’Hostie les instruments de leur supplice…
Un peu plus tard, quand le Paterva être récité, d’autres martyrs les rejoindront, qui se placeront à la droite du prêtre : saint JeanBaptiste le Précurseur décapité, saint Étienne lapidé, saint Mathias décapité, saint Barnabé décapité, saint Ignace déchiré par les bêtes du cirque, saint Alexandre décapité, saint Marcellin décapité, saint Pierre l’exorciste décapité, sainte Félicité et sainte Perpétue
massacrées, sainte Agathe brûlée vive, sainte Lucie égorgée, sainte Agnès égorgée, sainte Cécile saignée à mort, sainte Anastasie brûlée vive…
Ces témoins de la Vérité unique ont vaincu, ont triomphé des lâchetés de la chair et des embûches du Démon pour que nous, catholiques d’aujourd’hui, nous soyons mis à même de participer au sacrifice de Jésus-Christ par leurs mérites. Si nous assistons paisiblement à la Messe, c’est aux tortures qu’ils subirent sans défaillance que nous en sommes redevables. C’est de leur sang que l’Église est cimentée. C’est leur haleine qui en vivifie l’atmosphère chaque fois que la nonchalance de nos âmes médiocres la rend toute stagnante. Dans l’union solidaire que nous formons avec eux, leur part est énorme ; la nôtre bien minime.
Mais sans ce privilège que nous confère la communion des Saints saurions-nous, s’il le fallait, remplir les devoirs formidables qu’il peut impliquer un jour ?
Question angoissante et que je me suis souvent posée. Je me disais : — Imagine que, demain, les ennemis de l’Église deviennent nos maîtres, qu’ils édictent des lois et des décrets qui t’ordonneront de renier Jésus sous peine de mort. J’admets que, d’un premier mouvement, tu refusas l’apostasie. Mais on t’emprisonne ; et tu ne tardes pas à comparaître devant un tribunal d’athées en fureur qui te condamneront, sans délai ni appel, parce que son fanatisme matérialiste lui présente ta fidélité à Jésus comme un crime irrémissible. La sentence prononcée, tu es reconduit dans ton cachot et tu y restes seul avec cette pensée : dans quelques heures le bourreau me coupera la tête.
Es-tu bien sûr qu’alors tu n’appelleras pas le geôlier pour lui demander s’il n’existe pas des moyens d’échapper au supplice ?
— Il n’y en a qu’un, répondra-t-il, renonce à ton Dieu.
Auras-tu le courage de repousser la tentation ? Ne mendieras-tu pas une audience de tes juges pour sauver ton cher corps en perdant ton âme ? Et si l’on te présente un Crucifix, ne le repousseras-tu pas en t’écriant : « Je ne connais plus cet homme ? »
Je dis que le chrétien qui n’a pas évoqué cette possibilité en tremblant, au moins une fois dans sa vie, fait preuve d’une confiance excessive en lui-même. Je dis que si la persécution sanglante revenait, il risquerait d’apostasier sur une simple menace d’arrestation.
Certains objectent : — Mais la persécution sanglante ne reviendra jamais. La dureté, la cruauté du paganisme antique n’existent plus. L’état de civilisation où nous sommes parvenus nous garantit du retour d’abominations pareilles.
Fragile assurance ! Il est vrai que la société actuelle, si régie qu’elle soit par une fringale de basses jouissances et par la négation des droits de Dieu sur l’humanité, garde encore quelques traces de l’adoucissement des mœurs qu’elle doit à des siècles de christianisme. Encore ne faut-il pas exagérer sa mansuétude car il n’y a pas si longtemps que sa mère la Révolution satanique tenta de détruire l’Église par la guillotine. Mais que, demain, un bouleversement social se produise. Je vous certifie que ceux qui le provoqueront brûleront d’une haine farouche contre Dieu et son Église et qu’ils mettront en pièces les fidèles avec autant de férocité — sinon plus — que ne le firent jadis les païens.
Et qui sait si ce temps n’est pas tout proche ? Qui sait si l’astre noir de l’Antechrist ne se lèvera pas bientôt à l’horizon trouble de l’avenir ?
Jésus a dit : « Decejouretde cetteheure, nulne saitrien,pas mêmelesangesmaisDieuseul. »
Et alors, ajoute saint Paul, « l’amourdeDieuserefroidirachezun grandnombre ».
Bien des signes donnent à présumer que ce soir du monde approche.
Ce n’est donc pas sans raison que je demande aux Saints martyrs qui se pressent devant l’autel de me venir en aide le jour, peut-être prochain, où il me faudrait rendre témoignage à Jésus sous le glaive.
Leur exemple me fortifie. Les sachant près de moi, je me sens étroitement solidaire de leurs souffrances et de leur héroïsme. Contemplant leurs plaies je me sens aussi un peu moins indigne de m’offrir avec l’Hostie. Et, d’un cœur sans réticences, j’articule l’admirable prière qui précède immédiatement la Consécration :
Daigne,ômon Dieufairequ’entouteschoses,cetteoblationsoit bénie, légitime, valable, fondée en raison et acceptable par ta miséricorde,en sortequ’elledevienne,pour notresalut,leCorpset leSangdetonFilstrèsaimé,NotreSeigneurJésus-Christ.
Bénie, elle le sera, si je n’ai pas abusé des grâces qui me furent départies avec surabondance malgré l’insuffisance de mon zèle.
Légitime, elle le sera, si j’ai la conviction absolue que le fait de sa perpétuité dans l’Église correspond à l’ordre établi par Jésus lorsqu’il institua la Cène.
Valableetraisonnable, elle le sera parce que c’est l’Agneau vivant de Dieu, Dieu lui-même, c’est-à-dire la Raison et la Sagesse incréées qui vont être immolées tout à l’heure.
Si je comprends la responsabilité que j’assume en prononçant, avec le célébrant, ces paroles, si, par elles, je m’associe aux Martyrs qui moururent pour la gloire du Mystère d’amour qu’elles commémorent, « j’aurai part à la divinité de Celui qui a daigné se revêtirdenotrehumanité ».