28. ANSI Square and Hexagon Machine Screw Nuts and Flat Head Machine Screws, A-38
29. ANSI Slotted Flat Countersunk Head Cap Screws, A-39
30. ANSI Slotted Round and Fillester Head Cap Screws, A-39
31. Drill and Counterbore Sizes for Socket Head Cap Screw, A-40
32. ANSI Hexagon and Spline Socket Head Cap Screws, A-40
33. ANSI Hexagon Socket Head Shoulder Screws, A-41
34. Drill and Counterbore Sizes for Metric Socket Head Cap Screws, A-41
35. ANSI Socket Head Cap Screws—Metric Series, A-42
36. ANSI Metric Hex Bolts, A-42
37. ANSI Metric Hex Cap Screws, A-43
38. ANSI Hex and Hex Flange Head Metric Machine Screws, A-44
39. ANSI Slotted Flat Head Metric Machine Screws, A-45
40. ANSI Slotted Headless Set Screws, A-46
41. ANSI Hexagon and Spline Socket Set Screws, A-46
42. ANSI Hexagon and Spline Socket Set Screw Optional Cup Points, A-47
43. ANSI Square Head Set Screws, A-48
44. ANSI Taper Pipe Threads (NPT), A-49
45. ANSI Metric Plain Washers, A-50
46. ANSI Type A Plain Washers—Preferred Sizes, A-51
47. ANSI Type A Plain Washers—Additional Selected Sizes, A-51
48. ANSI Type B Plain Washers, A-52
49. A NSI Helical Spring Lock Washers, A-53
50. ANSI Internal and External Tooth Lock Washers, A-53
51. ANSI Keyseat Dimensions for Woodruff Keys, A-54
52. ANSI Standard Woodruff Keys, A-55
53. Key Size versus Shaft Diameter—Key Size and Keyway Depth, A-56
54. ANSI Standard Plain and Gib Head Keys, A-56
55. ANSI Chamfered, Square End, and Taper Pins, A-57
56. British Standard Parallel Steel Dowel Pins— Metric Series, A-58
57. ANSI Cotter and Clevis Pins, A-59
58. Piping Symbols, A-60–A-61
59. Electronic Symbols, A-62–A-63
60. Welding Symbols, A-64
INDEX, I-1–I-12
Preface
To the authors of this text, teaching graphics is not a job; it is a “life mission.” We feel that teaching is an important profession and that the education of our engineers and technologists is critical to the future of our country. Further, we believe that technical graphics is an essential, fundamental part of an engineer and technologist’s education. We also believe that many topics in technical graphics and the visualization process can be very difficult for some students to understand and learn. For these and other reasons, we have developed this text, which addresses both traditional and modern elements of technical graphics, using what we believe to be an interesting and straightforward approach.
Engineering and technical graphics have gone through significant changes as a direct result of the use of computers and CAD software. Although these changes are important to the subject of technical graphics, there is much about the curriculum that has not changed. Engineers and technologists still find it necessary to communicate and interpret designs, using graphics methods such as drawings or computer models. As powerful as today’s computers and CAD software have become, they are of little use to engineers and technologists who do not fully understand fundamental graphics principles and 3-D modeling strategies or do not possess high-level visualization skills.
communicated and produced. The text concentrates on the concepts and skills necessary to use both hand tools and 2-D or 3-D CAD. The primary goals of the text are to show how to
1. Clearly represent mental images.
This graphics text is therefore based on the premise that there must be some fundamental changes in the content and process of graphics instruction. Although many graphics concepts remain the same, the fields of engineering and technical graphics are in a transition phase from hand tools to the computer, and the emphasis of instruction is changing from drafter to 3-D geometric modeler, using computers instead of paper and pencil.
Goals of the Text
This text was written to help the engineering and technology student learn the techniques and standard practices of technical graphics so that design ideas can be adequately
2. Graphically represent technical designs, using accepted standard practices.
3. Use plane and solid geometric forms to create and communicate design solutions.
4. Analyze graphics models, using descriptive and spatial geometry.
5. Solve technical design problems, using traditional tools or CAD.
6. Communicate graphically, using sketches, traditional tools, and CAD.
7. Apply technical graphics principles to many engineering disciplines.
The authors of this text have gone to great lengths to truly integrate traditional and modern engineering design graphics theory and practice into a single text.
Features of the Fourth Edition
Much thought has gone into designing a complete instructional approach to teaching and learning of technical graphics. The instructor is provided with a number of tools to assist in the instruction aspects, and the student is provided with tools to assist in the learning process. This text was specifically written using techniques that will prepare students to use technical graphics concepts, practices, and modern tools, to solve design problems and communicate graphically. One goal was to provide to the students a textbook that was clear, interesting, relevant, and contemporary.
Some of the distinguishing features of this text include the following:
1. New Feature Supplemental Solid Modeling Exercises —A series of new problems focusing on 3-D solid modeling for parts and assemblies have been developed and are included in a special section at the ends of Chapter 10 Multiview Drawing, Chapter 13 Auxiliary Views, Chapter 16 Section Views, and Chapter 20 Working and Assembly Drawings. Visual examples for each part and assembly have been created with various solid modeling software packages and are included with engineering sketches to aid students in visualizing part geometry and the modeling process. In addition to supplementing traditional subjects in each of the chapters, these problems also provide a logical extension to the chapter on 3D Modeling by furnishing students a new series of software independent solid modeling exercises that may be modeled with any of the popular parametric based solid modeling software packages currently in use. In addition to 3-D solid modeling experience, it is also intended that these problems may serve as a basis for students to; 1) explore basic property analysis of solid models, 2) develop variable parametric models based on design intent, 3) generate detail and working assembly documentation drawings, 4) create intelligent spread sheet driven bills of material for managing the product development process and 5) explore methods of relational bottom up and top down assembly modeling.
2. Design Problems —The new design problems in Chapter 3 were developed to provide students an opportunity to exercise the various stages of the design process outlined in this chapter. They provide an ideation stage, a decision-making stage,
design creation stage, and a documentation stage. Each problem includes provisions for sketching, 3D modeling, and documentation of the student’s final solution to the problem. In addition, the problems were deliberately designed in an openended fashion to promote creativity in the solution process, and to provide a context in which the student can work to develop a 3D model that addresses the required criteria.
3. Integration of CAD —CAD concepts and practices have been integrated through all the chapters when they are relevant to the topic. They are not simply “tacked onto” the end of a chapter.
4. Visualization chapter (chapter 5)—This unique chapter, devoted exclusively to visualization, assists the student in understanding the concepts and importance of visualization and offers techniques for reading and visualizing engineering drawings.
5. 3-D modeling chapter (chapter 9)—This unique chapter is devoted exclusively to the theory and practice of 3-D modeling with an emphasis in constraint-based CAD.
6. Modern topics—The book is filled with modern examples, illustrations, and industry examples so students can relate to the material being presented and get excited about the subject.
7. Integration of design —Design concepts are integrated through the text to give relevance and understanding of the relationship of design to technical graphics. This is visually reinforced throughout the text through the use of an icon located in the margin of the text whenever a design concept is covered. The icon is a smaller version of the Concurrent Engineering Design Process figure first introduced in Chapter 2. Figure 2.8 breaks design into three major components: ideation, refinement, and implementation. Whenever one of these topics is discussed in the text, a smaller version of Figure 2.8 is placed in the margin with ideation, refinement, or implementation highlighted. This lets the student know that the topic being covered is relevant to the engineering design process and constantly reinforces design as the underlying theme for engineering and technical graphics.
Ideation Refinement Implementation
Coverage of Modern Topics
One of the primary reasons we wrote the text is that many modern topics are either not found or not covered in sufficient detail in traditional texts. Examples of contemporary topics covered in this book include:
Computer simulation
Human factors
Product data management (PDM)
Virtual reality (VR)
NURBS
Data exchange standards
3-D modeling problems
3-D modeling concepts and practices
Extensive Coverage of Traditional Topics
Even though we firmly believe our coverage results in the most modern text available, we have been very careful to include all the traditional topics normally found in a technical drawing textbook. The authors fully understand that students must learn the fundamentals whether using hand tools or CAD to communicate graphically. Therefore, coverage of traditional topics is comprehensive and in many cases includes step-by-step procedures and enhanced color illustrations to facilitate teaching and learning. The text includes the latest ANSI standard practices used in industry.
Chapter Overviews and Features
Every chapter has been carefully planned and written with a consistent writing, illustration, design style, and pedagogy. The book was written as a part of a more global instructional approach to engineering and technical graphics and will serve as a starting point for instructor and student.
To accomplish these goals, the text is divided into 4 parts and 25 chapters. Each part has a brief introduction with a listing of chapters in the part so the instructor and student understand the logical sequencing of topics and chapters. Each chapter has a logical sequence and organization that is easily navigated. Each chapter contains these features:
Relevant Quotes Each chapter opens with a quote that is releva nt to the chapter material being covered or the topic of graphics in general. These quotes, many by famous historical figures, reinforce the importance of graphics in industry and society.
Objectives Each chapter has a list of measurable objectives t hat can be used as a guide when studying the material presented in the text. Instructors can also use the objectives as a guide when writing tests and quizzes.
Introduction A brief overview of the chapter contents prepares the student for the material to be presented. The introduction sets the stage for the relevancy and importance of the material to be covered for the engineer or technologist. The introduction includes a rationale explaining why it is important to learn the material in the chapter.
Color Is Important in a Modern Engineering and Technical Graphics Textbook This was the fi rst technical graphics textbook to use four-color illustrations throughout to better present the material and improve learning. The selection and use of color in the text is consistent to enhance learning and teaching. Many of the color illustrations are also available to the instructor in the image library found in the Instructor Resources to supplement lectures, as explained in detail later in this Preface.
The use of color in the text was done specifically to enhance teaching, learning, and visualization. Workplanes are represented as a light pink (Figure 9.30). Projection and picture planes are a light purple color (Figure 10.10). Important information in a figure is shown in red to highlight the feature and draw the attention of the reader (Figure 8.6). Color shading is often used on pictorial illus-
Figure 9.30
Types of linear sweeping operations In some systems, linear sweeps are restricted to being perpendicular to the workplane.
Figure 10.10
trations so the user can better visualize the 3-dimensional form of the object (Figure 10.43). This is especially important for most students who are being asked to use their visual mode to think and create. Color shading highlights important features, more clearly shows different sides of objects, and adds more realism to the object being viewed. 0,0,0
Frequently, different shades of color are used on objects to highlight various features, improve visualization of objects, and better describe them (Figure 8.48). Different shades of color are also used on a single object to highlight surface features, which is useful especially when trying to draw attention to certain features, such as holes, oblique planes, and surfaces to be projected onto a picture plane. Some texts use two colors, which are adequate for some illustrations, but our research with students clearly
demonstrates that having the ability to display objects and text illustrations in many different colors provides a considerable advantage when teaching engineering and technical graphics. Effective use of color improves the pedagogy and can greatly enhance an instructor’s lecture and ability to teach complicated or hard to understand concepts. Being limited to one or two colors as in other texts is an unnecessary obstacle to effective teaching and learning.
Photographs and screen captures are much more interesting and show much more detail when in color (Figure 3.40). In some aspects of engineering design, such as
Figure 8.6
Display of coordinate axes in a multiview CAD drawing
Only two of the three coordinates can be seen in each view.
Figure 10.43
Most descriptive views
Select those views which are the most descriptive and have the fewest hidden lines. In this example, the right side view has fewer hidden lines than the left side view.
Figure 8.48
Constructing an ogee curve between two parallel lines
Figure 3.40
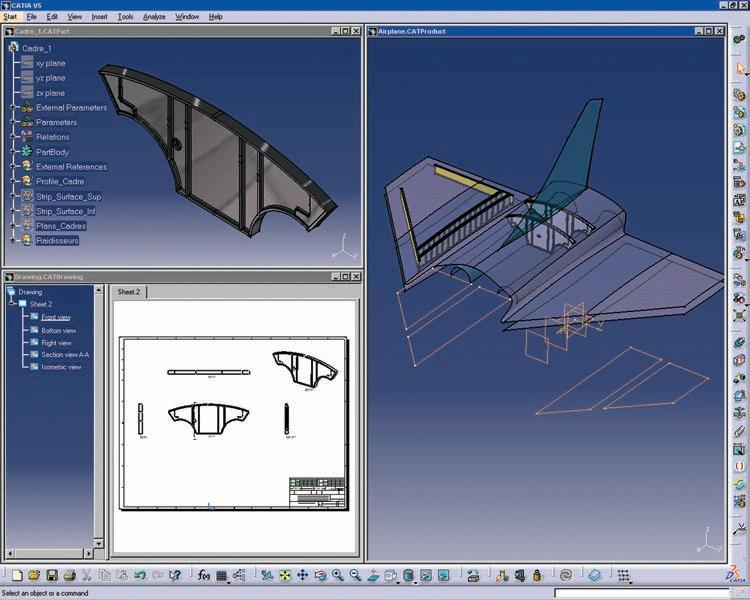
Production drawing
A production drawing showing views of a welded body part. (Courtesy of Dassault Systemes.)
finite element analysis, color is the method used to communicate or highlight areas of stress or temperature. Showing a black and white illustration to explain finite element analysis is just short of being useless. CAD systems are capable of displaying millions of colors and can create photographic realistic models of designs and assemblies. Full-color illustrations in engineering and technical graphics are prerequisite for a modern text.
Practice Exercises A unique feature of the text is the use of practice exercises, which cause the student to pause and actively engage in some activity that immediately reinforces their learning. For example, Practice Exercise 7.1 in Chapter 7, “Sketching and Text,” asks the student to find a few familiar objects and begin making isometric sketches.
Step-by-Step Illustrated Procedures Most chapters include many drawing examples that use step-by-step procedures with illustrations to demonstrate how to create graphics
elements or to solve problems. These step-by-step procedures show the student in simple terms how a drawing is produced. Most of the illustrations accompanying the stepby-step procedures are in multiple parts so the student can see how the drawing is created. In many cases the color red is used in each step of the illustration to show what is being added or created.
Integration of CAD Every chapter includes specific references to CAD rather than simply adding them to the end of the chapter. By integrating the references in the text, the student learns how CAD is used in the context of the topic being explained. In some cases whole sections or chapters deal with CAD topics. For example, Chapter 9, “ThreeDimensional Modeling,” covers the use of CAD to create 3-D models. Students begin to understand that CAD is another tool used by the engineer and technologist to communicate. Traditional topics and CAD topics are seamlessly integrated because the text was written that way from the outset. CAD is not an add-on or afterthought. It is fully integrated and embraced as a means of creating graphics for engineers and technologists (Figure 10.35).
Historical Highlights Many of the chapters include information about important events and people in the history of graphics. This is an extension of the history of graphics fi rst introduced to the students in Chapter 1. Historical Highlights are presented as a special boxed feature that contains an overview of the person or event along with photographs and drawings. They are used as a means of giving the student an historical context to graphics.
Figure 7.21
Figure 7.36 Isometric sketches of common objects
Figure 10.35
Predefi ned multiviews on a CAD system
Dream High Tech Jobs This feature is included in many chapters a nd describes interesting jobs that are available to engineers and technologists who have mastered technical communications.
Design in Industry Most chapters includes a special feature covering some aspect of design as practiced in industry. This Design in Industry feature covers design in many types of industries so that students with varied engineering interests can see how design is used to solve problems. Many feature quotes from engineers working in industry explaining how they solved problems or used CAD tools to enhance the design process. All the Design in Industry items include figures to supplement the information presented.
Highlighting Key Terms Important terms are highlighted in each chapter with bold or italicized text. All boldfaced terms are included in the extensive glossary found at the end of the text for easy reference. Italicized text draws the attention of the reader to highlighted important terms or phrases.
Summary Each chapter ends with a summary as a means to pull everything covered in the chapter together for the student. The summary is a brief overview of the most important topics covered in the chapter. In some cases, the summary also includes important information listed in tables or bulleted lists.
Questions for Review Each chapter includes an extensive list of questions for review. Included are questions meant to measure whether students learned the objective listed at the start of each chapter. Other questions are used to reinforce the most important information presented in the chapter. The types of questions used require students to answer through writing or through sketching and drawing.
Further Reading Many of the chapters include a list of books or a rticles from periodicals relevant to the content covered in the text. The Further Reading list can be useful for the instructor to find additional information about a topic.
Problems Every chapter in the text includes an extensive number a nd variety of problem assignments. Most chapters include text-based problems that describe a problem to solve or drawing to create. Most chapters include problems with figures that students are to solve or replicate using traditional tools and CAD. The figure-based problems are very extensive and range from the very simple to complex. This arrangement allows the instructor to carefully increase the complexity of the problems as students learn and progress. The most complex drawings can be used to supplement assignments given to the most talented students or for group-based projects.
Most of the problems are of real parts made of plastic or light metals, materials commonly found in industry today. There are many examples of unique problems that
are not found in other textbooks. For example, many of the problems in Chapters 5 and 9 are not found in other engineering and technical graphics texts. These problems reinforce student learning and give them experience that will be of great value in industry.
The wide range and numerous problems allow the instructor to frequently change assignments so that fresh problems are used from semester to semester. Additional problems are available on the website and through our workbooks.
Classic Problems Many chapters include Classic Problems, which are additional problems that can be assigned. They have been taken from the seminal technical graphics textbooks by Thomas E. French, published by McGrawHill. Many of the problems are castings with machined surfaces giving the student experience with additional materials and machining processes.
tion is the only useful method of describing design and the power of graphics over the written or spoken word.
■ Chapter 2, “The Engineering Design Process,” was significantly changed for the 3rd and 4th editions. Much of the original content was moved to a new Chapter 3, and new material was added. Chapter 2 is a brief introduction to traditional and modern technical design methodologies with more emphasis on concurrent engineering and product lifecycle management. One unique aspect of this chapter is the explanation of the modern practices used in engineering design, in which engineers interact and communicate with other professionals in the company.
■ Chapter 3, “Design in Industry,” is an in-depth overview of modern engineering design practice in industry. Before the 4th edition this was chapter 4. It was moved adjacent to Chapter 2 to provide a more comprehensive view of the processes and artifacts of the technical graphics processes as utilized in industry. Engineering design is explained in context with 3-D CAD modeling and the sharing of design information across the enterprise. The design process is covered in detail and includes important topics, such as ideation, the designer’s notebook, computer simulation, design analysis, and design review meetings.
Part 1
Global Implementation for Technical Graphics
This section contains four chapters that introduce the student to engineering design graphics. It includes an explanation of the importance of graphics instruction for engineers and technologists, has a brief overview of the engineering design process, explains the tools used to communicate graphically, and shows how to create simple sketches.
■ Chapter 1, “Introduction to Graphics Communications,” explains the role and importance of graphics communications in engineering design. The concept of visualization is fi rst introduced to the student so they can begin to relate its importance to design graphics. There is a strong emphasis on communications so students begin to understand that graphics is a powerful form of human communications. One unique feature of the chapter is Practice Exercise 1.1, which shows through a simple exercise why graphics communica-
■ Chapter 4, “The Role of Technical Graphics in Production Automation and Manufacturing Processes,” is an introduction to modern manufacturing and production processes. The chapter explains in contemporary terms the general manufacturing and production process and its relationship to technical design and drawing, including 3-D models. In addition, quality management, automation, and design for manufacturability (DFM) are explained.
Part 2 Fundamentals of Technical Graphics
This part explains visualization in the context of engineering design and shows students how to construct 2-D and 3-D geometry and create multiview and pictorial technical drawings.
■ Chapter 5, “Design Visualization,” is a unique chapter aimed at helping students improve their visualization abilities, which are fundamental to understanding and creating technical graphics. This chapter is unlike anything found in other technical graphics texts. The chapter briefly explains the human visual systems so students understand the complexity and power of human visualization.
Figure 10.156
rest
The chapter quickly moves into the very basics of visualization as it related to engineering design graphics. The nomenclature and techniques used to describe objects are explained in detail so students understand the language of engineering and technical graphics. This leads into extensive coverage of the visualization techniques employed for technical drawings, such as image planes and orientation. Students get their first introduction into inclined, normal, and oblique lines and planes.
Integrated into the chapter is information about data visualization and the use of graphs and charts to describe and visualize engineering data. Another unique feature of this chapter is the extensive coverage of VR in Section 5.8, “Virtual Reality and Visualization.”
■ Chapter 6, “Technical Drawing Tools,” is an introduction to the traditional and modern tools used to create sketches, drawings, and computer models. Traditional tools are described, with step-by-step instructions on how to use them. The instructions also cover how CAD is used to supplement traditional tools. This is the fi rst chapter employing one of the major features of this text: step-by-step instructions.
■ Chapter 7, “Sketching and Text,” is an introduction to the creation of sketches and their use to support the design process. Traditional sketching tools are described, along with important sketching techniques. Step-bystep procedures guide the student through simple sketching activities.
The additional sketching techniques are similar to those found in the classic text, Drawing on the Right Side of the Brain by Betty Edwards, and includes contour sketching, negative space sketching, and upsidedown sketching. All of these techniques can dramatically improve a person’s ability to make sketches.
■ In Chapter 8, “Engineering Geometry and Construction,” the student is shown how to create and edit 2-D geometry, using both traditional tools and CAD. More advanced technical geometry that can be created with 3-D CAD is also introduced. This chapter includes an extensive explanation of coordinate space which is especially useful for 3-D CAD. Another unique aspect of this chapter is the extensive coverage of geometric principles, such as parallelism, intersections, tangencies, and comprehensive coverage of 2-D and 2-D geometry.
■ Chapter 9, “Three-Dimensional Modeling,” is an extensive coverage of 3-D modeling theory, techniques, and applications. The chapter shows how computers are used to create all types of 3-D models, using various construction techniques. Coverage includes wire-
frame, surface, and solid modeling, constraint modeling, constructive solid geometry modeling CSG, and boundary representation modeling. Feature analysis is explained so students begin to understand design intent which is so important when concerned with modern engineering design. A section on feature definition explains how to build models using various features defined by the user. Virtually every method and technique used to create 3-D models with CAD is covered in the chapter, giving the student the understanding necessary to use any 3-D modeling system. Chapter 9 has more modern topic coverage, including more material on constraint-based modeling.
■ Chapter 10, “Multiview Drawings,” introduces standard multiview drawings for technical design and production. The chapter begins by explaining projection theory in general and multiview projections in particular. Standards and conventional practices for multiview drawings are then introduced. Integrated into the chapter are explanations and the use of illustration to assist the learner in visualizing the principles of orthographic projection. These visualization techniques provide a solid foundation and understanding of orthographic projection and how it relates to creating multiview drawings.
■ Chapter 11, “Axonometric and Oblique Drawings,” is an introduction to such drawings and contains an in-depth discussion of pictorial projections and drawings, building on the material covered in Chapter 7, “Sketching and Text.” Through step-by-step instructions, the student is shown how to create pictorial drawings, using traditional instruments or CAD. This chapter also goes to great lengths to explain the theory and technique of axonometric and oblique drawings so students understand at a very fundamental level how these projection techniques are created.
■ Chapter 12, “Perspective Drawings,” is an introduction to perspective projection and drawings. This chapter again builds on the information presented in Chapter 7, “Sketching and Text.” Step-by-step instructions describe how to create one- and two-point perspective drawings. Extensive background material is provided so students understand the concepts underlying perspective projections.
■ Chapter 13, “Auxiliary Views,” introduces the theory of auxiliary views and the techniques for drawing them. The fold-line and reference plane methods are explained using step-by-step instructions. Auxiliary view techniques are then applied to the solutions of problems concerning reverse construction, views in a spec-
ified direction, dihedral angles, and the true size of an oblique plane.
Part 3
Descriptive Geometry
Part 3 is a basic introduction to the theory and practice of descriptive geometry, intersections and developments.
■ Chapter 14, “Fundamentals of Descriptive Geometry,” is an introduction to the application of descriptive geometry to the solution of spatial problems. There is extensive coverage of the underlying concepts and projection theory related to auxiliary views. One unique feature of this chapter is the five principles of descriptive geometry, which summarize the important concepts in the solution of spatial geometry problems. Another feature is the list of tips and axioms useful in solving such problems.
■ Chapter 15, “Intersections and Developments,” introduces two concepts: (1) the intersections between geometric forms and (2) 3-D geometric developments. The chapter presents the standards and techniques for drawing these important elements through detailed step-by-step illustrated procedures. One unique aspect of the illustrations used in the step-by-step procedures includes 3-D pictorial color illustrations of the intersecting objects, making it easier for the student to visualize the problem being solved.
Part 4
Standard Technical Graphics Practices
Part 4 includes ten chapters which describe the standard practices commonly used to create technical drawings to support the engineering design process. In this part students learn how to create section views, dimension and tolerance a drawing, and represent fasteners on drawings. Modern manufacturing practices are covered as well as working drawings.
■ Chapter 16, “Section Views,” is an introduction to the techniques and standards used to create all types of section views. One important concept is section view visualization, which is explained early in the chapter. Each section view type is examined in terms of its visualization, the applicable standards practices, and the techniques useful in its construction. A Summary of Important Practices is included at the end of this chapter to assist the student in making section views.
■ Chapter 17, “Dimensioning and Tolerancing Practices,” introduces the techniques and standards for adding dimensions to technical drawings. There is extensive coverage of standard practices used for nearly any feature found on drawings, and they are explained using illustrations which sometimes include color rendered pictorial views useful in visualizing the dimensioning or tolerancing concept being explained. The need for tolerancing is discussed in great detail so that the student will understand and appreciate the importance of tolerancing in technical design. The summary includes two tables that condense important dimensioning and tolerancing information useful for students in developing their own technical drawings.
■ Chapter 18, “Geometric Dimensioning and Tolerancing Basics,” introduces the standards, techniques, and practices associated with ASME Y14.5M-1994 standard geometric dimensioning and tolerancing. The chapter explains each type of geometric dimension, how it is measured, and how its associated symbols are used in technical drawings. There is extensive use of illustrations with rendered pictorial views of the principle being explained.
■ Chapter 19, “Fastening Devices and Methods,” introduces the student to various types of fasteners and their representation on technical drawings. Step-by-step procedures demonstrate how to read a thread table, create simplified and schematic internal and external thread forms, and draw bolts and springs. One unique feature of this chapter is the many references to the Machinery Handbook to familiarize students with this important guide to information on fasteners. Another is the very detailed explanation of how to read an ANSI standard thread table.
■ Chapter 20, “Working Drawings,” describes how to create a standard set of drawings that specify the manufacture and assembly of a product based on its design. All of the important features of a set of working drawings are described and illustrated, along with engineering change orders (ECO) and reprographic practices, including digital technologies.
■ Chapter 21, “Technical Data Presentation,” describes how to create technical illustrations and represent data using both traditional techniques and computers. The chapter covers such modern illustration techniques as color theory, lighting, animation, and multimedia. Students learn the basic concepts used to represent data graphically followed by examples of charts and graphs produced from data. One unique feature of this chapter is the representation of 3-D graphs and charts to represent data.
■ Chapter 22, “Mechanisms: Gears, Cams, Bearings, and Linkages,” is an introduction to the standard technical drawings for gears, cams, bearings, and linkages. In this chapter students learn the theory and practice used to represent mechanisms. Included in this chapter are a number of step-by-step procedures used to read mechanism catalogs and draw the mechanism using standard practices.
■ Chapter 23, “Electronic Drawings,” is an introduction to the symbols and applications of electronic drawings in industry.
■ Chapter 24, “Piping Drawings,” explains the fundamentals of piping, as well as the symbols used to create standard piping drawings.
■ Chapter 25, “Welding Drawings,” is an introduction to welding processes and the symbols used to represent welded assemblies in technical drawings.
Glossary, Appendixes, and Index
At the end of the text is an extensive glossary containing the definitions of all key terms shown in bold in the text. This glossary contains over 600 terms related to engineering and technical drawing, engineering design, CAD, and manufacturing.
The appendixes contain supplementary information useful to the student, such as an extensive listing of abbreviations commonly used in technical graphics; geometric dimensioning and tolerancing information; materials properties, useful when creating a materials library for CAD solid modelers; properties of geometric forms, useful for 3-D modeling; ANSI standard tolerancing tables; and standard fastener tables for drawing and specifying various fasteners, keys, washers, and pins.
An extensive index is included at the end of the text to assist the reader in finding topics quickly. This index is carefully cross-referenced so related terms can easily be found by the user.
Supplements
A number of supplements have been developed to assist in the instruction of technical graphics.
Instructor’s Manual
This supplement is available on the instructor’s web site and it contains
Chapter objectives
Chapter outlines Chapter summaries
Key terms
Questions for review with answers
True-false questions with answers
Multiple-choice questions with answers
Teaching tips and suggestions
Solutions Manual
This solutions manual contains answers to the end-ofchapter word problems, as well as many of the end-ofchapter drawing problems. Solutions are available on the instructor’s web site.
Workbooks
A workbook with additional drawing problems is available. Graphics Drawing Workbook contains many of the problems found in the text in workbook form. This workbook has many traditional and nontraditional types of problems that are useful for visualization exercises and 3-D modeling.
Online Learning Center (OLC)
The OLC website follows the textbook chapter by chapter. As students study, they can refer to the OLC website for learning objectives, a chapter summary, flashcards, animations, and more. Before taking an exam, students will know if they’re ready thanks to interactive exercises and taking self-grading quizzes.
A secured Instructor Center stores your essential course materials to save you prep time before class. The Instructor’s Manual and presentation materials are now just a couple of clicks away. You will also find additional problem material and exercises (some are Internet-specific).
OLC Supplements
Many supplements for each chapter are found on the online learning center, including the following;
Learning Objectives A listing of all learning objectives for each chapter in the text.
Chapter Outline An extensive outline of each chapter.
Multiple-Choice Quiz An interactive online quiz covering important topics in the chapter. Answers are submitted for automatic and immediate grading for review by the student.
Questions for Review The questions include a hint button if a student cannot answer the question. The hint button refers the student to the chapter page where the material relevant to answering the question can be found.
True or False Questions An interactive online true and false test covering important topics in the chapter. Answers are submitted for automatic and immediate grading for review by the student.
Flashcards Interactive exercises to assist students in learn ing important terms from each chapter of the text.
Web Site Links Many chapters include numerous web site links t hat can be used by students and faculty to supplement the textbook material.
Animations Many chapters include animations that can be down loaded and played on a computer showing how to visualize and understand concepts.
Related Readings A listing of additional books that can be used as references or further reading on topics covered in the chapter.
Image Library The image library, available to instructors, conta ins all the images in each chapter that can be viewed, printed, or saved.
AutoCAD Problems Some chapters contain additional mechanical, civil, and architectural AutoCAD problems in PDF format for viewing and printing hard copies. These problems include step-by-step procedures useful in drawing the problem using AutoCAD software.
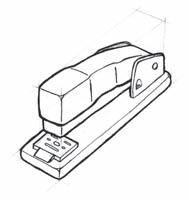
Stapler 3-D Modeling Project The 3-D stapler modeling project was removed from the 4th edition, but it can be found on the Online Learning Center. The purpose of the integrated 3-D modeling project is to further assist and motivate students to learn engineering and technical graphics concepts through a real project. The 3-D modeling project uses a real product, a stapler made by Swingline. The stapler is a fairly simple device with some challenging surfaces. The range of complexity allows students to begin with simple parts and move on to increasingly sophisticated graphics and models as they become more knowledgeable and experienced in using computer graphics.
Old Drawing Problems Many of the drawing problems that were in t he 3rd edition but not replaced with new
problems in the 4th edition can be found on the Online Learning Center.
Geometric Forms Patterns of simple geometric forms are patterns that can be cut out by the student and formed into their 3-D shape. Instructors can use them to supplement their lectures, as visualization aids, and for additional problem assignments.
Acknowledgments
The authors wish to thank the reviewers for the numerous editions, focus groups, and industrial advisory board members for their contribution to the content, organization, and quality of this book and its supplements.
Reviewers/Survey Respondents for the Fourth Edition
Douglas C. Acheson, Purdue School of Engineering and Technology at IUPUI
Mark W. McK. Bannatyne, Purdue University, IUPUI Campus
Christina Barsotti, Clark College
Tom Bledsaw, ITT Educational Services
Joel Brodeur, Montana State University-Northern Perry Carmichael, Linn-Benton Community College
Ralph Dirksen, Western Illinois University
Yaomin Dong, Kettering University
Dale P. Eddy, Kettering University
Howard M. Fulmer, Villanova University
Mohammad Ghaffarpour, University of Illinois-Chicago
Joseph P. Greene, California State University, Chico Karen Groppi, Cabrillo College
Bruce A. Harding, Purdue University
Hong–Tae Kang, University of Michigan-Dearborn
Edward J. Nagle, Tri-State University
Alan D. Papendick, Central Michigan University
Anne Perry, Kankakee Community College
Rex Pierce, Southern Illinois University Edwardsville
George Platanitis, University of Ontario
Anthony A. Roberts, Southwest Virginia Community College
Alexei V. Saveliev, University of Illinois-Chicago
Bert A. Siebold, Murray State University
Nancy E. Study, Virginia State University
Slobodan Urdarevik, Western Michigan University
Ken Youssefi, University of California-Berkeley, San Jose State University
John A. Zaner, University of Southern Maine
Illustrators
A text of this type would be useless without good, accurate g raphics. We have had the good fortune to have some of the best young illustrators in the country work on this text. Joe Mack and James Mohler led a team of illustrators that worked many months on the illustrations. The authors are indebted to these two individuals, both of whom have enormous talent. Joe Mack has since moved on to a very successful career in multimedia software development, and James Mohler has started his own multimedia company. In addition, the authors would like to thank the other illustrators on the team: Rob Cumberland, Jonathan Combs, Doug Acheson, Doug Bailen, Aaron Cox, Brad Johnson, Steve Adduci, Clark Cory, Trent Mohr, Keith Huggins, Dale Jackson, Jonathan Humphries, Sue Miller, Andy Mikesell, Travis Fuerst, Jason Bube, and Kevin Bertoline.
Other Contributors
Accuracy checking of end-of-chapter problems was done by Ted Branoff, North Carolina State University; Ed Nagle, Tri-State University; Jim Hardell, Virginia Polytechnic Institute; and Murari Shah, Purdue University. Special thanks to Peter Booker for the use of historical figures found in his text, A History of Engineering Drawing. We would like to thank Gary Lamit for permission to adopt some figures from his text, Technical Drawing and Design (West Publishing Company), that were used in Chapter 25 and Appendix 6.
The authors would also like to thank the publisher, McGraw-Hill, for its support of this project. Special thanks to Kelley Butcher for all the work she put into this project. She is simply the best developmental editor with whom the authors have ever worked. Our thanks to Bill Stenquist and Darlene Schueller who have given us the support and direction needed to complete the project and stay focused. Our thanks also to the production staff at McGraw-Hill, especially Rose Kernan, who pulled the graphics and text together into a beautifully designed and easy-to-use textbook.
Gary Bertoline would like to especially thank his wife, Ada, and his children, Bryan, Kevin, and Carolyn, for the support they have given so that he might fulfill this important mission in his life. His thanks also go to Caroline and Robert Bertoline, who encouraged him to pursue his studies. He would also like to thank all his colleagues, especially those at Purdue University, his instructors at Northern Michigan University who inspired him to pursue graphics as a discipline, and Wallace Rigotti who taught him the basics.
Finally, we would like to know if this book fulfills your needs. We have assembled a “team” of authors and curriculum specialists to develop graphics instructional material. As a user of this textbook, you are a part of this “team,” and we value your comments and suggestions. Please let us know if there are any misstatements, which we can then correct, or if you have any ideas for improving the material presented. Write in care of the publisher, McGraw-Hill, or E-mail Gary R. Bertoline at bertoline@purdue.edu.
Gary R. Bertoline
Eric N. Wiebe
Nathan W. Hartman
William A. Ross
“If
I have seen further . . . it is by standing upon the shoulders of Giants.” Isaac Newton
This book is dedicated to the pioneers in graphics, and our teachers, colleagues, family, and students from whom we have learned so much and to whom owe our gratitude.
About the Authors
Gary R. Bertoline is a distinguished Professor of Computer Graphics Technology at Purdue University. He earned his B.S. degree in Industrial Technology at Northern Michigan University in 1974, M.Ed. in Industrial Technology at Miami University in 1979, and Ph.D. at The Ohio State University in Industrial Technology in 1987. His graduate work focused on the integration of CAD into engineering graphics and visualization. He has 25 years’ experience teaching graphics at all levels from elementary school to senior citizens. Prof. Bertoline taught junior high and high school graphics at St. Henry High School, St. Henry, Ohio; drafting/design technology at Wright State University, Lake Campus, Celina, Ohio; and engineering graphics at The Ohio State University, Columbus, Ohio.
Eric N. Wiebe, Ph.D., is an Associate Professor in the Graphic Communications Program at North Carolina State University. He earned his B.A. degree in Chemistry from Duke University in 1982, an M.A. in Industrial Design in 1987, and a Ph.D. in Psychology (Ergonomics) in 1996 at North Carolina State University. Before going to graduate school, Professor Wiebe worked as a chemist and in the A/E/C industry. His graduate work in industrial design focused on the role of computer graphics and CAD in the design process. After completing his master’s, Professor Wiebe helped develop a photorealistic rendering and modeling system for architectural and design professionals and worked as a private consultant.
Since coming to teach at North Carolina State, Dr. Wiebe has developed and taught a 3-D solid modeling course for 17 years. In addition, he coordinated the introduction of CAD into the introductory engineering graphics course. Professor Wiebe has also developed a course on scientific visualization, which looks at the graphic representation of technical and scientific data. Since coming to North Carolina State, he has continued to work as a consultant to industry and has been active at the university level on the integration of computing in academics. He has authored numerous publications and instructional materials. In addition to being the past editor of the Engineering Design Graphics Journal, he is a member of the American Society for Engineering Education, the American Educational Research Association, and the Human Factors and Ergonomics Society.
You can contact Dr. Wiebe at eric_wiebe@ncsu.edu.
Nathan W. Hartman is an Assistant Professor in the Department of Computer Graphics Technology at Purdue University. He holds a Bachelor of Science in Technical Graphics and a Master of Science in Technology from Purdue University, and a Doctorate in Technology Education from North Carolina State University. His graduate work focused on the development of expertise and problem solving in the use of modern CAD tools. Nathan currently teaches undergraduate courses in engineering graphics, 3D modeling, product graphics standards and documentation, and product data management. He also teaches graduate course covering the foundational elements of computer graphics and measurement and evaluation. His current research focus includes the use of constraint-based CAD tools in the design process, geometry automation, legacy data and CAD data exchange, and the use of virtual reality in the product lifecycle. Prior to coming to Purdue, Nathan worked for a variety of companies in using and integrating computer-aided design (CAD) tools into the engineering design process through the development of custom training applications and materials. He worked for RAND Worldwide as a Senior Technical Training Engineer, where he taught all levels of courses in 3D modeling and product data management for corporate clients and developed customized training curricula. He also provided on-site technical support for larger clients during their new product development stages and during their installation and configuration of product data management tools. Nathan has also worked for Caterpillar in the large engine design group and for Fairfield Manufacturing in the tool design and fixtures group.
William A. Ross is Professor Emeritus of Computer Graphics Technology at Purdue University. He earned his B.S. Degree in Technical Education and design from North Carolina State University in 1973 and an M.Ed. in 1976. Prior to going into higher education, he worked for five years in industry in construction and architectural design. He has over 30 years experience teaching graphics at a variety of levels. Prior to joining the faculty at Purdue in 1988, Prof. Ross taught drafting at Athens Drive Senior High School, Raleigh, NC; design drafting in the North Carolina Community College system; and engineering graphics at North Carolina State University, Raleigh, NC. He specializes in visualization sketching and instructional design of 3D computer graphics applications for product design, CAD, animation, and simulation.
Gary R. Bertoline
Eric N. Wiebe
Nathan W. Hartman
William A. Ross
Part One Global Implementation for Technical Graphics
1 Introduction to Graphics Communications 5
2 The Engineering Design Process 27
3 Design in Industry 46
4 The Role of Technical Graphics in Production, Automation, and Manufacturing Processes 109
Technical graphics is an important—and essential—area of expertise for the modern technologist. Graphics permeates nearly every aspect of a technologist’s career. This text attempts to provide a clear and understandable description of the graphics theories and techniques currently in use, including both traditional approaches and computerbased operations.
Throughout the text, you will find Practice Exercises, which are intended to help you see more clearly the theories and concepts being described. There are also numerous Design in Industry, which describe how the techniques you are learning are being applied now in the real world.
Part I introduces the special tools and procedures used in technical graphics, and includes discussions on the “art” of visualization, the techniques of sketching, and the importance of technical graphics to the communications process.
Part One
Chapter One Introduction to Graphics Communications
A drawing acts as the reflection of the visual mind. On its surface we can probe, test, and develop the workings of our peculiar vision.
—Edward Hill
Objectives
After completing this chapter, you will be able to:
1. Describe why technical drawings are an effective communications system for technical ideas about designs and products.
2. Discuss the historical development of technical graphics.
3. Define important terms related to graphics communications for technology.
4. Define standards and conventions as applied to technical drawings.
5. Describe the difference between artistic and technical drawings.
6. List six areas in engineering technology that are important to creating and using graphics communications.
Introduction
Chapter 1 is an introduction to the graphics language of the engineer and technologist. The chapter explains why technical drawing is an effective way to communicate engineering concepts, relating past
Chapter One
developments to modern practices, and examines current industry trends, showing why engineers and technologists today have an even greater need to master graphics communication. Concepts and terms important to understanding technical drawing are explained and defined, and an overview of the tools, underlying principles, standards, and conventions of engineering graphics is included.
1.1 Introduction
What is graphics communications? For one thing, it is an effective means of communicating technical ideas and problem solutions.
Look at what happens in engineering design. The process starts with the ability to visualize, to see the problem and the possible solutions. Then, sketches are made to record initial ideas. Next, geometric models are created from those sketches and are used for analysis. Finally, detail drawings or three-dimensional (3-D) models are made to record the precise data needed for the production process. Visualizing, sketching, modeling, and detailing are how engineers and technologists communicate as they design new products and structures for our technological world.
Actually, graphics communications using engineering drawings and models is a language, a clear, precise language, with definite rules that must be mastered if you are to be successful in engineering design. Once you know the language of graphics communications, it will influence the way you think, the way you approach problems. Why? Because humans tend to think using the languages they know. Thinking in the language of technical graphics, you will visualize problems more clearly and will use graphic images to find solutions with greater ease.
In engineering, it is estimated that 92 percent of the design process is graphically based. The other 8 percent is divided between mathematics and written and verbal communications. Why? Because graphics serves as the primary means of communication for the design process. Figure 1.1 shows a breakdown of how engineers spend their time. Drafting and documentation, along with design modeling, comprise more than 50 percent of the engineer’s time and are purely visual and graphical activities. Engineering analysis depends largely on reading technical graphics, and manufacturing engineering and functional design also require the production and reading of graphics.
Why do graphics come into every phase of the engineer’s job? To illustrate, look at the jet aircraft in Figure 1.2.
Figure 1.1
A total view of engineering divided into its major activities Graphics plays a very important role in all areas of engineering, for documentation, communications, design, analysis, and modeling. Each of the activities listed is so heavily slanted toward graphics communications that engineering is 92 percent graphically based.
1.2
Aircraft designed using graphics
This jet aircraft would be impossible to create without computer graphics models and drawings. Drawings are the road maps which show how to manufacture or build products and structures.
Like any new product, it was designed for a specific task and within specified parameters; however, before it could be manufactured, a 3-D model and engineering drawings like that shown in Figure 1.3 had to be produced. Just imagine trying to communicate all the necessary details verbally or in writing. It would be impossible!
Figure
Engineering drawing
Engineering drawings and computer models such as these were needed to produce the hangar assembly shown. The 3-D model is used to design and visualize the hangar. The engineering drawings are used to communicate and document the design process.
A designer has to think about the many features of an object that cannot be communicated with verbal descriptions (Figure 1.4). These thoughts are dealt with in the mind of the designer using a visual, nonverbal process. This “visual image in the mind” can be reviewed and modified to test different solutions before it is ever communicated to someone else. As the designer draws a line on paper or creates a solid cylinder image with a computer, he or she is translating the mental picture into a drawing or model that will produce a similar picture
in the mind of anyone who sees the drawing and shares the same mastery of language. This drawing or graphic representation is the medium through which visual images in the mind of the designer are converted into the real object.
Technical graphics can also communicate solutions to technical problems. Such technical graphics are produced according to certain standards and conventions so they can be read and accurately interpreted by anyone who has learned those standards and conventions.
Figure 1.3
1.4
Technical drawings used for communications
Technical drawings are a nonverbal method of communicating information. Descriptions of complex products or structures must be communicated with drawings. A designer uses a visual, nonverbal process. A visual image is formed in the mind, reviewed, modified, and ultimately communicated to someone else, all using visual and graphics processes.
The precision of technical graphics is aided by tools; some are thousands of years old and still in use today, and others are as new and rapidly changing. This book will introduce you to the standards, conventions, techniques, and tools of technical graphics and will help you develop your technical skills so that your design ideas become a reality.
Engineers are creative people who use technical means to solve problems. They design products, systems, devices, and structures to improve our living conditions. Although problem solutions begin with thoughts or images in the mind of the designer, presentation devices and computer graphics hardware and software are powerful tools for communicating those images to others. They can also aid the visualization process in the mind of the designer. As computer graphics have a greater impact in the field of engineering, engineers will need an ever-growing understanding of and facility in graphics communications.
Technologists assist engineers and are concerned with the practicable aspects of engineering in planning and production. Technologists must be able to communicate quickly and accurately using graphics by sketching
design problems and solutions, analyzing design solutions, and specifying production procedures.
Both engineers and technologists are finding that sharing technical information through graphical means is becoming more important as more nontechnical people become involved in the design/manufacturing process. As Figure 1.5 illustrates, the circle of people requiring technical information is rapidly widening, and engineering and technical information must be effectively communicated to many other people who are not engineers or technologists, such as marketing, sales, and service personnel. Computer graphics can assist in the process. It can be the tool used to draw together many individuals with a wide range of visual needs and abilities.
1.2 Human Communications
Humans have developed a number of different ways to communicate both technical and nontechnical information. Spoken language is a highly refined communications system that humans use to express thoughts, emotions, information, and other needs. Writing is another highly developed communications system based on the use of a formal system of symbols. Writing began as a form of picture communications, as shown in the ancient Egyptian hieroglyphics in Figure 1.6. With the development of alphabets, the written symbols became more abstract, creating an extremely sophisticated and versatile system of communication. Nonetheless, written communications have all the same weaknesses as spoken language when describing technical ideas. The old saying, “a picture is worth a thousand words,” is an understatement when it comes to technical concepts because it is simply impossible to communicate some ideas with only words.
Mathematics is an abstract, symbol-based communications system built on formal human logic. Chemistry also has its own communications systems based on symbols, as do other sciences. It is important to realize that mathematics plays a very important role in engineering design; in fact, all human communications systems discussed here are needed. A successful engineer is one who can effectively use all of these forms of communication, especially technical drawings.
A communications system is selected according to the human need to be communicated. For example, you would not attempt to use mathematics to express human emotion. Instead, you would use a verbally based communications system, whether oral or written, whether sign language, Braille, or even Morse Code. However, for solving the technical problems of engineering, the visual language of technical graphics is the most efficient.
Figure
Users of graphics
The circle of people requiring technical information is growing rapidly.
Graphics is a visual communications language incorporating text, images, and numeric information. Graphics includes everything from the more traditional types of engineering drawings to sophisticated computer models, such as the solid model of a mechanical part or the display in the goggles of a virtual reality system, and all follow the rules or laws of visual science.
Practice Exercise 1.1
1. Attempt to describe the part shown in Figure 1.27 using written instructions. The instructions must be of such detail that another person can make a sketch of the part.
2. Now try verbally describing the part to another person. Have the person make a sketch from your instructions.
These two examples will help you appreciate the difficulty in trying to use written or verbal means to describe even simple mechanical parts. Refer to Figure 1.7 and others in this text to get an idea of how complicated some parts are compared with this example. It is also important to note that air and water craft have thousands of parts. For example, the nuclear powered Sea Wolf class submarine has more than two million parts. Try using verbal or written instructions to describe that!
Figure 1.5
Figure 1.6
Egyptian hieroglyphics are pictures that were used for communication.
Dream High Tech Job
Designing Robots to Explore Planets in Our Solar System
The engineering design process is used in many types of jobs—from the design of consumer product packaging to the design of robots used to explore planets in our solar system. An understanding of the design process along with strong skills in a field of engineering can lead to exciting job opportunities, such as the one described here of a young engineer working at NASA.
NASA’s twin Mars rovers, Spirit and Opportunity, have already rewritten the book on the Red Planet’s history, their amazing discoveries transmitted to an audience of millions. But Ayanna Howard is not content to let NASA rest on its laurels. She’s designing future generations of robotic explorers to bring back even more science for the buck. Her goal: a robot that can be dropped off on a planet and wander around on its own, eliminating the kind of intense supervision from Earth that Spirit and Opportunity require—their every move must be meticulously choreographed in advance and on a daily basis.
“I want to plop a rover on Mars and have it call back when it finds interesting science,” Howard says. “Like a geologist, it should wander
around until it sees something that might be interesting. Then it should be able to investigate further and decide if it’s really interesting or just another rock.”
1.3 The Importance of Technical Graphics
Technical graphics is a real and complete language used in the design process for
1. Visualization
2. Communication
3. Documentation
Howard works as a senior robotics engineer at NASA’s Jet Propulsion Laboratory in Pasadena, Calif. The laboratory has dominated the robotic
A drawing is a graphical representation of objects and structures and is done using freehand, mechanical, or computer methods. A drawing serves as a graphic model or representation of a real object or idea. Drawings may be abstract, such as the multiview drawings shown in Figure 1.7, or more concrete, such as the very sophisticated computer model shown in Figure 1.8. Even though draw-
Ayanna Howard cradles a Sony AIBO robot used to test new software approaches in JPL’s Mars Yard. Here, prototype Mars rover designs are put through their paces in a simulated Martian landscape.
exploration of the solar system since the earliest days of the Space Age.
Space exploration, however, is only a test bed for Howard’s ultimate technical objective: making robots better at helping people. “It’s bigger than space exploration—it’s robots assisting people,” she says. “But space exploration is definitely one of the prime ways that robots assist people.”
The 1970s TV show The Bionic Woman sparked Howard’s interest in human-robot interaction and inspired her to become an engineer. The TV series depicted a severely injured woman who was given superhuman powers, courtesy of bionics; artificial replacements for human parts. “But around the 10th grade, I took biology— and I hated it!” Howard says.
She was stuck, because she knew she’d need medical training if she were going to attach limbs to people. Then someone suggested she check out robots. “I could still build limbs and figure out how to make them move, and as long as I didn’t work on people, I didn’t have to go to med school,” Howard remembers thinking.
So she studied computer engineering—at Brown University in Providence, R.I., because her parents insisted she leave her native California for her undergraduate edu-
cation. “They felt California was too laid back!” she says, laughing. She returned to the West Coast for her school-break vacations, and she was accepted to JPL’s summer program for students.
“When I first got here, I was designing a database. I didn’t even really know that JPL had robotics until I started talking to people. Then I realized all these spacecraft, like the Voyager probes, were robots,” she recalls. Howard kept working at the laboratory during summers, nurturing her growing interest in artificial intelligence. After graduating from Brown, she earned a master’s degree and then a doctorate in electrical engineering from the University of Southern California, in Los Angeles, while working at JPL.
Ayanna Howard (SM) Age: 33
What she does: Develops autonomous robots
For whom: NASA’s Jet Propulsion Laboratory
Where she does it: Pasadena, Calif. Fun factors: Her robots could end up exploring Mars and beyond
What Howard likes best about her job is integrating diverse hardware and software elements into a work-
ings may take many forms, the graphics method of communication is universal and timeless.
It may seem to be a very simple task to pick up a pencil and start drawing three-dimensional images on twodimensional paper. However, it takes special knowledge and skill to be able to represent complex technical ideas with sufficient precision for the product to be mass-
ing robot. “Problem shooting with a device that you have to touch and interact with is the hardest part of developing a robot, but it’s the most fulfilling,” she says.
Howard also mentors disadvantaged girls and frequently addresses elementary and high school students, often in poor neighborhoods. Although a lack of computers and other resources can be a big problem, she finds that simply showing up and explaining that you can make a good living as an engineer can widen a child’s horizons.
“They haven’t talked to somebody who’s a professional, except for teachers,” Howard says. “They look at TV, and it’s all acting and sports, so that’s what they want to be. But when you meet children, it’s surprisingly easy to get them excited about engineering.”
“My hobby is my job,” she adds. And if the first mission to use technology she invented departs for Mars early next decade, as planned, Howard will be among the select few who count exploring planets as one of their hobbies.
produced and the parts to be easily interchanged (Figure 1.9). This special knowledge is called technical drawing
The projection techniques used to represent 3-D images on 2-D paper or flat computer screens took many years to develop. Actually, it has taken millennia for the techniques needed for graphics communications to evolve into the complex and orderly systems we have today.
.42 THRU BASE ONLY .50-13 UNC-2B THRU FOR .50-13 X 1.75 HEX HD CAP SCREW WITH MEDIUM-SPRING LOCK WASHER
EXCEPT WHERE NOTED MISHAWAKA, INDIANA SPLIT BRONZE BUSHED JOURNAL BEARING ∅.50 THRU CAP ONLY
DODGE MANUFACTURING CORP. FILLETS AND ROUNDS R.25
1.7
Multiview drawing of a journal bearing
Only experienced users of technical drawings can interpret the various lines, arcs, and circles sufficiently to get a clear mental picture of what this part looks like three-dimensionally.
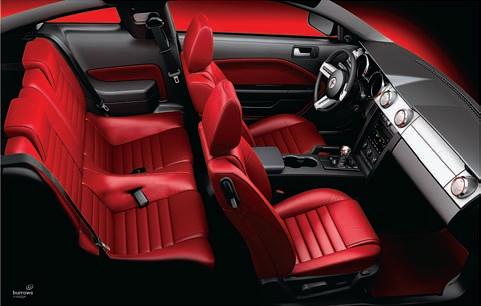
Figure 1.8
3-D computer model of the interior of an automobile
This computer rendering of a 3-D computer model is more easily understood because more detail is given through the use of colors, lights, and shades and shadows.
(Courtesy of Burrows, rendered on Render Drive.)
The volumes of standards developed by the American National Standards Institute (ANSI) will quickly convince you that technical drawing is a precise, formal language.
1.3.1 Visualization
A powerful tool for design engineers is the ability to see in their minds the solution to problems. Visualization is the ability to mentally picture things that do not exist. Design engineers with good visualization ability not only are able to picture things in their minds, but are able to control that mental image allowing them to move around the image, change the form, look inside, and other movement as if they were holding the object in their hands. Some of the greatest engineers and scientists throughout history have had powerful visualization ability, such as Albert Einstein, James Clerk Maxwell, Leonardo DaVinci, and Thomas Edison.
In his book titled Engineering and the Mind’s Eye, Eugene Ferguson summarizes the importance of visual-