Johns Hopkins University School of Medicine Washington, DC
CO- EDITORS
Jonathan S. Appelbaum, MD, FACP, AAHIVS
Florida State University College of Medicine
Roberto C. Arduino, MD Professor of Medicine
Department of Internal Medicine Division of Infectious Diseases
McGovern Medical School, University of Texas Health Sciences Center at Houston
Laurie L. Dozier Jr., MD
Education Director and Professor of Internal Medicine
Interim Chair, Department of Clinical Sciences Florida State University College of Medicine
Jeffrey T. Kirchner, DO, FAAFP, AAHIVS Medical Director, Penn Medicine/LGHP Comprehensive Care Lancaster General Hospital Lancaster, PA
William R. Short, MD, MPH Associate Professor of Medicine Division of Infectious Diseases Perelman School of Medicine University of Pennsylvania
CONTRIBUTORS
Saira Ajmal, MD Advocate Healthcare Illinois
Kevin Alby, MD University of North Carolina Hospitals
Benjamin Alfred, NP- C Family Health Center of Worcester
Jonathan Appelbaum, MD, FACP, AAHIVS Florida State University College of Medicine
Lisa Armitige, MD, PhD Heartland National TB Center
Renata Arrington- Sanders, MD, MPH, ScM Johns Hopkins School of Medicine
Jason V. Baker, MD, MS University of Minnesota
Ben J. Barnett, MD McGovern Medical School at University of Texas at Houston
Tamara Bininashvili, MD University of California, San Francisco
Jatandra Birney, PharmD Ascension Via Christi Hospital
Emily Blumberg, MD Hospital of the University of Pennsylvania
Philip Bolduc, MD, AAHIVS Family Health Center of Worcester
Christopher M. Bositis, MD, AAHIVS Greater Lawrence Family Health Center
Christian Brander, PhD IrsiCalxa AIDS Research Institute University of Vic- Central Catalonia Hospital Universitari Germans Trias i Pujol
Christopher Brendemuhl, DMD Maricopa Integrated Health System McDowell Dental Clinic
John P. Casas, MD Albany Stratton VA Medical Center
Elizabeth Chiao, MD, MPH Michael E. DeBakey VA Medical Center
Carolyn Chu, MD, MSc, FAAFP, AAHIVS University of California at San Francisco
Joseph A. Church, MD Children’s Hospital Los Angeles
Keck School of Medicine of University of Southern California
Eva Clark, MD, PhD, DTM&H
Baylor College of Medicine
Jennifer Cocohoba, PharmD, BCPS, AAHIVP
University of California, San Francisco, School of Pharmacy
University of California, San Francisco, Women’s HIV Program
Dagan Coppock, MD
Drexel University College of Medicine
Vishal Dahya, MD
Florida State University College of Medicine
Elizabeth David, MD
Baylor College of Medicine
Trew Deckard, PA- C, MHS, AAHIVS
Medical Practice of Dr. Steven M. Pounders
Alejandro Delgado, MD
Einstein Medical Center Philadelphia
Paul W. DenOuden, MD, AAHIVS
Multnomah County Health Department
Madeline B. Deutsch, MD, MPH
University of California, San Francisco
Quentin Doperalski, MD
University of California, San Francisco
Richard Dunham, PhD
GlaxoSmithKline
HIV Cure Center, University of North Carolina at Chapel Hill
James P. Dunn, MD
Wills Eye Hospital
Sidney Kimmel Medical College at Thomas Jefferson University
Derek M. Fine, MD
Johns Hopkins Hospital
Anna Forbes, MSS
American Academy of HIV Medicine
Rajesh Gandhi, MD
Massachusetts General Hospital
Harvard Medical School
Taylor K. Gill, PharmD, BCPS, AAHIVP
Ascension Via Christi Hospital
Michelle K. Haas, MD
Denver Public Health
University of Colorado, Anschutz Medical Campus
Dennis J. Hartigan- O’Connor, MD, PhD
University of California, Davis
Rodrigo Hasbun, MD, MPH
McGovern Medical School at University of Texas at Houston
Emily L. Heil, PharmD, BCIDP, BCPS, AAHIVP
University of Maryland School of Pharmacy
Margaret Hoffman-Terry, MD, FACP, AAHIVS
Milton S. Hershey Medical Center
Pennsylvania State University College of Medicine
Lehigh Valley Hospital
Jennifer Husson, MD, MPH
University of Maryland School of Medicine
Nikyati Jakharia, MD University of Maryland
Boris D. Juelg, MD, PhD
Massachusetts General Hospital
Joseph S. Kass, MD, JD, FAAN
Baylor College of Medicine
Jeffrey T. Kirchner, DO, FAAFP, AAHIVS
Penn Medicine/LGHP Comprehensive Care
Lancaster General Hospital
David E. Koren, PharmD
Temple University School of Pharmacy
Temple University Hospital
Carolyn Kramer, MD, MHS
Sidney Kimmel Medical College at Thomas Jefferson University
Doris Kung, DO
Baylor College of Medicine
Eurides Lopes, MD
Loma Linda University Healthcare
Adrian Majid, MD
Weill Cornell Medicine
New York-Presbyterian Hospital
Poonam Mathur, DO, MPH University of Maryland Medical Center
Jessica A. Meisner, MD, MS University of Pennsylvania Health System
Steven Menez, MD
Johns Hopkins School of Medicine
Ana Monczor, MD
McGovern Medical School at University of Texas at Houston
Kudakwashe Mutyambizi, MD
MD Anderson Cancer Center
The University of Texas Medical School at Houston
Puja H. Nambiar, MD
Assistant Professor, Department of Medicine/Infectious Diseases
Louisiana State University Health
Naiel Nassar, MD, FACP
University of California, San Francisco
Karin Nielsen- Saines, MD, MPH
David Geffen School of Medicine
University of California, Los Angeles
Karen Nunez-Wallace, MD
Baylor College of Medicine
Babafemi Onabanjo, MD, AAHIVS
Family Health Center of Worcester
Edgar T. Overton, MD
University of Alabama School of Medicine
Bruce J. Packett II
American Academy of HIV Medicine
Neha Sheth Pandit, PharmD, AAHIVP, BCPS
University of Maryland School of Pharmacy
Rachel A. Prosser, PhD, APRN, CNP, FAANP, AAHIVS
Hennepin County Medical Center
University of Minnesota School of Nursing
Metropolitan University School of Nursing
Centurion
RAAN
Positive Healthcare LLC
Christian B. Ramers, MD, MPH, AAHIVS
Family Health Centers of San Diego
University of San Diego School of Medicine
San Diego State University School of Public Health
Brandon H. Samson, PharmD, MPW
Vaniam Group LLC
Aroonsiri Sangarlangkarn, MD, MPH
HIV Netherlands Australia Thailand Research
Collaboration Clinic
Thai Red Cross
Jason J. Schafer, PharmD, MPH, BCPS
AQ-ID, BCIDP, AAHIVP
Jefferson College of Pharmacy
Thomas Jefferson University
Hans P. Schlecht, MD, MMSc
Baystate Health
Jeffrey T. Schouten, MD
Fred Hutchinson Cancer Research Center
James D. Scott, PharmD, Med, APh, FCCP, FASHP, AAHIVP
Western University of Health Sciences College of Pharmacy
Rajagopal V. Sekhar, MD
Baylor College of Medicine
Lydia J. Sharp, MD
Baylor College of Medicine
Kalpana D. Shere-Wolfe, MD University of Maryland Medical System
Elizabeth M. Sherman, PharmD, AAHIVP
Nova Southeastern University
William R. Short, MD, MPH, AAHIVS University of Pennsylvania
Daniel J. Skiest, MD, FACP, FIDSA
Baystate Health Professor of Medicine
University of Massachusetts Medical School-Baystate
Anthony C. Speights, MD, FACOG, AAHIVS
Florida State University College of Medicine
Sally Spencer Long, ANP C Bay State Medical Center
Gary F. Spinner, PA, MPH, AAHIVS
Southwest Community Health Center
Rohit Talwani, MD University of Maryland Medical Center
Zelalem Temesgen, MD, FIDSA
Mayo Clinic
Karen J. Vigil, MD
McGovern Medical School at University of Texas at Houston
Sana Waheed, MD
University of Wisconsin Hospitals and Clinics
Rakel Beall Wilkins, MD Magellan Health
Amanda L. Willig, PhD, RD
The University of Alabama at Birmingham
Daniel Wlodarczyk, MD
University of California, San Francisco
San Francisco General Hospital
San Francisco Department of Public Health
David A. Wohl, MD
University of North Carolina at Chapel Hill
NC AIDS Training and Education Center
Hojoon You, MD
Einstein Medical Center Philadelphia
Barry Zevin, MD
San Francisco Department of Public Health
JOINT ACCREDITATION STATEMENT
In support of improving patient care, this activity has been planned and implemented by the Postgraduate Institute for Medicine and American Academy of HIV Medicine. The Postgraduate Institute for Medicine is jointly accredited by the Accreditation Council for Continuing Medical Education (ACCME), the Accreditation Council for Pharmacy Education (ACPE), and the American Nurses Credentialing Center (ANCC) to provide continuing education for the healthcare team.
PHYSICIAN CONTINUING MEDICAL EDUCATION
The Postgraduate Institute for Medicine designates these enduring materials for a maximum of 43.75 AMA PRA Category
1 Credit(s)™. Physicians should claim only the credit commensurate with the extent of their participation in the activity.
CONTINUING PHARMACY EDUCATION
The Postgraduate Institute for Medicine designates these continuing education activities for 43.75 contact hour(s) (4.375 CEUs) of the Accreditation Council for Pharmacy Education.
Pharmacists should check their NABP account to ensure credit has been submitted; it must be submitted within 60 days of completion of activity.
CONTINUING NURSING EDUCATION
The maximum number of hours awarded for these Continuing Nursing Education activities is 40.7 contact hours; designated for a total of 10 contact hours of pharmacotherapy credit for Advanced Practice Registered Nurses.
CONTENTS
Disclosure of Conflicts of Interes
Method of Participation and Request for Credit
Disclosure of Unlabeled Use
1. Epidemiology and the Spread of HIV 1
Physicians – maximum of 0.1.0 AMA PRA Category 1
Credits™
Nurses – 1.0 contact hours
Pharmacists – 1.0 contact hours (0.10 CEUs)
ACPE UAN: JA4008162-9999-651-H02-P; Knowledge
2. The Origin, Evolution, and Epidemiology of HIV-1 and HIV-2 15
Physicians – maximum of 0.75 AMA PRA Category 1
Credits™
Nurses – 0.6 contact hours
Pharmacists – 0.75 contact hours (0.075 CEUs)
ACPE UAN: JA4008162-9999-652-H02-P; Knowledge
3. Mechanisms of HIV Transmission 21
Physicians – maximum of 0.75 AMA PRA Category 1
Credits™
Nurses – 0.6 contact hours
Pharmacists – 0.75 contact hours (0.075 CEUs)
ACPE UAN: JA4008162-9999-653-H02-P; Knowledge
4. HIV Transmission Prevention 25
Physicians – maximum of 1.0 AMA PRA Category 1
Credits™
Nurses – 1.0 contact hours, 0.1 pharmacotherapy for APRN
Pharmacists – 1.0 contact hours (0.10 CEUs)
ACPE UAN: JA4008162-9999-19-654-H02-P; Knowledge
5. Immunology
Physicians – maximum of 0.75 AMA PRA Category 1
Credits™
49
Nurses – 0.7 contact hours, 0.2 pharmacotherapy for APRN
Pharmacists – 0.75 contact hours (0.075 CEUs)
ACPE UAN: JA4008162-9999-19-655-H02-P; Knowledge
6. HIV Cure Strategies
Physicians – maximum of 0.75 AMA PRA Category 1
Credits™
Nurses – 0.7 contact hours, 0.5 pharmacotherapy for APRN
59
Pharmacists – 0.75 contact hours (0.075 CEUs)
ACPE UAN: JA4008162-9999-19-656-H02-P; Knowledge
7. HIV Testing and Counseling
Physicians – maximum of 0.75 AMA PRA Category 1
Credits™
Nurses – 0.6 contact hours
Pharmacists – 0.75 contact hours (0.075 CEUs)
ACPE UAN: JA4008162-9999-19-657-H02-P; Knowledge
8. Laboratory Testing Strategies Detection and Diagnosis
Physicians – maximum of 0.75 AMA PRA Category 1
Credits™
Nurses – 0.6 contact hours
Pharmacists – 0.75 contact hours (0.075 CEUs)
ACPE UAN: JA4008162-9999-19-658-H02-P; Knowledge
67
73
9. The Medical History and Physical Examination of the Patient with HIV 83
Physicians – maximum of 0.5 AMA PRA Category 1
Credits™
Nurses – 0.5 contact hours
Pharmacists – 0.5 contact hours (0.05 CEUs)
ACPE UAN: JA4008162-9999-19-659-H02-P; Knowledge
10. Initial Laboratory Evaluation and Risk Stratification of the Patient with HIV 87
Physicians – maximum of 0.25 AMA PRA Category 1
Credits™
Nurses – 0.2 contact hours
Pharmacists – 0.25 contact hours (0.025 CEUs)
ACPE UAN: JA4008162-9999-19-660-H02-P; Knowledge
11. Recognition of Acute and Advanced HIV Infection 91
Physicians – maximum of 0.75 AMA PRA Category 1
Credits™
Nurses – 0.7 contact hours, 0.3 pharmacotherapy for APRN
Pharmacists – 0.75 contact hours (0.075 CEUs)
ACPE UAN: JA4008162-9999-19-661-H02-P; Knowledge
12. Health Maintenance 97
Physicians – maximum of 1.25 AMA PRA Category 1
Credits™
Nurses – 1.2 contact hours, 0.1 pharmacotherapy for APRN
Pharmacists – 1.25 contact hours (0.125 CEUs)
ACPE UAN: JA4008162-9999-19-662-H02-P; Knowledge
13. Issues in Specific Patient Populations
Physicians – maximum of 2.25 AMA PRA
Category 1 Credits™
115
Nurses – 2.1 contact hours, 0.4 pharmacotherapy for APRN
Pharmacists – 2.25 contact hours (0.225 CEUs)
ACPE UAN: JA4008162-9999-19-663-H02-P; Knowledge
14. Complementary and Alternative Medicine/Integrative Medicine Approaches 157
Physicians – maximum of 1.0 AMA PRA Category 1
Credits™
Nurses – 1.0 contact hours, 0.6 pharmacotherapy for APRN
Pharmacists – 1.0 contact hours (0.10 CEUs)
ACPE UAN: JA4008162-9999-19-664-H02-P; Knowledge
15. HIV Care Coordination 175
Physicians – maximum of 0.75 AMA PRA Category 1
Credits™
Nurses – 0.7 contact hours
Pharmacists – 0.75 contact hours (0.075 CEUs)
ACPE UAN: JA4008162-9999-19-665-H02-P; Knowledge
16. The Pharmacist’s Role in Caring for HIV-Positive Individuals 183
Physicians – maximum of 0.75 AMA PRA Category 1
Credits™
Nurses – 0.7 contact hours
Pharmacists – 0.75 contact hours (0.075 CEUs)
ACPE UAN: JA4008162-9999-19-666-H02-P; Knowledge
17. The Role of the Physician Assistant and the Nurse Practitioner in Caring for Persons Living with HIV 189
Physicians – maximum of 1.0 AMA PRA Category 1
Credits™
Nurses – 1.0 contact hours
Pharmacists – 1.0 contact hours (0.10 CEUs)
ACPE UAN: JA4008162-9999-19-667-H02-P; Knowledge
18. Hospice and Palliative Care in Advanced HIV Disease 199
Physicians – maximum of 0.75 AMA PRA Category 1
Credits™
Nurses – 0.7 contact hours, 0.2 pharmacotherapy for APRN
Pharmacists – 0.75 contact hours (0.075 CEUs)
ACPE UAN: JA4008162-9999-19-668-H02-P; Knowledge
19. HIV Virology 205
Physicians – maximum of 1.0 AMA PRA Category 1
Credits™
Nurses – 1.0 contact hours, 0.4 pharmacotherapy for APRN
Pharmacists – 1.0 contact hours (0.10 CEUs)
ACPE UAN: JA4008162-9999-19-669-H02-P; Knowledge
20. Principles of Applied Clinical Pharmacokinetics and Pharmacodynamics in Antiretroviral Therapy 219
Physicians – maximum of 0.75 AMA PRA
Category 1
Credits™
Nurses – 0.7 contact hours, 0.3 pharmacotherapy for APRN
Pharmacists – 0.75 contact hours (0.075 CEUs)
ACPE UAN: JA4008162-9999-19-670-H02-P; Knowledge
21. Classes of Antiretrovirals 225
Physicians – maximum of 0.75 AMA PRA Category 1
Credits™
Nurses – 0.6 contact hours, 0.6pharmacotherapy for APRN
Pharmacists – 0.75 contact hours (0.075 CEUs)
ACPE UAN: JA4008162-9999-19-671-H02-P; Knowledge
22. Initiation of Antiretroviral Therapy: What to Start With 239
Physicians – maximum of 0.5 AMA PRA Category 1
Credits™
Nurses – 0.5 contact hours, 0.1 pharmacotherapy for APRN
Pharmacists – 0.5 contact hours (0.05 CEUs)
ACPE UAN: JA4008162-9999-19-672-H02-P; Knowledge
23. HIV-1 Resistance to Antiretroviral Drugs 245
Physicians – maximum of 0.5 AMA PRA Category 1
Credits™
Nurses – 0.5 contact hours
Pharmacists – 0.5 contact hours (0.05 CEUs)
ACPE UAN: JA4008162-9999-19-673-H02-P; Knowledge
24. Managing the Patient with Multidrug-Resistant HIV 257
Physicians – maximum of 0.5 AMA PRA Category 1
Credits™
Nurses – 0.5 contact hours, 0.4 pharmacotherapy for APRN
Pharmacists – 0.5 contact hours (0.05 CEUs)
ACPE UAN: JA4008162-9999-19-674-H02-P; Knowledge
25. Future Antiretrovirals, Immune-Based Strategies, and Therapeutic Vaccines 261
Physicians – maximum of 0.5 AMA PRA Category 1
Credits™
Nurses – 0.5 contact hours, 0.2 pharmacotherapy for APRN
Pharmacists – 0.5 contact hours (0.05 CEUs)
ACPE UAN: JA4008162-9999-19-675-H02-P; Knowledge
26. Solid Organ Transplantation in Persons Living with HIV 275
Physicians – maximum of 0.75 AMA PRA Category 1
Credits™
Nurses – 0.6 contact hours
Pharmacists – 0.75 contact hours (0.075 CEUs)
ACPE UAN: JA4008162-9999-19-676-H02-P; Knowledge
27. Antiretroviral Therapy in Pregnant Women
Physicians – maximum of 0.5 AMA PRA
Category 1 Credits™
Nurses – 0.5 contact hours, 0.1 pharmacotherapy for APRN
Pharmacists – 0.5 contact hours (0.05 CEUs)
ACPE UAN: JA4008162-9999-19-677-H02-P; Knowledge
28. Antiretroviral Therapy for Children and Newborns
Physicians – maximum of 0.75 AMA PRA Category 1
Credits™
Nurses – 0.7 contact hours
Pharmacists – 0.75 contact hours (0.075 CEUs)
ACPE UAN: JA4008162-9999-19-678-H02-P; Knowledge
29. Immunosuppressants and Antiretroviral Therapy in HIV-Positive Transplant Patients
Physicians – maximum of 0.75 AMA PRA Category 1
Credits™
Nurses – 0.6 contact hours, 0.3 pharmacotherapy for APRN
Pharmacists – 0.75 contact hours (0.075 CEUs)
ACPE UAN: JA4008162-9999-19-679-H02-P; Knowledge
30. Understanding and Managing Antineoplastic and Antiretroviral Therapy
Physicians – maximum of 0.5 AMA PRA Category 1
Credits™
Nurses – 0.5 contact hours
Pharmacists – 0.5 contact hours (0.05 CEUs)
ACPE UAN: JA4008162-9999-19-680-H02-P; Knowledge
31. Substance Abuse in HIV Populations
Physicians – maximum of 1.0 AMA PRA Category 1
Credits™
Nurses – 1.0 contact hours, 0.6 pharmacotherapy for APRN
Pharmacists – 1.0 contact hours (0.10 CEUs)
ACPE UAN: JA4008162-9999-19-681-H02-P; Knowledge
281
287
Nurses – 1.0 contact hours, 0.3 pharmacotherapy for APRN
Pharmacists – 1.0 contact hours (0.10 CEUs)
ACPE UAN: JA4008162-9999-19-683-H02-P; Knowledge
34. Malignancies in HIV
Physicians – maximum of 1.5 AMA PRA Category 1
Credits™
Nurses – 1.5 contact hours, 0.3 pharmacotherapy for APRN
Pharmacists – 1.5 contact hours (0.15 CEUs)
ACPE UAN: JA4008162-9999-19-684-H02-P; Knowledge
35. Dermatologic Complications
Physicians – maximum of 1.0 AMA PRA Category 1
Credits™
Nurses – 1.0 contact hours, 0.4 pharmacotherapy for APRN
Pharmacists – 1.0 contact hours (0.10 CEUs)
297
301
ACPE UAN: JA4008162-9999-19-685-H02-P; Knowledge
36. Endocrine and Metabolic Disorders
Physicians – maximum of 0.75 AMA PRA Category 1
Credits™
Nurses – 0.7 contact hours, 0.1 pharmacotherapy for APRN
Physicians – maximum of 0.75 AMA PRA Category 1 Credits™
Nurses – 0.6 contact hours
453
Pharmacists – 0.75 contact hours (0.075 CEUs)
ACPE UAN: JA4008162-9999-19-698-H02-P; Knowledge
49. US Healthcare Systems, HIV Programs, and Coverage Policy Issues 519
Physicians – maximum of 0.75 AMA PRA Category 1
Credits™
Nurses – 0.6 contact hours
469
Pharmacists – 0.75 contact hours (0.075 CEUs)
ACPE UAN: JA4008162-9999-19-699-H02-P; Knowledge
50. Legal Issues 525
Physicians – maximum of 1.0 AMA PRA Category 1
Credits™
Nurses – 0.8 contact hours
Pharmacists – 1.0 contact hours (0.10 CEUs)
481
ACPE UAN: JA4008162-9999-19-700-H02-P; Knowledge
51. Research Design and Analysis 541
Physicians – maximum of 0.75 AMA PRA Category 1 Credits™
Nurses – 0.6 contact hours
Pharmacists – 0.75 contact hours (0.075 CEUs)
ACPE UAN: JA4008162-9999-19-701-H02-P; Knowledge
487
493
52. Ethical Conduct of Clinical Trials, Institutional Review Boards, Informed Consent, and Financial Conflicts of Interest 545
Physicians – maximum of 0.75 AMA PRA Category 1
Credits™
Nurses – 0.6 contact hours
Pharmacists – 0.75 contact hours (0.075 CEUs)
ACPE UAN: JA4008162-9999-19-702-H02-P; Knowledge
DISCLOSURE OF CONFLICTS OF INTEREST
The Postgraduate Institute for Medicine (PIM) requires instructors, planners, managers, and other individuals who are in a position to control the content of this activity to disclose any real or apparent conflict of interest (COI) they may have as related to the content of this activity. All identified COIs are thoroughly vetted and resolved according to PIM policy. PIM is committed to providing its learners with high-quality CME
Name of Faculty or Presenter
Saira Ajmal
Kevin Alby
Benjamin Alfred
Jonathan Appelbaum
Lisa Armitage
Roberto C. Arduino
Renata Arrington-Sanders
Jason Baker
Ben J. Barnett, MD
Rakel Beall Wilkins
Tamara Bininashvili
Jatandra Birney
Saira Ajmal
Emily Blumberg
Philip Bolduc
Christopher Bositis
Christian Brander
Christopher Brendemuhl
John Casas
Elizabeth Chiao
Carolyn Chu
Joseph Church
Eva Clark
Jennifer Cocohoba
Dagan Coppock
Vishal Dahya
Elizabeth David
activities and related materials that promote improvements or quality in healthcare and not a specific proprietary business interest of a commercial interest.
The faculty reported the following financial relationships or relationships to products or devices they or their spouses/ life partners have with commercial interests related to the content of this CME activity:
Reported Financial Relationship
Nothing to disclose
Nothing to disclose
Nothing to disclose
Consulting fees: Merck, ViiV Healthcare
Nothing to disclose
Contracted Research Viiv Healthcare, Inc.
Nothing to disclose
Nothing to disclose
Consulting fees: Gilead, BMS
Fees for non-CME/CE services: Gilead, Merck
Nothing to disclose
Nothing to disclose
Nothing to disclose
Nothing to disclose
Nothing to disclose
Nothing to disclose
Nothing to disclose
Salary: Aelix Therapeutics
Consulting fees: Gritstone Inc, GLG
Contracted research: Aelix Therapeutics
Ownership interest: Aelix Therapeutics
Nothing to disclose
Nothing to disclose
Nothing to disclose
Nothing to disclose
Nothing to disclose
Nothing to disclose
Nothing to disclose
Nothing to disclose
Nothing to disclose
Nothing to disclose
Trew Deckard
Alejandro Delgado
Paul DenOuden
Madeline Deutsch
Quentin Doperalski
Richard Dunham
James Dunn
Derek Fine
Anna Forbes
Rajesh Gandhi
Taylor Gill
Michelle Haas
Dennis Hartigan-O’Connor
W. David Hardy
Rodrigo Hasbun
Emily Heil
Margaret Hoffman-Terry
Jennifer Husson
Niyati Jakharia
Boris Juelg
Joseph Kass
Jeff Kirchner
David Koren
Carolyn Kramer**
Doris Kung
Eurides Lopes
Adrian Majid
Poonam Mathur
Jessica Meisner
Steven Menez
Ana Monczor
Kudakwashe Mutyambizi Maloney
Puja Nambiar
Naiel Nassar
Karin Nielsen-Saines
Karen Nunez-Wallace
Babafemi Onabanjo
Edgar Overton
Bruce Packett
Rachel Prosser
Fees for non-CME/CE services received directly from a commercial interest or their agents (e.g., speakers bureau): Gilead Sciences, Janssen
Nothing to disclose
Nothing to disclose
Contracted research: Gilead
Nothing to disclose
Nothing to disclose
Fees for non-CME/CE services received directly from a commercial interest or their agents (e.g., speakers bureau): AbbVie
Nothing to disclose
Nothing to disclose
Consulting fees: Merck, Gilead
Research support: Gilead, Theratechnologies, ViiV, Janssen
The planners and managers reported the following financial relationships or relationships to products or devices they or their spouses/life partners have with commercial interests related to the content of this CME activity:
The PIM planners and managers have nothing to disclose.
The AAHIVM planners and managers have nothing to disclose.
METHOD OF PARTICIPATION AND REQUEST FOR CREDIT
There are no fees for participating and receiving CME/ CE credit for this activity. During the period May 1, 2019 through May 1, 2020, participants must read the learning objectives and faculty disclosures and study the educational activity.
PIM supports Green CME by offering your Request for Credit online. If you wish to receive acknowledgment for completing these activities, please complete the posttest and evaluation on www.cmeuniversity.com. On the navigation menu, click on “Find Post-test/Evaluation by Course” and search by course ID 13528. Upon registering and successfully completing the posttest with a score of 75% or better and the activity evaluation for each activity, your certificate will be
made available immediately. Processing credit requests online will reduce the amount of paper used by nearly 100,000 sheets per year.
For pharmacists: Upon successfully completing the posttest with a score of 75% or better and the activity evaluation form, transcript information will be sent to the NABP CPE Monitor Service. Pharmacists should check their NABP account to ensure credit has been submitted; it must be submitted within 60 days of completion of activity.
Media Printed Textbook
DISCLOSURE OF UNLABELED USE
This educational activity may contain discussion of published and/or investigational uses of agents that are not indicated by the US Food and Drug Administration (FDA). The planners of this activity do not recommend the use of any agent outside of labeled indications.
The opinions expressed in the educational activity are those of the faculty and do not necessarily represent the views of the planners. Please refer to the official prescribing information for each product for discussion of approved indications, contraindications, and warnings.
DISCLAIMER
Participants have an implied responsibility to use the newly acquired information to enhance patient outcomes and their own professional development. The information presented in this activity is not meant to serve as a guideline for patient management. Any procedures, medications, or other courses of diagnosis or treatment discussed or suggested in this activity should not be used by clinicians without evaluation of their patient’s conditions and possible contraindications and/ or dangers in use, review of any applicable manufacturer’s product information, and comparison with recommendations of other authorities.
1.
EPIDEMIOLOGY AND THE SPREAD OF HIV
Philip Bolduc, Benjamin Alfred, and Babafemi Onabanjo
CHAPTER GOALS
Upon completion of this chapter, the reader should be able to
• Provide an overview of the global AIDS pandemic and the US epidemic
• Demonstrate and apply knowledge about the evolving epidemiology of HIV to both individual and population-wide aspects of clinical practice
• Educate clinicians and patients about factors driving HIV transmission so that they will understand who is at greatest risk of infection
OVERVIEW OF WORLDWIDE PANDEMIC
LEARNING OBJECTIVE
Discuss the global prevalence and geographic distribution of HIV-1 and HIV-2 infections.
WHAT’S NEW?
The World Health Organization/Joint United Nations Programme on HIV and AIDS (WHO/UNAIDS) estimates that, in 2017, nearly 40 million people worldwide were infected with HIV (UNAIDS, 2018). Although the numbers of new HIV infections and AIDS-related deaths continue to decline in many regions of the world, including sub-Saharan Africa, there are still certain regions where the incidence of HIV is rising, most notably in the eastern European and eastern Mediterranean areas. In his foreword to the UNAIDS Global AIDS Update 2018, executive director Michel Sidibe writes “The global AIDS response is at a precarious point—partial success in saving lives and stopping new HIV infections is giving way to complacency. At the halfway point to the 2020 targets, the pace of progress is not matching the global ambition” (Sidibe, 2018).
KEY POINTS
• UNAIDS identified several demographic subgroups at high risk for HIV infection and in danger of being left
behind by the global AIDS response, including adolescent girls and young women, men who have sex with men (MSM), transgender people, people who inject drugs, prisoners, and sex workers.
• HIV occurs as types 1 and 2, with several groups and subtypes comprising HIV-1. Subtype B predominates in the Western Hemisphere and Western Europe, whereas other subtypes and recombinant forms are more prevalent elsewhere. Introduction of other subtypes and recombinant strains is occurring in the Western Hemisphere and Western Europe.
OVERVIEW OF GLOBAL PANDEMIC
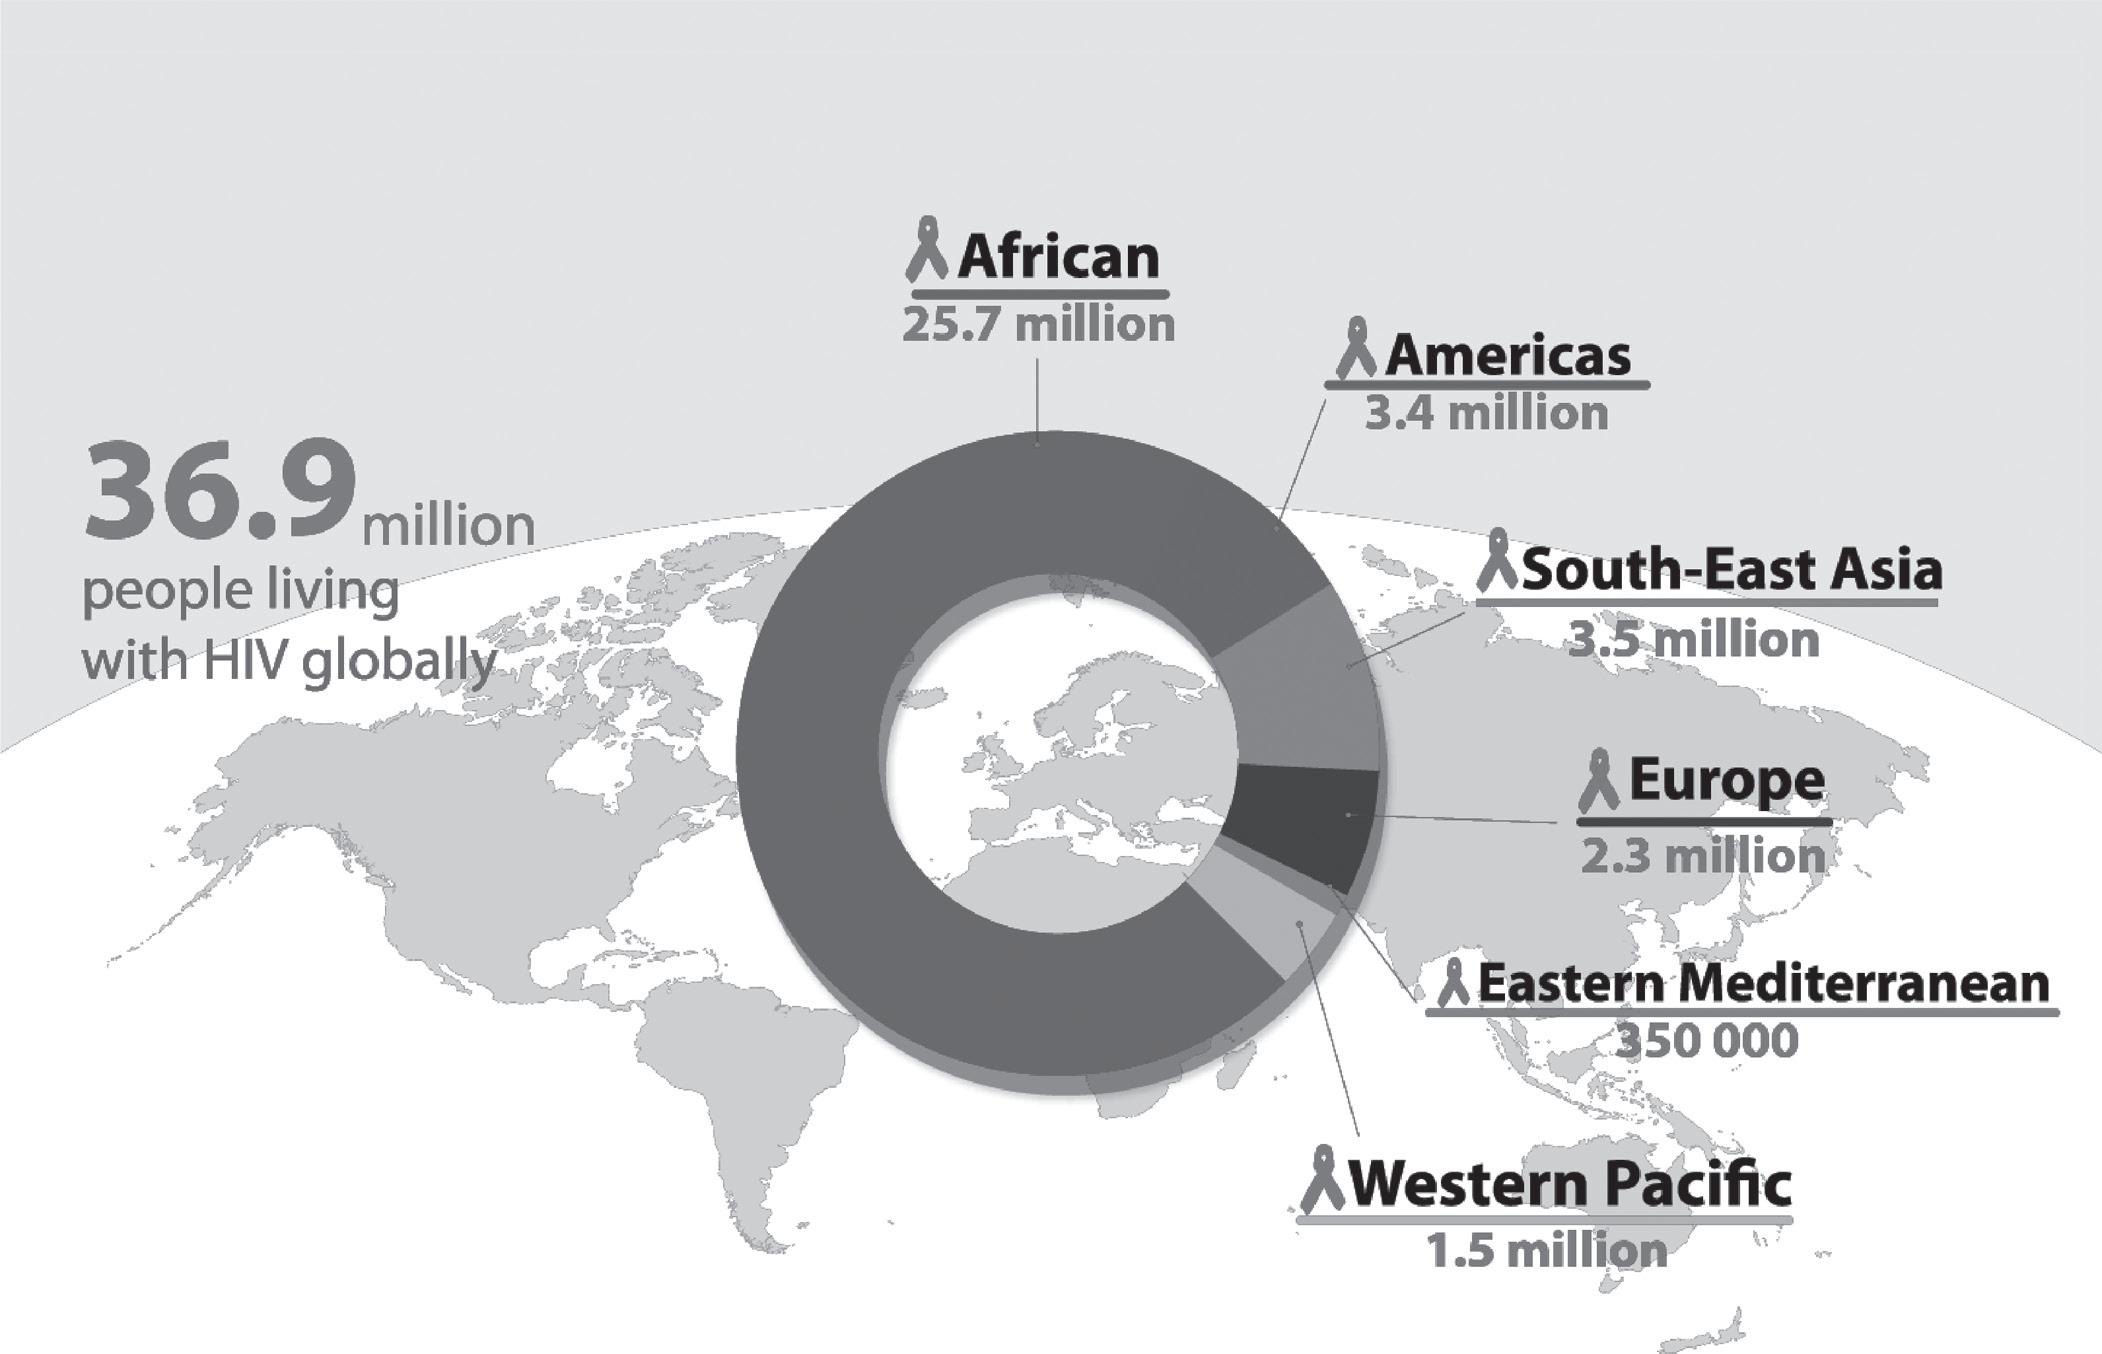
Data from the WHO and UNAIDS show global estimates of HIV as a continuing pandemic, with increasing overall prevalence (36.9 million) but fewer new infections each year (1.8 million), more people on antiretroviral therapy (ART; 21.7 million), and fewer annual deaths (0.9 million) (Figures 1.1 and 1.2) (UNAIDS, 2018).
Africa remains the continent most heavily affected by HIV/AIDS, accounting for 70% of persons living with HIV in 2017 (Figure 1.3). However, due to several global initiatives, there has been a dramatic decline in the annual number of new HIV infections (−24%) and deaths (−35%) in 2017 compared to 2000 (UNAIDS, 2018). Annual infections and deaths have also declined over this period in the Americas (−5% and −20%, respectively) and Southeast Asia (−27% and −40%), but trends in Europe (+20% and −5%) and the Western Pacific areas (+7% and −45%) are mixed, and the Eastern Mediterranean area saw increases in both infections and deaths (+27% and +59%) (UNAIDS, 2018).
Across all countries, several key demographic subgroups continue to be most impacted by the HIV/AIDS epidemic. UNAIDS has identified six populations at higher risk of HIV infection that are in danger of being left behind by the global AIDS response: adolescent girls and young women, MSM, transgender people, people who inject drugs, prisoners, and sex workers. The risk of acquiring HIV is 27 times higher among MSM; 23 times higher among people who inject drugs; 13 times higher for female sex workers; and 12 times
Global HIV epidemic since 2010—prevalence, incidence and mortality trends.
higher for transgender women compared to other adults in the general population (UNAIDS, 2018).
The importance of each of these populations varies by region and within countries. For example, in southern Africa, age-disparate intergenerational sexual relationships and transactional sex place adolescent girls and young women at extremely high risk for HIV; in Eastern Europe and Central Asia, most new HIV infections are associated with people who inject drugs; and in the Latin American and Caribbean regions, the largest proportion of new HIV infections is among MSM. These six key populations and their sexual partners account for 47% of new HIV infections globally, but with wide geographic differences: just 16% in eastern and southern Africa but an incredible 95% in Eastern Europe, central Asia, the Middle East, and North Africa (UNAIDS, 2018).
As of 2017, 21.7 million people living with HIV were accessing ART, an increase of 2.3 million since 2016 and 13.7 million from 2010. Additionally, in 2017, 80% of pregnant women living with HIV had access to antiretrovirals to prevent mother-to-child transmission (UNAIDS, 2018). With better access to testing, 75% of all people living with HIV knew
New
Deaths annually relative to 2010
their HIV status in 2017 compared with ~50% of those living with HIV in 2014. Despite these significant achievements in the global HIV response, there is still much work to be done. The 2017 global HIV testing and care continuum (Figure 1.4) demonstrates that more than half of the world’s people living with HIV are still not on antiretroviral treatment and that significant gaps remain to reach the UNAIDS 90-90-90 goal by 2020 (90% of infected persons will be diagnosed, 90% of those will be on treatment, and 90% of those will be virally suppressed).
HIV DIVERSITY
There are two major types of HIV, designated HIV-1 and HIV-2. Each has a similar but distinct genome with a genetic difference of approximately 60%. The vast majority of clinical cases are caused by HIV-1, with HIV-2 comprising only 1–2 million of the 36.9 million HIV cases living in 2016 (Campbell-Yesufu, 2011). HIV-2 is found almost exclusively in persons from or living in West Africa and is transmitted at lower rates than HIV-1. It appears to have a longer incubation
Figure 1.2 Increase in people receiving ART over time. sOuRCE: UNAIDS/WHO estimates, 2017. WHO HIV Update 2018. Available at http://www.who.int/hiv/data/en/. Accessed August 13, 2018.
Figure 1.1
sOuRCE: UNAIDS/WHO estimates, 2017.
period, produce lower plasma viral load, and lead to AIDS in fewer patients (Apetrei, 2004). HIV-1 is classified into three genetically related subtypes based on the coding sequence of the envelope gene. Group M (Main) is the most common, and groups O (Outlier) and N (Not-M, Not- O or New) remain rare (Apetrei, 2004). Group M has at least 11 subtypes, or clades, designated A–K.
HIV subtype (i.e., group) variability may eventually influence how ART is used, although studies to date suggest
that most antiretroviral agents appear to be equally effective regardless of the viral subtype. Certain subtypes may be less sensitive to or have a greater propensity to develop resistance to antiretroviral drugs or classes of these drugs (Spira, 2003; Gomes, 2002; Wainberg, 2004). A study from Thailand found that discordant viral load results were obtained in persons with non-B subtypes (Hackett, 2004).
There is limited clinical trial information on the effect of ART for HIV-2 infection. An in vitro study found that although the HIV-2 isolates tested were susceptible to the antiviral activities of nucleoside reverse transcriptase inhibitors and most protease inhibitors, they were highly resistant to non-nucleoside reverse transcriptase inhibitors (NNRTIs) (Witvrouw, 2004). Older studies of patients infected with HIV-2 receiving ART found mutations in HIV-2 reverse transcriptase and protease genes associated with HIV-1 drug resistance for each major drug class, including enfuvirtide, although HIV-2 also appears to have reverse transcriptase mutations that are not found in HIV-1 (Witvrouw, 2004; Colson, 2005; Damond, 2005; Rodes, 2000).
Figure 1.4 HIV testing and care continuum (2017). sOuRCE: UNAIDS/WHO estimates, 2017. WHO HIV Update 2018. Available at http://www.who.int/hiv/data/en/. Accessed August 13, 2018.
A 2013 in vitro study found that HIV-2 showed susceptibility to several newer antiretroviral agents, including tenofovir, emtricitabine, and the integrase inhibitor elvitegravir (Andreatta, 2013). A small study of five patients with HIV-2 found effective virologic responses and CD4+ cell increases when raltegravir was part of their ART regimen (Peterson, 2012). The net clinical implication of these findings
Figure 1.3 People living with HIV by WHO region (2017). sOuRCE: UNAIDS/WHO
is that persons with HIV-2 should not be treated with any of the currently available NNRTI medications or enfurvitide, whereas other classes are likely to be effective (US Department of Health and Human Services [USDHHS], 2018).
RECOMMENDED READING
UNAIDS. Global HIV & AIDS statistics—2018 fact sheet. Available at http://www.unaids.org/en/resources/fact-sheet. Accessed September 28, 2018.
World Health Organization. HIV/AIDS data and statistics. Available at http://www.who.int/hiv/data/en/ Accessed September 28, 2018.
OVERVIEW OF us EPIDEMIC
LEARNING OBJECTIVE
Describe current demographic trends in HIV disease in the United States, especially regarding gender, sexuality, race/ethnicity, age, injection-drug use, socioeconomic status, and recent initiatives.
WHAT’S NEW?
HIV, originally concentrated in the urban areas of the Northeast and California, continues its shift into the southeastern United States.
KEY POINTS
• HIV incidence among young black and Latino MSM continues to increase.
• The leading mode of HIV transmission continues to be male same-sex sexual contact.
• Nearly flat overall incidence rates and declining death rates continue to drive up HIV prevalence and workforce demands.
OVERALL US HIV PREVALENCE, INCIDENCE, AND DEATHS
(NB: at the time of this writing, the majority of available US HIV epidemiologic data from the US Centers for Disease Control and Prevention [CDC] was published in 2016, covering through 2015.)
According to the CDC, which reports on the prevalence and incidence of HIV and AIDS in the 50 US states and six territories, in 2015, an estimated 1.1 million persons aged 13 years or older were living with HIV, including 15% who were unaware of their diagnosis (CDC HIV/AIDS Resource Library Slideset, 2016). The year 2016 saw 39,782 new diagnoses, up from 38,500 in 2015. From 2011 through 2015, the annual number of new HIV diagnoses decreased in people who inject drugs (−16%), heterosexuals (−15%), and white gay and
bisexual men (−10%). However, within this same time period, new cases increased among African American (+4%) and Hispanic/Latino (+14%) gay and bisexual men, accounting for the overall increase in new infections (HIV.gov, 2016).
Death rates continue in a low, slow decline following the sharp drop-off with the advent of effective antiretroviral treatments in 1996. With new infections outpacing deaths by approximately 25,000 cases each year, HIV prevalence continues to rise. Two important implications of this are that more clinicians will be needed to care for the burgeoning HIV population, and more must be done to prevent HIV transmission by targeting high-risk populations with interventions of proven efficacy, such as preexposure prophylaxis (PrEP) and treatment-as-prevention.
HIV DEMOGRAPHICS ACROSS THE STATES
To take a regional look at these statistics, Figure 1.5 shows the rates of people living with HIV by state in 2015, showing clear weighting toward the West Coast, Northeast, and South. The South is disproportionally affected, comprising half of the new HIV infections in 2015, 46% of HIV prevalence, and 53% of deaths among HIV patients, despite having only 38% of the US population. Despite this unequal impact, Figure 1.5 also demonstrates that HIV is now also widely distributed throughout the United States. Consequently, HIV clinicians will be needed in new geographic locations to reach underserved areas. In addition, HIV prevention and education must expand beyond historically high-prevalence areas to virtually every state and county in the United States to reduce new infections in a way that we have not been able to do thus far.
AIDS REMAINS COMMON
Despite CDC and US Preventive Task Force recommendations for routine, opt-out, non–risk factor-based HIV screening since 2006, AIDS remains disappointingly common, with 18,160 persons receiving a new AIDS diagnosis in 2016, comprising 46% of the number of new HIV infections in 2016. New AIDS diagnoses follow a geographic trend similar to HIV diagnoses, with the heaviest impact in the South (53%), followed by the West (17%), Northeast (17%), and Midwest (13%). The high rate of AIDS despite widespread availability of effective, tolerable antiretroviral treatment highlights the need for improved HIV screening as well as care linkage, retention, and treatment for those already diagnosed with HIV (HIV.gov, 2016).
THE US HIV CARE CONTINUUM
The US rates of HIV diagnosis among persons estimated to be HIV-infected, care linkage and retention, and viral suppression are represented in the CDC’s HIV care continuum (Figure 1.6). Since the National HIV/AIDS Strategy release in 2010, the HIV treatment community has focused on the care continuum as the leading quality indicator in our healthcare system’s response to HIV. As ART has become
Rates of adults and adolescents living with diagnosed HIV infections, year-end 2015 (United States and 6 Dependent Areas).
Available at http://www.cdc.gov/hiv/library/slidesets/index.html Accessed August 14, 2018.
Figure 1.5
Sets. Available at http://www.cdc.gov/hiv/library/slidesets/index.html Accessed August 14, 2018.
increasingly potent, less toxic, and easier to take, the greatest challenges in suppressing “community viral load” now exist primarily in the first two steps of the continuum, which in 2015 were the percentage of undiagnosed patients (14%) and the additional percentage of diagnosed patients who were not receiving medical care (23%). Only minor progress was made from 2009 to 2012 in these measures, and in 2012 fewer than one-third of persons with HIV in the United States were virally suppressed. However, by 2016, 76% of persons receiving an HIV diagnosis were linked to care within 1 month, improving the overall viral suppression rate to 51%. Providing HIV care across a variety of settings, particularly community health centers and other medical homes that serve affected populations with cultural competence, is critical to further improving the HIV care continuum. This supports the National HIV/AIDS Strategy goals, which include reducing new HIV infections, increasing access to care and improving health outcomes for people living with HIV infection, and reducing HIV-related health disparities (National HIV/ AIDS Strategy, 2015 Accessed August 13, 2018).
3,400 (9%) among people who inject drugs*
TRANSMISSION BY MODE AND AGE
Efforts at HIV screening and prevention must target those at greatest risk for HIV infection by understanding how HIV transmissions are occurring and among what age groups. MSM continue to make up the majority of new HIV infections (68%), easily outpacing all other transmission modes combined (Figure 1.7). Another distinct trend is that the decreasing incidence in all age groups older than 34 years is now outweighed by increases in HIV incidence among 13to 24-year-old and 25- to 34-year-old individuals (Figure 1.8). Of the 39,782 new HIV diagnosis in the United States in 2016, 41% were 13–29 years old; however, 17% of new infections were in the 50+ age group, reminding clinicians to screen for HIV well outside the peak demographic (HIV.gov, 2016).
RECOMMENDED READING
Centers for Disease Control and Prevention. HIV Surveillance Report, 2016. Available at http://www.cdc.gov/hiv/library/reports/ surveillance
s PREAD OF HIV AMONG WOMEN, CHILDREN, AND ADOLE s CEN ts
WHAT’S NEW?
Nineteen percent of HIV diagnoses in 2015 in the United States were among women, which represents a decrease from 2013 (24%). With widespread utilization of ART, transmission of HIV from mother to child has decreased to less than 1% in the United States.
KEY POINTS
• High-risk heterosexual contact remains the most common risk factor for HIV acquisition among adult women.
• The CDC recommends opt-out testing for all pregnant women in the first trimester and repeat testing in the third trimester for women at risk for infection. Adolescent HIV transmission mirrors adult patterns, with large majorities
Figure 1.6 Persons living with diagnosed or undiagnosed HIV infection HIV care continuum outcomes, 2015 (United States). CDC HIV/AIDS Resource Library
8,800 (23%) among heterosexuals 26,200 (68%) among gay and bisexual men
Figure 1.7 Estimated New HIV Infections in the United States by Transmission Category, 2015. sOuRCE: CDC, 2017.
sOuRCE: CDC, 2017. CDC HIV In the United States At A Glance. Available at https://www.cdc.gov/hiv/statistics/overview/ataglance.html. Accessed August 15, 2018. CDC HIV/AIDS Resource Library Slide Sets. Available at http://www.cdc.gov/ hiv/library/slidesets/index.html Accessed August 14, 2018.
of males infected via same-sex contact and females via heterosexual contact.
WOMEN
Worldwide in 2016, women continue to account for more than half (51%) of all HIV-infected persons and 43% of new infections largely through heterosexual transmission (American Foundation for AIDS Research [amfAR], 2017). In sub- Saharan Africa, three of four new infections are among girls aged 15–19 years, and young women aged 15–24 years are twice as likely as men to be living with HIV (UNAIDS, 2018). However, in the United States, women represented only 19% of HIV diagnoses in 2015, down from 24% in 2013, comprising an estimated 7,529 newly diagnosed infections. This disparity is due to the preponderance of male-to-male HIV transmission in the United States. Of these new diagnoses, approximately 4,271 were stage 3 (AIDS) classifications, a number that has been declining since 1996, but remains stubbornly fixed around one- quarter of all HIV diagnoses among women, highlighting the need to improve testing to find patients before progression to AIDS. HIV incidence among US women continues to be highest in the South, followed by the industrial states of the Northeast. Louisiana, with a rate of 15.3 infections per 100,000 population, is hardest hit, with a rate nearly three times the national average.
From 2007 through 2015, black/African American women accounted for the majority of new HIV diagnoses in US females (59% vs. 17% white). The seropositivity rate of these women (26.2 per 100,000 persons) was 15 times higher than that of white females (1.7/100k) and 5 times higher than that of Hispanic females (5.3/100k). Although black/African American women comprised only 13% of the female population, they accounted for 61% of diagnoses of HIV infection among women. Hispanic/Latino women made up 16% of the female population and accounted for 16% of diagnoses. White women encompassed 63% of the US female population and yet accounted for only 19% of HIV diagnoses in women overall (CDC, 2016).
Factors that increase a woman’s risk of acquiring HIV include not knowing her partner’s risk factors for HIV infection, having a lack of HIV knowledge, and having a decreased awareness of risk (CDC, 2011). Women’s relationships with their partners play a pivotal role as well: in relationships in which women are physically abused, vulnerability to HIV is increased because they may not insist on condom use due to fear of being harmed. Women with a history of sexual abuse are more likely to engage in high-risk sexual activity and use drugs compared to women without such behaviors. This includes exchanging sexual activities for drugs and money as well as having difficulty refusing unwanted sex.
The most common mode of transmission for women is high-risk heterosexual contact (84–88% across various groups), followed by injection drug use. These rates, current through 2016, may change with the deepening national opioid crisis and outbreaks of HIV transmission among needlesharing networks (CDC, 2016).
Sexual HIV transmission occurs through unprotected vaginal or anal sex, with receptive anal sex posing the highest risk and insertive vaginal sex the lowest. Oral sex is a theoretical risk if there are breaks in the oral and genital mucosa through which blood or genital secretions may pass. Similarly, sexually transmitted infections that disrupt genital mucosa and stimulate a local immune response increase the likelihood of acquiring or transmitting HIV. Because gonorrhea and syphilis in particular have a higher rate in women of color compared to white women, this likely plays a role in their heightened risk of HIV acquisition. Socioeconomic status also plays a role in HIV risk. In states with higher rates of poverty and limited access to healthcare, women are more likely to use drugs and exchange sex for drugs or money. These risk factors have been shown to increase risk of HIV, directly or indirectly (CDC, 2017).
CHILDREN
The reduction of mother-to-child HIV transmission in the United States is a major success of the antiretroviral era. Although the CDC does not publish a similar graph showing perinatal HIV transmission rates over time, Figure 1.9 shows the dramatic
Figure 1.8 Rates of Diagnoses of HIV Infection among Adults and Adolescents by Age at Diagnosis, 2010–2015 (United States).
Figure 1.9 Stage 3 (AIDS) classifications among persons with perinatally acquired HIV infection, 1985—2015 (United States and 6 Dependent Areas). sOuRCE: CDC, 2017.
decline in perinatal AIDS diagnoses. In 1992, an estimated 952 pediatric HIV transmissions were reported in the United States. By 2004, the number declined to 177. In 2011, there were only 53 reported perinatal infections, but this has since stabilized to around 100 infections per year through 2016 (CDC, 2017). The overall rate of perinatal HIV infections reported by the CDC for 2015 was 1.5 per 100,000 live births, surpassing the CDC’s goal of 5.1 by the end of 2015 (CDC, 2017).
The recent persistence of the number of transmissions in the face of declining rates is due to an increasing number of pregnancies among HIV-positive women as the powerful role of ART in preventing both horizontal and vertical transmission has been promoted among persons living with HIV. However, it bears noting that of all HIV diagnoses in children younger than age 13 years during 2010–2015, only 30% tested positive during their first year of life (Figure 1.10), which is closely linked to data showing that only 20% of these
children’s mothers were tested for HIV during their pregnancy (Figure 1.11). Vertical transmission cannot be prevented if the mother’s HIV status is not known, thus highlighting the importance of screening all pregnant women for HIV at least once during pregnancy.
HIV disproportionately affects black/African American children. While accounting for 64% of diagnoses, they comprised only 14% of the population of US children in 2016, whereas Hispanic (26% of population, 13% of HIV diagnoses) and white (50% of population, 13% of HIV diagnoses) children are infected far less often than their population percentages (CDC, 2016).
ADOLESCENTS
Adolescents aged 13–24, along with 25- to 34-year- old young adults, account for the only two age groups in which
Figure 1.10 Diagnoses of HIV infection among children aged <13 Years, by age at diagnosis, 2010—2015 (United States and 6 Dependent Areas). N = 1,179. CDC, 2017.
Exposed but not infected N =
Figure 1.11 Time of maternal HIV testing among children with diagnosed perinatally acquired HIV infection and children exposed to HIV, birth year 2010-2014 (United States and Puerto Rico). sOuRCE: CDC, 2016. sOuRCE: CDC HIV/AIDS Resource Library Slide Sets. Available at https://www.cdc.gov/hiv/pdf/library/slidesets/cdc-hivsurveillance-women-2016.pdf. Accessed August 02, 2018.
HIV incidence is rising in the United States, being driven in particular by infections among black and Latino MSM youth. Of all adolescents and young adults aged 13–24 years diagnosed with HIV infection, the CDC reported in 2015 that 54% were black/African Americans, again far outpacing their percentage of the general population. Another striking disparity for black/African American children is that their percentage of all children with AIDS increases dramatically with decreasing age, as seen moving right to left in Figure 1.12.
Transmission rates through male same-sex contact increased from 72% to 92.7% of all transmission from 2009 to 2016 in the adolescent and young adult population, whereas heterosexual infections decreased from 20% to 3%. Infections from injection drug use decreased among adolescents over this period from 4% to 1% (CDC, 2016).
In 2016, females comprised 16% of the HIV diagnoses in adolescents (13–19 years) and 11% in young adults (20–24 years) compared to 21% of adults older than 24 years. The mode of HIV transmission varies between sexes in this age group, as it does in adults: whereas 84% of adolescent and young adult females are infected through heterosexual contact, more than 90% of males contract HIV through male-tomale sexual contact (CDC, 2016).
RECOMMENDED READING
Centers for Disease Control and Prevention. HIV surveillance report: Diagnoses of HIV infection and AIDS in the United States and dependent areas. 2016. Vol. 28. Available at https://www. cdc.gov/ hiv/ pdf/ library/ reports/ surveillance/ cdc- hiv- surveillancereport-2016-vol-28.pdf
Figure 1.12 Stage 3 (AIDS) Classifications among persons aged 13 years and older with diagnosed HIV infection, by race/ethnicity and age group, 2016 (United States and 6 Dependent Areas). sOuRCE: CDC, 2017. sOuRCE: CDC HIV/AIDS Resource Library Slide Sets. Available at https://www.cdc.gov/hiv/pdf/library/slidesets/cdc-hivsurveillance-women-2016.pdf. Accessed August 02, 2018
Centers for Disease Control and Prevention. Adolescents and young adult surveillance. Available at https://www.cdc.gov/hiv/pdf/library/slidesets/cdc-hiv-surveillance- adolescents-young-adults-2016. pdf Center of Disease and Prevention. Pediatric surveillance. Available at https://www.cdc.gov/hiv/pdf/library/slidesets/cdc-hiv-surveillancepediatric.pdf.
s PREAD OF HIV AMONG MEN AND WOMEN IN COMM u NI t IE s OF COLOR
WHAT’S NEW?
Young black/African American MSM have the highest risk for HIV infection of any demographic group in the United States.
KEY POINTS
• Black/African Americans are HIV-infected at nearly four times higher rates than their percentage of the US population, with rates highest in the southeastern United States.
• AIDS and AIDS-related deaths among black/ African Americans and Hispanics are higher than population norms, indicating poorer outcomes with HIV infection.
UNEQUAL BURDENS
Another important perspective of US HIV epidemiologic data is to recognize the ethnic and racial groups hardest hit by HIV infection and deaths, particularly blacks/African Americans. Figure 1.13 shows how this group steadily increased its percentage among AIDS diagnoses early in the epidemic while cases among Caucasians steadily declined, overtaking them in 1995 before leveling off in 2000, continuing to far exceed all other racial groups. Blacks/African Americans continue to be vastly overrepresented among persons living with HIV than in the general population in 2016 (44% vs. 12%). This is also true, but to a lesser extent, for Hispanics (25% vs. 18%). These numbers for whites, by comparison, are 61% and 26%, respectively.
Results from CDC’s Young Men’s Survey (1994–2000) found that many young black, African American, and Latino MSM outwardly identify as heterosexual, with female spouses or partners, but also engage in same-sex encounters with other men, and that this high-risk group represents a bridge for transmitting HIV to women (Fitzpatrick, 2004; Millett, 2004; Valleroy, 2004). In addition, many poor and/or minority women lack the agency—whether economic, cultural, or otherwise—to use condoms with or separate from abusive or unfaithful men who engage in high-risk sex with other partners or commercial sex workers. HIV prevention efforts must account for such factors to make inroads against HIV transmission in these groups.
The current highest risk demographic in the United States is young black MSM who live in the South, driving the epidemic in this population overall in the United States, such that the
Figure 1.13 Percentages of stage 3 (AIDS) classifications among adults and adolescents with diagnosed HIV infection, by race/ethnicity and year of classification, 1985-2015 (United States and 6 Dependent Areas). sOuRCE: CDC, 2017. CDC HIV/AIDS Resource Library Slide Sets. Available https://www.cdc.gov/hiv/pdf/library/ slidesets/cdc-hiv-surveillance-race-ethnicity-2016.pdf. Accessed August 3, 2018.