ALL RIGHTS RESERVED. No part of this work covered by the copyright herein may be reproduced, transmitted, stored, or used in any form or by any means graphic, electronic, or mechanical, including but not limited to photocopying, recording, scanning, digitizing, taping, Web distribution, information networks, or information storage and retrieval systems, except as permitted under Section 107 or 108 of the 1976 United States Copyright Act, without the prior written permission of the publisher.
For product information and technology assistance, contact us at Cengage Learning Customer & Sales Support, 1-800-354-9706.
For permission to use material from this text or product, submit all requests online at www.cengage.com/permissions. Further permissions questions can be e-mailed to permissionrequest@cengage.com.
Library of Congress Control Number 2014952597
Student Edition:
ISBN-13: 978-1-305-11358-9
ISBN-10: 1-305-11358-6
Loose-leaf Edition:
ISBN-13: 978-1-305-26500-4
ISBN-10: 1-305-26500-9
Cengage Learning 20 Channel Center Street Boston, MA 02210
USA
Cengage Learning is a leading provider of customized learning solutions with office locations around the globe, including Singapore, the United Kingdom, Australia, Mexico, Brazil, and Japan. Locate your local office at www.cengage.com/global.
Cengage Learning products are represented in Canada by Nelson Education, Ltd.
To learn more about Cengage Learning Solutions, visit www.cengage.com.
Purchase any of our products at your local college store or at our preferred online store www.cengagebrain.com.
CH aP ter 1
CH aP ter 2
CH aP ter 3
Earth and Its Atmosphere 3
Energy: Warming Earth and the Atmosphere 31
Seasonal and Daily Temperatures 59
CH aP ter 4 Atmospheric Humidity 93
CH aP ter 5
CH aP ter 6
CH aP ter 7
Condensation: Dew, Fog, and Clouds 115
Stability and Cloud Development 145
Precipitation 169
CH aP ter 8 Air Pressure and Winds 199
CH aP ter 9
CH aP ter 10
Wind: Small-Scale and Local Systems 229
Wind: Global Systems 265
CH aP ter 11 Air Masses and Fronts 295
CH aP ter 12
Middle-Latitude Cyclones 321
CH aP ter 13 Weather Forecasting 347
CH aP ter 14
CH aP ter 15
Thunderstorms 383
Tornadoes 415
CH aP ter 16 Hurricanes 439
CH aP ter 17 Global Climate 471
CH aP ter 18 Earth’s Changing Climate 501
CH aP ter 19 Air Pollution 535
CH aP ter 20 Light, Color, and Atmospheric Optics 565
Preface xi
CH aP ter 1
Earth and Its Atmosphere 3
The Atmosphere and the Scientific Method 4
Overview of Earth’s Atmosphere 4
The Early Atmosphere 5
Composition of Today’s Atmosphere 6
FOCUS ON A SPECIAL TOPIC 1.1
A Breath of Fresh Air 7
Vertical Structure of the Atmosphere 10
A Brief Look at Air Pressure and Air Density 11
Layers of the Atmosphere 12
FOCUS ON A SPECIAL TOPIC 1.2
The Atmospheres of Other Planets 14
FOCUS ON AN OBSERVATION 1.3
The Radiosonde 15
The Ionosphere 16
Weather and Climate 17
Meteorology—A Brief History 17
A Satellite’s View of the Weather 18
Weather and Climate in Our Lives 22
FOCUS ON A SPECIAL TOPIC 1.4
What is a Meteorologist? 26
Summary 27
Key Terms 27
Questions for Review 27
Questions for Thought 28
Problems and Exercises 28
CH aP ter 2
Energy: Warming Earth and the Atmosphere 31
Energy, Temperature, and Heat 32
Temperature Scales 33
Specific Heat 34
Latent Heat—The Hidden Warmth 34
FOCUS ON A SPECIAL TOPIC 2.1
The Fate of a Sunbeam 36
Heat Transfer in the Atmosphere 36
Conduction 36
Convection 37
FOCUS ON A SPECIAL TOPIC 2.2
Rising Air Cools and Sinking Air Warms 38
Radiant Energy 39
Radiation and Temperature 40
Radiation of the Sun and Earth 40
Radiation—Absorption, Emission, and Equilibrium 41
FOCUS ON AN ENVIRONMENTAL ISSUE 2.3
Wave Energy, Sun Burning, and UV Rays 42
Selective Absorbers and the Atmospheric Greenhouse Effect 43
Enhancement of the Greenhouse Effect 46
Warming the Air from Below 47
Shortwave Radiation Streaming from the Sun 47
FOCUS ON AN OBSERVATION 2.4
Blue Skies, Red Suns, and White Clouds 48
Earth’s Annual Energy Balance 49
Solar Particles, the Aurora, and Space Weather 51
FOCUS ON A SPECIAL TOPIC 2.5
Characteristics of the Sun 52
Solar Storms and Space Weather 54
Summary 55
Key Terms 55
Questions for Review 55
Questions for Thought 56
Problems and Exercises 56
Seasonal and Daily Temperatures 59
Why Earth Has Seasons 60
Seasons in the Northern Hemisphere 60
FOCUS ON A SPECIAL TOPIC 3.1
Is December 21 Really the First Day of Winter? 64
Seasons in the Southern Hemisphere 66
Local Seasonal Variations 66
FOCUS ON AN ENVIRONMENTAL ISSUE 3.2
Solar Heating and the Noonday Sun 67
Daily Warming and Cooling Air Near the Surface 68
Daytime Warming 68
Extreme High Temperatures 69
Nighttime Cooling 70
Record Low Temperatures 73
Daily Temperature Variations 75
FOCUS ON A SPECIAL TOPIC 3.3
When It Comes to Temperature, What’s Normal? 77
Applications of Air Temperature 80
Air Temperature and Human Comfort 82
FOCUS ON AN OBSERVATION 3.4
A Thousand Degrees and Freezing to Death 83
Measuring Air Temperature 84
FOCUS ON AN OBSERVATION 3.5
Why Thermometers Should Be Read in the Shade 86
Summary 88
Key Terms 88
Questions for Review 88
Questions for Thought 89
Problems and Exercises 90
CH aP ter 4
Atmospheric Humidity 93
Circulation of Water in the Atmosphere 94
The Many Phases of Water 95
Evaporation, Condensation, and Saturation 95
Humidity 97
Absolute Humidity 97
Specific Humidity and Mixing Ratio 97
Vapor Pressure 98
Relative Humidity 99
FOCUS ON A SPECIAL TOPIC 4.1
Vapor Pressure and Boiling—The Higher You Go, the Longer Cooking Takes 100
Relative Humidity and Dew Point 101
Comparing Humidities 104
Relative Humidity in the Home 105
Relative Humidity and Human Discomfort 106
FOCUS ON A SPECIAL TOPIC 4.2
Computing Relative Humidity and Dew Point 107
Measuring Humidity 109
FOCUS ON A SPECIAL TOPIC 4.3
Which Is “Heavier”—Humid Air or Dry Air? 110
Summary 111
Key Terms 111
Questions for Review 111
Questions for Thought 112 Problems and Exercises 112
CH aP ter 5
Condensation: Dew, Fog, and Clouds 115
The Formation of Dew and Frost 116
Condensation Nuclei 117
Haze 117
Fog 118
Radiation Fog 119
Advection Fog 120
FOCUS ON AN OBSERVATION 5.1
Why Are Headlands Usually Foggier Than Beaches? 121
Upslope Fog 122
Evaporation (Mixing) Fog 122
Foggy Weather 123
FOCUS ON A SPECIAL TOPIC 5.2
Fog That Forms by Mixing 124
FOCUS ON AN ENVIRONMENTAL ISSUE 5.3
Fog Dispersal 126
Clouds 127
Classification of Clouds 127
Cloud Identification 127
Some Unusual Clouds 132
Cloud Observations 135
Satellite Observations 135
FOCUS ON AN OBSERVATION 5.4
Measuring Cloud Ceilings 137
FOCUS ON A SPECIAL TOPIC 5.5
Satellites Do More Than Observe Clouds 141
Summary 142
Key Terms 142
Questions for Review 142
Questions for Thought 143
Problems and Exercises 143
CH aP ter 6
Stability and Cloud Development
Atmospheric Stability 146
Determining Stability 147
A Stable Atmosphere 147
An Unstable Atmosphere 149
A Conditionally Unstable Atmosphere 151
Causes of Instability 151
FOCUS ON A SPECIAL TOPIC 6.1
Subsidence Inversions—Put a Lid on It 152
Cloud Development 154
Convection and Clouds 154
FOCUS ON A SPECIAL TOPIC 6.2
Atmospheric Stability and Windy Afternoons— Hold On to Your Hat 155
FOCUS ON AN OBSERVATION 6.3
Determining Convective Cloud Bases 159
Topography and Clouds 159
Clouds That Form Downwind of Mountains 161
FOCUS ON AN ADVANCED TOPIC 6.4
Adiabatic Charts 162
Changing Cloud Forms 162
Summary 166
Key Terms 166
Questions for Review 166
Questions for Thought 166 Problems and Exercises 167
CH aP ter 7
Precipitation
169
Precipitation Processes 170
How Do Cloud Droplets Grow Larger? 170
Collision and Coalescence Process 171
Ice-Crystal (Bergeron) Process 173
FOCUS ON A SPECIAL TOPIC 7.1
The Freezing of Tiny Cloud Droplets 174
Cloud Seeding and Precipitation 176
Precipitation in Clouds 178
FOCUS ON AN ENVIRONMENTAL ISSUE 7.2
Does Cloud Seeding Enhance Precipitation? 178
Precipitation Types 179
Rain 179
Snow 180
FOCUS ON A SPECIAL TOPIC 7.3
Are Raindrops Tear-Shaped? 181
FOCUS ON A SPECIAL TOPIC 7.4
145
Snowing When the Air Temperature Is Well Above Freezing 182
Sleet and Freezing Rain 185
FOCUS ON A SPECIAL TOPIC 7.5
Sounds and Snowfalls 185
FOCUS ON AN OBSERVATION 7.6
Aircraft Icing 187
Snow Grains and Snow Pellets 188 Hail 188
Measuring Precipitation 191 Instruments 191
Doppler Radar and Precipitation 192
Measuring Precipitation from Space 193
Summary 195
Key Terms 195
Questions for Review 195
Questions for Thought 196 Problems and Exercises 196
CH aP ter 8
Air Pressure and Winds 199
Atmospheric Pressure 200
Horizontal Pressure Variations—A Tale of Two Cities 200
Daily Pressure Variations 201
Pressure Measurements 202
FOCUS ON A SPECIAL TOPIC 8.1
The Atmosphere Obeys the Gas Law 204
Pressure Readings 205
Surface and Upper-Level Charts 206
FOCUS ON AN OBSERVATION 8.2
Flying on a Constant Pressure Surface—High to Low, Look Out Below 209
Newton’s Laws of Motion 210
Forces That Influence the Winds 211
Pressure Gradient Force 211
Coriolis Force 211
Straight-Line Flow Aloft—Geostrophic Winds 214
FOCUS ON AN ADVANCED TOPIC 8.3
A Mathematical Look at the Geostrophic Wind 216
Curved Winds Around Lows and Highs Aloft— Gradient Winds 216
FOCUS ON AN OBSERVATION 8.4
Estimating Wind Direction and Pressure Patterns Aloft by Watching Clouds 218
Winds on Upper-Level Charts 218
Surface Winds 220
FOCUS ON AN OBSERVATION 8.5
Winds Aloft in the Southern Hemisphere 220 Winds and Vertical Air Motions 222
FOCUS ON AN ADVANCED TOPIC 8.6
The Hydrostatic Equation 224
Summary 225 Key Terms 225
Questions for Review 225 Questions for Thought 226 Problems and Exercises 226
CH aP ter 9
Wind: Small-Scale and Local Systems 229
Scales of Motion 230
Small-Scale Winds Interacting with the Environment 231
Friction and Turbulence in the Boundary Layer 231
Eddies—Big and Small 233
The Strong Force of the Wind 234
Wind and Soil 234
FOCUS ON AN OBSERVATION 9.1
Eddies and “Air Pockets” 235
Wind and Snow 236
Wind and Vegetation 237
Wind and Water 238
Local Wind Systems 239
FOCUS ON A SPECIAL TOPIC 9.2
Pedaling into the Wind 240
Thermal Circulations 240
Sea and Land Breezes 241
Mountain and Valley Breezes 243
Katabatic Winds 244
Chinook (Foehn) Winds 245
FOCUS ON A SPECIAL TOPIC 9.3
Snow Eaters and Rapid Temperature Changes 246
Santa Ana Winds 246
Desert Winds 249
Seasonally Changing Winds—The Monsoon 251
Determining Wind Direction and Speed 254
The Influence of Prevailing Winds 255
Wind Measurements 257
FOCUS ON A SPECIAL TOPIC 9.4
Wind Energy 257
Summary 260
Key Terms 260
Questions for Review 260
Questions for Thought 261
Problems and Exercises 262
CH aP ter 10
Wind: Global Systems
265
General Circulation of the Atmosphere 266
Single-Cell Model 266
Three-Cell Model 267
Average Surface Winds and Pressure: The Real World 269
The General Circulation and Precipitation Patterns 271
Average Wind Flow and Pressure Patterns Aloft 272
FOCUS ON AN OBSERVATION 10.1
The “Dishpan” Experiment 274
Jet Streams 274
The Formation of Jet Streams 276
Other Jet Streams 277
Atmosphere-Ocean Interactions 278
Global Wind Patterns and Surface Ocean Currents 278
Upwelling 280
El Niño, La Niña, and the Southern Oscillation 281
Pacific Decadal Oscillation 286
FOCUS ON A SPECIAL TOPIC 10.2
The Challenge of Predicting El Niño and La Niña 287
North Atlantic Oscillation and Arctic Oscillation 289
Summary 291
Key Terms 291 Questions for Review 291 Questions for Thought 292 Problems and Exercises 292
CH aP ter 11
Air Masses and Fronts 295
Air Masses 296
Source Regions 296
Classification 296 Air Masses of North America 297
FOCUS ON A SPECIAL TOPIC 11.1
Lake-Effect (Enhanced) Snows 299
FOCUS ON A SPECIAL TOPIC 11.2
The Return of the Siberian Express 302
Fronts 306
Stationary Fronts 307
Cold Fronts 307
Warm Fronts 311
Drylines 313
FOCUS ON A SPECIAL TOPIC 11.3
The Wavy Warm Front 314
Occluded Fronts 315
Upper-Air Fronts 316
Summary 318
Key Terms 318
Questions for Review 318
Questions for Thought 319
Problems and Exercises 319
CH aP ter 12
Middle-Latitude Cyclones 321
Polar Front Theory 322
Where Do Mid-Latitude Cyclones Tend to Form? 325
FOCUS ON A SPECIAL TOPIC 12.1
Nor’easters 326
Vertical Structure of Deep Dynamic Lows 326
The Roles of Converging and Diverging Air 327
FOCUS ON A SPECIAL TOPIC 12.2
A Closer Look at Convergence and Divergence 328
Upper-Level Waves and Mid-Latitude Cyclones 329
The Necessary Ingredients for a Developing Mid-Latitude Cyclone 330
Upper-Air Support 330
The Role of the Jet Stream 331
FOCUS ON A SPECIAL TOPIC 12.3
Jet Streaks and Storms 332
Conveyor Belt Model of Mid-Latitude Cyclones 333
A Developing Mid-Latitude Cyclone—The March Storm of 1993 334
Vorticity, Divergence, and Developing Mid-Latitude Cyclones 337
FOCUS ON A SPECIAL TOPIC 12.4
Vorticity and Longwaves 339
Vorticity Advection and Shortwaves 340
Putting It All Together—A Monstrous Snowstorm 341
Polar Lows 342
Summary 343
Key Terms 343
Questions for Review 343
Questions for Thought 344
Problems and Exercises 344
CH aP ter
13
Weather Forecasting
Weather Observations 348
347
Surface and Upper-Air Data 348
Satellite Products 348
Doppler Radar 348
FOCUS ON A SPECIAL TOPIC 13.1
The Forecast Funnel 349
Acquisition of Weather Information 350
Weather Forecasting Tools 350
FOCUS ON A SPECIAL TOPIC 13.2
The Forecast in Words and Pictures 351
Forecast Production 352
Time Range of Forecasts 353
FOCUS ON A SPECIAL TOPIC 13.3
The Thickness Chart—A Forecasting Tool 354
Forecasting Techniques 355
FOCUS ON AN OBSERVATION 13.4
TV Weathercasters—How Do They Do It? 356
The Computer and Weather Forecasting: Numerical Weather Prediction 358
Why Forecasts Go Awry and Steps to Improve Them 360
Accuracy and Skill in Forecasting 363
FOCUS ON SOCIAL AND ECONOMIC IMPACTS 13.5
Weather Prediction and the Marketplace 364
Predicting the Weather from Local Signs 366
Weather Forecasting Using Surface Charts 366
FOCUS ON AN OBSERVATION 13.6
Forecasting Temperature Advection by Watching the Clouds 368
Determining the Movement of Weather Systems 369
A Forecast for Six Cities 370
A Meteorologist Makes a Prediction 373
Help from the 500-mb Chart 374
The Models Provide Assistance 375
A Valid Forecast 376
Satellite and Upper-Air Assistance 376
A Day of Rain and Wind 377
Summary 379
Key Terms 379
Questions for Review 379
Questions for Thought 380
Problems and Exercises 380
CH aP ter 14
Thunderstorms 383
Thunderstorm Types 384
Ordinary Cell Thunderstorms 385
Multicell Thunderstorms 387
Supercell Thunderstorms 394
Thunderstorms and the Dryline 398
Thunderstorms and Flooding 399
FOCUS ON A SPECIAL TOPIC 14.1
The Terrifying Flash Flood in the Big Thompson Canyon 400
Distribution of Thunderstorms 401
Lightning and Thunder 403
How Far Away Is the Lightning?—Start Counting 403
Electrification of Clouds 404
FOCUS ON AN OBSERVATION 14.2
ELVES in the Atmosphere 405
The Lightning Stroke 405
Lightning Detection and Suppression 408
FOCUS ON AN OBSERVATION. 14.3
Don’t Sit Under the Apple Tree 409
Summary 411
Key Terms 411
Questions for Review 411
Questions for Thought 412
Problems and Exercises 412
CHaP ter
15
Tornadoes
415
Tornadoes: A Few Facts 416
Tornado Life Cycle 416
Tornado Occurrence and Distribution 417
Tornado Winds 419
FOCUS ON A SPECIAL TOPIC 15.1
The Evolution of Tornado Watches and Warnings 422
Tornado Outbreaks 423
Tornado Formation 424
Supercell Tornadoes 424
FOCUS ON A SPECIAL TOPIC 15.2
Forecasting Severe Thunderstorms and Tornadoes 428
How Do Hurricanes Compare with Middle-Latitude Cyclones? 448
Naming Hurricanes and Tropical Storms 450
Devastating Winds, the Storm Surge, and Flooding 452
Classifying Hurricane Strength 453
FOCUS ON A SPECIAL TOPIC 16.2
Devastating Tropical Storms 454
Hurricane Spawned Tornadoes 455
Hurricane Fatalities 456
Some Notable Hurricanes 456
Galveston, 1900 456
New England, 1938 456
Camille, 1969 457
Hugo, 1989 457
Andrew, 1992 457
Ivan, 2004 458
Katrina and Rita, 2005 459
FOCUS ON AN OBSERVATION 16.3
The Record-Setting Atlantic Hurricane Seasons of 2004 and 2005 460
Sandy, 2012 461
Devastating Tropical Cyclones Around the World 462
Hurricane Watches and Warnings 464
FOCUS ON AN ENVIRONMENTAL ISSUE 16.4
Hurricanes in a Warmer World 465
Hurricane Forecasting Techniques 466
Modifying Hurricanes 467
Summary 468
Key Terms 468
Questions for Review 468
Questions for Thought 469
Problems and Exercises 469
CH aP ter 17
Global Climate 471
A World with Many Climates 472
Global Temperatures 472
Global Precipitation 473
FOCUS ON A SPECIAL TOPIC 17.1
Precipitation Extremes 476
Climatic Classification 477
The Ancient Greeks 477
The Köppen System 477
Thornthwaite’s System 477
The Global Pattern of Climate 478
Tropical Moist Climates (Group A) 478
Dry Climates (Group B) 484
Moist Subtropical Mid-Latitude Climates (Group C) 486
FOCUS ON AN OBSERVATION 17.2
A Desert with Clouds and Drizzle 487
FOCUS ON A SPECIAL TOPIC 17.3
When Does a Dry Spell Become a Drought? 490
Moist Continental Climates (Group D) 490
Polar Climates (Group E) 493
FOCUS ON AN ENVIRONMENTAL ISSUE 17.4
Are Plant Hardiness Zones Shifiting Northward? 496
Highland Climates (Group H) 497
Summary 498
Key Terms 498
Questions for Review 498
Questions for Thought 499
Problems and Exercises 499
CH aP ter 18
Earth’s Changing Climate 501
Reconstructing Past Climates 502
Climate Throughout the Ages 504
Temperature Trends during the Past 1000 Years 505
FOCUS ON A SPECIAL TOPIC 18.1
The Ocean’s Influence on Rapid Climate Change 506
Temperature Trends during the Past 100-Plus Years 507
Climate Change Caused by Natural Events 508
Climate Change: Feedback Mechanisms 508
Climate Change: Plate Tectonics, and Mountain Building 509
Climate Change: Variations in Earth’s Orbit 511
Climate Change: Variations in Solar Output 514
Climate Change: Atmospheric Particles 514
Climate Change Caused by Human (Anthropogenic) Activities 516
Climate Change: Aerosols Injected into the Lower Atmosphere 516
Climate Change: Greenhouse Gases 517
Climate Change: Land Use Changes 517
FOCUS ON AN ENVIRONMENTAL ISSUE 18.2
Nuclear Winter, Cold Summers, and Dead Dinosaurs 518
Climate Change: Global Warming 519
Recent Global Warming: Perspective 519
FOCUS ON A SPECIAL TOPIC 18.3
The Sahel—An Example of Climatic Variability and Human Existence 520
FOCUS ON AN ENVIRONMENTAL ISSUE 18.4
The Extremes of 2011 and 2012: Did Climate Change Play a Role? 521
Future Climate Change: Projections 522
FOCUS ON A SPECIAL TOPIC 18.5
Climate Models—A Quick Glance 524
Consequences of Climate Change: The Possibilities 527
FOCUS ON AN ENVIRONMENTAL ISSUE 18.6
Ozone and the Ozone Hole: Their Influence on Climate Change 527
Climate Change: Efforts to Curb 530
Summary 532
Key Terms 532
Questions for Review 532
Questions for Thought 533
Problems and Exercises 533
CH aP ter 19
Air Pollution 535
A Brief History of Air Pollution 536 Types and Sources of Air Pollutants 537
FOCUS ON AN ENVIRONMENTAL ISSUE 19.1
Indoor Air Pollution 538
Principal Air Pollutants 540
Ozone in the Troposphere 542
Ozone in the Stratosphere 543
FOCUS ON AN ENVIRONMENTAL ISSUE 19.2
The Ozone Hole 546
Air Pollution: Trends and Patterns 547
Factors That Affect Air Pollution 550
The Role of the Wind 550
The Role of Stability and Inversions 550
FOCUS ON SPECIAL TOPIC 19.3
Smokestack Plumes 553
The Role of Topography 554
Severe Air Pollution Potential 554
FOCUS ON AN OBSERVATION 19.4
Five Days in Donora—An Air Pollution Episode 556
Air Pollution and the Urban Environment 556
FOCUS ON SOCIAL AND ECONOMIC IMPACT 19.5
Heat Waves and Air Pollution: A Deadly Team 558
Acid Deposition 559
Summary 561
Key Terms 561
Questions for Review 561
Questions for Thought 562
Problems and Exercises 562
CH aP ter 20
Light, Color, and Atmospheric
Optics 565
White and Colors 566
Scattered Light 566
Blue Skies and Hazy Days 566
White Clouds and Dark Bases 567
Crepuscular and Anticrepuscular Rays 569
Red Suns and Blue Moons 569
Twinkling, Twilight, and the Green Flash 571
The Mirage: Seeing Is Not Believing 573
FOCUS ON AN OBSERVATION 20.1
The Fata Morgana 575
Halos, Sundogs, and Sun Pillars 575
Rainbows 578
Coronas, Glories, and Heiligenschein 581
FOCUS ON AN OBSERVATION 20.2
Can It Be a Rainbow If It Is Not Raining? 581
Summary 584
Key Terms 584
Questions for Review 584
Questions for Thought 585
Problems and Exercises 585
a PP eNd IX a
Units, Conversions, Abbreviations, and Equations A-1
aPP eNd IX B
Weather Symbols and the Station Model A-4
aPP eNd IX C
Global Average Annual Precipitation A-6
Glossary G-1
Additional Reading Material R-1
Index I-1
P re FaCe
The world is an ever-changing picture of naturally occurring events. From drought and famine to devastating floods, some of the greatest challenges we face come in the form of natural disasters created by weather. Yet dealing with weather and climate is an inevitable part of our lives. Sometimes it is as small as deciding what to wear for the day or how to plan a vacation. But it can also have life-shattering consequences, especially for those who are victims of a hurricane or a tornado.
Weather has always been front-page news, but in recent years, extreme weather seems to receive an ever-increasing amount of coverage. From the record-setting tornadoes of 2011 to widespread drought in 2012 and the devastation wrought by Hurricane/Superstorm Sandy late that year, weather has enormous impact on our lives. The longer-term challenges of an evolving climate also demand our attention, whether it be rising sea levels, near-record global temperatures, intensified downpours, or the retreat of Arctic sea ice. Thanks in part to the rise of social media, more people than ever are sharing their weather-related observations, impressions, and photographs with the world at large. For these and many other reasons, interest in meteorology (the study of the atmosphere) continues to grow. One of the reasons that meteorology is such an engaging science to study is that the atmosphere is a universally accessible laboratory for everyone. Although the atmosphere will always provide challenges for us, as research and technology advance, our ability to understand and predict our atmosphere improves as well. We hope this book serves to assist you as you develop your own personal understanding and appreciation of our planet’s dynamic, spectacular atmosphere.
About This Book
Meteorology Today is written for college-level students taking an introductory course on the atmospheric environment. As was the case in previous editions, no special prerequisites are necessary. The main purpose of the text is to convey meteorological concepts in a visual and practical manner, while simultaneously providing students with a comprehensive background in basic meteorology. This eleventh edition includes up-to-date information on important topics, including climate change, ozone depletion, and El Niño. Also included are discussions of high-profile weather events, such as droughts, heat waves, tornado outbreaks, and hurricanes of recent years.
Written expressly for the student, this book emphasizes the understanding and application of meteorological principles. The text encourages watching the weather so that it becomes “alive,” allowing readers to immediately apply textbook material to the world around them. To assist with this endeavor, a color Cloud
Chart appears at the end of this text. The Cloud Chart can be separated from the book and used as a learning tool any place where one chooses to observe the sky. Numerous full-color illustrations and photographs illustrate key features of the atmosphere, stimulate interest, and show how exciting the study of weather can be.
After an introductory chapter on the composition, origin, and structure of the atmosphere, the book covers energy, temperature, moisture, precipitation, and winds. Next come chapters that deal with air masses and middle-latitude cyclones, followed by weather prediction and severe storms, including a newly separated and enlarged chapter devoted to tornadoes. Wrapping up the book are chapters on hurricanes, global climate, climate change, air pollution, and atmospheric optics.
This book is structured to provide maximum flexibility to instructors of atmospheric science courses, with chapters generally designed so that they can be covered in any desired order. For example, the chapter on atmospheric optics, Chapter 20, is self-contained and can be covered before or after any chapter. Instructors, then, are able to tailor this text to their particular needs.
Each chapter contains at least two Focus sections, which expand on material in the main text or explore a subject closely related to what is being discussed. Focus sections fall into one of five distinct categories: Observations, Special Topics, Environmental Issues, Advanced Topics, and Social and Economic Impacts. Some include material that is not always found in introductory meteorology textbooks, such as temperature extremes, cloud seeding, and the weather on other planets. Others help to bridge theory and practice. Focus sections new to this edition include “The Challenge of Predicting El Niño and La Niña” (Chapter 10), “The Forecast Funnel” and “The Forecast in Words and Pictures” (Chapter 13), “The Evolution of Tornado Watches and Warnings” (Chapter 15), and “Are Plant Hardiness Zones Shifting Northward?” (Chapter 17). Quantitative discussions of important equations, such as the geostrophic wind equation and the hydrostatic equation, are found in Focus sections on advanced topics.
Set apart as “Weather Watch” features in each chapter is weather information that may not be commonly known, yet pertains to the topic under discussion. Designed to bring the reader into the text, most of these weather highlights relate to some interesting weather fact or astonishing event.
Each chapter incorporates other effective learning aids:
● A major topic outline begins each chapter.
● Interesting introductory pieces draw the reader naturally into the main text.
● Important terms are boldfaced, with their definitions appearing in the glossary or in the text.
● Key phrases are italicized.
● English equivalents of metric units in most cases are immediately provided in parentheses.
PreFaCe
● A brief review of the main points is placed toward the middle of most chapters.
● Each chapter ends with a summary of the main ideas.
● A list of key terms with page references follows each chapter, allowing students to review and reinforce their know1edge of key concepts.
● Questions for Review act to check how well students assimilate the material.
● Questions for Thought require students to synthesize learned concepts for deeper understanding.
● Problems and Exercises require mathematical calculations that provide a technical challenge to the student.
● References to more than 15 Concept Animations are spread throughout the chapters. These animations (several of which are new) convey an immediate appreciation of how a process works and help students visualize the more difficult concepts in meteorology. Animations can be found in MindTap, accessed through CengageBrain.com.
● At the end of each chapter are questions that relate to articles found on the Global Geoscience Watch website available on its own or via MindTap.
Three appendices conclude the book. In addition, at the end of the book, a compilation of supplementary reading material is presented, as is an extensive glossary.
New to this edition are Online Appendices that allow students access to a wide variety of supplemental material, including tools for weather prediction and background on watches, warnings, and advisories.
On the endsheet at the back of the book is a geophysical map of North America. The map serves as a quick reference for locating states, provinces, and geographical features, such as mountain ranges and large bodies of water.
Supplemental Material and Technology Support
teCHNology For tHe INStrUCtor Cognero Test Bank/ Cengage Learning Testing Powered by Cognero is a flexible, online system that allows you to:
● Author, edit, and manage test bank content from multiple Cengage Learning solutions
● Create multiple test versions in an instant
● Deliver tests from your LMS, your classroom, or wherever you want
Instructor’s Companion Site Everything you need for your course in one place! This collection of book-specific lecture and class tools is available online via www .cengage.com/login. Access and download PowerPoint presentations, images, instructor’s manual, videos, and more.
global geoscience Watch Updated several times a day, the Global Geoscience Watch is an ideal one-stop site for classroom discussion and research projects for all things geoscience. Broken into the four key course areas (Geography, Geology, Meteorology, and Oceanography), you can easily get to the most relevant content available for your course. You and your students will have access to the latest information from trusted academic journals, news outlets, and magazines. You also will receive access to statistics, primary sources, case studies, podcasts, and much more.
te CHNology F or t H e St U de Nt MindTap Meteorology is a new approach to highly personalized online learning. Beyond an eBook, homework solution, digital supplement, or premium website, MindTap is a digital learning platform that works alongside your campus LMS to deliver course curriculum across the range of electronic devices in your life. MindTap is built on an “app” model allowing enhanced digital collaboration and delivery of engaging content across a spectrum of Cengage and non-Cengage resources.
A Workbook/Study Guide written by Don Ahrens, first author of this book, reinforces concepts learned in Meteorology Today, Eleventh Edition. Each chapter contains a summary of the text, a list of important concepts, self-tests with answers (which include multiple choice, true/false, matching, short answer, and/ or fill in the blank), and a list of additional readings.
Changes in the Eleventh Edition
This edition of Meteorology Today includes a coauthor— meteorologist and science journalist Robert Henson. For more than 20 years, Henson has produced publications and websites for the University Corporation for Atmospheric Research, which manages the National Center for Atmospheric Research. He is an expert on severe weather, including tornadoes, thunderstorms, and hurricanes. He has also analyzed how television weathercasters cover major storms and report on climate change. Henson is the author of four trade books on meteorology, including The Thinking Person’s Guide to Climate Change (previously The Rough Guide to Climate Change, whose first edition was shortlisted for the United Kingdom’s Royal Society Prize for Science Books).
The authors have carried out extensive updates and revisions to this eleventh edition of Meteorology Today, reflecting the
ever-changing nature of the field and the atmosphere itself. More than 65 new or revised color illustrations and more than 45 new photos have been added to help visualize the excitement of the atmosphere.
● Chapter 1, “Earth and Its Atmosphere,” continues to serve as a broad overview of the atmosphere. Material that puts meteorology in the context of the scientific method is now presented in the text, laying the foundation for the rest of the book.
● Chapter 2, “Energy: Warming Earth and the Atmosphere,” includes updated information on greenhouse gases and their influence on global warming, a topic covered in more detail later in the book. The discussion of space weather now appears in a Focus section.
● Chapter 3, “Seasonal and Daily Temperatures,” has been restructured so that the material on extreme high and low temperatures is now included in the main narrative.
● Chapter 4, “Atmospheric Humidity,” continues to convey important concepts related to how humidity is expressed and atmospheric moisture content is measured.
● Chapter 5, “Condensation: Dew, Fog, and Clouds,” spotlights one of the most recently recognized cloud types (asperatus undulatus) and features updated information on satellites, including the Global Precipitation Measurement (GPM) mission.
● Chapter 6, “Stability and Cloud Development,” discusses atmospheric stability and instability and the resulting effects on cloud formation in a carefully sequenced manner, with numerous illustrations and several Focus sections helping to make these complex concepts understandable.
● “Precipitation” (Chapter 7) includes coverage of the highimpact Atlanta snowstorm of 2014 and other recent snow and ice events, as well as expanded discussion of snow measurement techniques.
● Chapter 8, “Air Pressure and Winds,” includes a substantially enhanced description and revised illustrations of the interplay between the pressure gradient and Coriolis forces in cyclonic and anticylonic flow. Several other illustrations have been revised for clarity.
● Chapter 9, “Wind: Small-Scale and Local Systems,” includes several revised illustrations and a number of other updates, including new discussion of such observing systems as sonic anemometers and dropsondes. The Focus section on wind energy has also been updated.
● Chapter 10, “Wind: Global Systems,” features a major restructuring, update, and expansion of sections dealing with the El Niño/Southern Oscillation, Pacific Decadal Oscillation, North Atlantic Oscillation, and Arctic Oscillation. A
new Focus section explains how El Niño and La Niña forecasts are produced.
● In Chapter 11, “Air Masses and Fronts,” the concept of atmospheric rivers is now introduced, and a number of illustrations have been revised for clarity.
● With minor revisions, Chapter 12, “Middle Latitude Cyclones,” continues to provide a thorough and accessible introduction to this important topic.
● Chapter 13, “Weather Forecasting,” has undergone a major revision. Two new Focus sections introduce the student to the forecast-funnel concept and the ways in which forecasts are communicated verbally and pictorially. The narrative has been restructured so that the student moves from traditional types of weather forecasting to numerical weather prediction. In addition, an exercise that takes students through the forecasting process now incorporates forecast-funnel concepts.
● Due to strong interest among students, and at the suggestion of a number of reviewers, the previous single chapter on thunderstorms and tornadoes has been expanded into two chapters, each one a manageable length. In Chapter 14, “Thunderstorms,” the discussions of such topics as microbursts, heat bursts, and record hailstones have been updated, and the Washington, D.C., derecho of 2012 has been included. Both low- and high-precipitation supercells are introduced, and capping inversions are discussed at greater length. Chapter 15, “Tornadoes,” includes a new Focus section on the evolution of tornado watches and warnings, as well as background on the devastating Oklahoma tornadoes of 2013. Storm chasing is discussed in the context of the VORTEX and VORTEX2 field campaigns and the tragic deaths of several storm researchers in 2013. Both Chapters 14 and 15 include a number of new photographs and illustrations, as well as references to the latest storm-observing technology, including dual-polarization and phased-array radars.
● Chapter 16, “Hurricanes,” includes extensive background on Hurricane/Superstorm Sandy (2012) and Super Typhoon Haiyan (2013), as well as new illustrations depicting storm surge processes and wind-speed probabilities. Several new questions and exercises are also included.
● The order of the next two chapters has been reversed. Chapter 17, “Global Climate,” continues to serve as a standalone unit on global climatology and classification schemes, with updates and revisions reflecting recent data, including the new 1981–2010 United States climate averages. This chapter now includes a new Focus section on the northward movement of United States plant zones.
● Chapter 18, “Earth’s Changing Climate,” has undergone extensive updating to reflect recent developments and
findings, including the Fifth Assessment Report (2013) from the Intergovernmental Panel on Climate Change. Many graphics have been added or updated.
● Chapter 19, “Air Pollution,” reflects a number of updates, including the role of airborne ammonia and particulates as well as recent progress in addressing acid rain and ozone depletion.
● The book concludes with Chapter 20, “Light, Color, and Atmospheric Optics,” which uses exciting photos and art to convey the beauty of the atmosphere.
Acknowledgments
Many people have contributed to this eleventh edition of Meteorology Today. A very special and most grateful thankyou goes to Don Ahrens’ wife, Lita, who indexed and proofread the entire book. Special thanks also go to Charles Preppernau for his care in rendering beautiful artwork and to Judith Chaffin for professional and conscientious proofreading. We are indebted to Janet Alleyn who not only designed the book but, once again, took the photos, art, and manuscript and turned them into a beautiful book. We also thank Stuart Kenter for his conscientious editing. Special thanks go to all the people at Cengage Learning who worked on this edition, especially Aileen Berg, Jake Warde, and Hal Humphrey.
Thanks to our friends who provided photos and to those reviewers who offered comments and suggestions for this edition, including:
Eric Michael Aldrich, University of Missouri
Kim Drager, University of Kansas
Melissa Godeck, SUNY Oneonta
Redina L. Herman, Western Illinois University
Larry Hopper, University of Louisiana at Monroe
Steven Lazarus, Florida Institute of Technology
Victor Meledge-Ade, Metropolitan Community College–Longview
Peter Ray, Florida State University
Rich Schultz, Elmhurst College
Jennifer Sheppard, Moraine Valley Community College
Brent Skeeter, Salisbury University
Mike Smith, Front Range Community College
Kenneth Yanow, Southwestern College
To the Student
Learning about the atmosphere can be a fascinating and enjoyable experience. This book is intended to give you some insight into the workings of the atmosphere. However, for a real appreciation of your atmospheric environment, you must go outside and observe. Although mountains take millions of years to form, a cumulus cloud can develop into a raging thunderstorm in less than an hour. The atmosphere is always producing something new for us to behold. To help with your observations, a color Cloud Chart is at the back of the book for easy reference. Remove it and keep it with you. And remember, all of the concepts and ideas in this book are out there for you to discover and enjoy. Please, take the time to look.
Donald Ahrens and Robert Henson
We live at the bottom of a turbulent ocean of air where rising air can form into clouds composed of water and ice.
Earth and Its Atmosphere
Contents
The Atmosphere and the Scientific Method
Overview of Earth’s Atmosphere
Vertical Structure of the Atmosphere
Weather and Climate
Iwell remember a brilliant red balloon which kept me completely happy for a whole afternoon, until, while I was playing, a clumsy movement allowed it to escape. Spellbound, I gazed after it as it drifted silently away, gently swaying, growing smaller and smaller until it was only a red point in a blue sky. At that moment I realized, for the first time, the vastness above us: a huge space without visible limits. It was an apparent void, full of secrets, exerting an inexplicable power over all the earth’s inhabitants. I believe that many people, consciously or unconsciously, have been filled with awe by the immensity of the atmosphere. All our knowledge about the air, gathered over hundreds of years, has not diminished this feeling.
Theo Loebsack, Our Atmosphere
Our atmosphere is a delicate life-giving blanket of air that surrounds the fragile Earth. In one way or another, it influences everything we see and hear—it is intimately connected to our lives. Air is with us from birth, and we cannot detach ourselves from its presence. In the open air, we can travel for many thousands of kilometers in any horizontal direction, but should we move a mere eight kilometers above the surface, we would suffocate. We may be able to survive without food for a few weeks, or without water for a few days, but, without our atmosphere, we would not survive more than a few minutes. Just as fish are confined to an environment of water, so we are confined to an ocean of air. Anywhere we go, air must go with us.
Earth without an atmosphere would have no lakes or oceans. There would be no sounds, no clouds, no red sunsets. The beautiful pageantry of the sky would be absent. It would be unimaginably cold at night and unbearably hot during the day. All things on Earth would be at the mercy of an intense sun beating down upon a planet utterly parched.
Living on the surface of Earth, we have adapted so completely to our environment of air that we sometimes forget how truly remarkable this substance is. Even though air is tasteless, odorless, and (most of the time) invisible, it protects us from the scorching rays of the sun and provides us with a mixture of gases that allows life to flourish. Because we cannot see, smell, or taste air, it may seem surprising that between your eyes and the pages of this book are trillions of air molecules. Some of these may have been in a cloud only yesterday, or over another continent last week, or perhaps part of the life-giving breath of a person who lived hundreds of years ago.
In this chapter, we will examine a number of important concepts and ideas about Earth’s atmosphere, many of which will be expanded in subsequent chapters.
The Atmosphere and the Scientific Method
Our understanding of the atmosphere and how it produces weather is built on knowledge acquired and applied through the scientific method. This technique allows us to make informed predictions about how the natural world will behave. For hundreds of years, the scientific method has served as the backbone for advances in medicine, biology, engineering, and many other fields. In the field of atmospheric science, the scientific method has paved the way for the production of weather forecasts that have steadily improved over time.
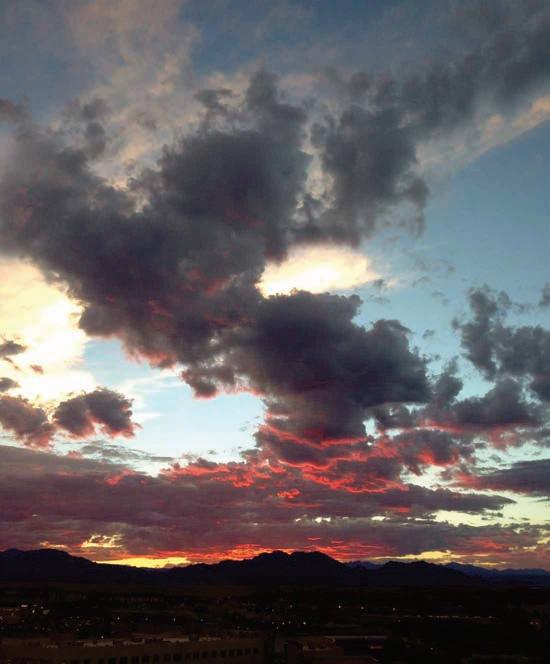
Investigators use the scientific method by posing a question, putting forth a hypothesis, predicting what the hypothesis would imply if it were true, and carrying out tests to see if the prediction is accurate. Many common sayings about the weather, such as “red sky at morning, sailor take warning; red sky at night, sailor’s delight,” are rooted in careful observation, and there are grains of truth in some of them. However, they are not considered to be products of the scientific method because they are not tested and verified in a standard rigorous way. (See Fig. 1.1.)
To be accepted, a hypothesis* has to be shown to be correct through a series of quantitative tests. In many areas of science, such testing is carried out in a laboratory, where it can be replicated again and again. Studying the atmosphere, however, is somewhat different, because Earth has only one atmosphere. Despite this limitation, scientists have made vast progress by studying the physics and chemistry of air in the laboratory (for instance, the way in which molecules absorb energy) and by extending those understandings to the atmosphere as a whole. Observations using weather instruments allow us to quantify how the atmosphere behaves and to determine whether a prediction is correct. If a particular kind of weather is being studied, such as hurricanes or snowstorms, a field campaign can gather additional observations to test specific hypotheses.
Over the last 50 years, computers have given atmospheric scientists a tremendous boost. The physical laws that control atmospheric behavior can be represented in software packages known as numerical models. Forecasts can be made and tested many times over. The atmosphere within a model can be used to depict weather conditions from the past and project them into the future. When a model can accurately simulate past weather conditions and provide confidence in its portrayal of tomorrow’s weather, the model can provide valuable information about the weather and climate we may expect decades from now.
Overview of Earth’s Atmosphere
The scientific method has not only illuminated our understanding of weather and climate but also provided much information about the universe that surrounds us. The universe contains billions of galaxies and each galaxy is made up of billions of stars. Stars are hot glowing balls of gas that generate energy by converting hydrogen into helium near their centers. Our sun is an average-sized star
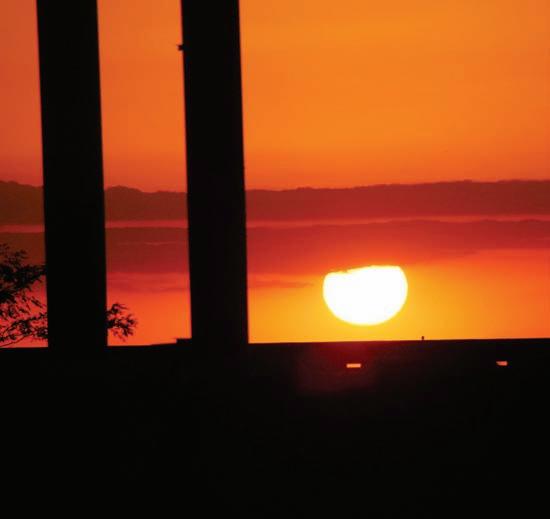
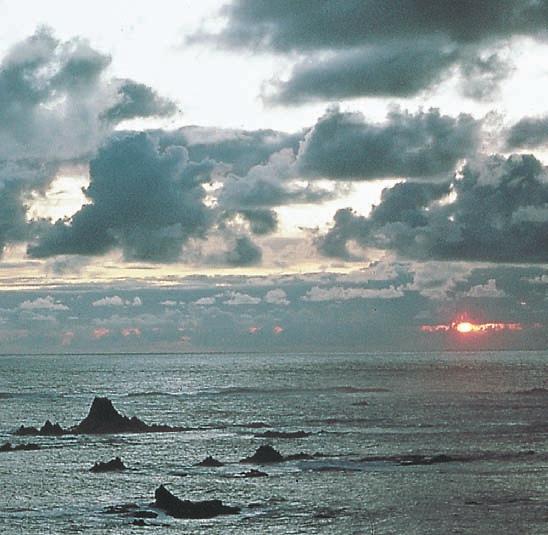
FIGURE 1.1 Observing the natural world is a critical part of the scientific method. Here a vibrant red sky is visible at sunset. One might use the scientific method to verify the old proverb, “Red sky at morning, sailors take warning; red sky at night, sailor’s delight.”
A hypothesis is an assertion that is subject to verification of proof.
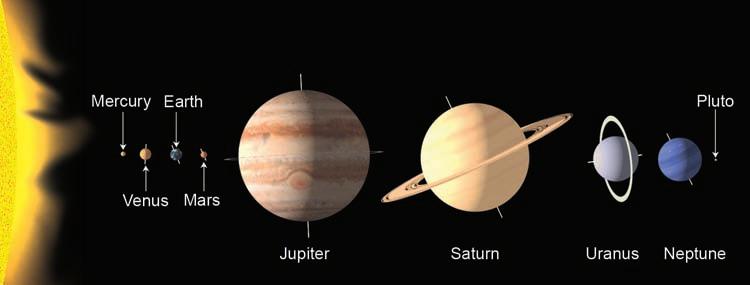
situated near the edge of the Milky Way galaxy. Revolving around the sun are Earth and seven other planets (see Fig. 1.2).* These planets, along with a host of other material (comets, asteroids, meteors, dwarf planets, etc.), comprise our solar system.
Warmth for the planets is provided primarily by the sun’s energy. At an average distance from the sun of nearly 150 million kilometers (km) or 93 million miles (mi), Earth intercepts only a very small fraction of the sun’s total energy output. However, it is this radiant energy (or radiation)** that drives the atmosphere into the patterns of everyday wind and weather and allows Earth to maintain an average surface temperature of about 15°C (59°F).† Although this temperature is mild, Earth experiences a wide range of temperatures, as readings can drop below –85°C (–121°F) during a frigid Antarctic night and climb, during the day, to above 50°C (122°F) on the oppressively hot subtropical desert.
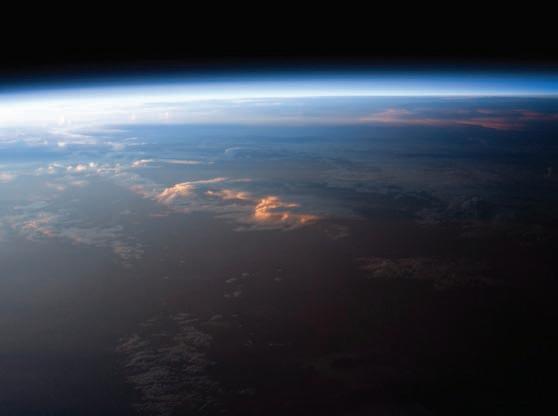
Earth’s atmosphere is a relatively thin, gaseous envelope comprised mostly of nitrogen and oxygen, with small amounts of other gases, such as water vapor and carbon dioxide. Nestled in the atmosphere are clouds of liquid water and ice crystals. Although our atmosphere extends upward for many hundreds of kilometers, it gets progressively thinner with altitude. Almost 99 percent of the atmosphere lies within a mere 30 km (19 mi) of Earth’s surface (see Fig. 1.3). In fact, if Earth were to shrink to the size of a beach ball, its inhabitable atmosphere would be thinner than a piece of paper. This thin blanket of air constantly shields the surface and its inhabitants from the sun’s dangerous ultraviolet radiant energy, as well as from the onslaught of material from interplanetary space. There is no definite upper limit to the atmosphere; rather, it becomes thinner and thinner, eventually merging with empty space, which surrounds all the planets.
THE EARLY ATMOSPHERE The atmosphere that originally surrounded Earth was probably much different from the air we breathe today. Earth’s first atmosphere (some 4.6 billion years ago)
*Pluto was once classified as a true planet. But recently it has been reclassified as a planetary object called a dwarf planet.
**Radiation is energy transferred in the form of waves that have electrical and magnetic properties. The light that we see is radiation, as is ultraviolet light. More on this important topic is given in Chapter 2.
†The abbreviation °C is used when measuring temperature in degrees Celsius, and °F is the abbreviation for degrees Fahrenheit. More information about temperature scales is given in Appendix A and in Chapter 2.
was most likely hydrogen and helium—the two most abundant gases found in the universe—as well as hydrogen compounds, such as methane (CH4) and ammonia (NH3). Most scientists believe that this early atmosphere escaped into space from Earth’s hot surface.
A second, more dense atmosphere, however, gradually enveloped Earth as gases from molten rock within its hot interior escaped through volcanoes and steam vents. We assume that volcanoes spewed out the same gases then as they do today: mostly water vapor (about 80 percent), carbon dioxide (about 10 percent), and up to a few percent nitrogen. These gases (mostly water vapor and carbon dioxide) probably created Earth’s second atmosphere.
As millions of years passed, the constant outpouring of gases from the hot interior—known as outgassing—provided a rich supply of water vapor, which formed into clouds. (It is also believed that when Earth was very young, some of its water may have originated from numerous collisions with small meteors that pounded Earth, as well as from disintegrating comets.) Rain fell upon Earth for many thousands of years, forming the rivers, lakes, and oceans of the world. During this time, large amounts of carbon dioxide (CO2) were dissolved in the oceans.
Earth’s atmosphere as viewed from space. The atmosphere is the thin bluish-white region along the edge of Earth. The photo was taken from the International Space Station on April 12, 2011, over western South America.
▼ Table 1.1 Composition of the Atmosphere near the Earth’s Surface
XenonXe 0.000009 Chlorofluorocarbons (CFCs) and hydrofluorocarbons (HFCs)
*For CO2, 400 parts per million means that out of every million air molecules, 400 are CO2 molecules.
†Stratospheric values at altitudes between 11 km and 50 km are about 5 to 12 ppm.
Through chemical and biological processes, much of the CO2 became locked up in carbonate sedimentary rocks, such as limestone. With much of the water vapor already condensed and the concentration of CO2 dwindling, the atmosphere gradually became rich in molecular nitrogen (N2), which is usually not chemically active.
It appears that molecular oxygen (O2), the second most abundant gas in today’s atmosphere, probably began an extremely slow increase in concentration as energetic rays from the sun split water vapor (H2O) into hydrogen and oxygen during a process called photodissociation. The hydrogen, being lighter, probably rose and escaped into space, while the oxygen remained in the atmosphere.
This slow increase in oxygen may have provided enough of this gas for primitive plants to evolve, perhaps 2 to 3 billion years ago. Or the plants may have evolved in an almost oxygen-free (anaerobic) environment. At any rate, plant growth greatly enriched our atmosphere with oxygen. The reason for this enrichment is that, during the process of photosynthesis, plants, in the presence of sunlight, combine carbon dioxide and water to produce oxygen. Hence, after plants evolved, the atmospheric oxygen content increased more rapidly, probably reaching its present composition about several hundred million years ago.
COMPOSITIO n OF TO dAY’S ATMOSPHERE ▼ Table 1.1 shows the various gases present in a volume of air near Earth’s surface. Notice that molecular nitrogen (N2) occupies about 78 percent and molecular oxygen (O2) about 21 percent of the total volume of dry air. If all the other gases are removed, these percentages for nitrogen and oxygen hold fairly constant up to an elevation of about 80 km (50 mi). (For a closer look at the composition of a breath of air at Earth’s surface, read Focus section 1.1.)
At the surface, there is a balance between destruction (output) and production (input) of these gases. For example, nitrogen is removed from the atmosphere primarily by biological
processes that involve soil bacteria. In addition, nitrogen is taken from the air by tiny ocean-dwelling plankton that convert it into nutrients that help fortify the ocean’s food chain. It is returned to the atmosphere mainly through the decaying of plant and animal matter. Oxygen, on the other hand, is removed from the atmosphere when organic matter decays and when oxygen combines with other substances, producing oxides. It is also taken from the atmosphere during breathing, as the lungs take in oxygen and release carbon dioxide (CO2). The addition of oxygen to the atmosphere occurs during photosynthesis, as plants, in the presence of sunlight, combine carbon dioxide and water to produce sugar and oxygen.
The concentration of the invisible gas water vapor (H2O), however, varies greatly from place to place, and from time to time. Close to the surface in warm, steamy, tropical locations, water vapor may account for up to 4 percent of the atmospheric gases: whereas in colder arctic areas, its concentration may dwindle to a mere fraction of a percent (see Table 1.1). Water vapor molecules are, of course, invisible. They become visible only when they transform into larger liquid or solid particles, such as cloud droplets and ice crystals, which may grow in size and eventually fall to Earth as rain or snow. The changing of water vapor into liquid water is called condensation, whereas the process of liquid water becoming water vapor is called evaporation. The falling rain and snow is called precipitation. In the lower atmosphere, water is everywhere. It is the only substance that exists as a gas, a liquid, and a solid at those temperatures and pressures normally found near Earth’s surface (see Fig. 1.4).
Water vapor is an extremely important gas in our atmosphere. Not only does it form into both liquid and solid cloud particles that grow in size and fall to Earth as precipitation, but it also releases large amounts of heat—called latent heat—when it changes from vapor into liquid water or ice. Latent heat is an important source of atmospheric energy, especially for storms, such as thunderstorms and hurricanes. Moreover, water vapor
A Breath of Fresh Air
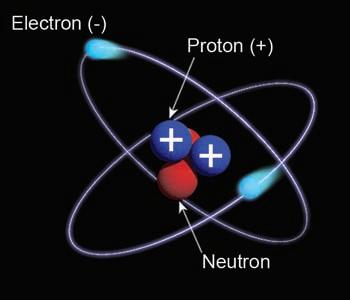
If we could examine a breath of air, we would see that air (like everything else in the universe) is composed of incredibly tiny particles called atoms. We cannot see atoms individually with the naked eye. Yet, if we could see one, we would find electrons whirling at fantastic speeds about an extremely dense center, somewhat like hummingbirds darting and circling about a flower. At this center, or nucleus, are the protons and neutrons. Almost all of the atom’s mass is concentrated here, in a trillionth of the atom’s entire volume. In the nucleus, the proton carries a positive charge, whereas the neutron is electrically neutral. The circling electron carries a negative charge. As long as the total number of protons in the nucleus equals the number of orbiting electrons, the atom as a whole is electrically neutral (see Fig. 1).
Most of the air particles are molecules, combinations of two or more atoms (such as nitrogen, N2, and oxygen, O2), and most of the molecules are electrically neutral. A few, however, are electrically charged, having lost or gained electrons. These charged atoms and molecules are called ions.
An average breath of fresh air contains a tremendous number of molecules. With every deep breath, trillions of molecules from the atmosphere enter your body. Some of these inhaled gases become a part of you, and others are exhaled.
The volume of an average size breath of air is about a liter.* Near sea level, there are roughly ten thousand million million million (1022)* air molecules in a liter. So,
1 breath of air 5 1022 molecules
We can appreciate how large this number is when we compare it to the number of stars in the universe. Astronomers estimate that there are about 500 billion (1011) stars in the Milky Way, which is considered to be an average sized galaxy, and that there may be more than 1011 galaxies in the universe. To determine the total number of stars in the universe, we multiply the average number of stars in a galaxy by the total number of galaxies and obtain (5 x 10¹¹) 3 1011 5 5 x 10²² stars in the universe
*One cubic centimeter is about the size of a sugar cube, and there are a thousand cubic centimeters in a liter.
**The notation 1022 means the number one followed by twenty-two zeros. For a further explanation of this system of notation see Appendix A.
is a potent greenhouse gas because it strongly absorbs a portion of Earth’s outgoing radiant energy (somewhat like the glass of a greenhouse prevents the heat inside from escaping and mixing with the outside air). This trapping of heat energy close to Earth’s surface—called the greenhouse effect—keeps the average air temperature near the surface much warmer than it would be otherwise.* Thus, water vapor plays a significant role in Earth’s heat-energy balance.
Carbon dioxide (CO2), a natural component of the atmosphere, occupies a small (but important) percent of a volume of air, about 0.04 percent. Carbon dioxide enters the atmosphere mainly from the decay of vegetation, but it also comes from
*A more detailed look at the greenhouse effect is presented in Chapter 2.
Therefore, just a few breaths of air contain about as many molecules as there are stars in the known universe.
In the entire atmosphere, there are nearly 10 44 molecules. The number 10 44 is 1022 squared; consequently
1022 3 1022 5 10 44 molecules in the atmosphere
We thus conclude that there are about 1022 breaths of air in the entire atmosphere. In other words, there are as many molecules in a single breath as there are breaths in the atmosphere.
Each time we breathe, the molecules we exhale enter the turbulent atmosphere. If we wait a long time, those molecules will eventually become thoroughly mixed with all of the other air molecules. If none of the molecules were consumed in other processes, eventually there would be a molecule from that single breath in every breath that is out there. So, considering the many breaths people exhale in their lifetimes, it is possible that in our lungs are molecules that were once in the lungs of people who lived hundreds or even thousands of years ago. In a very real way then, we all share the same atmosphere.
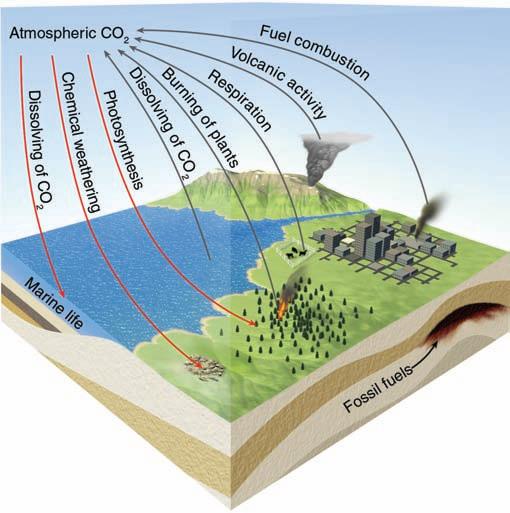
volcanic eruptions, the exhalations of animal life, from the burning of fossil fuels (such as coal, oil, and natural gas), and from deforestation. The removal of CO2 from the atmosphere takes place during photosynthesis, as plants consume CO2 to produce green matter. The CO2 is then stored in roots, branches, and leaves. Rain and snow can react with silicate minerals in rocks and remove CO2 from the atmosphere through a process known as chemical weathering. The oceans act as a huge reservoir for CO2, as phytoplankton (tiny drifting plants) in surface water fix CO2 into organic tissues. Carbon dioxide that dissolves directly into surface water mixes downward and circulates through greater depths. Estimates are that the oceans hold more than 50 times the total atmospheric CO2 content. Figure 1.5 illustrates important ways carbon dioxide enters and leaves the atmosphere.
FIGURE 1 An atom has neutrons and protons at its center with electrons orbiting this center (or nucleus). Molecules are combinations of two or more atoms. The air we breathe is mainly molecular nitrogen (N2) and molecular oxygen (O2).
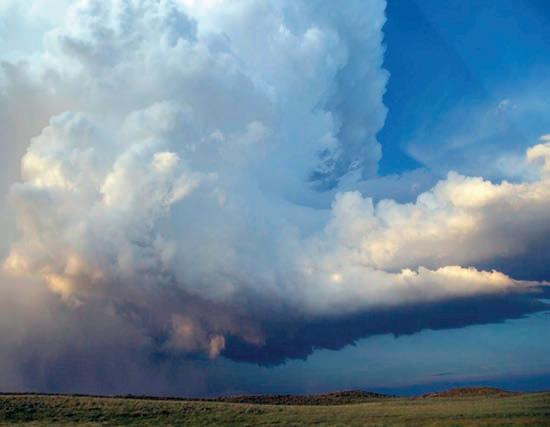
FIGURE 1.4 Earth’s atmosphere is a rich mixture of many gases, with clouds of condensed water vapor and ice crystals. Here, water evaporates from the ocean’s surface. Rising air currents then transform the invisible water vapor into many billions of tiny liquid droplets that appear as puffy cumulus clouds. If the rising air in the cloud should extend to greater heights, where air temperatures are quite low, some of the liquid droplets would freeze into minute ice crystals.
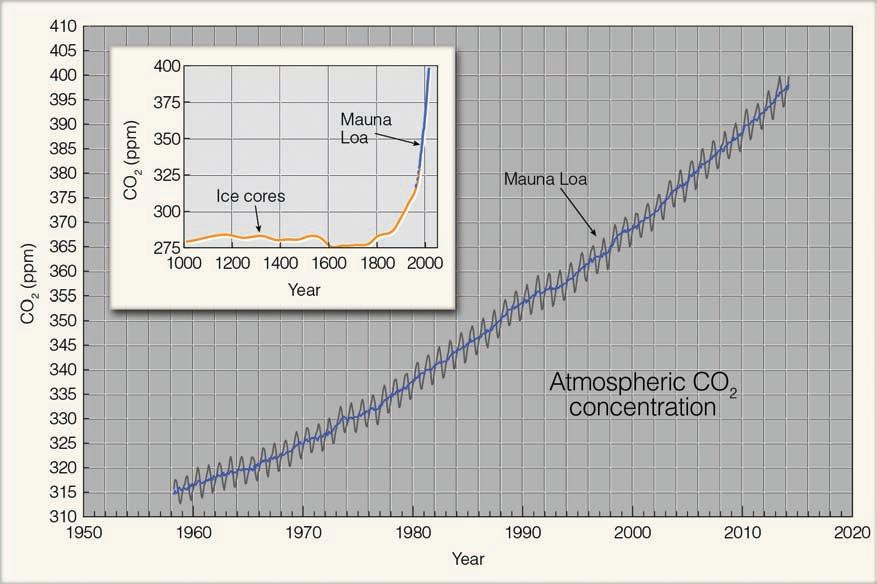
Figure 1.6 reveals that the atmospheric concentration of CO2 has risen by almost 30 percent since 1958, when regular measurements began at Mauna Loa Observatory in Hawaii. This increase means that CO2 is entering the atmosphere at a greater rate than it is being removed. The increase appears to be due mainly to
FIGURE 1.6 (a) The solid blue line shows the average yearly measurements of CO2 in parts per million (ppm) at Mauna Loa Observatory, Hawaii, from 1958 to 2013. The jagged dark line illustrates how higher readings occur in winter where plants die and release CO2 to the atmosphere, and how lower readings occur in summer when more abundant vegetation absorbs CO2 from the atmosphere. (b) The insert shows CO2 values in ppm during the past 1000 years from ice cores in Antarctica (orange line) and from Mauna Loa Observatory (blue line). (Mauna Loa data courtesy of NOAA; Ice Core data courtesy of Carbon Dioxide Information Analysis Center, Oak Ridge National Laboratory)
1.5 The main components of the atmospheric carbon dioxide cycle. The gray lines show processes that put carbon dioxide into the atmosphere, whereas the red lines show processes that remove carbon dioxide from the atmosphere.
the burning of fossil fuels; however, deforestation also plays a role as cut timber, burned or left to rot, releases CO2 directly into the air, perhaps accounting for about 10 to 15 percent of the observed increase in recent years. Measurements of CO2 also come from ice cores. In Greenland and Antarctica, for example, tiny bubbles of air trapped within the ice sheets reveal that before the industrial revolution, CO2 levels were stable at about 280 parts per
million (ppm). (See the insert in Fig. 1.6.) Since the early 1800s, however, CO2 levels have increased more than 40 percent. With CO2 levels presently increasing by more than 0.5 percent annually (2.0 ppm/year), scientists now estimate that the concentration of CO2 will likely rise from its current value of about 400 ppm to a value exceeding 550 ppm by the end of this century, assuming that fossil fuel emissions continue at or above current levels.
Carbon dioxide is another important greenhouse gas because, like water vapor, it traps a portion of Earth’s outgoing energy. Consequently, with everything else being equal, as the atmospheric concentration of CO2 increases, so should the average global surface air temperature. In fact, over the last 100 years or so, Earth’s average surface temperature has warmed by more than 0.8°C (1.4°F). Mathematical climate models that predict future atmospheric conditions estimate that if concentrations of CO2 (and other greenhouse gases) continue to increase at or beyond their present rates, Earth’s surface could warm by an additional 3°C (5.4°F) or more by the end of this century. As we will see in Chapter 18, the negative consequences of this type of climate change (such as rising sea levels and the rapid melting of polar ice) will be felt worldwide.
Carbon dioxide and water vapor are not the only greenhouse gases. Others include methane (CH4), nitrous oxide (N2O) and chlorofluorocarbons (CFCs). On average, methane concentrations have risen about one-half of one percent per year since the 1990s, but the pace has been uneven for reasons now being studied. Most methane appears to derive from the breakdown of plant material by certain bacteria in rice paddies, wet oxygen-poor soil, the biological activity of termites, and biochemical reactions in the stomachs of cows, although some methane is also leaked into the atmosphere by natural gas operations. Levels of nitrous oxide—commonly known as laughing gas—have also been rising annually at the rate of about one-quarter of a percent. As well as being an industrial byproduct, nitrous oxide forms in the soil through a chemical process involving bacteria and certain microbes. Ultraviolet light from the sun destroys nitrous oxide.
Chlorofluorocarbons (CFCs) represent a group of greenhouse gases that, up until the mid-1990s, had been increasing in concentration. At one time, they were the most widely used propellants in spray cans. More recently, they have been used as refrigerants, as propellants for the blowing of plastic-foam insulation, and as solvents for cleaning electronic microcircuits. Although their average concentration in a volume of air is quite small (see Table 1.1, p. 6), CFCs have an important effect on our atmosphere as they not only have the potential for raising global temperatures, they also play a part in destroying the gas ozone in the stratosphere, a region in the atmosphere located between about 11 km and 50 km above Earth’s surface. CFCs are gradually being phased out through a global agreement called the Montreal Protocol. Their main replacements, hydrofluorocarbons (HFCs), do not damage stratospheric ozone, but they are still powerful greenhouse gases.
On Earth’s surface, ozone (O3) is the primary ingredient of photochemical smog,* pollution which irritates the eyes and
*Originally the word smog meant the combining of smoke and fog. Today, however, the word usually refers to the type of smog that forms in large cities, such as Los Angeles, California. Because this type of smog forms when chemical reactions take place in the presence of sunlight, it is termed photochemical smog
WEATHER WATCH
When it rains, it rains pennies from heaven—sometimes. On July 17, 1940, a tornado reportedly picked up a treasure of over 1000 sixteenth-century silver coins, carried them into a thunderstorm, then dropped them on the village of Merchery in the Gorki region of russia.
throat and damages vegetation. But the majority of atmospheric ozone (about 97 percent) is found in the upper atmosphere— in the stratosphere—where it is formed naturally, as oxygen atoms combine with oxygen molecules. Here, the concentration of ozone averages less than 0.002 percent by volume. This small quantity is important, however, because it shields plants, animals, and humans from the sun’s harmful ultraviolet rays. It is ironic that ozone, which damages plant life in a polluted environment, provides a natural protective shield in the upper atmosphere so that plants on the surface may survive.
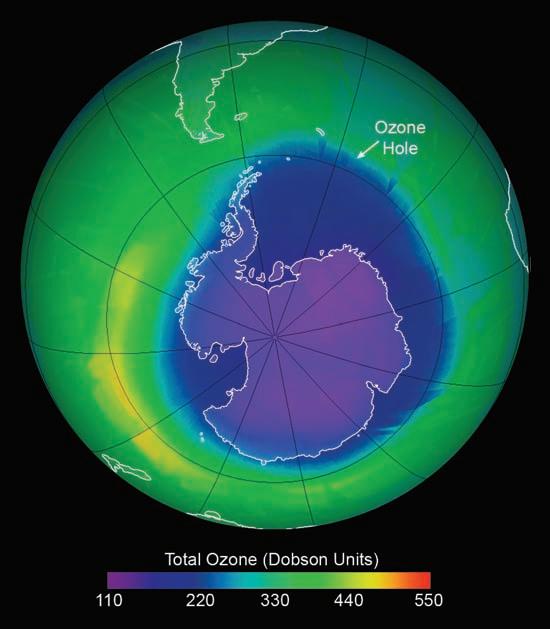
When CFCs enter the stratosphere, ultraviolet rays break them apart, and the CFCs release ozone-destroying chlorine. Because of this effect, ozone concentration in the stratosphere has decreased over parts of the Northern and Southern Hemispheres. Figure 1.7 illustrates the extent of ozone depletion above Antarctica during September 2010. Stratospheric ozone concentrations plummet each year during September and October above Antarctica, to the point where so little ozone is observed
FIGURE 1.7 The darkest color represents the area of lowest ozone concentration, or ozone hole, over the Southern Hemisphere on September 25, 2010. Notice that the hole is larger than the continent of Antarctica. A Dobson unit (DU) is the physical thickness of the ozone layer if it were brought to Earth’s surface, where 500 DU equals 5 millimeters.
that a seasonal ozone hole forms, as shown in Fig. 1.7. (We will examine stratospheric ozone and the Antarctic ozone hole in more detail in Chapter 19.)
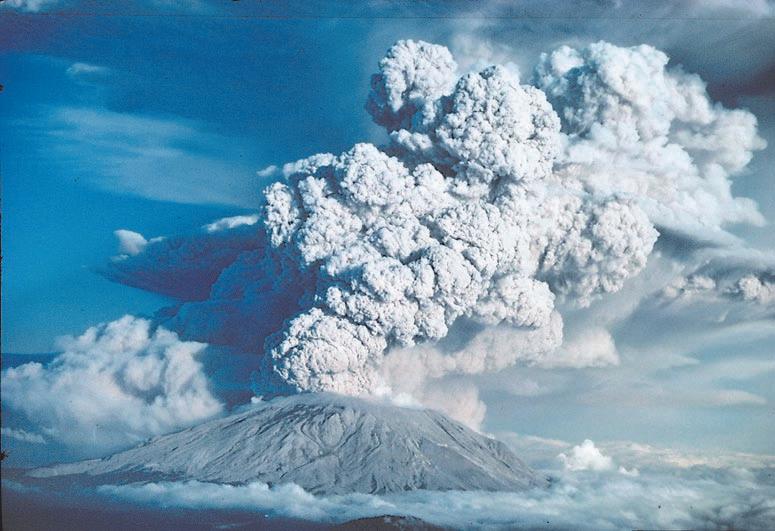
Impurities from both natural and human sources are also present in the atmosphere: Wind picks up dust and soil from Earth’s surface and carries it aloft; small saltwater drops from ocean waves are swept into the air (upon evaporating, these drops leave microscopic salt particles suspended in the atmosphere); smoke from forest fires is often carried high above Earth; and volcanoes spew many tons of fine ash particles and gases into the air (see Fig. 1.8). Collectively, these tiny solid or liquid particles of various composition, suspended in the air, are called aerosols.
Some natural impurities found in the atmosphere are quite beneficial. Small, floating particles, for instance, act as surfaces on which water vapor condenses to form clouds. However, most human-made impurities (and some natural ones) are a nuisance, as well as a health hazard. These we call pollutants. For example, many automobile engines (especially older ones) emit copious amounts of nitrogen dioxide (NO2), carbon monoxide (CO), and hydrocarbons. In sunlight, nitrogen dioxide reacts with hydrocarbons and other gases to produce photochemical smog. Carbon monoxide is a major pollutant of city air. Colorless and odorless, this poisonous gas forms during the incomplete combustion of carbon-containing fuel. Hence, about one-third of carbon monoxide in urban areas comes from road vehicles.
The burning of sulfur-containing fuels (such as coal and oil) releases sulfur gases into the air. When the atmosphere is sufficiently moist, these gases may transform into tiny dilute drops of sulfuric acid. Rain containing sulfuric acid corrodes metals and painted surfaces, and turns freshwater lakes acidic. Acid rain is a major environmental problem, especially downwind from major industrial areas. (More on the acid rain problem is given in Chapter 19.)
BRIEF REVIEW
Before going on to the next several sections, here is a review of some of the important concepts presented so far:
● Earth’s atmosphere is a mixture of many gases. In a volume of dry air near the surface, nitrogen (N2) occupies about 78 percent and oxygen (O2) about 21 percent.
● Water vapor, which normally occupies less than 4 percent in a volume of air near the surface, can condense into liquid cloud droplets or transform into delicate ice crystals. Water is the only substance in our atmosphere that is found naturally as a gas (water vapor), as a liquid (water), and as a solid (ice).
● Both water vapor and carbon dioxide (CO2) are important greenhouse gases.
● Ozone (O3) in the stratosphere protects life from harmful ultraviolet (UV) radiation. At the surface, ozone is the main ingredient of photochemical smog.
● The majority of water on our planet is believed to have come from its hot interior through outgassing, although some of Earth’s water may have come from collisions with meteors and comets.
Vertical Structure of the Atmosphere
When we examine the atmosphere in the vertical, we see that it can be divided into a series of layers. Each layer may be defined in a number of ways: by the manner in which the air temperature varies through it, by the gases that compose it, or even by its electrical properties. At any rate, before we examine these various atmospheric layers, we need to look at the vertical profile of two important atmospheric variables: air pressure and air density.
FIGURE 1.8 Erupting volcanoes can send tons of particles into the atmosphere, along with vast amounts of water vapor, carbon dioxide, and sulfur dioxide.
Earlier in this chapter we learned that most of our atmosphere is crowded close to Earth’s surface. The reason for this fact is that air molecules (as well as everything else) are held near Earth by gravity. This strong, invisible force pulling down on the air squeezes (compresses) air molecules closer together, which causes their number in a given volume to increase. The more air above a level, the greater the squeezing effect or compression.
Gravity also has an effect on the weight of objects, including air. In fact, weight is the force acting on an object due to gravity. Weight is defined as the mass of an object times the acceleration of gravity; thus
weight 5 mass 3 gravity
An object’s mass is the quantity of matter in the object. Consequently, the mass of air in a rigid container is the same everywhere in the universe. However, if you were to instantly travel to the moon, where the acceleration of gravity is much less than that of Earth, the mass of air in the container would be the same, but its weight would decrease.
When mass is given in grams (g) or kilograms (kg), volume is given in cubic centimeters (cm3) or cubic meters (m3). Near sea level, air density is about 1.2 kilograms per cubic meter (nearly 1.2 ounces per cubic foot).
The density of air (or any substance) is determined by the masses of atoms and molecules and the amount of space between them. In other words, density tells us how much matter is in a given space (that is, volume). We can express density in a variety of ways. The molecular density of air is the number of molecules in a given volume. Most commonly, however, density is given as the mass of air in a given volume; thus
density = mass volume
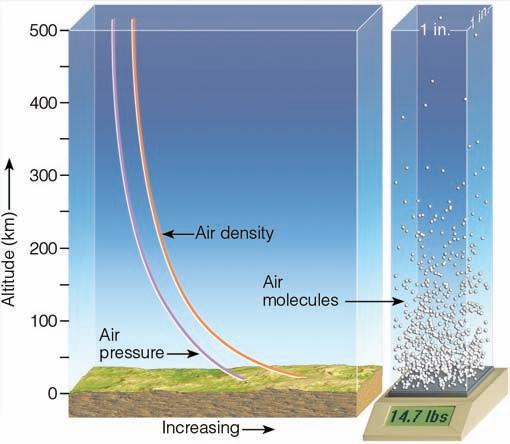
Because there are appreciably more molecules within the same size volume of air near Earth’s surface than at higher levels, air density is greatest at the surface and decreases as we move up into the atmosphere. Notice in Fig. 1.9 that, because air near the surface is compressed, air density normally decreases rapidly at first, then more slowly as we move farther away from the surface.
Air molecules are in constant motion. On a mild spring day near Earth’s surface, an air molecule will collide about 10 billion times each second with other air molecules. It will also bump against objects around it—houses, trees, flowers, the ground, and even people. Each time an air molecule bounces against a person, it gives a tiny push. This small force (push) divided by the area on which it pushes is called pressure; thus
pressure = force area
If we weigh a column of air 1 square inch in cross section, extending from the average height of the ocean surface (sea level) to the “top” of the atmosphere, it would weigh nearly 14.7 pounds (see Fig. 1.9). Thus, normal atmospheric pressure near sea level is close to 14.7 pounds per square inch (14.7 lb/in.2). If more molecules are packed into the column, it becomes more dense, the air weighs more, and the surface pressure goes up. On
surface produces an average pressure near 14.7 lb/in.2
the other hand, when fewer molecules are in the column, the air weighs less, and the surface pressure goes down. So, the surface air pressure can be changed by changing the mass of air above the surface.
Pounds per square inch is, of course, just one way to express air pressure. Presently, the most common unit found on surface weather maps is the millibar (mb)* although the metric equivalent, hectopascal (hPa), is gradually replacing the millibar as the preferred unit of pressure on surface charts. Another unit of pressure is inches of mercury (Hg), which is commonly used in the field of aviation and in weather reports on television, radio, smartphones, and the Internet. At sea level, the standard value for atmospheric pressure is
1013.25 mb 5
1013.25 hPa 5 29.92 in. Hg
Billions of air molecules push constantly on the human body. This force is exerted equally in all directions. We are not crushed by it because billions of molecules inside the body push outward just as hard. Even though we do not actually feel the constant bombardment of air, we can detect quick changes in it. For example, if we climb rapidly in elevation, our ears may “pop.” This experience happens because air collisions outside the eardrum lessen. The popping comes about as air collisions between the inside and outside of the ear equalize. The drop in the number of collisions informs us that the pressure exerted by the air molecules decreases with height above Earth. A similar type of
*By definition, a bar is a force of 100,000 newtons (N) acting on a surface area of 1 square meter (m2). A newton is the amount of force required to move an object with a mass of 1 kilogram (kg) so that it increases its speed at a rate of 1 meter per second (m/ sec) each second. Because the bar is a relatively large unit, and because surface pressure changes are usually small, the unit of pressure most commonly found on surface weather maps is the millibar, where 1 bar 5 1000 mb. The unit of pressure designated by the International System SI (Système International) of measurement is the pascal (Pa), where 1 pascal is the force of 1 newton acting on a surface of 1 square meter. A more common unit is the hectopascal (hPa), as 1 hectopascal equals 1 millibar.
FIGURE 1.9 Both air pressure and air density decrease with increasing altitude. The weight of all the air molecules above Earth’s