List of Contributors
Ingrid Aguiló‐Aguayo, IRTA, Postharvest Pogramme, Edifici Fruitcentre, Parc Científic i Tecnològic Agroalimentari de Lleida, Lleida, Spain
Gerard Aragonès, Universitat Rovira i Virgili, Departament de Bioquímica i Biotecnologia, Nutrigenomics Research Group, Tarragona, Spain
Javier Ávila‐Román, Universitat Rovira i Virgili, Departament de Bioquímica i Biotecnologia, Nutrigenomics Research Group, Tarragona, Spain
Gloria Bobo, IRTA, Postharvest Pogramme, Edifici Fruitcentre, Parc Científic i Tecnològic Agroalimentari de Lleida, Lleida, Spain
Francisca Isabel Bravo, Universitat Rovira i Virgili, Departament de Bioquímica i Biotecnologia, Nutrigenomics Research Group, Tarragona, Spain
América Chávez‐Martínez, Faculty of Zootechnics and Ecology, Autonomous University of Chihuahua, Chihuahua, México
Gemma Echeverria, IRTA, Postharvest Program, Edifici Fruitcentre, Parc Científic i Tecnològic Agroalimentari de Lleida, Lleida, Catalonia, Spain
María Antonia Flores‐Córdova, Faculty of Agrotechnological Sciences, Autonomous University of Chihuahua, Chihuahua, México
Jan Fritsche, Institute of Safety and Quality of Milk and Fish Products, Max Rubner‐Institute, Federal Research Institute of Nutrition and Food, Kiel, Germany
Nirupama Gangopadhyay, Kusuma School of Biological Sciences, Indian Institute of Technology Delhi, New Delhi, India
Marco Garcia‐Vaquero, School of Agriculture and Food Science, University College Dublin, Dublin, Ireland
TEAGASC, Food Research Centre, Dublin, Ireland
Antonia Garrido‐Frenich, Department of Chemistry and Physics, Analytical Chemistry Area, Research Centre for Mediterranean Intensive Agrosystems and Agri‐Food Biotechnology (CIAIMBITAL), Agrifood Campus of International Excellence ceiA3, University of Almería, Almería, Spain
Editha Giese, Institute of Safety and Quality of Milk and Fish Products, Max Rubner‐Institut, Federal Research Institute of Nutrition and Food, Kiel, Germany
Department of Life Sciences, Hamburg University of Applied Sciences (HAW Hamburg), Hamburg, Germany
Jordi Giné‐Bordonaba, IRTA, Postharvest Program, Edifici Fruitcentre, Parc Científic i Tecnològic Agroalimentari de Lleida, Lleida, Catalonia, Spain
Andreu Gual‐Grau, Universitat Rovira i Virgili, Departament de Bioquímica i Biotecnologia, Nutrigenomics Research Group, Tarragona, Spain
Néstor Gutiérrez‐Méndez, Faculty of Chemical Sciences, Autonomous University of Chihuahua, Chihuahua, México
Douglas G. Hayes, Department of Biosystems Engineering and Soil Science, University of Tennessee, Knoxville, TN, USA
Maria Hayes, Food BioSciences Department, Teagasc Food Research Centre, Ashtown, Dublin, Ireland
José L. Hidalgo‐Ruiz, Department of Chemistry and Physics, Analytical Chemistry Area, Research Centre for Mediterranean Intensive Agrosystems and Agri‐Food Biotechnology (CIAIMBITAL), Agrifood Campus of International Excellence ceiA3, University of Almería, Almería, Spain
Brijesh K. Tiwari, TEAGASC Food Research Centre, Dublin, Ireland
Tomás Lafarga, Department of Chemical Engineering, University of Almería, Almería, Spain
Chloe Leclerc, IRTA, Postharvest Program, Edifici Fruitcentre, Parc Científic i Tecnològic Agroalimentari de Lleida, Lleida, Catalonia, Spain
José Luis Martínez‐Vidal, Department of Chemistry and Physics, Analytical Chemistry Area, Research Centre for Mediterranean Intensive Agrosystems and Agri‐Food Biotechnology (CIAIMBITAL), Agrifood Campus of International Excellence ceiA3, University of Almería, Almería, Spain
Begoña Muguerza, Universitat Rovira i Virgili, Departament de Bioquímica i Biotecnologia, Nutrigenomics Research Group, Tarragona, Spain
Miquel Mulero, Universitat Rovira i Virgili, Departament de Bioquímica i Biotecnologia, Nutrigenomics Research Group, Tarragona, Spain
Iolanda Nicolau‐Lapeña, Food Technology Department, University of Lleida (UDL), Lleida, Spain
Ramona Pérez‐Leal, Faculty of Agrotechnological Sciences, Autonomous University of Chihuahua, Chihuahua, México
María Janeth Rodríguez‐Roque, Faculty of Agrotechnological Sciences, Autonomous University of Chihuahua, Chihuahua, México
Agustí Romero, IRTA, Oliviculture, Oil Science, and Nuts, Mas de Bover, Constantí, Tarragona, Spain
Roberto Romero‐González, Department of Chemistry and Physics, Analytical Chemistry Area, Research Centre for Mediterranean Intensive Agrosystems and Agri‐Food Biotechnology (CIAIMBITAL), Agrifood Campus of International Excellence ceiA3, University of Almería, Almería, Spain
Nora Aideé Salas‐Salazar, Faculty of Agrotechnological Sciences, Autonomous University of Chihuahua, Chihuahua, México
Rogelio Sánchez‐Vega, Faculty of Zootechnics and Ecology, Autonomous University of Chihuahua, Chihuahua, México
Mayra Cristina Soto‐Caballero, Faculty of Agrotechnological Sciences, Autonomous University of Chihuahua, Chihuahua, México
Manuel Suárez, Universitat Rovira i Virgili, Departament de Bioquímica i Biotecnologia, Nutrigenomics Research Group, Tarragona, Spain
Juan Manuel Tirado‐Gallegos, Faculty of Zootechnics and Ecology, Autonomous University of Chihuahua, Chihuahua, México
Cristina Torres‐Fuentes, Universitat Rovira i Virgili, Departament de Bioquímica i Biotecnologia, Nutrigenomics Research Group, Tarragona, Spain
Production and Consumption of Oils and Oilseeds
Tomás Lafarga Department of Chemical Engineering, University of Almería, Almería, Spain
1.1 Introduction
Lipids, which are together with proteins and carbohydrates the main constituents of plant and animal cells, can be broadly defined as substances such as fats, oils, or waxes that dissolve in organic solvents but not in water. Lipids, oil‐bearing nuts, and animal fats have been used by man for centuries. These were used for lighting, as cosmetics, applied to weapons or other utensils, and as foods, mainly as sources of energy or as medicines. Nowadays, the use of oils has expanded to several food applications which include cooking, frying, baking shortenings, salad dressing, and flavor carriers, among others. Each of these applications requires oils with specific physical and chemical properties (Gupta 2017). These properties will therefore determine the quality of the vegetable oil, which starts with high quality oilseeds or oil‐bearing nuts or fruits. Several factors which include maturity of the oilseed, climatic conditions, harvest conditions, handling of the harvested raw material, and storage can significantly affect the quality of the end product.
Broadly, oil extraction from seeds or beans is achieved by pressing and/or extraction using an organic solvent, generally hexane. Mechanical and thermal pre‐treatments can also be used to improve extraction yields (Savoire et al. 2013). Other oils such as avocado, palm, or olive oil are obtained after pressing of the whole fruit. Although some oils such as olive oil are used without further treatment than filtering, most of the currently commercialized edible oils are refined in some measure prior to commercialization (Gunstone 2011b). The term refining refers to the removal of several major and minor impurities and its main goal is to produce high quality oils with optimal properties to satisfy the different oil applications.
Oil production from oilseeds has been steadily increasing by an average of 12.3% annually over the last three decades: for the main oils – palm (palm kernel plus palm
Oil and Oilseed Processing: Opportunities and Challenges, First Edition. Edited by Tomás Lafarga, Gloria Bobo, and Ingrid Aguiló-Aguayo. © 2021 John Wiley & Sons Ltd. Published 2021 by John Wiley & Sons Ltd.
oil), rapeseed, soybean, and sunflower seed oil – there is a production increase of 231.1%, from 45.73 Mt in 1990 to 151.42 Mt in 2017 (UN 2019). Despite recent advances in oil extraction techniques, this impressive increase in oil production could not have been achieved without an increase in the quantity of seeds harvested. Indeed, during the same time period, the production of palm fruits, rapeseeds, soybean, and sunflower seeds followed the same trend from 159.29 Mt in 1990 to 794.31 Mt in 2017, representing an 17.7% annual increase (UN 2019).
The aim of the current chapter is to give an overview of the production of the most relevant vegetable oils and oilseeds, focusing on soybeans, rapeseeds, sunflower seeds, palm fruits, and the oils derived thereof. This chapter will also discuss the production quantities and trade of other common oilseeds such as groundnuts, maize, or sesame seeds as well as novel sources for oil production that are expected to soon gain an increased industrial relevance.
1.2 Oilseeds and Oils: Production and trade
The majority of the currently utilized vegetable oils are obtained from seeds or beans. Sources for vegetable oil extraction can be divided into three main categories: (i) those plants that are not grown for oil production, where oil can be considered as a by‐product; (ii) those crops that cannot be changed on a yearly basis, generally trees; and (iii) those crops that are planted annually such as sunflower, linseed, or rape (Gunstone 2011a). Currently, from the total oil and fat production, approximately 14% is utilized as a starting material for the oleochemical industry, 79–80% is used for human food as spreads, frying oils, or salad oils, and the remaining 6% is used as animal feed, and therefore, indirectly used for human food production (Gunstone 2011a). Crushing of soybeans or oilseeds into cake and oil dominates total usage and it is expected that 90% of the world soybean production and 86% of world production of other oilseeds will be crushed in 2027 (FAO 2018). The current section will discuss current applications as well as the production and trade of the most important edible oils and oil sources.
1.2.1 Copra and Coconut Oil
Coconut oil is obtained from the fruit of the coconut palm (Cocos nucifera L.), a tropical plant normally utilized for edible and non‐edible purposes. Two major types of oil can be obtained from coconut: (i) coconut or copra oil, which is obtained from the dried coconut flesh, also known as copra, and (ii) virgin coconut oil, obtained from fresh coconut flesh (Zuknik et al. 2016). Copra oil can be found either unrefined or refined, bleached, and deodorized (Kumar and Krishna 2015).
As a portable source of water (and food), coconuts played an important role in the ability of humans to voyage and colonize regions throughout the tropics (Gunn et al. 2011). Currently, coconut is an important crop in tropical countries where it plays an important role in diets and livelihoods (MacDonald et al. 2018). A large number of food products containing coconut oil have been launched into the market during recent years (Table 1.1).
Besides being used for frying or as an ingredient in baked goods, coconut oil is currently used for pharmaceutical and cosmetic applications, among others (Kumar and
table 1.1 Foods manufactured using vegetable (and microalgal) oils.
Product Brand Company
Sour cream and onion flavored potato snack
Country of commercialization
Pringles Pringles, USA Argentina
Roasted and salted peanuts Pami Pami, Greece Croatia
Corn “tostadas” Mamá Lycha
Chocolate cake with chocolate topping Betty Crocker Mug Treats
Productos Mamá Lycha, USA Canada
General Mills, USA Saudi Arabia
Tomato soup Campbell’s Soup at Hand Campbell, Canada Canada
Hazelnut cream with cocoa and breadsticks Nut Bari
Spicy vegetable tajine with bulgur, spelt, and raisins
DKC Grup Gida San, Turkey Turkey
Carrefour Veggie Carrefour, France Spain
Breakfast cereals Kellogg’s Froot LoopsKellogg Sales, USA USA
Cookie covered almonds7‐Select 7‐Eleven, USA USA
Apple pie Royal Classic DutchDe Specialiteitenbakkerij, the Netherlands Switzerland
Rice mini squares
Kellogg’s Rice Krispies Treats Mini Squares Kellogg Sales, USA USA
Sweet kale salad Eat Smart Salad Shake Ups Apio, USA USA
Oil(s) used
Cottonseed and coconut oil
Cottonseed and sunflower oil
Cottonseed, palm, and/or soybean oil
Cottonseed, palm, sunflower, and rapeseed oil
Canola, corn, cottonseed, and or/soybean oil
Sunflower, cottonseed, and palm oil
Cottonseed and extra virgin olive oil
Coconut, soybean, and cottonseed oil
Canola, cottonseed, palm kernel, and/or peanut oil
Cottonseed, rapeseed, and sunflower oil
Soybean and palm oil
Canola, soybean, and sunflower oil
(Continued )
table 1.1 (Continued)
Product Brand Company
Country of commercialization
Mr Kipling lemon whirlsMr Kipling Premier Foods, IrelandIreland
Cookies drizzled in chocolate Bake Shop Bites Cookies United, USAPuerto Rico
Special bread tapas biscuits Quely Quely, Spain
Taralli biscuits Continental Taralli Biscuits
Continental Taralli Biscuits, Australia
Quinoa salad Pur PUR Bio Feinkost Manufaktur – Heinz Gierze, Germany
Tuna salad The Yummy Tummy Co, The Yummy Tummy Company, UK
Artichoke pesto Casa de la Torre Converfrut, Argentina
Spain
Australia
Germany
UK
Argentina
Infant formula Enfamil Neuro Pro EnfaCare Mead Johnson, USA USA
Apple drink Life Mix
W Pesquisa, Tecnologia e Indústria de Alimentos, Brazil
Evaporated milk Laive Niños Laive, Peru
Source: Data accessed on June 7, 2019 from MINTEL, available at http://www.mintel.com.
Brazil
Peru
Oil(s) used
Rapeseed and palm oil
Palm kernel oil, hydrogenated palm oil, and soybean oil
Sunflower and olive oil
Olive oil
Sunflower and olive oil
Olive oil
Olive oil
Sunflower, soybean, coconut, and Schizochytrium sp. oil
Schizochytrium sp. oil
Mortierella alpine and Schizochytrium sp. oil
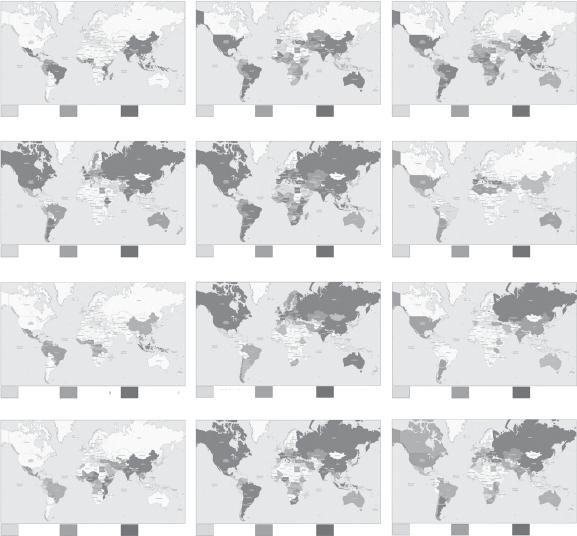
Krishna 2015). Over 12.30 Mha of coconut are currently planted across 89 tropical countries, mainly in Asia (Gunn et al. 2011) – Figure 1.1. Coconut plantations can now be found on practically every tropical and sub‐tropical coastline worldwide, distributed mainly in coastal regions between 20°N and 20°S (Ramanatha Rao et al. 2005). Coconuts are even cultivated far from the coast in many regions with adequate rainfall and altitude (Foale 2005). Over 95% of the farmers who grow coconuts are smallholders tending less than four hectares and lack the resources to invest in technologies that would improve production yields (Batugal et al. 2005). However, production and consumption of coconut oil is expected to increase in coming years and production of virgin coconut oil shows potential for improving coconut farm incomes by five to eightfold over traditional copra production (Bawalan and Chapman 2006).
Production of coconut oil during 2014 was estimated as 3.10 Mt (UN 2019). During the period 2018/2019, coconut oil production was reported to be 3.63 Mt (USDA 2019).
Approximately 2.70 Mt of coconut oil were produced in Asia, representing approximately COCONUT
figure 1.1 World production of palm fruit, olives, and most economically important oilseeds. Values represent tonnes produced during 2017. Source: Data accessed on April 8, 2019 from FAOSTAT, the Food and Agriculture Organization Corporate Statistical Database, available at http://www.fao.org/faostat.
88.4% of the total production. Largest coconut oil producers are the Philippines, Indonesia, and India with 1.10, 0.91, and 0.39 Mt, respectively. The Philippines and Indonesia are also the biggest coconut exporters with approximately 0.75 and 0.60 Mt of coconut oil exported during 2016, respectively. Moreover, the US and the Netherlands are the major coconut oil importers followed by Malaysia and Germany with approximately 0.51, 0.34, 0.15, and 0.15 Mt of coconut oil imported during 2017. Global copra production is expected to increase by 2%, mainly due to expanding coconut plantations in Vietnam and improving yields in the Philippines (USDA 2017).
1.2.2 Cottonseeds and Cottonseed Oil
Cotton, which is obtained from the cotton plants of the genus Gossypium in the family Malvaceae, is a profit crop for over 20 M farmers in developing countries, mainly cultivated to meet the basic requirements for cotton fabrics (Saxena et al. 2011). Cottonseed is a valuable by‐product of the cotton plant: for every 1 kg of cotton fiber, 1.65 kg of cottonseeds are produced (Saxena et al. 2011). The cottonseed is used to produce oil, mainly for human consumption, and oilseed cake for animal feed. Cottonseed oil fits within the previously mentioned group of plants that are not grown for oil production, and where oil can be considered as a by‐product. However, besides being a “by‐product,” cottonseed oil dominated the US vegetable oil market for almost 100 years (O’Brien et al. 2005). Table 1.1 lists some products containing cottonseed oil that were recently launched into the market.
Cottonseeds were the fifth most produced commodity within the “processed crops” classification of FAOSTAT, surpassed only by barley, sugar, molasses, and palm oil. World production of cottonseeds was measured as 46.98 Mt in 2014 (UN 2019). Although cottonseed production decreased significantly during the period 2015/2016 to 37.76 Mt, it is now slowly recovering and reached 43.39 Mt produced during the period 2018/2019 (USDA 2019a). Major cottonseed producers were China, India, and the US with a production of 12.32, 12.30, and 4.64 Mt. Cottonseed oil production is largely concentrated in India, the US, Pakistan, and China (FAO 2018). In the EU, cotton is produced only in three Member States on around 300 00 0 ha, mainly in Greece (approximately 80% of European production), Spain (20%, mainly grown in the region of Andalucía), and Bulgaria that produces cotton on less than 1 ha. Globally, major cottonseed exporters are the US, Greece, Australia, and Brazil with average exports of 182.12, 176.42, 166.96, and 95.45 kt/year. Despite being one of the most produced oilseeds, cottonseed oil production during the period 2018/2019 was reported to be 5.17 Mt, significantly lower than the amount of soybean, rapeseed, palm, or sunflower seed oil, which were 57.07, 27.78, 73.49, and 19.49 Mt during the same period (USDA 2019a).
1.2.3 Groundnuts and Groundnut Oil
Groundnut or peanut (Arachys hypogaea L.) is one of the most important oilseed crops in the world. Groundnut consumption as well as commercial products containing groundnuts vary in large proportions as peanuts have been developed into a large number of products like roasted peanuts, peanut butter, peanut paste, peanut flour, peanut “milk,” or peanut cheese analogues (Arya et al. 2016). In Western countries, groundnuts are mainly used for direct consumption as salted and roasted nuts. In the
US, groundnuts are also utilized for making peanut butter and confectionary. In turn, in China and India groundnuts are primarily crushed for oil production (Pandey et al. 2014).
The cultivation of peanuts, which was originated in South America, has expanded and groundnuts are currently being produced in over 100 countries of Asia, Africa, and the Americas (Pandey et al. 2014). Over 70% of the groundnut growing area comes under arid and semi‐arid regions (Shasidhar et al. 2017). Figure 1.1 shows the annual production of groundnuts per country during 2017.
World production during 2017 totaled approximately 47.09 Mt, which represents an 18% increase from the 39.9 Mt produced in 2013 (Torres et al. 2014). World area harvested with groundnuts has also increased over the last decades and is currently over 27.94 Mha. This trend is likely to continue to grow. Major groundnut producers are China, India, and the US with 17.09, 9.18, and 3.28 Mt produced in 2017. The US is one of the biggest groundnut exporters, with 0.36 Mt exported in 2016. Argentina, which was the seventh major producer during 2017, was the third major exporter during that same year with 0.29 Mt of groundnuts exported. Argentina, the US, Sudan, Senegal, and Brazil account for over 71% of total world exports (Torres et al. 2014). Other countries like Vietnam, India, and several African countries periodically enter the world market depending on market demands and their crops quality (Torres et al. 2014). Indeed, in 2016, India was the major exporter with 0.61 Mt of groundnuts exported. Moreover, major groundnut importers in 2017 were the Netherlands, China, Indonesia, and Mexico with 0.32, 0.19, 0.14, and 0.13 Mt respectively. Peanut imports into the EU, Canada, and Japan account for approximately 78% of the world’s imports (Torres et al. 2014). Approximately 5.03 Mt of groundnut oil were produced in 2014, mainly in Asia (69.4%), Africa (23.8%), and the Americas (4.5%). The top five peanut oil producers are China, India, Nigeria, Myanmar, and Sudan with an approximate production of 1.87, 1.25, 0.27, 0.21, 0.15 Mt respectively.
1.2.4 linseed
Flax (Linum usitatissimum L.) belonging to the family Lineaceae is a blue flowering herb that produces small flat seeds, which vary from golden yellow to reddish brown and have a nutty flavor (Kajla et al. 2015). Flaxseeds, also known as linseeds, are an economically important oilseed crop used for industrial, food, and feed purposes. Generally the term flaxseed refers to the seed grown for fiber production (linen), while linseed refers to the oilseed grown for industrial and food uses. In the current chapter, both terms will be used indistinctively.
Linseeds are currently being cultivated in more than 50 countries, predominantly in the Northern hemisphere as shown in Figure 1.1. The harvested area in 2017 amounted to 2.78 Mha representing a 14.04% annual increase during the last decade. For example, in the EU, the area harvested increased from 52 00 0 ha in 2008 to 70 00 0 ha in 2019, representing an average annual increase of 13.5% (European Commission 2019). World production of linseed increased from 1.98 Mt in 2000 to around 2.79 Mt in 2017. At the beginning of the century, Canada was the world’s largest producer and exporter of flax, and represented about 40% of the world’s production and 75% of the global flax trade (Oomah 2001). Currently, Canada produces 0.51 Mt of linseed per year and ranks third in the list of top producers, surpassed by Kazakhstan and Russia, which produced 0.68 and 0.61 Mt, respectively. Currently, most of the linseed currently produced is grown in Asia
followed by Europe and the Americas, with production shares of 44.7, 28.6, and 22.7%, respectively. Canada is still the biggest linseed exporter, followed by Russia, Kazakhstan, Belgium, and the US. Exports of these countries during 2017 were approximately 0.62, 0.61, 0.27, 0.18, 0.03 Mt, respectively. Major linseed importers were Belgium, China, Turkey, and Germany with 0.58, 0.47, 0.19, and 0.15 Mt of seeds imported during 2017. Belgium, which imports large amounts of linseeds is one of the world’s most important linseed oil producers. In 2014, 0.12 Mt of linseed oil were produced in Belgium, only surpassed by China with an annual production of 0.19 Mt third, fourth, and fifth major linseed oil producers were the US, Turkey, and Germany. Top five linseed oil exporters during 2016 were Belgium, Germany, Turkey, Kazakhstan, and Gambia. In turn, Gambia was the major linseed oil importer followed by China, Germany, the Netherlands, and the UK.
1.2.5 maize
Maize (Zea mays L.), also known as corn, is a cereal grain from the family Gramineae, which includes plants such as wheat, rice, or sugarcane. Cereal grains are key‐importance crops as they provide humans with more nourishment than any other food class and nearly 50% of the total caloric requirement (Ranum et al. 2014). Maize was first domesticated by indigenous peoples in the mid‐ to low‐land regions of what today is known as Mexico, around 9000 years before present (van Heerwaarden et al. 2011). Today, maize is a staple food in many parts of the world, with the total production of maize surpassing that of other staples including wheat (UN 2019). Table 1.1 lists some products recently launched into the market manufactured using maize oil. Production of maize showed an important increase in both area harvested and total production over the last decade. Currently, world area harvested is approximately 197.15 Mha, showing an important increase from 2007 when approximately 158.67 Mha of maize were harvested. World production of maize was 1134.74 Mt in 2017. Maize ranked fifth in the most produced commodities during 2017 according to data accessed from FAOSTAT, only surpassed by “total cereals,” rice, sugar cane, and “total coarse grain.” Approximately 50.9% of the maize produced during 2017 was cultivated in the Americas, followed by Asia and Europe with production shares of 31.9 and 9.7%, respectively. Largest producers were the US, China, Brazil, Argentina, and India with production quantities of 370.96, 259.07, 97.72, 49.47, and 28.72 Mt in 2017. Recently, the USDA predicted lower maize imports and production for 2018/2019. Larger maize exporters during 2016 were the US, Argentina, Brazil, and Ukraine with 55.99, 24.50, 21.87, and 11.01 Mt, respectively. Increased corn exports in Argentina and Ukraine are expected, partially offset by reductions for South Africa and Mexico (USDA 2019b). Japan, Mexico, the Republic of Korea, and Vietnam were the larger importers during this period with approximately 15.34, 14.10, 9.78, and 8.05 Mt, respectively (UN 2019). As a crop, maize is highly productive and versatile, and responded successfully to investments in research, breeding, and promotion. However, the current corn production system can be considered inefficient, at least at feeding people. Only a small fraction of the maize grown over the world is consumed directly by humans. Most of the maize currently harvested today is being indirectly used for human consumption as animal feed or as raw material for the production of maize‐derived products such as corn starch or corn syrup, or used for other industrial purposes such as the production
of ethanol. An important part of maize production, approximately 40%, is being used as a raw material for the production of ethanol used as a motor fuel (Ranum et al. 2014). The utilization of maize for producing biofuels has a strong impact on production and trade. Indeed, total corn use was predicted to decrease by 165 M bushels (approximately 4.19 Mt) mainly caused by a 40 M bushel decrease (approximately 1.01 Mt) in the amount of corn used for ethanol production (USDA 2019b). Only a small amount of the maize currently cultivated is used for oil production. Total maize oil production during 2014 was 3.18 Mt, led by the US, China, Turkey, and Brazil with oil production quantities of 1.82, 0.26, 0.19, and 0.09 Mt. Major oil exporters during 2016 were the US, Turkey, and Spain with approximately 0.47, 0.05, and 0.04 Mt of oil exported. Spain was also one of the largest importers, with 0.09 Mt, only surpassed by Libya, who imported 0.10 Mt of maize oil during 2016. Overall, although human consumption of maize has remained steady over the last years, its global production has slightly but steadily increased mainly caused by an increase in its use for animal feed and for biofuel production.
1.2.6 Olive Oil
The olive tree (Olea europea L.) is one of the oldest known cultivated trees in the world and olive oil has become one of the most widely accepted and used oils in culinary applications. The amount of food products manufactured using olive oil increases every year. Some of these are listed in Table 1.1. Olive oil is a staple food for people living in Mediterranean countries but its use is now expanding to other parts of the world. As can be seen in Figure 1.1, the olive tree is currently being cultivated in several countries including Spain, Italy, Greece, Tunisia, Portugal, Turkey, Morocco, Argentina, Australia, and the US, among others. The world production of olives was approximately 20.87 Mt in 2017. Approximately 62% of the total world production of olives was carried out in Europe, with Spain, Greece, and Italy the biggest producers with 6.54, 2.72, and 2.57 Mt/year in 2017, respectively. The EU is the leading producer, consumer, and exporter of olive oil: indeed, in the last five marketing years the EU produced, consumed, and exported 67, 55, and 67% of the worlds’ olive oil. The biggest non‐European producers were Morocco and Egypt with an annual production of 1.03 and 0.92 Mt in 2017 (UN 2019). Major exporters of olive fruit in 2016 were Portugal, Spain, Mexico, Greece, and Jordan: 24.69, 12.81, 10.72, 4.47, and 3.39 kt, respectively. Portugal was also the most important importer of olives, with approximately 19.25 kt imported during 2016, most of these from Spain (EU 2019). Spain is the biggest producer of olive oil followed by Italy and Greece with a production of 1.73, 0.29, and 0.21 Mt of virgin olive oil during 2014, respectively. These countries were also the most important exporters with approximately 920.82, 354.29, and 161.00 kt exported during 2016. Major non‐European olive oil producers are Tunisia and Morocco, followed by Syria with an annual production of approximately 179.70, 137.40, and 100.64 kt, respectively. Tunisia ranks fifth just behind Portugal among the major olive oil exporters with 107.95 and 117.83 kt of oil exported in 2016. During 2018/2019, from the total 124.06 kt of olive oil exported from the EU to non‐EU countries, 41.80, 12.80, 9.66, and 5.74 kt were imported by the US, China, Japan, and Canada, respectively (Ferraris 2019). These values show a 22.6, 0.5, 18.4, and 34.4% increase when compared to the period 2017/2018.
1.2.7 Palm and Palm Kernel Oil
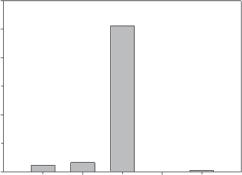
The oil palm fruit, which is obtained from the palm tree (Elaeis guineensis L.), is a drupe formed in tight bunches. Palm fruit is mainly used for the extraction of palm oil driven by a lower price, and the fact that one hectare of oil palm plantation can produce up to 10 more times oil than other leading oilseed crops (Mba et al. 2015). Palm oil can be divided into crude palm oil, obtained from the fruits mesocarp, and palm kernel oil. Both are key important in world trade. Indeed, palm oil was the fourth most produced commodity within the “processed crops” classification of FAOSTAT, surpassed only by beer of barley, sugar, and molasses. Palm oil production has boomed over the last decades caused by an increasing use as frying oil, as an ingredient in foods and other products such as detergents, and biodiesel production (Pirker et al. 2016). As shown in Figure 1.2, total world production of palm oil increased from 45.78 Mt in the year 2000 to 57.33 Mt in 2014. In 2019, the total world production of palm oil has been calculated as 70.90 Mt, representing a 16.16% annual increase during the last decade.
Malaysia and Indonesia have been the center of this impressive increase. As an example, planted areas increased from 3.37 and 2.01 Mha in 2000 to 5.11 and 9.28 Mha in 2017, which represent an averaged 8.90 and 27.09% annual increase during the period 2000–2017 in Malaysia and Indonesia, respectively. The USDA recently forecasted the Indonesian oil palm harvested area for 2018/2019 as 11.3 Mha. In 2016, Vijay et al. (2016) assessed the impact of oil palm on deforestation and biodiversity
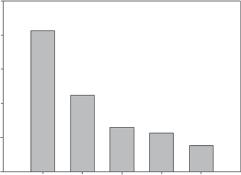
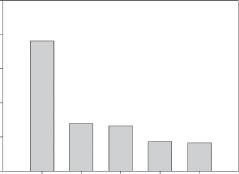
figure 1.2 Area harvested and production of palm, rapeseed, soybean, and sunflower seed oil. Source: Data accessed on April 8, 2019 from FAOSTAT, available at http://www.fao.org/faostat.
1.2 OIlseeds and OIls: PrOduCtIOn and trade
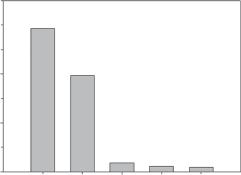
loss and reported that 45% of sampled oil palm plantations evaluated in Southern Asia came from areas that were forests in 1989 (less than three decades). Similar conclusions were obtained by Henders et al. (2015), who observed that over 50% of Malaysian and Indonesian oil palm plantations in 2005 were on land that was forest in the 1990s. This has led not only to obvious negative environmental issues, but also to closer scrutiny from consumers. However, as global demand for food increases and land availability in those countries becomes scarcer, governments of developing and emerging countries such as Brazil, Peru, and some African countries are increasingly promoting palm tree cultivation (Pirker et al. 2016). Nowadays, the palm tree is cultivated in several countries with adequate temperature, sunlight, and rainfall (Figure 1.1). However, major palm oil producers continue to be Indonesia, Malaysia, and Thailand with an annual productions in 2017 of approximately 29.27, 19.67, and 1.85 Mt. As shown in Figure 1.3, Malaysia and Indonesia are also the largest palm oil exporters with approximately 22.76 and 13.81 Mt exported during 2017.
Major palm oil importers in 2017 were India, China, and Pakistan with 8.26, 4.48, and 2.60 Mt respectively.
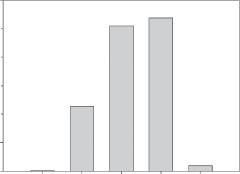
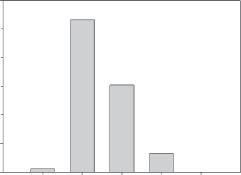
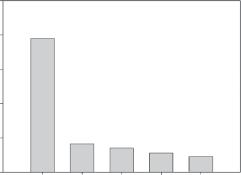
figure 1.3 Palm oil: Production and trade. Abbreviation: PNG, Papua New Guinea. Source: Data accessed on April 8, 2019 from FAOSTAT, available at http://www.fao.org/faostat.
1.2.8 rapeseed and Canola Oil
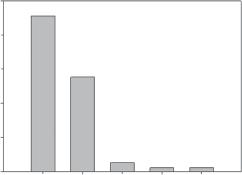
The genus Brassica, which is the most important within the Brassicaceae family, includes the six interrelated species Brassica nigra, Brassica oleracea, Brassica rapa, Brassica carinata, Brassica juncea, and Brassica napus (Cartea et al. 2016). Both rapeseed and canola belong to the Brassicaceae family. In some countries, the term rapeseed oil refers to the oils for industrial use, while canola oil is used to refer to the edible cooking oil. Canola is a subgroup within the rapeseeds and include those Brassica species having seeds containing oil with under 2% erucic acid and low levels of glucosinolates. As an estimate, Daun (2015) recently suggested that, to identify the amount of rapeseed crops that are canola quality, a good estimate can be obtained by assuming that all production in North America, Australia, Scandinavia, and Western Europe is canola quality, while only 10 and 75% of the production in China and Eastern Europe are canola. In the current chapter, all Brassica seeds utilized for oil production will be referred to as rapeseeds. Currently, rapeseeds rank second in world production of oilseeds (third if considering palm oil). According to data accessed from the USDA, world production of rapeseed during 2018/2019 was 70.37 Mt (USDA 2019a). Production of rapeseed in the EU increased from 19.02 Mt in 2009 to 19.80 Mt in 2018, with a historical maximum production of 24.26 Mt in 2014 (European Commission 2019). Rapeseed has a long history of use in Europe, Scandinavia, China, and India and has been more recently introduced into Canada and Australia (Daun 2015). Rapeseeds are adapted to the cool extremes of the temperature zones: although the optimum growth temperature is around 10 °C, minimum temperatures for growth have been reported to be near 0 °C (Daun 2015). Major rapeseed growing areas, shown in Figure 1.1, include temperate areas of Europe, Asia, and to a lesser extent, North America. Indeed, 41.5 and 39.3% of the total rapeseed oil production was carried out in Europe and Asia, respectively (Figure 1.4). Rapeseed oil was ninth most produced commodity within the “processed crops” classification of FAOSTAT, and the third most produced oil only surpassed by palm oil and soybean oil, which ranked fourth and sixth, respectively.
In the EU‐28 the area harvested increased from 6.17 Mha in 2008 to 6.96 Mha in 2018 (European Commission 2019). As shown in Figure 1.4, biggest producers in 2017 were China, Germany, and Canada (UN 2019). Canada is currently the major rapeseed oil exporter. Indeed, according to data obtained from FAOSTAT, 2.93 Mt of rapeseed oil were exported during 2017 (UN 2019). Although there will continue to be a market for rapeseed oil, mainly for industrial processes because of its high heat stability and for specialty foods, the world trend is to increase the production of canola‐quality seeds (Daun 2015). Global rapeseed production is forecast to rise 3.9 Mt on the strength of a 9% increase in are harvested and an increased production in Canada, Ukraine, India, the EU, and the US (USDA 2017).
1.2.9 sesame seeds and sesame Oil
Sesame (Sesamum indicum L.) is considered as one of the world’s major oilseeds and one of the most ancient crops cultivate by humans (Wan et al. 2015). The origin of sesame has been a matter of discussion for more than a century, but it is now widely accepted that domestication occurred on the Indian subcontinent (Bedigian 2010a). Sesame seeds were a major oilseed in the ancient world mainly because of their stability,
Americas Asia Europe Oceania
France
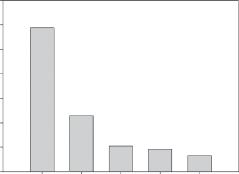
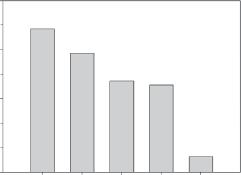
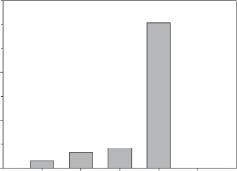
figure 1.4 Rapeseed oil: Production and trade. Abbreviations: CR, Czech Republic; US, United States of America. Source: Data accessed on April 8, 2019 from FAOSTAT, available at http:// www.fao.org/faostat.
resistance to drought, and their high oil content. Currently, sesame is grown in varied environments from semiarid tropics and subtropics to temperate regions. World area harvested with sesame in 2017 was calculated as 9.98 Mha, most of it in African and Asian countries (Figure 1.1). During the last decades, world production of sesame seeds has increased steadily Total world production of sesame seed in 2018 was estimated to be 5.53 Mt, most of it being cultivated in Asia (39.7%) and Africa (56.9%). Top five sesame seed producers during 2018 were the United Republic of Tanzania, Myanmar, India, Nigeria, and Sudan, with an estimated production of 805.7, 764.3, 751.0, 550.0, and 550.0 kt respectively. On average, 70% of the worlds’ sesame seeds are consumed within producer countries, leaving an approximately 30% excess for global trade (Bedigian 2010b). Major sesame seed exporters during 2016 were Ethiopia, India, Sudan, Nigeria, and Burkina Faso with approximately 382.0, 325.9, 258.54, 172.8, and 159.8 kt respectively. Approximately 65% of the sesame seeds harvested are dedicated for oil production while only 35% are consumed as a food ingredient (Wan et al. 2015). Global sesame oil production was estimated to be 1.63 Mt in 2014. Major sesame oil
producers in 2014 were the United Republic of Tanzania, Myanmar, China, India, and Japan with an annual production of 544.3, 318.0, 234.0, 108.0, and 45.44 kt respectively. The top five sesame oil exporters during 2016 were Mexico, Ghana, India, and Japan. In turn, major sesame oil importers were the US, the UK, Australia, Taiwan, and Vietnam with approximately 16.39, 3.52, 3.24, 3.18, and 3.08 kt imported during 2016 respectively.
1.2.10 soybean
The soybean (Glycine max L.) or soya bean is a legume native to East Asia, widely cultivated for its edible bean. It is thought that domestication of soybean started in China between 7000 and 6600 bce, in Japan between 5000 and 3000 bce, and in Korea in approximately 1000 bce (Lee et al. 2011). Currently, cultivation of soybean is successful in climates with hot summers, with optimum growing conditions in mean temperatures of 20–30 °C. Soybean is a globally important crop used for the production of soybean meal and soybean oil, which is used in a large variety of processed foods, some of them listed in Table 1.1.
While soybeans are produced around the world, production and exports are dominated by the America’s. The production of soybeans will continue to grow strongly in Latin America, with Argentina and Paraguay producing 66 Mt and 12 Mt by 2027 (FAO 2018). Soybean production is also expected to increase in Ukraine, Russian Federation, and several countries in Africa (FAO 2018). In the EU, the area harvested increased from 0.27 Mha in 2008 to 0.98 Mha in 2018, representing an average annual increase of 36.3% (European Commission 2019). These increased production will result in an estimated 360.6 Mt of soybean produced during 2018/2019, led by the US, Brazil, and Argentina with a forecasted production of 123.7, 117.0, and 55.0 Mt (USDA 2019b). However, soybean production in the US is estimated to decrease by approximately 1.52 Mt for the period 2018/2019 (USDA 2019b) and by 2027, it is expected that Brazil will overtake North America as the world’s largest exporter of soybean with a 41.8% rise in its share in the global soybean exports (FAO 2018). The 2018/2019 global soybean outlook of the USDA includes a 1.7 Mt reduction in soybean exports from Brazil, Uruguay, and Paraguay, which are partially offset by the above mentioned higher exports for Argentina. Indeed, the highly developed crushing industry in Argentina, together with a small domestic market, and a lower export tax on processed commodities than on unprocessed commodities favors the export of soybean oil and meal from Argentina.
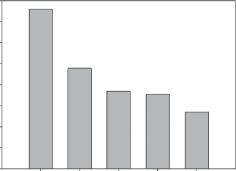
Soybeans are not only used as a protein source but also for producing soybean oil. Soybean oil is the sixth most produced commodity within the “processed crops” classification of FAOSTAT, surpassed by beer of barley, sugar, molasses, palm oil, and cottonseed. Figure 1.5 shows the world production of soybean oil during 2014.
World production of soybean was calculated as 45.7 Mt, the major producers being China, the US, Brazil, and Argentina with 11.7, 9.7, 7.4, and 7.1 Mt, respectively (UN 2019). Soybean oil trade is expected to further expand mainly due to India’s growing demand (USDA 2017).
1.2.11 sunflower
The common name sunflower refers to the popular annual species Helianthus annuus L., grown as food crops for humans, cattle, and poultry or as ornamental plants. The oil content of sunflower seeds is around 50% (w/w) (Salas et al. 2015). Sunflower
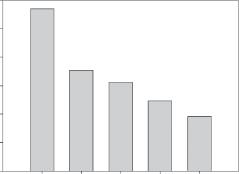
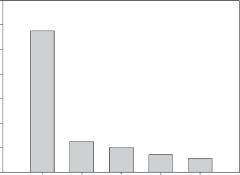
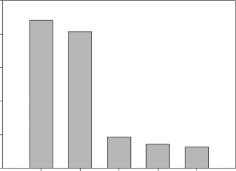
figure 1.5 Soybean oil: Production and trade. Abbreviation: US, United States of America. Source: Data accessed on April 8, 2019 from FAOSTAT, available at http://www.fao.org/faostat.
seeds are crushed for oil recovery via either hard pressing or prepress solvent extraction. The former relies on exerting high pressure on the seeds to separate the oil from the solid fraction obtaining recovery yields close to 25% (Williams 2005). In turn, the latter relies on exerting medium pressure followed by solvent extraction and allows recovering approximately 40% of the seed’s oil (Le Chef and Kemper 2015). Crude sunflower oil contains several impurities which are removed by degumming, to remove phosphatides, chemical neutralization to remove free fatty acids and residual phosphatides, and bleaching, which aims at removing colored compounds such as chlorophylls and carotenes. Other processes which include dewaxing and deodorization generally by stripping under vacuum with steam at elevated temperatures are also applied (Dijkstra 2015).
Sunflower grows better at temperate (20–25 °C) and dry climates with high irradiation and deep soils (Salas et al. 2015). Argentina was the biggest sunflower seed and oil producer until the late twentieth century, when it was surpassed by Ukraine and Russia after important economic and technological reforms (Feoll and Ingaramo 2015). Currently, over 75% of the sunflower oil commercialized worldwide is made in Europe (Figure 1.6). The total area dedicated to cultivate sunflower seeds increased from
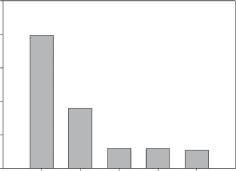
figure 1.6 Sunflower seed oil: Production and trade. Source: Data accessed on April 8, 2019 from FAOSTAT, available at http://www.fao.org/faostat.
3.79 Mha in 2008 to 4.17 Mha in 2018, representing an average 11.3% annual increase (European Commission 2019).
Despite being a Native American plant, traditionally, the main regions of sunflower oil consumption are the EU and former soviet countries. Ukraine and Russia are currently the largest producers, followed by Argentina. In 2017, Ukraine, Russia, and Argentina produced 12.23, 10.48, and 3.54 Mt, respectively. Expected production gains for Ukraine (to 15.5 in 2018/2019 from 13.7 Mt in 2017/2018) will be caused by improved sunflower yields, as Ukraine’s crop area is expected to stay unchanged in 2018/2019 at 6.4 Mha (USDA 2018). In the EU‐28, sunflower seed production increased from 7.21 Mt in 2008 to 10.17 Mt in 2018 (European Commission 2019). World sunflower seed production was 51.49 Mt during 2018/2019 (USDA 2019a). Russia and especially Ukraine are not only the biggest producers but also the biggest sunflower oil exporters. In 2017, Ukraine exported 3.97 Mt of sunflower oil. According to the International Sunflower Oil Association, in 2016, sunflower oil was exported to more than 110 countries in the world. Top importers in 2017 are shown in Figure 1.6 and are led by India and China, which imported approximately 1.52 and 0.96 Mt of sunflower oil in 2017, respectively.