Applied Modeling Techniques and Data Analysis
Financial, Demographic, Stochastic and Statistical Models and Methods
Edited by
Alex Karagrigoriou
Yannis Dimotikalis
Christina Parpoula
Christos H. Skiadas
First published 2021 in Great Britain and the United States by ISTE Ltd and John Wiley & Sons, Inc.
Apart from any fair dealing for the purposes of research or private study, or criticism or review, as permitted under the Copyright, Designs and Patents Act 1988, this publication may only be reproduced, stored or transmitted, in any form or by any means, with the prior permission in writing of the publishers, or in the case of reprographic reproduction in accordance with the terms and licenses issued by the CLA. Enquiries concerning reproduction outside these terms should be sent to the publishers at the undermentioned address:
ISTE Ltd
John Wiley & Sons, Inc.
27-37 St George’s Road 111 River Street London SW19 4EU Hoboken, NJ 07030
UK USA
www.iste.co.uk
www.wiley.com
© ISTE Ltd 2021
The rights of Yannis Dimotikalis, Alex Karagrigoriou, Christina Parpoula and Christos H. Skiadas to be identified as the authors of this work have been asserted by them in accordance with the Copyright, Designs and Patents Act 1988.
Library of Congress Control Number: 2020951002
British Library Cataloguing-in-Publication Data
A CIP record for this book is available from the British Library
ISBN 978-1-78630-674-6
Preface ........................................xi
YannisD IMOTIKALIS ,AlexK ARAGRIGORIOU ,ChristinaPARPOULA andChristosH.S KIADAS
Part1.FinancialandDemographicModelingTechniques
Chapter1.DataMiningApplicationIssuesintheTaxpayer SelectionProcess
MauroBARONE ,StefanoP ISANI andAndreaS PINGOLA
1.1.Introduction.................................3
1.2.Materialsandmethods...........................5
1.2.1.Data....................................5
Chapter2.AsymptoticsofImpliedVolatilityintheGatheral DoubleStochasticVolatilityModel
MohammedA LBUHAYRI ,AnatoliyM ALYARENKO ,SergeiS ILVESTROV , YingN I ,ChristopherE NGSTRÖM ,FinnanT EWOLDE andJiahuiZ HANG
2.1.Introduction.................................27
Chapter3.NewDividendStrategies .....................39
EkaterinaB ULINSKAYA
3.1.Introduction.................................39
3.2.Model1....................................41
3.3.Model2....................................48
3.4.Conclusionandfurtherresults.......................51
3.5.Acknowledgments..............................51
3.6.References..................................52
Chapter4.IntroductionofReservesinSelf-adjustingSteering ofParametersofaPay-As-You-GoPensionPlan ............53
KeivanD IAKITE ,AbderrahimO ULIDI andPierreD EVOLDER
4.1.Introduction.................................53
4.2.Thepensionsystem.............................54
4.3.TheoreticalframeworkoftheMusgraverule...............57
4.4.Transformationoftheretirementfund...................60
4.5.Conclusion..................................63
4.6.References..................................64
Chapter5.ForecastingStochasticVolatilityforExchange RatesusingEWMA ................................65
Jean-PaulM URARA ,AnatoliyM ALYARENKO ,MilicaR ANCIC andSergeiS ILVESTROV
5.1.Introduction.................................65
5.2.Data......................................66
5.3.Empiricalmodel...............................67
5.4.Exchangeratevolatilityforecasting....................69
5.5.Conclusion..................................73
5.6.Acknowledgments..............................73
5.7.References..................................74
Chapter6.AnArbitrage-freeLargeMarketModel forForwardSpreadCurves ...........................75
HosseinN OHROUZIAN ,YingN I andAnatoliyM ALYARENKO
6.1.Introductionandbackground........................75
6.1.1.Term-structure(interestrate)models.................76
6.1.2.Forward-ratemodelsversusspot-ratemodels.............77
6.1.3.TheHeath–Jarrow–Mortonframework................77
6.1.4.Constructionofourmodel.......................78
6.2.Constructionofamarketwithinfinitelymanyassets..........79
6.2.1.TheCuchiero–Klein–Teichmannapproach..............79
6.2.2.AdaptingCuchiero–Klein–Teichmann’sresultstoourobjective..82
6.3.Existence,uniquenessandnon-negativity.................82
6.3.1.Existenceanduniqueness:mildsolutions...............83
6.3.2.Non-negativityofsolutions.......................85
6.4.Conclusionandfutureworks........................87
6.5.References..................................88
Chapter7.EstimatingtheHealthyLifeExpectancy(HLE) intheFarPast:TheCaseofSweden(1751–2016) withForecaststo2060 ..............................91
ChristosH.S KIADAS andCharilaosS KIADAS
7.1.Lifeexpectancyandhealthylifeexpectancyestimates..........92
7.2.Thelogisticmodel..............................94
7.3.TheHALEestimatesandourdirectcalculations.............95
7.4.Conclusion..................................96
7.5.References..................................96
Chapter8.VaccinationCoverageAgainstSeasonalInfluenza ofWorkersinthePrimaryHealthCareUnitsinthePrefecture ofChania .......................................97
AggelikiM ARAGKAKI andGeorgeM ATALLIOTAKIS
8.1.Introduction.................................98
8.2.Materialandmethod.............................98
8.3.Results....................................101
8.4.Discussion..................................105
8.5.References..................................107
Chapter9.SomeRemarksontheCoronavirusPandemic inEurope .......................................109
KonstantinosZ AFEIRIS andMariannaK OUKLI
9.1.Introduction.................................109
9.2.Background.................................110
9.2.1.CoVpathogens..............................110
9.2.2.ClinicalcharacteristicsofCOVID-19.................111
9.2.3.Diagnosis.................................113
9.2.4.EpidemiologyandtransmissionofCOVID-19............113
9.2.5.Countryresponsemeasures.......................115
9.2.6.TheroleofstatisticalresearchinthecaseofCOVID-19 anditschallenges................................119
9.3.Materialsandanalyses...........................119
9.4.Thefirstphaseofthepandemic......................121
9.5.Concludingremarks.............................126 9.6.References..................................127
Part2.AppliedStochasticandStatisticalModelsandMethods ...135
Chapter10.TheDoubleFlexibleDirichlet:AStructuredMixture ModelforCompositionalData .........................137
RobertoA SCARI ,SoniaM IGLIORATI andAndreaO NGARO
10.1.Introduction.................................138
10.1.1.TheflexibleDirichletdistribution..................139
10.2.ThedoubleflexibleDirichletdistribution................140
10.2.1.Mixturecomponentsandclustermeans...............141
10.3.Computationalandestimationissues...................144
10.3.1.Parameterestimation:theEMalgorithm...............145
10.3.2.Simulationstudy............................148
10.4.References.................................151
Chapter11.QuantizationofTransformedLévyMeasures .......153 MarkAnthonyC ARUANA
11.1.Introduction.................................153
11.2.Estimationstrategy.............................156
11.3.Estimationofmassesandtheatoms...................159
11.4.Simulationresults.............................165
11.5.Conclusion.................................166
11.6.References.................................167
Chapter12.AFlexibleMixtureRegressionModelforBounded MultivariateResponses .............................169
AgneseM.D I B RISCO andSoniaM IGLIORATI
12.1.Introduction.................................169
12.2.FlexibleDirichletregressionmodel...................170
12.3.Inferentialissues..............................172
12.4.Simulationstudies.............................173
12.4.1.Simulationstudy1:presenceofoutliers...............174
12.4.2.Simulationstudy2:genericmixtureoftwoDirichlet distributions...................................179
12.4.3.Simulationstudy3:FDdistribution.................180
12.5.Discussion.................................182
12.6.References.................................183
Chapter13.OnAsymptoticStructureoftheCritical Galton–WatsonBranchingProcesseswithInfiniteVariance andAllowingImmigration ............................185 AzamA.I MOMOV andErkinE.T UKHTAEV
13.1.Introduction.................................185
13.2.InvariantmeasuresofGWprocess....................187
13.3.InvariantmeasuresofGWPI.......................190
13.4.Conclusion.................................193
13.5.References.................................194
Chapter14.PropertiesoftheExtremePointsoftheJoint EigenvalueProbabilityDensity FunctionoftheWishartMatrix ...195 AsaphKeikaraM UHUMUZA ,KarlL UNDENGÅRD ,SergeiS ILVESTROV , JohnMageroM ANGO andGodwinK AKUBA
14.1.Introduction.................................195
14.2.Background.................................196
14.3.PolynomialfactorizationoftheVandermonde andWishartmatrices...............................197
14.4.MatrixnormoftheVandermondeandWishartmatrices........200 14.5.ConditionnumberoftheVandermondeandWishartmatrices.....203 14.6.Conclusion.................................206
14.7.Acknowledgments.............................206 14.8.References.................................207
Chapter15.ForecastUncertaintyoftheWeighted TARPredictor ....................................211 FrancescoG IORDANO andMarcellaN IGLIO
15.1.Introduction.................................211
15.2.SETARpredictorsandbootstrappredictionintervals..........214
15.3.MonteCarlosimulation..........................218
15.4.References.................................222
Chapter16.RevisitingTransitionsBetweenSuperstatistics .....223 PetrJ IZBA andMartinP ROKŠ
16.1.Introduction.................................223
16.2.Fromsuperstatistictotransitionbetweensuperstatistics........224 16.3.Transitionconfirmation..........................225
16.4.Beck’stransitionmodel..........................227
16.5.Conclusion.................................230
16.6.Acknowledgments.............................231
16.7.References.................................231
Chapter17.ResearchonRetrialQueuewithTwo-Way CommunicationinaDiffusionEnvironment ................233 ViacheslavVAVILOV
17.1.Introduction.................................233
17.2.Mathematicalmodel............................234
17.3.Asymptoticaveragecharacteristics....................236
17.4.Deviationofthenumberofapplicationsinthesystem.........241
17.5.Probabilitydistributiondensityofdevicestates.............247
17.6.Conclusion.................................248
17.7.References.................................248
Preface
Data analysis as an area of importance has grown exponentially, especially during the past couple of decades. This can be attributed to a rapidly growing technology industry and the wide applicability of computational techniques, in conjunction with new advances in analytic tools. Modeling enables analysts to apply various statistical models to the data they are investigating, to identify relationships between variables, to make predictions about future sets of data, as well as to understand, interpret and visualize the extracted information more strategically. Many new research results have recently been developed and published and many more are developing and in progress at the present time. The topic is also widely presented at many international scientific conferences and workshops. This being the case, the need for the literature that addresses this is self-evident. This book includes the most recent advances on the topic. As a result, on one hand, it unifies in a single volume all new theoretical and methodological issues and, on the other, introduces new directions in the field of applied data analysis and modeling, which are expected to further grow the applicability of data analysis methods and modeling techniques.
This book is a collective work by a number of leading scientists, analysts, engineers, mathematicians and statisticians, who have been working on the front end of data analysis. The chapters included in this collective volume represent a cross-section of current concerns and research interests in the above-mentioned scientific areas. This volume is divided into two parts with a total of 17 chapters in a form that provides the reader with both theoretical and applied information on data analysis methods, models and techniques, along with appropriate applications.
Part 1 focuses on financial and demographic modeling techniques and includes nine chapters: Chapter 1, “Data Mining Application Issues in the Taxpayer Selection
Process”, by Mauro Barone, Stefano Pisani and Andrea Spingola; Chapter 2, “Asymptotics of Implied Volatility in the Gatheral Double Stochastic Volatility Model”, by Mohammed Albuhayri, Anatoliy Malyarenko, Sergei Silvestrov, Ying Ni, Christopher Engström, Finnan Tewolde and Jiahui Zhang; Chapter 3, “New Dividend Strategies”, by Ekaterina Bulinskaya; Chapter 4, “Introduction of Reserves in Self-adjusting Steering the Parameters of a Pay-As-You-Go Pension Plan”, by Keivan Diakite, Abderrahim Oulidi and Pierre Devolder; Chapter 5, “Forecasting Stochastic Volatility for Exchange Rates using EWMA”, by Jean-Paul Murara, Anatoliy Malyarenko, Milica Rancic and Sergei Silvestrov; Chapter 6, “An Arbitrage-free Large Market Model for Forward Spread Curves”, by Hossein Nohrouzian, Ying Ni and Anatoliy Malyarenko; Chapter 7, “Estimating the Healthy Life Expectancy (HLE) in the Far Past: The Case of Sweden (1751–2016) with Forecasts to 2060”, by Christos H. Skiadas and Charilaos Skiadas; Chapter 8, “Vaccination Coverage Against Seasonal Influenza of Workers in the Primary Health Care Units in the Prefecture of Chania”, by Aggeliki Maragkaki and George Matalliotakis; Chapter 9, “Some Remarks on the Coronavirus Pandemic in Europe”, by Konstantinos N. Zafeiris and Marianna Koukli
Part 2 covers the area of applied stochastic and statistical models and methods and comprises eight chapters: Chapter 10, “The Double Flexible Dirichlet: A Structured Mixture Model for Compositional Data”, by Roberto Ascari, Sonia Migliorati and Andrea Ongaro; Chapter 11, “Quantization of Transformed Lévy Measures”, by Mark Anthony Caruana; Chapter 12, “A Flexible Mixture Regression Model for Bounded Multivariate Responses”, by Agnese M. Di Brisco and Sonia Migliorati; Chapter 13, “On Asymptotic Structure of the Critical Galton–Watson Branching Processes with Infinite Variance and Allowing Immigration”, by Azam A. Imomov and Erkin E. Tukhtaev; Chapter 14, “Properties of the Extreme Points of the Joint Eigenvalue Probability Density Function of the Wishart Matrix”, by Asaph Keikara Muhumuza, Karl Lundengård, Sergei Silvestrov, John Magero Mango and Godwin Kakuba; Chapter 15, “Forecast Uncertainty of the Weighted TAR Predictor”, by Francesco Giordano and Marcella Niglio; Chapter 16, “Revisiting Transitions Between Superstatistics”, by Petr Jizba and Martin Prokš; Chapter 17, “Research on Retrial Queue with Two-Way Communication in a Diffusion Environment”, by Viacheslav Vavilov.
We wish to thank all the authors for their insights and excellent contributions to this book. We would like to acknowledge the assistance of all those involved in the reviewing process of this book, without whose support this could not have been successfully completed. Finally, we wish to express our thanks to the secretariat and,
Preface xiii
of course, the publishers. It was a great pleasure to work with them in bringing to life this collective volume.
Yannis DIMOTIKALIS
Crete, Greece
Alex KARAGRIGORIOU
Samos, Greece
Christina PARPOULA
Athens, Greece
Christos H. SKIADAS
Athens, Greece
December 2020
PART 1
Thischapterprovidesadataanalysisframeworkdesignedtobuildaneffective learningschemeaimedatimprovingtheItalianRevenueAgency’sabilitytoidentify non-complianttaxpayers,withspecialregardtoself-employedindividualsallowedto keepsimplifiedregisters.OurprocedureinvolvesbuildingtwoC4.5decisiontrees, bothtrainedandvalidatedonasampleof8,000auditedtaxpayers,butpredictingtwo differentclassvalues,basedontwodifferentpredictiveattributesets.Thatis,thefirst modelisbuiltinordertoidentifythemostlikelynon-complianttaxpayers,whilethe secondidentifiestheonesthatarearelesslikelytopaytheadditionalduetaxbill. Thistwofoldselectionprocesstargetisneed edinordertomaximizetheoverallaudit effectiveness.Oncebothmodelsareinplace,thetaxpayerselectionprocesswillbe heldinsuchawaythatbusinesseswillonlybeauditediftheyarejudgedasworthyby bothmodels.Thismethodologywillsoonbevalidatedonrealcases:thatis,asample oftaxpayerswillbeselectedaccordingtothe classificationcriteriadevelopedinthis chapterandwillsubsequentlybeinvolvedinsomeauditprocesses.
1.1.Introduction
Frauddetectionsystemsaredesignedtoautomateandhelpreducethemanualparts ofascreening/checkingprocess(Phua etal. 2005).Dataminingplaysanimportant roleinfrauddetectionasitisoftenappliedtoextractfraudulentbehaviorprofiles hiddenbehindlargequantitiesofdataand, thus,maybeusefulindecisionsupport systemsforplanningeffectiveauditstrategies.Indeed,hugeamountsofresources (toputitbluntly,money)mayberecoveredfromwell-targetedaudits.Thisexplains theincreasinginterestandinvestmentsofbothgovernmentsandfiscalagencies
ChapterwrittenbyMauroB ARONE ,StefanoP ISANI andAndreaS PINGOLA
inintelligentsystemsforauditplanning.TheItalianRevenueAgency(hereafter, IRA)itselfhasbeenstudyingdataminingapplicationtechniquesinordertodetect taxevasion,focusing,forinstance,onthetaxcreditsystem,supposedtosupport investmentsindisadvantagedareas(deSistiandPisani2007),onfraudrelatedto creditmechanisms,withregardtovalue-addedtax–ataxthatisleviedontheprice ofaproductorserviceateachstageofproduction,distributionorsaletotheend consumer,exceptwhereabusinessistheendconsumer,whichwillreclaimthisinput value(Basta etal. 2009)andonincomeindicatorsaudits(Barone etal. 2017).
Thischaptercontributestotheempiricalliteratureonthedevelopmentof classificationmodelsappliedtothetaxevasionfield,presentingacasestudythat focusesonadatasetof8,000auditedtaxpayersonthefiscalyear2012,eachof themdescribedbyasetoffeatures,concerning,amongothers,theirtaxreturns,their propertiesandtheirtaxnotice. 1
Inthiscontext,allthetaxpayersareinsomeway“unfaithful”,sinceallofthem havereceivedataxnoticethatsomehowrectifiedthetaxreturntheyhadfiled.Thus, thepredictiveanalysistoolwedevelopisdesignedtofindpatternsindatathatmay helptaxofficesrecognizeonlytheriskiesttaxpayers’profiles.
Evidenceondataathandshowsthatourfirstmodel,whichisdescribedindetail later,isabletodistinguishthetaxpayerswhoareworthyofcloserinvestigationfrom thosewhoarenot. 2
However,bydefiningtheclassvalueasafunctionofthehigherduetaxes,we satisfytheneedoffocusingonthetaxpayerswhoaremorelikelytobe“significant” taxevaders,butwedonotensureanefficient collectionoftheirtaxdebt.Indeed,data showsthatasthetaxbillincreases,thenumberofcoercivecollectionproceduresput inplacealsoincreases.Unfortunately,these proceduresarehighlyinefficient,asthey areabletoonlycollectabout5%oftheoverallcreditsclaimedagainsttheaudited taxpayers(ItalianCourtofAuditors2016).Asaresult,thetaxauthorities’abilityto collecttheduetaxesmaybejeopardized.
Furtheranalysisisthusdevotedtofindingawaytodiscover,amongthe “significant”evaders,themostsolventones.Werecallthatthe2018–2020Agreement betweentheIRAandtheMinistryofFinancestatesthatauditeffectivenessis measured,amongothers,byanindicatorthatissimplyequaltothesumofthe collectedduetaxeswhich summarizestheeffectivenessoftheIRA’seffortstotackle taxevasion (MinistryofEconomyandFinance–IRAAgreementfor2018–2010 2018).Thisisareasonableindicatorbecause theordinaryactivitiestakeninthefight
1Ataxnoticeisaformalwritten actthroughwhichtaxauthoritiesassessahigherduetaxable incomewithrespecttothedeclaredone.
2DataanalysesareperformedusingWEKA–thedataminingworkbenchdevelopedatWaikato UniversityinHamilton,NewZealand,releasedundertheGNUGPLlicense.
againsttaxevasionarecrucialfromtheStatebudgetpointofview,becausepublic expenditures(i.e.publicservices)strictlydependontheamountofpublicrevenue. Ofcourse,fraudandotherincorrectfiscalbehaviorsmaybetackled,eventhoughno taxcollectionisguaranteed,inorderto reachthemaximumtaxcompliance.Such extraactivitiesmayalsobejointlyconductedwiththeFinance GuardorthePublic Prosecutoriftaxoffensesarise.
Therefore,totackleoursecondproblem,i.e.toguaranteeacertaindegreeofdue taxcollection,atrivialfactthatwestartfromisthatataxpayerwithnopropertieswill notbewillingtopayhisdues,whereasifhehadsomethingtolose(ahomeoracar thatcouldbeseized),then,iftheIRA’sclaimisright,itismoreprobablethathemight reachanagreementwiththetaxauthorities.
Therefore,asecondmodelonlyfocusingonafewfeaturesindicatingwhether thetaxpayerownedsomekindofassetsornotisbuilt,inordertopredicteachtax notice’sfinalstatus(inthiscase,weonlydistinguishbetweenstatusesendingwithan enforcedrecoveryproceedingandstatuses wheresuchenforcedrecoveryproceedings donottakeplace).Oncebothmodelsareavailable,thetaxpayerselectionprocessis heldinsuchawaythatbusinesseswillonlybeauditediftheyarejudgedasworthyby bothmodels.
Thekeyfeatureofourprocedureisthetwofoldselectionprocesstarget,neededto maximizetheIRA’sauditprocesses’effectiveness.Themethodologywesuggestwill soonbevalidatedinrealcasesi.e.asampleoftaxpayerswillbeselectedaccordingto theclassificationcriteriadevelopedinthischapterandwillbesubsequentlyinvolved insomeauditprocesses.
1.2.Materialsandmethods
1.2.1. Data
Dataonhandreferstoasampleof8,028auditedself-employedindividualsfor fiscalyear2012,eachdescribedbyasetoffeatures,concerning,amongothers,their taxreturns,theirpropertiesandtheirtaxnotice.3
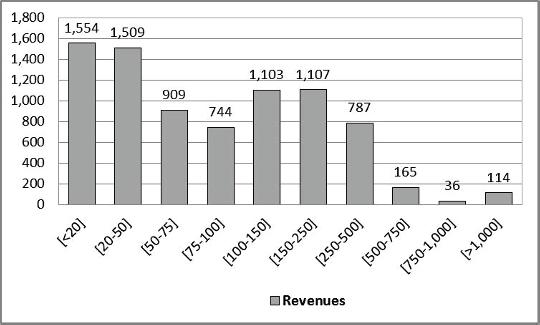
Justfordescriptivepurposes,wecandepictthestatisticaldistributionofthe revenuesachievedbythebusinessesinoursample,groupedinclasses(inthousands ofeuros),inFigure1.1.
Mostofourdatasetismadeupofsmall-sizedtaxpayers,ofwhichalmost50% showrevenueslowerthan C75,000peryearandonly4%higherthan C500,000, withasampleaverageof C146,348.
3TheIRAsentatotalof59,269taxnoticesconcerningfiscalyear2012toself-employed individualsallowedtokeepsimplifiedregisters,sowecanmanageaquitesignificantsample.
Foreachtaxpayerinthedataset,bothhistaxnoticestatusandtheadditionaldue taxes(i.e.theadditionalrequestedtaxamount)areknown.
Herecomesthefirstproblemthatneedstobetackled:theadditionalduetaxis anumericattributewhichmeasurestheseriousnessofthetaxpayer’staxevasion, whereasouralgorithms,aswewillshowlateron,needcategoricalvaluesinorderto predict.Thus,wecannotdirectlyusetheadditionalduetaxes,butweneedtodefinea classvariable anddecidebothwhichvaluesitwilltakeandhowtomapeachnumeric valuereferredtotheadditionalduetaxesintosuchcategoricalvalues.
1.2.2. Interestingtaxpayers
Wemustdefineafunction f(x) whichassociates,toeachelement x inthedataset, acategoricalvaluethatshowsitsfraudriskdegreeandrepresentsthe class our firstmodelwilltrytopredict.Ofcourse,afunctionthatlabelsallthetaxpayersin thedatasetas taxevaders wouldbeuseless.Thus,adistinctionneedstobedrawn betweenserioustaxevasioncasesandthosethatarelessrelevant.Tothispurpose, wesomehowfollow(Basta etal. 2009)andchoosetodividethetaxpayersintotwo groups,the interesting onesandthe notinteresting ones,fromthetaxadministration pointofview(toacertainextent, interesting standsfor“itmightbeinteresting forthetaxadministrationtogoandcheckwhat’sgoingon...”),basedontwo criteria:profitability(i.e.theabilitytoidentifythemostseriouscasesoftaxevasion, independentlyfromallotherfactors)andfairness(i.e.theabilitytoidentifythemost seriouscasesoftaxevasion,withrespecttothetaxpayer’sturnover).
Honesttaxpayersaretreatedas notinteresting taxpayers,eventhoughthislabel isusedtoindicatemoderatetaxevasioncases.Wearesomehowforcedtousethis approximationsinceweonlyhavedataontaxpayerswhoreceivedataxnotice,andnot
Figure1.1. Revenuesdistribution
ontaxpayersforwhichanauditprocessmayhavebeenclosedwithoutqualifications, ormayhavenotevenbeenstarted.
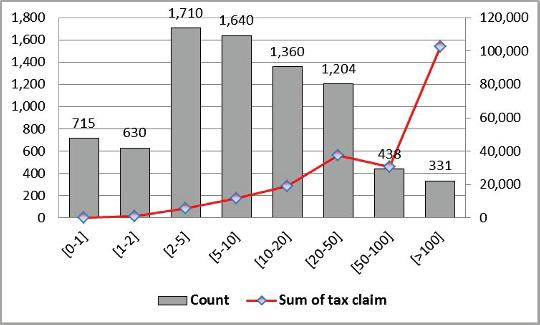
Therefore,inordertotakethe profitabilityissue intoaccount,wedefineanew variable,calledthe taxclaim,whichrepresentsthehigherassessedtaxesifthetax noticestageisstill open,orthehighersettledtaxesifthestagestatusis definitive.Note thatthehigherassessedtaxcouldbedifferentfromthehighersettledtax,because theIRAandthetaxpayer,whilereachinganagreement,canbothreconsidertheir positions.The taxclaim distributiongroupedinclasses(again,inthousandsofeuros) isshowninFigure1.2.
Figure1.2. Taxclaimdistribution.Foracolorversionofthisfigure,see www.iste.co.uk/dimotikalis/analysis2.zip
Theleftverticalaxisisrelatedtothe taxclaim distribution,groupedintheclasses shownonthehorizontalaxis;therightverticalaxis,onthecontrary,sumsupthe monetary taxclaim amountthatarisesfromeachgroup(inthousandsofeuro). Therefore,asitcaneasilybeseen,the331 mostprofitabletaxnotices(12%ofthe total)accountforalmosthalfofthetaxrevenuearisingfromourdataset.
The fairness criterionisthenintroducedtoaddresstheauditprocess,eventowards smallerfirms(whichusuallyarechargedsmalleramountsofdueincometaxes),and itisusefulasitallowsthetaxauthoritiestonotdiscriminateagainsttaxpayersonthe basisoftheirturnoverandintroducesadeterrenteffectwhichimprovestheoverall tax compliance
Therefore,wedefineanothervariable, calledZ,whichtakesintoaccount,foreach taxpayer,bothhisturnoverandrevenues,andcomparesthemtothe taxclaim.More formally,bothoftheratios taxclaim turnover and taxclaim revenues arecomputed.Then,theminimum betweenthesetworatiosand1istaken.Thatis,thevariableZvalue,whichthus rangesfrom0to1.
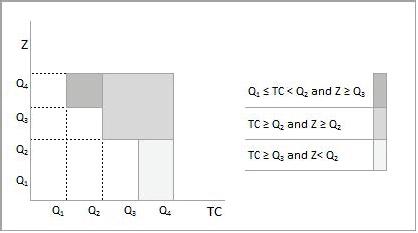
Now,forboth taxclaim (TC)andZ,wecalculatethe25thpercentile(Q1 ),the medianvalue(Q2 )andthe75thpercentile(Q3 ).Wethenstatethatataxpayermaybe considered interesting ifhesatisfiesoneofthefollowingconditions:
Q1 ≤ TC<Q2 andZ ≥ Q3
TC ≥ Q2 andZ ≥ Q2
TC ≥ Q3 andZ<Q2
Thethreeabove-mentionedrulescanberepresentedasinFigure1.3.
Figure1.3. Determininginterestingandnotinterestingtaxpayers.Fora colorversionofthisfigure,seewww.iste.co.uk/dimotikalis/analysis2.zip
Oncethepopulationofourdatasetisentirelydividedinto interesting and not interesting taxpayers,wecanseefromTable1.1thatthe interesting onesarefarmore profitable thantheothers(taxclaim valuesareinthousandsofeuros).Amachine learningtoolabletodistinguishthesetwokindsoftaxpayersfairlywellwouldthen beveryuseful.
Ourfirstmodeltaskwillthenbethatofidentifying,withacertainconfidence degree,thetaxpayerswhoaremorelikelytohaveevaded(bothinabsolutetermsand asapercentageofrevenuesorturnover).
Theliteratureontaxfrauddetection, althoughusingdifferentmethodsand algorithms,isusuallyonlyconcernedaboutthisissue,i.e.infindingthebestway toidentifythemostrelevantcasesoftaxevasion(Bonchi etal. 1999;Wu etal. 2012; GonzalezandJ.D.Velasquez2013;deRoux etal. 2018).
Thereisanothercrucialissuethathastobetakenintoaccount,i.e.theeffective taxauthorities’abilitytocollectthetaxdebtarisingfromthetaxnoticessenttoallof theunfaithfultaxpayers.
Notinteresting Interesting TaxclaimNumTotaltaxAverageNumTotaltaxAverage claimclaim
[0-1]7363220.44000.00 [1-2]6319421.49000.00
[2-5]1,6075,4093.371385634.08
[5-10]1,1277,7276.865174,1578.04 [10-20]4465,91113.2590213,13914.57 [20-50]000.001,16436,05630.98
[50-100]000.0043330,05569.41
[100+]000.00327101,987311.89
Total4,54720,3114.473,481185,95753.42
Table1.1. Taxclaim,interestingandnotinterestingtaxpayers
1.2.3. Enforcedtaxrecoveryproceedings
Whathappensifataxpayerdoesnotspontaneouslypaytheadditionaltaxamount heischarged?Well,afterawhile,coercivecollectionprocedureswillbedeployed bythetaxauthorities.However,aswehaveseenabove,theseproceduresarehighly ineffective,astheyonlycollectaboutthe5%oftheoverallcreditsclaimedagainstthe auditedtaxpayers.
Indeed,datashowsthatcoerciveprocedurestakeplaceinalmost40%ofcases, althoughitsdistributionisnotuniform:theyaremorefrequentifthetaxbillishigh, asreportedinTable1.2(again, taxclaim valuesareinthousandsofeuros).
TaxclaimCoerciveproceduresTotal
NoYes
[0-1]578158736 [1-2]476155631
[2-5]1,2684771,745
[5-10]1,0725721,644
[10-20]7456031,348
[20-50]5116531,164 [50-100]159274433
[100+]90237327
Total4,8993,1298,028
Table1.2. Numberofcoerciveprocedurespertaxclaiminterval
Table1.2isactuallyadoublefrequencytable,whichcanbeusedtoinvestigatethe existingrelationshipbetween thetwocategoricalvariables, Coerciveprocedures and Taxclaim (theybothtakeonvaluesthatarelabels).Recallthatgivencharacters X and Y, X isindependentfrom Y ifforall Y values,therelativedistributionof X doesnot change.Therefore,aquickglanceatTable1.2showsthat Coerciveprocedures depend onthevaluestakenby Taxclaim
Inamoreformalway,followingtheOpenstax(2013)notation,wecouldalso performatestofindependenceforthesevariables,byusingthewell-knowntest statisticforatestofindependence:
where O istheobservedvalue, E istheexpectedvalue,calculatedas(row total)(columntotal)overtotalnumbersurveyed.
GiventhevaluesinTable1.2,thetestwouldletusrejectthehypothesisofthetwo variablesbeingindependentata1%levelofsignificance:therefore,fromthedata, thereissufficientevidencetoconcludethat Coerciveprocedures aredependentonthe Taxclaim level.
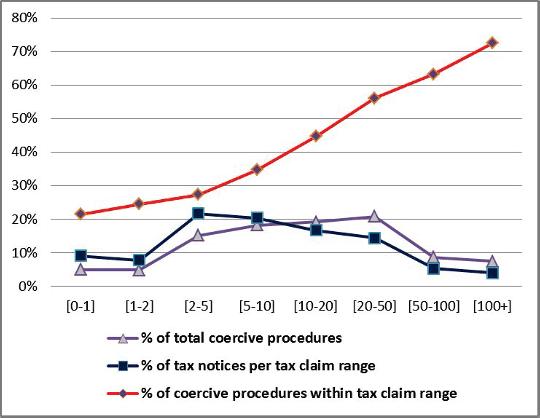
Itiseasytocalculate,fromTable1.2,foreach taxclaim interval,thetotalcoercive proceduresrate,thetaxnoticesrateandthecoerciveprocedureswithinthat taxclaim intervalrate(alloftheseratiosaredepictedinFigure1.4).
AcloselookatFigure1.4showsthatuntilthetaxclaimis“low”(lessthan C10,000;pleasenotethattheintervalsareinthousandsofeuros),theblueline,i.e. thepercentageoftaxnotices,isabovethepurpleone,i.e.thepercentageofcoercive procedures,whileforhighervaluesoftaxclaim,thebluelineisunderthepurpleone. Thisisquitestrongevidencethatcoerciveproceduresarenotindependentfromtax claim.
Asaresult,theredlineshowsthatthehigherthetaxclaim,thehigherthe percentageofprocedureswithinthetaxclaimrangeitself,uptoover70%inthelast and,apparently,mostdesirablerange.
Therefore,withjustonemodelinplace,whosetaskistorecognize interesting taxpayers,thetaxauthoritieswouldriskfacingmanycasesofcoerciveprocedures. Thustheirabilitytoensuretaxcollectionmaybeseriouslyjeopardized.
Wethereforeneedtofindawaytodiscover,amongthemost interesting taxpayers, themostsolventones,themostwillingtopay.
Figure1.4. Coerciveproceduresandtaxclaim.Foracolorversionof thisfigure,seewww.iste.co.uk/dimotikalis/analysis2.zip
Wecanstartbyobservingthatataxpayerwithnopropertieswillprobablynotbe willingtopayhisdues.Therefore,asecondmodelonlyfocusingonafewfeatures indicatingwhetherthetaxpayerownedsomekindofassetsornotisbuilt,inorderto predictifataxnoticewillendinanenforcedrecoveryproceedingornot.
Oncebothmodelsareavailable,thetaxpayerselectionprocessisheldinsucha waythatundertakingswillonlybeauditedifjudgedworthybybothmodels.
1.2.4. Themodels
Ourselectionstrategyneedstotakeintoaccounttwocompetingdemands:onone hand,taxnoticesmustbe profitable,i.e.theyhavetoaddressserioustaxfraudorthe taxevasionphenomena;ontheother, taxcollectability mustbeguaranteedinorderto justifyallofthetaxauthorities’efforts.
Tothispurpose,wedeveloptwomodels,bothintheformofclassificationtrees: thefirstonepredictswhetherataxpayeris interesting ornot,whilethesecondpredicts thefinalstageofataxnotice,distinguishingbetweenthoseendingwithanenforced recoveryproceedingandtheothers,wheresuchenforcedrecoveryproceedingsdonot takeplace.
Thefirstone’sattributesaretakenfromseveraldatasetsrunbytheIRAandare relatedtothetaxpayers’taxreturnsandtheirannexes(suchasthe sectorstudies),their propertiesdetails,theircustomersandsupplierslistsandtheirtaxnotices,whereasthe secondoneonlyfocusesonasetoffeaturesconcerningtaxpayers’assets.
Inthetaxpayerselectionprocess,modelsthatareeasiertointerpretarepreferredto morecomplexmodels.Typically,decisiontreesmeettheaboverequestedconditions, sobothofourmodelstakethatform.
Inbothcases,insteadofconsideringjustonedecisiontree,bothpracticaland theoreticalreasons(Breiman1996)leadustowardsamoresophisticatedtechnique, knownas bagging,whichstandsforbootstrapaggregating,withwhichmanybase classifiersarecomputed(inourcase,manytrees).
Moreover,acostmatrixisusedwhilebuildingthemodels.Indeed,inourcontext, toclassifyanactual notinteresting taxpayeras interesting isamuchmoreseriouserror thanthatofclassifyingasanactual interesting taxpayeras notinteresting,basedonthe factthat,generally,taxoffices’humanresourcesarebarelysufficienttoperformallof theauditstheyareassigned.Therefore,aslongasofficesaudit interesting taxpayers, everythingisfine,eventhoughmany interesting taxpayersmaynotbeconsidered.In thesameway,topredictthatataxnoticewillnotendinacoerciveprocedurewhen itactuallydoes,isamuchmoreseriouserrorthanthatofclassifyingataxnotice finalstagetheotherwayround.Therefore,differentweightsaregiventodifferent misclassificationerrors.
Finally,RossQuinlan’sC4.5decisiontreealgorithmisusedtobuildthebase classifierswithinthe bagging process.
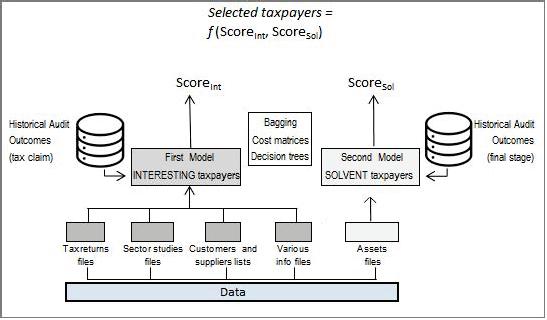
Figure1.5putsallthepiecesofourmodelstogether.
Figure1.5. Thetwomodelstogether
1.3.Results
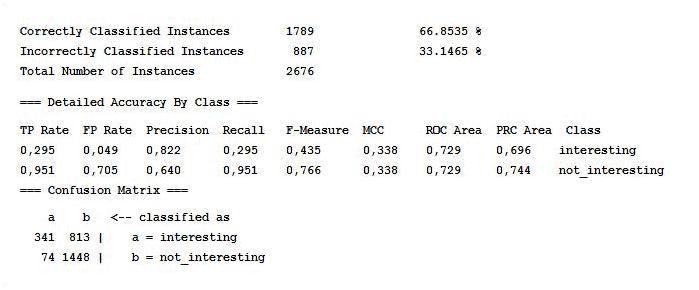
Ourfirstmodelpredicts,onthebasisoftheavailablefeatures,415taxpayersto be interesting (i.e.15.5%oftheentiretestset),withaprecisionrateofabout80%,as showninFigure1.6.
Figure1.6. Firstmodelstatisticsandconfusionmatrix
Intermsof taxclaim amounts,themodelappearstoperformquitewell,sincethe selectedtaxpayers’averagedueadditionaltaxesamountsto C49,094,whereasthe averageontheentiretestsetisequalto C22,339.
Sofar,wehaveshownthatourmodel,onaverage,isabletodistinguishserioustax evasionphenomenafromthelesssignificantones.Butwhataboutthetaxcollection issue?Todealwiththismatter,weshouldinvestigatewhatkindoftaxpayerswehave justselected.Forthispurpose,Table1.3showsthatthemajorityofthetaxpayers,the modelwouldselect,wouldalsobesubjecttocoerciveprocedures(aswecansee,the sumofthevaluesofeachcolumnis100%).
PredInterestingNotInteresting Act
Table1.3. Predictedvaluesversusactualcoerciveprocedures
Thus,manyoftheselectedtaxpayershaveadebtpaymentissue.Thisjeopardizes theoverallselectionprocessefficiencyandeffectiveness.AspointedoutbytheItalian CourtofAuditors,coerciveprocedures,onaverage,areabletocollectonlyabout5% oftheoverallclaimedcredits.
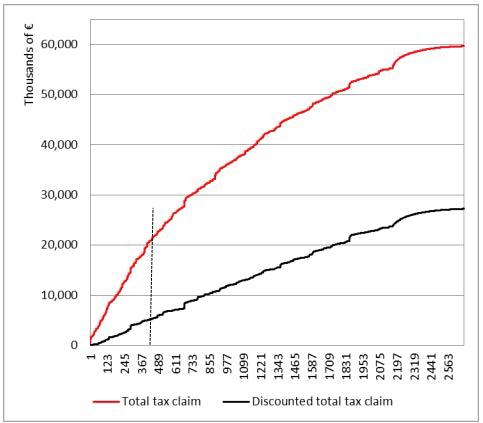
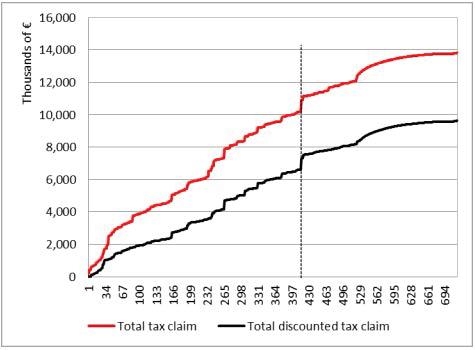
Toevaluatetheproblemextent,wecanreplacetheactual taxclaim value correspondingtotheproblematictaxpayerswiththe estimatedcollectabletax,which isequaltothe taxclaim multipliedbyadiscountfactorof95%,andcomparethetwo scenarios,asinFigures1.7and1.8,wherewedepictboththetotal taxclaim andthe average taxclaim arisingfromthetaxpayers’noticesintheentiretestset.
Figure1.7. Totaltaxclaimanddiscountedtaxclaim.Foracolorversion ofthisfigure,seewww.iste.co.uk/dimotikalis/analysis2.zip
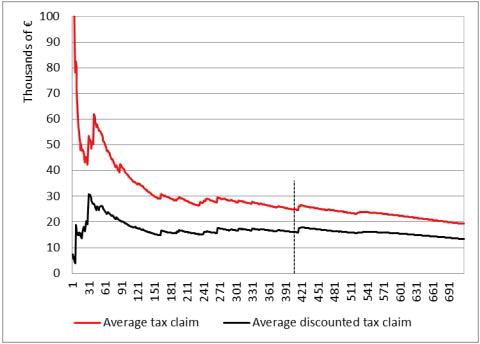
Taxpayersareordered,fromlefttoright,accordingtotheirprobabilityofbeing interesting,ascalculatedbyourmodel.Figure1.7,forinstance,depictsthecumulative taxclaim chargeduptoacertaintaxpayer:theredlinevaluesrefertotheadditional taxesrequestedwiththetaxnotices,whiletheblacklineisdrawnbyconsidering thediscountedvalues.Thedashedverticallineindicatesthelevelscorrespondingto thelastselectedtaxpayeraccordingtothe model(inourcase,the415th).Recallthat whenassociatingaclasslabelwitharecord,themodelalsoprovidesaprobability, whichhighlightshowconfidentthemodelisaboutitsownprediction.Therefore,to acertainextent,itsetsarankingamongtaxpayers,whichwecanexploittodraw Figures1.7and1.8.Aswecaneasilyobserve,theoverall taxclaim chargedtothe selectedtaxpayersplummetsfrom C20millionto C5million,andtheaverage tax claim,depictedinFigure1.8,from C49,000to C12,000.Thus,theselectionprocess, whichreliedonourdataminingmodelandatfirstsightseemedtobeveryefficient, showssomeimportantflawsthatweneedtoface.Infact, taxcollectability isnot adequatelyguaranteed.

Figure1.8. Averagetotaltaxclaimanddiscountedtaxclaim.Fora colorversionofthisfigure,seewww.iste.co.uk/dimotikalis/analysis2.zip
Asecondmodelmaythenhelpusbypredictingwhichtaxpayerswouldnotbe subjecttocoerciveprocedures,byfocusingo nasetoffeaturesconcerningtheirassets.
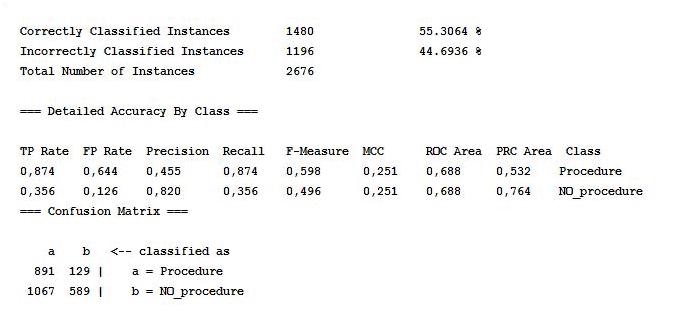
Again,withaprecisionrateofabout80%,asshowninFigure1.9,themodel appearstobesuccessful.
Figure1.9. Secondmodelstatisticsandconfusionmatrix
PredProcedureNoProcedure Act Interesting46.94%32.73%
Table1.4. Predictedcoerciveproceduresversus actualinterestingtaxpayers
Thissecondmodelcouldbeusefulonourend,eventhoughitmayhavesome caveats.First,mostofthetaxpayersthatthemodelclassifiesaspeoplethatwillnot faceacoerciveprocedurearealso notinteresting,asshowninTable1.4.Again,the sumofthevaluesofeachcolumnis100%.
Infact,thissecondmodel’sperformanceintermsof taxclaim appearstohave worsenedwithrespecttothefirst,sincethe noprocedure taxpayers’averagedue additionaltax,calculatedonthefirst415 taxpayers(accordingtotherankingsetby thismodel,whichis,obviously,dramaticallydifferentfromtheonesetbythefirst modelwehaveseen),isequalto C20,388.However,theaverage collectabletaxclaim isequalto C13,493,whichisalittlebitbetterthantheonewehaveseenbefore.
Wepointoutthatthroughoutthischapter,wehavecomparedsetsofselected taxpayerswiththesamecardinality,fortwokindsofconsiderations:first,tax authorities,reasonably,haveafixedbudgetofauditstoperform,socomparisons betweenmodelsshouldbedonesubjecttoagivennumberofaudits;second,for comparabilityreasons,sincesmallersetstendtoperformmore(seeFigure1.8,where theaverage taxclaim decreaseswhilethenumberofselectedtaxpayersincreases).
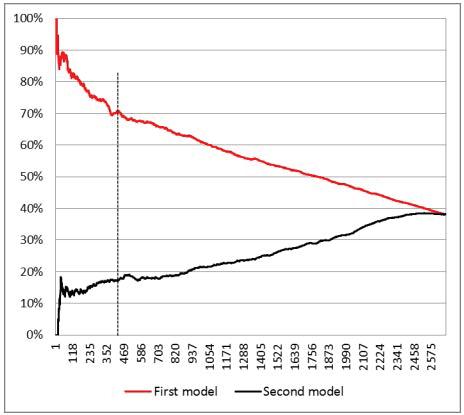
Therefore,inthissecondmodelwehavedeveloped,thehighrateof notinteresting taxpayers,ononehand,causesadropintheaverage taxclaim (from49,000to 20,000),but,ontheother,itcontributestotheslightenhancementofthediscounted average taxclaim (from C12,000to C13,000),sinceonlyafewofthe notinteresting taxpayerspassthroughacoerciveprocedure.Figure1.10compares,foreachnumber ofselectedtaxpayers,thedifferentcoerciveproceduresratesarisingfromthetwo models.
Whatwecando,then,isusethetwomodels“together”.Forinstance,wecould exploitthefirstmodelinordertosortthetaxpayerseligibletobeselectedandthe secondonetodiscardtheoneslikelytobesubjecttocoerciveprocedures.
Insuchaway,ifweimaginethatweselectour415taxpayersagain,onone hand,wewouldselectboth interesting and notinteresting taxpayers(onlyifthe secondmodelhadpredictedthatno interesting taxpayerswouldgothroughacoercive
procedure,wewouldhaveselectedonly interesting taxpayers),but,ontheother,we wouldalsoselectthetaxpayerswhoaremorelikelytopaytheirtaxdebts.
Figure1.10. Coerciveprocedures’rates.Foracolorversionofthis figure,seewww.iste.co.uk/dimotikalis/analysis2.zip
Thisisjustanexampleanditisnottheonlywaywecancombinethetwomodels. Indeed,thereisspaceforpolicymakerstoexploitthetwomodelsindifferentways, dependingonthekindoftradeoffchoices theymaywanttoreach,concerningthetwo goalsoftheauditprocess:itsprofitabilityanditstaxcollectability.Forinstance,a selectionprocesscouldonlybetargetedtowardsinterestingtaxpayers and taxpayers withoutpaymentissues.
Anyway,doesthetradeoffwehavesketchedabovework?
Figures1.11–1.13canshedsomelightonour ensemblemodel’sperformance. Asusual,thedashedverticallineshowsthevaluescorrespondingtothenumberof taxpayerswewishtoselect.
Inourcase,thus,withthe ensemblemodel,wewouldclaim,onaverage, C26,219 fromtheselectedtaxpayersandwewouldhopefullycollect,onaverage, C17,542 fromeachofthem,ofwhomonly25%arepredictedtoincurincoerciveprocedures.
Figure1.11. Totaltaxclaim.Foracolorversionofthisfigure,see www.iste.co.uk/dimotikalis/analysis2.zip
Figure1.12. Averagetaxclaim.Foracolorversionofthisfigure,see www.iste.co.uk/dimotikalis/analysis2.zip