Business Forecasting
The Emerging Role of Artificial Intelligence and Machine Learning
Edited by
Michael Gilliland
Len Tashman
Udo Sglavo
Copyright © 2021 by SAS Institute Inc. All rights reserved.
Published by John Wiley & Sons, Inc., Hoboken, New Jersey.
Published simultaneously in Canada.
No part of this publication may be reproduced, stored in a retrieval system, or transmitted in any form or by any means, electronic, mechanical, photocopying, recording, scanning, or otherwise, except as permitted under Section 107 or 108 of the 1976 United States Copyright Act, without either the prior written permission of the Publisher, or authorization through payment of the appropriate per-copy fee to the Copyright Clearance Center, Inc., 222 Rosewood Drive, Danvers, MA 01923, (978) 750-8400, fax (978) 646-8600, or on the Web at www.copyright.com. Requests to the Publisher for permission should be addressed to the Permissions Department, John Wiley & Sons, Inc., 111 River Street, Hoboken, NJ 07030, (201) 748-6011, fax (201) 748-6008, or online at www.wiley.com/go/permissions.
Limit of Liability/Disclaimer of Warranty: While the publisher and author have used their best efforts in preparing this book, they make no representations or warranties with respect to the accuracy or completeness of the contents of this book and specifically disclaim any implied warranties of merchantability or fitness for a particular purpose. No warranty may be created or extended by sales representatives or written sales materials. The advice and strategies contained herein may not be suitable for your situation. You should consult with a professional where appropriate. Neither the publisher nor author shall be liable for any loss of profit or any other commercial damages, including but not limited to special, incidental, consequential, or other damages.
For general information on our other products and services or for technical support, please contact our Customer Care Department within the United States at (800) 762-2974, outside the United States at (317) 572-3993, or fax (317) 572-4002.
Wiley publishes in a variety of print and electronic formats and by print-on-demand. Some material included with standard print versions of this book may not be included in e-books or in print-on-demand. If this book refers to media such as a CD or DVD that is not included in the version you purchased, you may download this material at http://booksupport.wiley.com.
For more information about Wiley products, visit www.wiley.com.
Library of Congress Cataloging-in-Publication Data
Names: Gilliland, Michael, editor. | Tashman, Len, 1942- editor. | Sglavo, Udo, 1968- editor. | John Wiley & Sons, publisher.
Title: Business forecasting : the emerging role of artificial intelligence and machine learning / edited by Michael Gilliland, Len Tashman, and Udo Sglavo.
Description: Hoboken, New Jersey : Wiley, 2021. | Includes index.
Identifiers: LCCN 2021002141 (print) | LCCN 2021002142 (ebook) | ISBN 9781119782476 (hardback) | ISBN 9781119782599 (adobe pdf) | ISBN 9781119782582 (epub)
Subjects: LCSH: Business forecasting. | Artificial intelligence. | Machine learning.
Classification: LCC HD30.27 .B874 2021 (print) | LCC HD30.27 (ebook) | DDC 658.4/0355028563—dc23
LC record available at https://lccn.loc.gov/2021002141
LC ebook record available at https://lccn.loc.gov/2021002142
Cover Design: Wiley
10 9 8 7 6 5 4 3 2 1
“The future remains uncertain and so it should, for it is the canvas upon which we paint our desires. Thus always the human condition faces a beautifully empty canvas. We possess only this moment in which to dedicate ourselves continuously to the sacred presence which we share and create.”
Frank Herbert, Children of Dune
Contents
Foreword (Spyros Makridakis and Fotios Petropoulos) xi
Preface (Michael Gilliland, Len Tashman, and Udo Sglavo) xv
State of the Art 1
Forecasting in Social Settings: The State of the Art (Spyros Makridakis, Rob J. Hyndman, and Fotios Petropoulos) 1
Chapter 1 Artificial Intelligence and Machine Learning in Forecasting 31
1.1 Deep Learning for Forecasting (Tim Januschowski and colleagues) 32
1.2 Deep Learning for Forecasting: Current Trends and Challenges (Tim Januschowski and Colleagues) 41
1.3 Neural Network–Based Forecasting Strategies (Steven Mills and Susan Kahler) 48
1.4 Will Deep and Machine Learning Solve Our Forecasting Problems? (Stephan Kolassa) 65
1.5 Forecasting the Impact of Artificial Intelligence: The Emerging and Long-Term Future (Spyros Makridakis) 72
Commentary: Spyros Makridakis’s Article “Forecasting The Impact Of Artificial Intelligence” (Owen Davies) 80
1.6 Forecasting the Impact of Artificial Intelligence: Another Voice (Lawrence Vanston) 84
Commentary: Response to Lawrence Vanston (Spyros Makridakis) 92
1.7 Smarter Supply Chains through AI (Duncan Klett) 94
1.8 Continual Learning: The Next Generation of Artificial Intelligence (Daniel Philps) 103
1.9 Assisted Demand Planning Using Machine Learning (Charles Chase) 110
1.10 Maximizing Forecast Value Add through Machine Learning and Behavioral Economics (Jeff Baker) 115
1.11 The M4 Forecasting Competition – Takeaways for the Practitioner (Michael Gilliland) 124
Commentary –The M4 Competition and a Look to the Future (Fotios Petropoulos) 132
Chapter 2 Big Data in Forecasting 135
2.1 Is Big Data the Silver Bullet for Supply-Chain Forecasting? (Shaun Snapp) 136
Commentary: Becoming Responsible Consumers of Big Data (Chris Gray) 142
Commentary: Customer versus Item Forecasting (Michael Gilliland) 146
Commentary: Big Data or Big Hype? (Stephan Kolassa) 148
Commentary: Big Data, a Big Decision (Niels van Hove) 150
Commentary: Big Data and the Internet of Things (Peter Catt) 152
2.2 How Big Data Could Challenge Planning Processes across the Supply Chain (Tonya Boone, Ram Ganeshan, and Nada Sanders) 155
Chapter 3 Forecasting Methods: Modeling, Selection, and Monitoring 163
3.1 Know Your Time Series (Stephan Kolassa and Enno Siemsen) 164
3.2 A Classification of Business Forecasting Problems (Tim Januschowski and Stephan Kolassa) 171
3.3 Judgmental Model Selection (Fotios Petropoulos) 181
Commentary: A Surprisingly Useful Role for Judgment (Paul Goodwin) 192
Commentary: Algorithmic Aversion and Judgmental Wisdom (Nigel Harvey) 194
Commentary: Model Selection in Forecasting Software (Eric Stellwagen) 195
Commentary: Exploit Information from the M4 Competition (Spyros Makridakis) 197
3.4 A Judgment on Judgment (Paul Goodwin) 198
3.5 Could These Recent Findings Improve Your Judgmental Forecasts? (Paul Goodwin) 207
3.6 A Primer on Probabilistic Demand Planning (Stefan de Kok) 211
3.7 Benefits and Challenges of Corporate Prediction Markets (Thomas Wolfram) 215
3.8 Get Your CoV On . . . (Lora Cecere) 225
3.9 Standard Deviation Is Not the Way to Measure Volatility (Steve Morlidge) 230
3.10 Monitoring Forecast Models Using Control Charts (Joe Katz) 232
3.11 Forecasting the Future of Retail Forecasting (Stephan Kolassa) 243
Commentary (Brian Seaman) 255
Chapter 4 Forecasting Performance 259
4.1 Using Error Analysis to Improve Forecast Performance (Steve Morlidge) 260
4.2 Guidelines for Selecting a Forecast Metric (Patrick Bower) 271
4.3 The Quest for a Better Forecast Error Metric: Measuring More Than the Average Error (Stefan de Kok) 277
4.4 Beware of Standard Prediction Intervals from Causal Models (Len Tashman) 290
Chapter 5 Forecasting Process: Communication, Accountability, and S&OP 297
5.1 Not Storytellers But Reporters (Steve Morlidge) 298
5.2 Why Is It So Hard to Hold Anyone Accountable for the Sales Forecast? (Chris Gray) 303
5.3 Communicating the Forecast: Providing Decision Makers with Insights (Alec Finney) 310
5.4 An S&OP Communication Plan: The Final Step in Support of Company Strategy (Niels van Hove) 317
5.5 Communicating Forecasts to the C-Suite: A Six-Step Survival Guide (Todd Tomalak) 325
5.6 How to Identify and Communicate Downturns in Your Business (Larry Lapide) 331
5.7 Common S&OP Change Management Pitfalls to Avoid (Patrick Bower) 338
5.8 Five Steps to Lean Demand Planning (John Hellriegel) 342
5.9 The Move to Defensive Business Forecasting (Michael Gilliland) 346
Afterwords: Essays on Topics in Business Forecasting 351
Observations from a Career Practitioner: Keys to Forecasting Success (Carolyn Allmon) 351
Demand Planning as a Career (Jason Breault) 354
How Did We Get Demand Planning So Wrong? (Lora Cecere) 357
Business Forecasting: Issues, Current State, and Future Direction (Simon Clarke) 358
Statistical Algorithms, Judgment and Forecasting Software Systems (Robert Fildes) 361
The <<Easy Button>> for Forecasting (Igor Gusakov) 364
The Future of Forecasting Is Artificial Intelligence Combined with Human Forecasters (Jim Hoover) 367
Quantile Forecasting with Ensembles and Combinations (Rob J. Hyndman) 371
Managing Demand for New Products (Chaman L. Jain) 376
Solving for the Irrational: Why Behavioral Economics Is the Next Big Idea in Demand Planning (Jonathon Karelse) 380
Business Forecasting in Developing Countries (Bahman Rostami-Tabar) 382
Do the Principles of Analytics Apply to Forecasting? (Udo Sglavo) 387
Groupthink on the Topic of AI/ML for Forecasting (Shaun Snapp) 390
Taking Demand Planning Skills to the Next Level (Nicolas Vandeput) 392
Unlock the Potential of Business Forecasting (Eric Wilson) 394
Building a Demand Plan Story for S&OP: The Business Value of Analytics (Dr. Davis Wu) 396
About the Editors 401
Index 403
Foreword
The forecasting spring began with the M4 Competition, where a complex hybrid approach combining statistical and ML elements came first, providing a 9.4% improvement in its sMAPE relative to that of the Comb benchmark.
Makridakis and Petropoulos (2020)
On March 12, 2020, U.S. toilet paper sales ballooned 734% compared with the same day the previous year, becoming the top-selling product at grocery stores by dollars spent. Clearly, forecasting did not predict the huge surge in demand that created panicbuying – demand that became exaggerated once photos of empty store shelves began circulating on social and mass media. Worse, the scarcity lasted for several months even as manufacturers rushed to produce and ship more paper.
This story reveals two important facts about forecasting. The first relates to its phenomenal failure during the pandemic. The second, even more important one, confirms its astounding success for all other periods when there has always been toilet paper available to buy.
Moreover, it is not just toilet paper. Walmart sells more than 50 million items in its 12,000 stores and online, and it is rare that customers could not find an item they want to buy. Its sophisticated forecasting system accurately predicts the demand for all its products, avoiding stockouts in the great majority of cases. The same is true with essentially most retailers that manage their supply chain in such a way that their customers could buy whatever they want at practically all times when shopping. This achievement is made possible through the accurate forecasts of customer demand and a multitude of actions that make certain that the right items will be available in each store at the correct time to be purchased by the customer wanting to acquire it.
But even during the Covid-19 outbreak the number of products in shortage were limited to some, mostly food categories, hoarded for safety reasons just in case of future scarcities. There were also shifts in purchasing habits away from luxury items to necessities and from physical shopping to online purchases. Forecasting adjusted to the new pandemic reality and after some period of corrections managed to provide reasonably accurate predictions about the products consumers wanted to buy. What the virus has made clear is that our ability to accurately predict the future and be able to estimate the uncertainty of our predictions is straightforward during “normal” periods that account for the great majority of time. However, forecasting can fail, and uncertainty can increase tremendously during unusual periods like the Covid-19 pandemic, during recessions and when rare, unexpected events occur – particularly when people’s
actions greatly affect the future. It is important, therefore, to accept forecasting’s advantages but also its limitations, avoiding unrealistic expectations of what forecasting can achieve.
To do so, executives must understand:
J The forecast is an estimation of a future situation. It is not a target. It is not a plan.
J Forecasting methods, from the simplest to the most sophisticated ones, do not possess any prophetic powers. Their predictions are based on identifying and estimating past patterns and/or relationships that are then extrapolated to forecast the future.
J All forecasts come with an error. All forecasts are uncertain.
J Forecasting accuracy and uncertainty can be estimated consistently in usual, everyday situations when established patterns/relationships remain fairly constant and can be extrapolated reasonably well.
J During periods of recessions/crises, or when unusual events occur, forecasting accuracy deteriorates – often significantly – while the level of uncertainty increases exponentially, and sometimes cannot be measured quantitatively.
J There are trade-offs between the achieved forecasting performance and the respective resources needed (such as data availability, computational cost, and personnel’s time), so companies need to carefully choose an appropriate balance.
J When possible, forecasts should be assessed in terms of their utility (such as the decrease in the holding cost) instead of their forecasting performance.
Forecasting is a unique field in two distinct ways. First, it includes researchers and practitioners both interested in improving the accuracy of their predictions as well as the correct estimation of uncertainty. Second, it is a rare social science field where the equivalent of the experimentation, widely used in physical science, is possible and widely practiced through forecasting competitions. This means that the accuracy and uncertainty of available and proposed methods can be tested empirically, allowing firms to decide on what methods to utilize and researchers to strive to improve them by proving their value with real-life data. In the field of forecasting there are many established facts guiding practitioners and researchers on the most appropriate way to get the maximum benefits from its use, and so less need to rely on personal opinion. As in all fields there are potential problems but also available solutions. Many of these are covered in the first volume of Business Forecasting: Practical Problems and Solutions (published in 2015), which provides thorough and timely guidance for the forecasting problems facing executives, while the updated edition of the book embraces all new ones.
The field of forecasting just passed its 60th birthday since Robert Brown’s pioneering book was published in 1959. His exponential smoothing methods were simple but powerful, and for a long time the most accurate of all available methods, including complex and statistically sophisticated ones, like the Box-Jenkins methodology for ARIMA
models. Fortunately, during recent years, new developments originating in artificial intelligence (AI) and machine learning (ML) have opened some new prospects to not only improve forecasting accuracy but also to correctly estimate uncertainty. These advances commence a forecasting spring, with huge potential for revolutionizing the field. They are moving forecasting into new directions – exploiting new ideas from deep learning (DL), and utilizing information from countless series to predict individual ones with cross learning (CL).
In the M4 competition both the first and the second-best methods applied CL, not only achieving a close to 10% improvement in accuracy over the benchmark (a combination of three simple time series methods) but also attaining a phenomenal degree of correctly estimating the uncertainty in the provided forecasts. These new MLbased methods are still in their infancy. But they open huge opportunities for improvements not only in forecasting accuracy/uncertainty but also in the easiness of obtaining the predictions/uncertainty accomplished by AI, without the need of much human inputs.
During the last five years, data science has grown in importance and size, introducing brand-new ways to forecast and estimate uncertainty. In the M4 competition run in 2018, there were ~600 registrations of mostly statisticians and practitioners to participate, with 49 final submissions. In the M5, run two years later, there have been more than 40,000 registrations of mostly data scientists followed, we suspect, by statisticians and practitioners. The competition featured two tracks, one focusing on pointforecast accuracy (with 5,558 teams and 7,022 participants) and another one focusing on uncertainty (with 1,003 teams and 909 participants). Across both tracks, individuals and teams performed almost 100,000 submissions.
With such numbers involved, it is obvious that the forecasting field is being transformed to a new discipline dominated by data scientists that will grow it substantially in the future in unforeseen ways. The big challenge for the new field will undoubtedly be how to integrate data science and statistics and how the practice of forecasting can benefit from such merging. Will, for instance, simple statistical methods still be appropriate for forecasting at the stock-keeping-unit level, with DL used for products high up in the hierarchy, or vice versa? Will the estimation of uncertainty receive more attention from data scientists as it must supplement their point forecasts to determine, among other tasks, inventory levels and deal with the risks always present in all predictions? These and similar questions are being explored in this new book.
This second volume, Business Forecasting: The Emerging Role of Artificial Intelligence and Machine Learning, details the forthcoming big changes in the field of forecasting. Its first chapter, Artificial Intelligence and Machine Learning in Forecasting, provides ample treatment of how AI is revolutionizing the field, while its second chapter, Big Data in Forecasting, is concerned with the value of data and how it is being used to improve its importance. The remaining book includes model selection and monitoring, measuring forecasting performance, and covers the organizational aspects of forecasting and the use of judgment in the forecasting process. The Afterwords provide
unique perspectives from over a dozen respected academics, consultants, vendors, and industry practitioners – all contributing essays on the issues, current status, and future direction of business forecasting.
Like the first volume, we expect this volume to become a must-read for practitioners. The editors did a fantastic job in delivering a diverse collection of articles and commentaries that offer important and contemporary aspects in forecasting which will help practicing managers to improve the forecasting within their organizations.
SpyroS MakridakiS
Institute for the Future, University of Nicosia Nicosia, Cyprus
FotioS petropouloS School of Management, University of Bath United Kingdom
Preface
In our 2015 compilation, Business Forecasting: Practical Problems and Solutions, we brought together 49 of the most interesting, important, and influential articles published in the field since 2000. The selection centered around fundamental issues in business forecasting, forecasting methods, performance evaluation and reporting, and forecasting process and politics. While these topics are just as relevant today as they were five years ago, we’ve seen a spectacular rise in interest in a new direction – in the role of artificial intelligence and machine learning in business forecasting. Hence the subtitle of this new volume.
Now in 2020, we are writing about forecasting against the backdrop of another spectacular forecasting failure – an unforeseen pandemic. The new compilation features over 60 articles, commentaries, and “op-ed” pieces – all either original or published since 2015. We are pleased to have assembled input from the top academics, consultants, vendors, and industry practitioners – many of the most recognized and respected names in the forecasting profession. Each provides their own unique vision of the issues, current state, and future direction of business forecasting.
There has been much progress in the last five years, and we have attempted to reflect that progress in the selected contributions. After an introductory review of business forecasting’s “state of the art,” the material is organized into five chapters:
1. Artificial Intelligence and Machine Learning in Forecasting
2. Big Data in Forecasting
3. Forecasting Methods: Modeling, Selection, and Monitoring
4. Forecasting Performance
5. Forecasting Process: Communication, Accountability, and S&OP
We close with a lengthy section of Afterwords (described below) from thoughtful contributors in the field.
Each chapter gets a brief introduction, and each article begins with an abstract summarizing its content and significance. Some articles also include commentaries that further expand upon – or argue counter to – the article’s key points.
The authors wish to thank SAS Press and Wiley for initiating the idea of an updated volume, and for accepting the manuscript into the Wiley and SAS Business Series. We were assisted at SAS by Lauree Shephard, who initiated the book proposal, and by Catherine Connolly as Developmental Editor. At Wiley, Susan Cerra was our Senior Managing Editor, and Sheck Cho our Executive Editor.
As in the earlier volume, much of this book’s content first appeared in Foresight: The International Journal of Applied Forecasting, and appears with permission from the International Institute of Forecasters. Len Tashman, co-editor of this compilation and
Foresight’s editor-in-chief, extends special thanks to his staff: Liza Woodruff, Ralph Culver, Mary Ellen Bridge, Holly Lancaster, and Michelle Kitchens. In addition, we thank IIF Business Director Pam Stroud, for her critical support over the years.
We also, again, include several articles from the Journal of Business Forecasting, with permission graciously provided by its editor-in-chief, Dr. Chaman Jain, and the Institute of Business Forecasting. We look forward to the return of live events, and a chance to see our longtime IBF friends: Anish Jain, Stephanie Murray, and Latosha Staton.
This collection includes several adaptations from other previously published work, and we thank the authors and publishers:
J Jeff Baker, for adaptation of his MIT Master’s thesis.
J Lora Cecere, for adaptation of her blog post.
J Charles Chase and SAS, for adaptation of his whitepaper.
J Paul Goodwin, for adaptation from his book Forewarned: A Skeptic’s Guide to Prediction.
J Susan Kahler and Steven Mills, for adaptation of her blog post with his SAS Global Forum paper.
J Stephan Kolassa and Enno Siemsen (as well as publisher Scott Isenberg of Business Expert Press), for adaptation from their book Demand Forecasting for Managers.
J Steve Morlidge, for adaptations from two of his books, Present Sense and The Little (Illustrated) Book of Operational Forecasting.
We also wish to acknowledge and thank the Makridakis Open Forecasting Center (MOFC) of the University of Nicosia for funding open access to the important “Forecasting in Social Settings: The State of the Art” article, originally published by Elsevier in International Journal of Forecasting.
Rather than closing with a single Afterword, we realized there could be great benefit in sharing a diversity of perspectives, particularly from influential writers who might have had insufficient representation in the main body of the text. These individuals graciously followed our directive for delivering an original “opinion-editorial” piece, targeting 1,000–1,200 words, and within a very tight publication timeline. For these we thank Carolyn Allmon of Teleflex Inc., Jason Breault of LifeWork Search, Lora Cecere of Supply Chain Insights, Simon Clarke of Argon & Co, Robert Fildes of Lancaster University, Igor Gusakov of GoodsForecast, Jim Hoover of University of Florida, Rob Hyndman of Monash University, Chaman Jain of St. John’s University, Jonathon Karelse of NorthFind Management, Bahman Rostami-Tabar of Cardiff University, Shaun Snapp of Brightwork Research & Analysis, Nicolas Vandeput of SupChains, Eric Wilson of IBF, and Dr. Davis Wu of Nestlé.
Finally, we wish to give very special thanks to Spyros Makridakis of the Institute for the Future at University of Nicosia, and Fotios Petropoulos of the School of Management at University of Bath. Amidst their busy academic schedules and the closing weeks
of the M5 Competition, Spyros and Fotios contributed the Foreword. They also coauthored, with Rob Hyndman, our indispensable opening piece on the state of the art. Just like last time, the editors wish to acknowledge all the authors whose work has been included in this book. We thank them for their continuing contributions to the advancement and better practice of business forecasting.
Michael Gilliland SAS Institute Seagrove, North Carolina
len TashMan Foresight Golden, Colorado
Udo sGlavo SAS Institute Cary, North Carolina
State of the Art
We are about to embark on a journey through the last five years of business forecasting literature, with over 60 selections from journals, books, whitepapers, and original contributions written just for this collection. The biggest single topic area – reflecting the intense interest from practitioners and researchers alike – is the role of artificial intelligence and machine learning in business forecasting. But traditional forecasting topics like modeling, performance evaluation, and process remain vital, and are not ignored. We’ve sought to include the compelling new ideas, and the divergent viewpoints, to broadly represent advances in the business forecasting profession over the past five years.
But before we begin the journey, it is worth a few moments to review and reflect upon where we are at now – business forecasting’s state of the art.
* *
FORECASTING IN SOCIAL SETTINGS: THE STATE OF THE ART*
Spyros Makridakis, Rob J. Hyndman, and Fotios Petropoulos
This paper provides a nonsystematic review of the progress of forecasting in social (i.e., non-physical science) settings – which includes business forecasting. It is aimed at someone outside the field who wants to understand and appreciate the results of 2018’s M4 Competition, and the M4’s historical context and significance. As such, it forms a survey paper regarding the state of the art of the business forecasting discipline, and provides a perfect launch point for the chapters to follow.
The review discusses the recorded improvements in forecast accuracy over time, the need to capture forecast uncertainty, and things that can go wrong with predictions. It classifies the knowledge achieved over recent years into (i) what we know, (ii) what we are not sure about, and (iii) what we don’t know. In the first two areas, this article explores the difference between explanation and prediction, the existence of an optimal model, the performance of machine learning methods on time series forecasting tasks, the difficulties of predicting nonstable environments, the performance of judgment, and the value added by exogenous variables. The article concludes with the importance of (thin and) fat tails, the challenges and advances in causal inference, and the role of luck.
Written by three of the very top contributors to the field, this article delivers an exceptional recap of our current knowledge about business forecasting, along with an extensive section of references for further study.
* This article originally appeared in the International Journal of Forecasting 36(1), January–March 2020 (https:// doi.org/10.1016/j.ijforecast.2019.05.011), published by Elsevier B.V. on behalf of the International Institute of Forecasters. © 2019 The Authors. This is an open access article under the CC BY license (http://creativecommons.org/licenses/by/4.0/). It has been modified slightly to fit the format of this book.
“There’s no chance that the iPhone is going to get any significant market share.”
—Steve Ballmer, CEO Microsoft, April
2007
I. THE FACTS
A Brief History of Forecasting
In terms of human history, it is not that long since forecasting moved from the religious, the superstitious, and even the supernatural (Scott, 2015) to the more scientific. Even today, though, old fortune-telling practices still hold among people who pay to receive the “prophetic” advice of “expert” professional forecasters, including those who claim to be able to predict the stock market and make others rich by following their advice. In the emerging field of “scientific” forecasting, there is absolute certainty about two things. First, no one possesses prophetic powers, even though many pretend to do so; and, second, all predictions are uncertain: often the only thing that varies among such predictions is the extent of such uncertainty.
The field of forecasting outside the physical sciences started at the end of the nineteenth century with attempts to predict economic cycles, and continued with efforts to forecast the stock market. Later, it was extended to predictions concerning business, finance, demography, medicine, psychology, and other areas of the social sciences. The young field achieved considerable success after World War II with Robert Brown’s work (Brown, 1959, 1963) on the prediction of the demand for thousands of inventory items stored in navy warehouses. Given the great variety of forecasts needed, as well as the computational requirements for doing so, the work had to be simple to carry out, using the mechanical calculators of the time. Brown’s achievement was to develop various forms of exponential smoothing that were sufficiently accurate for the problems faced and computationally light. Interestingly, in the Makridakis and Hibon (1979) study and the subsequent M1 and M2 competitions, his simple, empirically-developed models were found to be more accurate than the highly sophisticated ARIMA models of Box and Jenkins (Box, Jenkins, Reinsel, and Ljung, 2015).
As computers became faster and cheaper, the field expanded, with econometricians, engineers and statisticians all proposing various advanced forecasting approaches, under the belief that a greater sophistication would improve the forecasting accuracy. There were two faulty assumptions underlying such beliefs. First, it was assumed that the model that best fitted the available data (model fit) would also be the most accurate one for forecasting beyond such data (post-sample predictions), whereas actually the effort to minimise model fit errors contributed to over-parameterisation and overfitting. Simple methods that captured the dominant features of the generating process were both less likely to overfit and likely to be at least as accurate as statistically sophisticated ones (see Pant and Starbuck, 1990). The second faulty assumption was that of constancy of patterns/relationships – assuming that the future will be an exact
continuation of the past. Although history repeats itself, it never does so in precisely the same way. Simple methods tend to be affected less by changes in the data generating process, resulting in smaller post-sample errors.
Starting in the late 1960s, significant efforts were made, through empirical and other studies and competitions, to evaluate the forecasting accuracy and establish some objective findings regarding our ability to predict the future and assess the extent of the uncertainty associated with these predictions. Today, following many such studies/ competitions, we have a good idea of the accuracy of the various predictions in the business, economic and social fields (and also, lately, involving climate changes), as well as of the uncertainty associated with them. Most important, we have witnessed considerable advances in the field of forecasting, which have been documented adequately in the past by two published papers. Makridakis (1986) surveyed the theoretical and practical developments in the field of forecasting and discussed the findings of empirical studies and their implications until that time. Twenty years later, Armstrong (2006) published another pioneering paper that was aimed at “summarizing what has been learned over the past quarter century about the accuracy of forecasting methods” (p. 583) while also covering new developments, including neural networks, which were in their infancy at that time. The purpose of the present paper is to provide an updated survey for non-forecasting experts who want to be informed of the state of the art of forecasting in social sciences and to understand the findings/conclusions of the M4 Competition better.
Some of the conclusions of these earlier surveys have been overturned by subsequent additional evidence. For example, Armstrong (2006) found neural nets and Box-Jenkins methods to fare poorly against alternatives, whereas now both have been shown to be competitive. For neural nets, good forecasts have been obtained when there are enormous collections of data available (Salinas, Flunkert, and Gasthaus, 2017). For Box-Jenkins methods, improved identification algorithms (Hyndman and Khandakar, 2008) have led to them being competitive with (and sometimes better than) exponential smoothing methods. Other conclusions have stood the test of time: for example, that combining forecasts improves the accuracy.
When Predictions Go Wrong
Although forecasting in the physical sciences can attain amazing levels of accuracy, such is not the case in social contexts, where practically all predictions are uncertain and a good number can be unambiguously wrong. This is particularly true when binary decisions are involved, such as the decision that faces the U.S. Federal Reserve as to whether to raise or lower interest rates, given the competing risks of inflation and unemployment. The big problem is that some wrong predictions can affect not only a firm or a small group of people, but also whole societies, such as those that involve global warming, while others may be detrimental to our health. Ioannidis, a medical professor at Stanford, has devoted his life to studying health predictions. His findings
are disheartening, and were articulated in an article published in PLoS Medicine entitled “Why most published research findings are false” (Ioannidis, 2005).1 A popular piece on a similar theme in The Atlantic entitled “Lies, damned lies, and medical science” (Freedman, 2010) is less polite. It summarizes such findings as: “Much of what medical researchers conclude in their studies is misleading, exaggerated, or flat-out wrong.” Freedman concluded with the question, “why are doctors – to a striking extent – still drawing upon misinformation in their everyday practice?”
A recent case exemplifying Ioannidis’ conclusions is the findings of two studies eight years apart of which the results were contradictory, making it impossible to know what advice to follow in order to benefit from medical research. In 2010, Micha, Wallace, and Mozaffarian (2010) published a meta-analysis that reviewed six studies which evaluated the effects of meat and vegetarian diets on mortality, involving a total of more than 1.5 million people. It concluded that all-cause mortality was higher for those who ate meat, mainly red or processed meat, daily. However, a new study published in 2018 (Mente and Yusuf, 2018), using a large sample of close to 220,000 people, found that eating red meat and cheese reduced cardiovascular disease by 22% and decreased the risk of early death by 25% (with such large sample sizes, all differences are statistically significant). If conflicting medical predictions, based on substantial sample sizes and with hundreds of millions of dollars having been spent on designing and conducting them, are widespread, what are we to surmise about studies in other disciplines that are less well funded, utilize small sample sizes, or base their predictions on judgment and opinion? Moreover, if the conclusions of a medical study can be reversed in a period of just eight years, how can we know that those of new studies will not produce the same contradictions? Recommendations about the treatment of disease are based on the findings of medical research, but how can such findings be trusted when, according to Ioannidis, most of them are false? Clearly, there is a predictability problem that extends beyond medicine to practically all fields of social science, including economics (Camerer et al. 2016, Dewald, Thursby, and Anderson, 1986). Fortunately, empirical studies in the field of forecasting have provided us with some objective evidence that allows us to both determine the accuracy of predictions and estimate the level of uncertainty.
There are several famous examples of forecasting errors, including Ballmer’s forecast quoted earlier about the iPhone, which is possibly the most successful of all products ever marketed. In 1798, Malthus predicted that we were confronted by mass starvation, as the population was growing geometrically while food production was increasing only arithmetically. Today’s material abundance and decreases in population growth in most advanced countries have been moving in the opposite direction to his predictions. In 1943, Thomas Watson, IBM’s president, made his infamous prediction: “I think there is a world market for maybe five computers,” missing it by about a billion times if all computers, including smartphones, are counted (see also Schnaars, 1989). However, even recent predictions by professional organisations that specialise in forecasting, using modern computers and well-trained, PhD-holding forecasters, can go wrong, as can be seen from the complete failure of these organisations to predict
the great 2007/2008 recession and its grave implications. The same has been true with technological forecasting, which failed to predict, even a few decades earlier, the arrival and widespread usage of the three major inventions of our times: the computer, the internet, and the mobile phone. Judgmental predictions have been evaluated by Tetlock (2006), who has compared the forecasts of experts in different macroeconomic fields to forecasts made by well-informed laity or those based on simple extrapolation from current trends. He concluded that not only are most experts not more accurate, but they also find it more difficult to change their minds when new evidence becomes available.
After surveying past successes and failures in forecasting, what we can conclude is that there is a significant amount of uncertainty in all of our predictions, and that such uncertainty is underestimated greatly for two reasons. First, our attitude to extrapolating in a linear fashion from the present to the future, and second, our fear of the unknown and our psychological need to reduce the anxiety associated with such a fear by believing that we can control the future by predicting it accurately (known as the illusion of control, see Langer, 1975). Thus, it becomes imperative to be aware of the difficulty of accurate predictions and the underestimation of the uncertainty associated with them, in order to be able to minimise this bias. The field of quantitative forecasting has the potential advantage that it may be possible to assess the accuracy of forecasts and the level of uncertainty surrounding them by utilising information from empirical and open forecasting competitions.
Improving Forecasting Accuracy over Time
The scientific approach to forecasting in the physical sciences began with Halley’s comet predictions in the early 1700s (Halleio, 1704), which turned out to be remarkably accurate. Other forecasts followed, including the somewhat less successful meteorological forecasts of Beaufort and FitzRoy in the late 1850s (Burton, 1986). These were highly controversial at the time, and FitzRoy in particular was criticised heavily, and subsequently committed suicide. Nevertheless, he left a lasting legacy, including the word “forecast,” which he had coined for his daily weather predictions. Over the 150 years since, there has been extraordinary progress in improving the forecast accuracy not only in meteorology (Kistler et al., 2001; Saha et al., 2014) but also in other physical sciences, as the underlying physical processes have come to be understood better, the volume of observations has exploded, computing power has increased, and the ability to share information across connected networks has become available.
The social sciences are different. First, there is usually a limited theoretical or quantitative basis for representing a causal or underlying mechanism. Thus, we rely on statistical approximations that roughly describe what we observe, but may not represent a causal or underlying mechanism. Second, despite the deluge of data that is available today, much of this information does not concern what we want to forecast directly. For example, if we wish to predict the GDP next quarter, we may have an
enormous amount of daily stock market data available, but no daily data on expenditures on goods and services. Third, what we are trying to forecast is often affected by the forecasts themselves. For example, central banks might forecast next year’s housing price index but then raise interest rates as a result, thus leading the index to be lower than the forecast. Such feedback does not occur in astronomical or weather forecasts.
For these reasons, social science forecasts are unlikely ever to be as accurate as forecasts in the physical sciences, and the potential for improvements in accuracy is somewhat limited. Nevertheless, increases in computing power and a better understanding of how to separate signal from noise should lead to some improvements in forecast accuracy. However, this does not appear to have been the case, at least for macroeconomic forecasting (Fildes and Stekler, 2002; Heilemann and Stekler, 2013; Stekler, 2007).
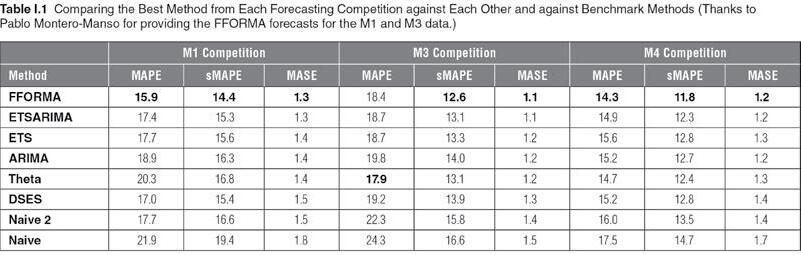
On the other hand, time series forecasting has improved demonstrably over the last 30 years. We can measure the change through the published accuracies of forecasting competitions over the last 40 years, beginning with the first Makridakis competition (Makridakis et al., 1982), then the M3 competition (Makridakis and Hibon, 2000), and finally the recent M4 competition (Makridakis, Spiliotis, and Assimakopoulos, 2018a). In measuring the forecast accuracy improvement, we have applied the best-performing methods from each competition to the data from previous competitions in order to see how the methods have improved over time.
However, these comparisons are not straightforward because the forecast accuracy measures used were not consistent between competitions. In fact, there is still no agreement on the best measure of the forecast accuracy. We will therefore compare results using the MAPE (used in the first competition), the sMAPE (used in the M3 competition), and the MASE. The M4 competition used a weighted average of the sMAPE and MASE values. All measures are defined and discussed by Hyndman and Koehler (2006) and Hyndman and Athanasopoulos (2018).
In the first Makridakis competition (Makridakis et al., 1982), the best-performing method overall (as measured by MAPE) was simple exponential smoothing applied to deseasonalized data, where the deseasonalization used a classical multiplicative decomposition (Hyndman and Athanasopoulos, 2018); this is denoted by DSES. For nonseasonal data, DSES is equivalent to simple exponential smoothing.
In the M3 competition, the best method (as measured by sMAPE), and which is in the public domain, was the Theta method (Assimakopoulos and Nikolopoulos, 2000). We applied the Theta method using the thetaf() implementation from the forecast package for R (Hyndman et al., 2018), to ensure consistent application to all data sets.
In the M4 competition, the best-performing method (as measured by a weighted average of sMAPE and MASE) for which we had R code available was the FFORMA method (Montero-Manso, Athanasopoulos, Hyndman, and Talagala, 2020), which came second in the competition.
In addition to these methods, we also included, for comparison, the popular auto. arima() and ets() methods (Hyndman and Khandakar, 2008; Hyndman et al., 2002), as
implemented by Hyndman et al. (2018), along with a simple average of the forecasts from these two methods (denoted “ETSARIMA”). We also include two simple benchmarks: naive and naive on the seasonally adjusted data (naive 2).
When we apply these methods to the data from all three competitions, we can see how the forecast accuracy has changed over time, as is shown in Table I.1. Note that the mean values of MAPE, sMAPE, and MASE have been calculated by applying the arithmetic mean across series and horizons simultaneously. Other ways of averaging the results can lead to different conclusions, due to greater weights being placed on some series or horizons. It is not always obvious from the published competition results how these calculations have been done in the past, although in the case of the M4 competition, the code has been made public to help to avoid such confusion.
There are several interesting aspects to this comparison.
J DSES did well on the M1 data and is competitive with other non-combining methods on the M3 and M4 data according to the MAPE and sMAPE, but it does poorly according to the MASE.
J While Theta did well on the M3 data (winner of that competition), it is less competitive on the M1 and M4 data.
J The most recent method (FFORMA) outperforms the other methods on every measure for the M1 and M4 competitions, and on all but the MAPE measure for the M3 competition.
J The ETSARIMA method (averaging the ETS and ARIMA forecasts) is almost as good as the FFORMA method in terms of MASE, and is easier and faster to compute.
J The results are relatively clear-cut across all competitions (in the order displayed) using the MASE criterion, but the results are less clear with the other accuracy criteria.
While there is some variation between periods, the good performances of FFORMA and ETSARIMA are relatively consistent across data sets and frequencies. Clearly, progress in forecasting methods has been uneven, but the recent M4 competition has helped to advance the field considerably in several ways, including: (1) encouraging the development of several new methods; and (2) providing a large set of data in order to allow detailed comparisons of various forecasting methods over different time granularities.
The Importance of Being Uncertain
No forecasts are exact, and so it is important to provide some measure of the forecast uncertainty. Unless such uncertainty is expressed clearly and unambiguously, forecasting is not far removed from fortune-telling.
The most general approach to expressing the uncertainty is to estimate the “forecast distribution” – the probability distribution of future observations conditional on the
information available at the time of forecasting. A point forecast is usually the mean (or sometimes the median) of this distribution, and a prediction interval is usually based on the quantiles of this distribution (Hyndman and Athanasopoulos, 2018). As a consequence, forecasting has two primary tasks:
1. To provide point forecasts which are as accurate as possible;
2. To specify or summarise the forecast distribution.
Until relatively recently, little attention was paid to forecast distributions, or measures of the forecast distribution accuracy. For example, there was no measure of the distributional forecast uncertainty used in the M1 and M3 competitions, and it is still rare to see such measures used in Kaggle competitions.
Prediction Interval Evaluation
The simplest approach to summarising the uncertainty of a forecast distribution is to provide one or more prediction intervals with a specified probability coverage. However, it is well known that these intervals are often narrower than they should be (Hyndman et al., 2002); that is, that the actual observations fall inside the intervals less often than the nominal coverage implies. For example, the 95% prediction intervals for the ETS and ARIMA models applied to the M1 and M3 competition data, obtained using the automatic procedures in the forecast package for R, yield coverage percentages that are as low as 76.8%, and are never higher than 95%. Progress has been made in this area too, though, with the recent FFORMA method (Montero-Manso et al., 2020) providing an average coverage of 94.5% for these data sets. Figure I.1 shows the coverages for nominal 95% prediction intervals for each method and forecast horizon when applied to the M1 and M3 data. ARIMA models do particularly poorly here.
It is also evident from Figure I.1 that there are possible differences between the two data sets, with the percentage coverages being lower for the M1 competition than for the M3 competition.
Figure I.1 Actual Coverages Achieved by Nominal 95% Prediction Intervals
There are at least three reasons for standard statistical models’ underestimations of the uncertainty.
1. Probably the biggest factor is that model uncertainty is not taken into account. The prediction intervals are produced under the assumption that the model is “correct,” which clearly is never the case.
2. Even if the model is specified correctly, the parameters must be estimated, and also the parameter uncertainty is rarely accounted for in time series forecasting models.
3. Most prediction intervals are produced under the assumption of Gaussian errors. When this assumption is not correct, the prediction interval coverage will usually be underestimated, especially when the errors have a fat-tailed distribution.
In contrast, some modern forecasting methods do not use an assumed data generating process to compute prediction intervals. Instead, the prediction intervals from FFORMA are produced using a weighted combination of the intervals from its component methods, where the weights are designed to give an appropriate coverage while also taking into account the length of the interval.
Coverage is important, but it is not the only requirement for good prediction intervals. A good prediction interval will be as small as possible while maintaining the specified coverage. Winkler proposed a scoring method for enabling comparisons between prediction intervals that takes into account both the coverage and the width of the intervals. If the 100(1−α)% prediction interval for time t is given by [l t , u t], and yt is the observation at time t, then the Winkler (1972) score is defined as the average of:
This penalises both for wide intervals (since u t − l t will be large) and for non-coverage, with observations that are well outside the interval being penalised more heavily. However, although this was proposed in 1972, it has received very little use until recently, when a scaled version of it was used in the M4 competition. The lower the score, the better the forecasts. For a discussion of some of the problems with interval scoring, see Askanazi, Diebold, Schorfheide, and Shin (2018).
Forecast Distribution Evaluation
To the best of our knowledge, the only forecasting competitions that have evaluated whole forecast distributions have been the GEFCom2014 and GEFCom2017 energy forecasting competitions (Hong et al., 2016). Both used percentile scoring as an evaluation measure.