They Aware, and Why?” Bayesian Analysis of Predictors of Smallholder Farmers’ Awareness of Climate Change and Its Risks to Agriculture
John N. Ng’ombe 1,2,*, Moses C. Tembo 3 and Blessing Masasi 4
1 Department of Agricultural Economics and Rural Sociology, Auburn University, Auburn, AL 36849, USA
2 Department of Agricultural Economics and Extension, University of Zambia, Lusaka 10101, Zambia
3 Indaba Agricultural and Policy Research Institute, Lusaka 10101, Zambia; chifwambe@yahoo.com
4 Department of Biosystems and Agricultural Engineering, Oklahoma State University, Stillwater, OK 74078, USA; blessing.masasi@okstate.edu
* Correspondence: ngombe@okstate.edu
Received: 9 February 2020; Accepted: 5 March 2020; Published: 9 March 2020
Abstract: While climate change threatens global food security, health, and nutrition outcomes, Africa is more vulnerable because its economies largely depend on rain-fed agriculture. Thus, there is need for agricultural producers in Africa to employ robust adaptive measures that withstand the risks of climate change. However, the success of adaptation measures to climate change primarily depends on the communities’ knowledge or awareness of climate change and its risks. Nonetheless, existing empirical research is still limited to illuminate farmers’ awareness of the climate change problem. This study employs a Bayesian hierarchical logistic model, estimated using Hamiltonian Monte Carlo (HMC) methods, to empirically determine drivers of smallholder farmers’ awareness of climate change and its risks to agriculture in Zambia. The results suggest that on average, 77% of farmers in Zambia are aware of climate change and its risks to agriculture. We find sociodemographics, climate change information sources, climate change adaptive factors, and climate change impact-related shocks as predictors of the expression of climate change awareness. We suggest that farmers should be given all the necessary information about climate change and its risks to agriculture. Most importantly, the drivers identified can assist policymakers to provide the effective extension and advisory services that would enhance the understanding of climate change among farmers in synergy with appropriate farm-level climate-smart agricultural practices.
Keywords: climate change; climate change awareness; Hamiltonian Monte Carlo; climate-smart technologies; Zambia
1. Introduction
Recent studies have shown that climate change is a reality and threatens global food security, health, and nutrition outcomes [3–6]. However, despite being a global problem, the impacts of climate change are not equally felt across countries. Bounoua [7] contends that while climate change affects the whole world, Africa is more vulnerable because its economies are largely dependent on agriculture. The agriculture industry employs 65% of Africa’s labor force, accounting for 32% of the continent’s overall Gross Domestic Product (GDP) [7]. Thus, to ensure that agricultural production systems are sufficiently resilient to climate change, there is need for agricultural producers in Africa to employ robust adaptive measures that would withstand the risks of climate change. However, successful adaptation to climate change may have to depend on farmers’ knowledge or perception of the marvel. Ubisi et al. [8] suggest that the success of climate change adaptation strategies depends on whether farmers fully understand what climate change is, and are therefore able to consider the necessary adaptive initiatives. Similarly, [9] argue that understanding people’s
Agronomy 2020, 10, 376; doi:10.3390/agronomy10030376 www.mdpi.com/journal/agronomy
perception of climate change is a necessary prerequisite for conveying climate change mitigation and adaptation policies. However, empirical research that exists in developing countries is too little to illuminate farmers’ awareness of the phenomenon, and how they would want to build resilience of their production systems [10].
Zambia, like many other developing countries, has more than 90% of smallholder agriculture that is rain-fed [11] and this exacerbates farmers’ exposure to climate change. Similar to Latin America [12], studies that focus on farmers’ perceptions of climate change and its consequences on agriculture in Zambia are few, even though some descriptive and communicative work exists. Nyanga et al. [13] examines smallholder farmers’ perceptions of climate change and conservation agriculture in Zambia. These authors provide useful insights about what smallholder farmers consider as the causes of climate change. They find low adoption of conservation agriculture as one of the mitigation strategies. However, their research is more descriptive and does not examine what affects people’s accounts of climate variation econometrically—thereby potentially leaving other important variables that would affect farmers’ perceptions of climate change unaccounted for. While [13] is insightful, descriptive analyses only simplify concepts and are always subject to some loss of nuance or detail [14].
On the other hand, [15] use linear regression models to assess smallholder farmers’ perceptions of climate change in Zambia. They document the perceived impacts of climate change on agricultural households in addition to the main adaptation technologies that farmers employ. Mulenga et al. [15] attribute improper choices of strategies directed at addressing rainfall variability and rising temperatures to some inconsistencies they find between meteorological data and farmers’ perceptions of climate change. However, the study by [15] also does not analyze determinants of smallholder farmers’ awareness of climate change and its risk to agriculture in Zambia. Actually, [15] recommend future studies to examine factors that drive smallholder farmers’ perceptions or awareness of climate change as well as how they could be used to develop and promote relevant adaptation strategies to smallholder farmers.
Climate change is generally characterized by changes in the distribution of rainfall and extreme average temperatures [16], which may last for an extended period, such as decades or much longer. An increase in dry spells during normal rainy seasons aggravates the climate change crisis. Taken together, it follows that there is a growing body of research investigating the impacts of climate change adaptation strategies in Zambia and across sub-Saharan Africa (SSA). Examples of such studies include [17–28]. However, the limited capacity of smallholder farmers to adapt to climate change in Zambia [6,27] in part contributes to the low adoption rates of climate change adaptation measures [21,23]. This makes smallholder agricultural production more vulnerable to climate change impacts. As pointed out by [6], since temperatures are projected to rise further, either way, farmers will have to adapt to climate change, regardless of whether agriculture is irrigated or rain-fed. The African continent is projected to experience at least 1 to 2 °C rising temperatures by 2050 [6,15,29]. Thus, to promote increased adaptation to climate change, there is need to provide empirical references for designing climate change policies, as well as advancing public cognizance. Mekonnen et al. [30] recommend the need to conduct research to incorporate the perception and indigenous knowledge of local smallholder farmers in order to come up with lasting solutions to the challenges of climate change.
Selected studies outside Zambia that have examined farmers’ perceptions or awareness of climate change include [9,12,31–37]. Studies by [12,31–34,36] find that socio-economic variables, production systems and social capital affect farmers’ awareness of climate change. Roco et al. [12] find that age, education, land tenure, access to weather information, and location within Chile affect climate change awareness, while [37] indicate that education, farmer experience, and access to extensions services have a positive effect on climate change awareness in South Africa. Similarly, [31] find a negative relationship between climate change awareness and age of respondents in nine U.S. states. Additionally, [34] find that Argentinian farmers that have access to extension programs are more likely to be aware of climate change than otherwise. A study by [38] finds that the level of
education, farm size, family size, family income, training received, and farming experience are significant determinants of climate change awareness in Bangladesh.
In terms of gender, a study by [39] about rancher and farmer perceptions of climate change in Nevada, USA indicates that that women are more concerned about environmental issues such as climate change than men, because such issues threaten their families and communities. A study on risk perception of climate change in North Carolina by [40] suggests that men have less perception of climate change risks than females. Additionally, [9] find that the level of education, gender, household size, and the number of people affected by natural disasters affect climate change awareness among Chinese residents, while [37] indicates that farmers that have access to water for irrigation purposes are not likely to perceive any changes in climate, whether it is in terms of rainfall or temperature patterns. As argued by [12,41], human perception and/or awareness of climate change is a complex issue that is strongly affected by expectations that may be weakly correlated with the true nature of climate.
Moreover, despite a growing body of research modeling the impacts of climate change adaptation technologies on various household outcomes, there is a dearth of empirical research that examines drivers of climate change awareness among smallholder farmers in developing countries. As argued by [12], public understanding of climate change has been explored more in developed countries than in developing countries, and Zambia is no exception. Thus, the objectives of this study are (1) to determine smallholder farmers’ awareness of climate change and its risks to agriculture in Zambia, and (2) to determine drivers of smallholder farmers’ awareness of climate change and its risk to agriculture in Zambia. Our findings could be useful for effective targeting of climate change policy and promotion of the necessary mitigation strategies in Zambia and other countries.
2. Materials and Methods
2.1. Study Area and Data Sources
The data used in this study were collected in 2013 under the University of Zambia (UNZA) and Indaba Agricultural Policy Research Institute (IAPRI) Climate Change Land Use project. The sample was demographically and agro-ecologically representative and consisted of 1,231 farm households. The households selected were part of the previous survey titled the Rural Agricultural Livelihood Survey (RALS), that was conducted in 2012 [42] by the Zambia Central Statistical Office (CSO) and IAPRI. Due to the fact that the sample was part of RALS 2012, it is noteworthy to mention how sampling of RALS 2012 was done. The sampling frame guiding RALS 2012 survey was based on the 2010 Census of Housing and Population. With regards to sampling, a stratified two-stage design was employed, where the initial stage involved identification of Primary Sampling Units (PSUs). A PSU is defined as at least one Standard Enumeration Area (SEA) comprising a minimum of 30 agricultural households. The SEA is the smallest area with well-defined boundaries identified on census sketch maps. In the second stage, all the farm households in selected SEAs were recorded with the respective identified agricultural households. The listed farm households were then stratified into three classes, namely: A, B, and C, based on total area allocated to crops; special crops; numbers of cattle, goats, and chickens raised; and sources of income. To select at least 20 farm households distributed across the three strata in each SEA, systematic sampling was used [43]. While the total sample size for the 2013 survey in this study was 1,231, we used 1,227 observations because of the nonresponse/missing values.
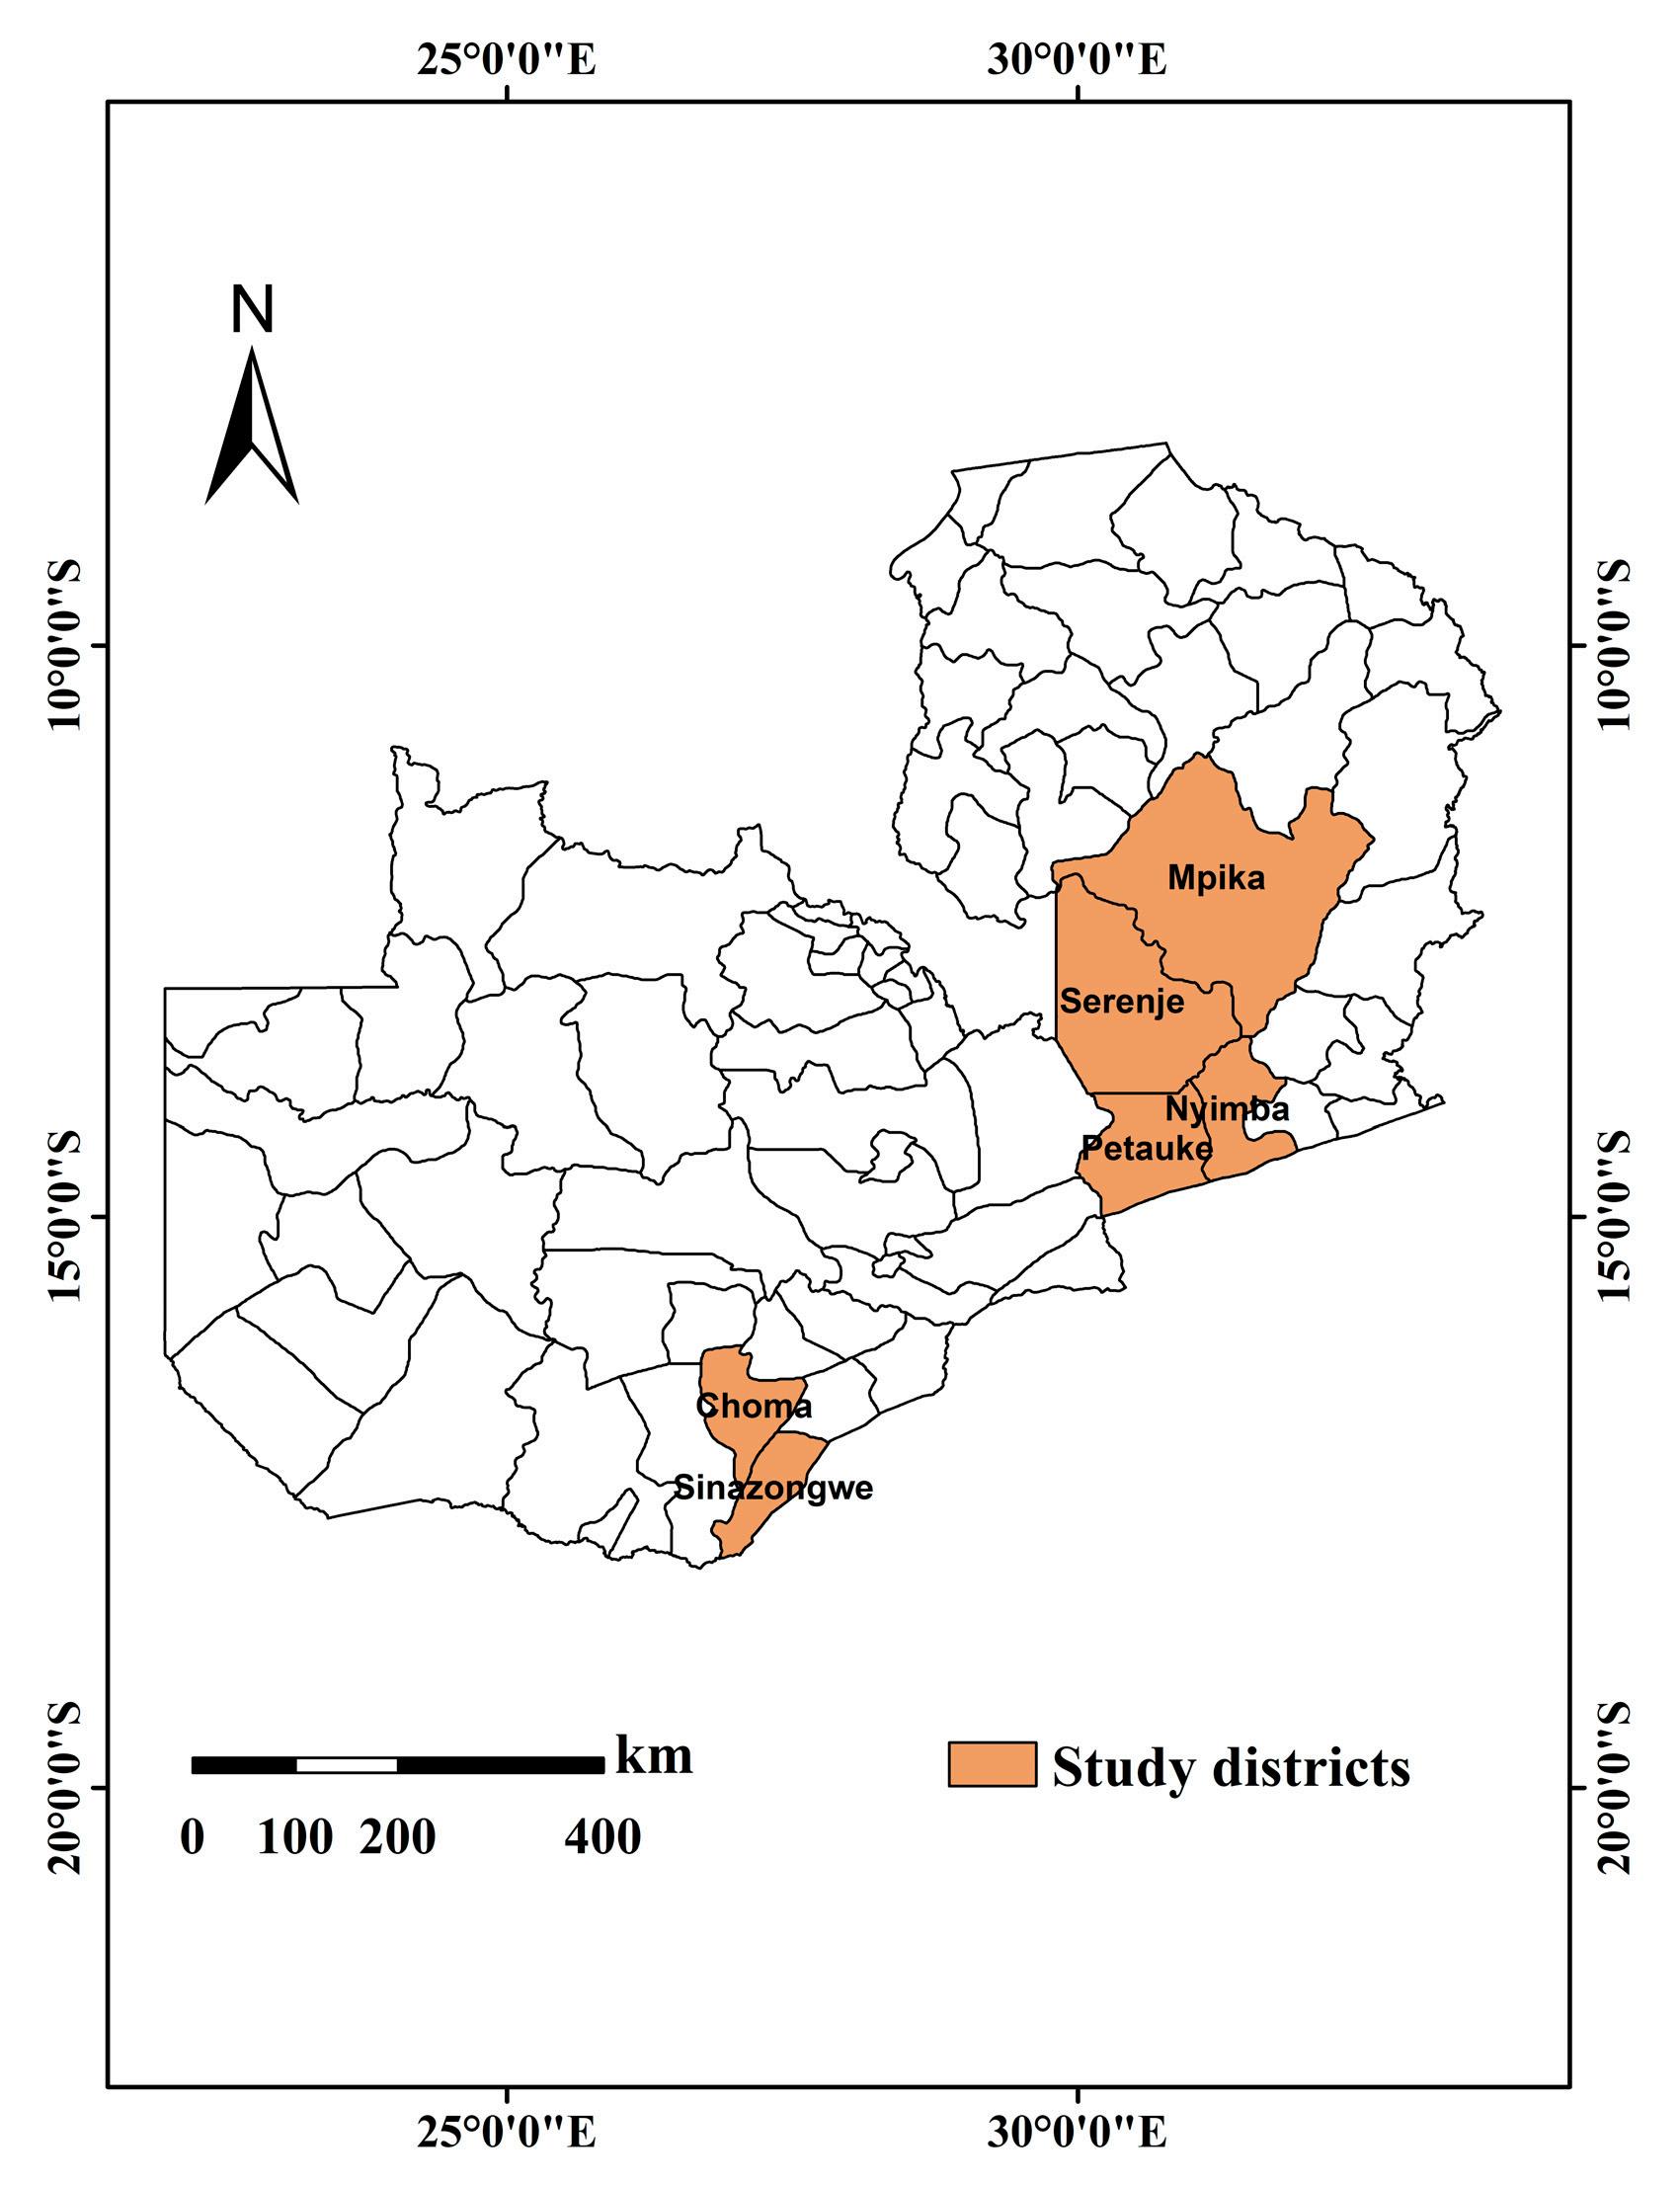
The 2013 survey was conducted in 6 districts from Zambia’s three agro-ecological regions (AER) [44]. The districts included Choma, Mpika, Nyimba, Petauke, Serenje, and Sinazongwe. Choma and Sinazongwe are from AER I, while Nyimba, Petauke, and Serenje belong to AER II. Mpika district is located in AER III. Figure 1 shows locations of the districts within Zambia where the data were collected.
districts.
A full description of the variables used in the analysis is presented in Table 1. The variables considered were selected based on a review of previous theoretical and empirical climate change related studies [12,17,38,45–50]. The response variable is the expression of awareness of climate change and its risks to agriculture (alias climate change awareness), which equals 1 if the respondent replied “Yes” to the question: “Are you aware of climate change and its consequences on agriculture?”, and 0 otherwise. This question asked respondents to express their awareness of the climate change phenomenon. Similar to most questionnaire surveys, some respondents for this study perhaps answered the question based on their limited knowledge about the phenomenon. As in most climate change observational studies (e.g., [8,9,12,13,38,49]), the perception or awareness of climate change is solicited based on recall methods and experience, which are subject to inaccuracy from respondents1. As argued by [15], memory can be faulty. However, the expression of awareness of climate change captured in this study is credible, as can be observed by the positive effects of common climate change impact–related shocks, which suggests that our dependent variable is robust to such shortcomings.
Variable Name
Dependent variable
Awareness of climate change and its risk to agriculture
Predictor variables
Socio-demographic characteristics
Variable Description
Household head expresses awareness of climate change and its risks on agricultural production; equals 1 if yes, 0 otherwise
1Measuring the awareness of climate change is not problem-free. Thus, throughout the article, we use ‘awareness of climate change’ and ‘expression of awareness of climate change’ interchangeably, where necessary.
Figure 1. Location of study
Table 1. Definition of variables.
Gender
Age of household head
Household size
No education
Basic education
High school education
College education
Access to farm credit
Gender of household head; equals 1 if male, 0 if female
Age of household head in years
Number of members in a household
Household head received no formal education. Equals 1 if yes, 0 otherwise
Household head’s highest level of education is 9th grade
Household head’s highest level of education is high school
Household head’s highest level of education is college education
Household has access to farm credit; equals 1 if yes, 0 otherwise
Climate change information sources
Radio
Television
Conservation agriculture advice
Extension services
Climate change adaptive factors
Planting in basins
Animal manure
Fundikila
Agroforestry
Changing planting dates
Changing crop varieties
Crop diversification
Ownership of water wells
Ownership of boreholes
Ownership of water pumps
Number of pipes
Number of solar panels
Number of rippers
Household owns a radio; equals 1 if yes, 0 otherwise
Household owns a television; equals 1 if yes, 0 otherwise
Household received conservation agriculture advice; equals 1 if yes, 0 otherwise
Household has access to extension services; equals 1 if yes, 0 otherwise
Household plants in basins; equals 1 if yes, 0 otherwise
Household applies animal manure of their farm; equals 1 if yes, 0 otherwise
Household practices fundikila; equals 1 if yes, 0 otherwise
Household practices agroforestry; equals 1 if yes, 0 otherwise
Household change planting dates; equals 1 if yes, 0 otherwise
Household changes seed varieties; equals 1 if yes, 0 otherwise
Household adopts crop diversification; equals 1 if yes, 0 otherwise
Household owns water wells; equals 1 if yes, 0 otherwise
Household owns boreholes; equals 1 if yes, 0 otherwise
Household owns water pumps; equals 1 if yes, 0 otherwise
Number of water pipes owned by the household
Number of solar panels owned by the household,
Number of rippers owned by the household
Climate change impact-related shocks
Increased irrigation reliance
Reduced food consumption
Floods
Frost
Heat wave
Districts
Choma
Household has increased reliance on crop irrigation; equals 1 if yes, 0 otherwise
Household reduced food consumption; equals to 1 if yes, 0 otherwise
Area is experiencing floods; equals 1 if yes, 0 otherwise
Area is experiencing frost; equals 1 if yes, 0 otherwise
Area is experiencing heat waves; equals 1 if yes, 0 otherwise
Household is located in Choma; equals 1 if yes, 0 otherwise Mpika
Household is located in Mpika; equals 1 if yes, 0 otherwise Nyimba
Petauke
Serenje
Sinazongwe
Household is located in Nyimba; equals 1 if yes, 0 otherwise
Household is located in Petauke; equals 1 if yes, 0 otherwise
Household is located in Serenje; equals 1 if yes, 0 otherwise
Household is located in Sinazongwe; equals 1 if yes, 0 otherwise
Predictor variables are presented underneath the response variable in Table 1. We categorized predictor variables into socio-demographic characteristics, climate change information sources, climate change adaptive factors, and climate change impact-related shocks. The socio-demographics include individual-level farmer or household characteristics that may play a role on climate change awareness. Following [12,31,32,36], we hypothesize that socio-demographic characteristics such as gender, age of the household head, household size, education levels, and access to credit positively affect climate change awareness among farmers. Additionally, since access to information is critical at influencing people’s perceptions of climate change [34,36], we included climate change information sources that include ownership of television, radio, access to conservation agriculture advice, and access to extension services. Our hypotheses are that information sources positively affect climate change awareness among smallholder farm households, because it is through such sources that climate change information may be conveyed by relevant institutions.
Following a review of literature on climate change [12,31,32,36,38,47–50], our expectation is that the expression of climate change awareness and climate change adaptive measures have a positive relationship between them. Thus, as shown in Table 1, we considered a variety of adaptive factors that we hypothesize to affect expression of awareness of change among farmers. The adaptive practices considered in this paper include planting in basins (where seeds are planted in potholes that are dug about 15–30 cm deep, in order to hold soil moisture for crop seeds [44,51], use of animal manure, fundikila (Zambian local name for grass-mound system of cultivation mostly practiced in northern Zambia [52]), agroforestry (planting of leguminous trees [28], changing planting dates, and changing crop varieties [20]. Others include ownership of water wells, boreholes, water pumps, number of pipes, solar panels, and rippers. Rippers are agricultural machinery used to generate riplines where seeds are planted, a practice called ripping. Ripping is part of minimum tillage and involves farmers planting in rip-lines. According to [44,51], ripping harvests water during years of sporadic rainfall and facilitates precise application of fertilizer and other inputs besides plants, thereby facilitating plant growth and development.
We also include climate change impact-related factors. These are a group of variables that represent one’s experience of climate change-related impacts. They include increased reliance on irrigated agriculture, reduced food consumption, experience of droughts, floods, frost, heat wave, and extreme heat. As argued by [12,34,53], awareness of a phenomenon can be influenced by past experience of events related to such a phenomenon. Thus, we hypothesize that farmers that experienced climate change impact-related shocks would be more aware of climate change than those without.
Descriptive statistics of all the variables used in the estimation according to district are shown in Annex 1 in the Appendix. In terms of age and gender, country statistics indicate that on average, 39% of respondents were 46-year-olds, while 80% of the households were male-headed. Regarding observations from each district, Petauke had the most observations in the sample—contributing about 25%, while Sinazongwe district contributed the least (about 10%) of the sample. These statistics appear in the last row of Annex 1.
2.2.
Conceptual Framework
In a logistic regression model, the response variable �� is assumed to follow a Bernoulli distribution, ��~������ 1, �� . Thus �� = �� + �� , (1) where i = 1, �� represents the individual-level indicator, k = 1, K group of interest-level indicator, �� is the probability of success for individual i from group k, and �� are individual-level stochastic errors assumed to be independent and with mean zero and ������(�� )= �� (1 �� ) . The success probability depends on the effects of predictor variables in x, where x denotes a vector of predictors. The logit-link function can be written as logit(�� ) = log = �� + �� �� (2)
where �� and �� are parameters to be estimated, �� are predictor variables, and �� is as defined previously. Solving for �� in equation (2) yields
(3)
where variables in equation (3) are as previously defined. Greene [54] contends that because of its mathematical convenience relative to the probit model, the logistic model is a more widely applied binary response model in empirical research. In terms of estimation, maximum likelihood is usually used to obtain parameter estimates especially that the logit model predicts probabilities instead of classes [55]. Assuming data in �� and observed class �� exist, the probability of the classification variable is either �� if �� =1 , or 1 �� if �� takes zero values, which results in the likelihood function shown in equation (4)
Under the frequentist approach, one would have to maximize the log likelihood function of equation (4) over the given sample to estimate �� and �� . Our data are from different districts in Zambia that fall in different agro-ecological regions facing heterogeneous environmental conditions [56] that could in part affect farmers’ experience of climate-related shocks that they might be exposed to. This implies that smallholder farmers in the same district and henceforth, agro-ecological region, may have similar levels of awareness of climate change and its risks on agricultural production, but dissimilar to those in other agro-ecological regions. A Bayesian hierarchical model accounting for such district-variation is a natural way to control such a structure. Thus, this study employs Bayesian hierarchical techniques as its estimation methods.
Bayesian econometrics requires one to estimate posterior distributions of model parameters from their prior distributions and data. Following [55,57,58], posterior distributions make it possible to generate robust informative statements about the results using Bayesian credible intervals. Bayesian credible intervals are equivalent to confidence intervals in classical inference. Advocates of Bayesian inference postulate that frequentists draw their conclusions directly from the data. Frequentists interpret a 95% confidence interval as one that would include 95% of the parameter estimates, if the data generating process recurred a large number of independent times [59,60]. In contrast, instead of repeating experiments for such a huge number of times, the Bayesian approach combines prior information and the data. It replaces confidence intervals with credible intervals that are interpreted as the probability of a parameter estimate lying in a range of values given the data [59]. This is a more intuitive interpretation, notwithstanding the scarcity of the data [39]. Specifically, we use a Bayesian hierarchical logistic regression to model farmers’ awareness of climate change and its risks to agriculture.
The modeling approach proceeds as follows. Given a vector of parameters as �� =[��, ��]’, where �� and �� are model parameters to be estimated, the likelihood function in equation (4) can be used in combination with prior distributions i.e., ��(��) for parameters in �� via Bayes’ rule, to obtain respective parameters’ posterior distributions. The posterior density of ��
(5) where ��(��|�� ) represents the posterior densities of model parameters, ��(�� |��) is the likelihood function in equation (4), (notice that �� is ignored because it is a constant under a logistic model), and ��(��) is the prior distribution for ��
In a Bayesian hierarchical framework, the prior density depends on its lower level hyperparameters, �� In a similar manner, the likelihood function also changes. Thus, equation (5) becomes
(6) where ��(��) are hyper-priors for the prior distribution stated in ��(��|�� ), while other terms are as previously defined.
The posterior density in equation (6) may be evaluated by numerical integration methods, which would be challenging in a multiple-parameter case. However, with the advent of improved
algorithms and increased computing power, equation (6) can be evaluated using Bayesian Markov chain Monte Carlo (MCMC) methods that include Gibbs sampling and variants of MetropolisHastings algorithms. More details about modeling Bayesian hierarchical regression models can be found in [57]. To the best of the authors’ knowledge, there is no published research that used empirical application of Bayesian hierarchical logistic model estimated using Hamiltonian Monte Carlo (HMC) to model climate change awareness. HMC and its extension, the no-U-turn sampler, are more efficient than Gibbs sampling and Metropolis-Hastings variants at estimating nonlinear hierarchical regression models [57,61,62]. A Bayesian hierarchical logistic regression belongs to a class of regression models where the outcome variable is binary and statistical inference is in a Bayesian framework while taking advantage of information across groups of observations. This reduces the sensitivity of lower-level parameters to noise [57,58,63]. We use Bayesian techniques because Bayesian inference is exact and valid for any sample size [56,64,65].
2.3. Empirical Model
We model farmer awareness of climate change and its risks to agriculture, while accounting for district-heterogeneity in farmer responses. Due to the fact that respondents were smallholder farmers from 6 districts in Zambia and from different agro-ecological zones with varying environmental conditions, we specify a varying-intercept Bayesian hierarchical logistic model according to district. The empirical specification of the model is
(0,10) where �� is the varying-intercept parameter, �� denotes the kth coefficient for the kth predictor variable, �� is the kth predictor of the ith farmer in the sample. The �� ’s are the predictor variables whose definitions are in Table 1 and summarized in Annex 1. The varying-intercept model shown in equation (8) shows that the model intercept would vary by �� , while the between-district variation would be captured by the between-intercept stochastic disturbances �� . Following [57,66,67], we imposed weakly-normal priors on �� and �� to ensure proper posterior densities and because these can take either positive or negative values, even though the null hypotheses for these two parameters would be that they are zero. Additionally, we used a normal prior for the betweenintercept variance denoted by its standard deviation �� . We selected these priors to provide little information—which is consistent with [68] who suggests that posterior standard deviations should be smaller than 10% of the corresponding prior standard deviations.
We took advantage of modern computationally efficiency of Markov chain simulation techniques—Hamiltonian Monte Carlo (HMC) and its extension the no-U-turn sampler to generate posterior samples of the parameter estimates for equations (7) and (8). HMC uses “momentum” variables that accelerate each iteration within a parameter space to allow faster mixing and convergence [57,61,62]. Girolami and Caderhead [69] further demonstrate that both Gibbs sampling and Metropolis-Hastings algorithms are in general less efficient than HMC. Due to its advantages, some agricultural economics research that employed Bayesian methods has used HMC techniques (e.g., [70–72]). Since HMC and the no-U-turn sampler are the default choice in Stan software, all our estimations were done in R and Stan [0,62,73–75]. Our HMC techniques involved 2 chains with a burn-in phase of 2,500 to enable the Markov chains forget their starting states [56,64], with total iterations of 5000 per chain.
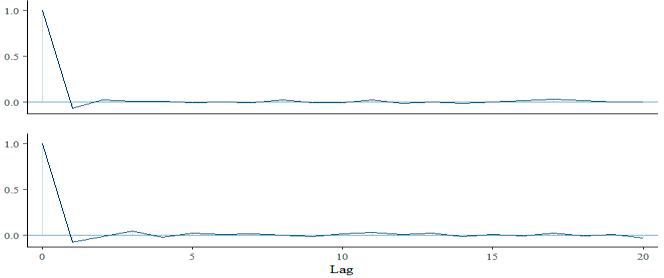
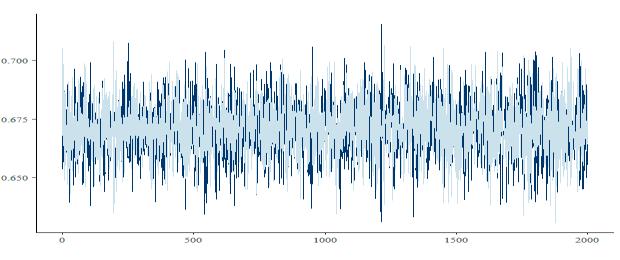
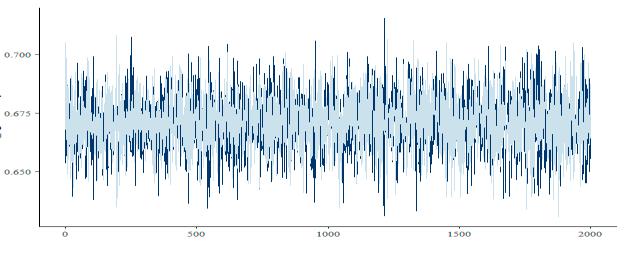
In Bayesian analysis, there is a need to check whether the MCMC chains successfully converged to their target posterior distributions for results to be considered valid. This can be done by conducting convergence diagnostics using graphical methods or formal tests. Graphical methods include trace and/or autocorrelation plots. Trace plots depict how the MCMC chains mixed during simulations. A good mixing of MCMC chains (analogous to caterpillar plots) indicates successful convergence, otherwise, it indicates poor convergence. Alternatively, autocorrelation plots indicate
the correlation of the MCMC sequences between different lags. Autocorrelation plots that indicate the extinction of correlation as the lag increases indicate successful convergence, otherwise, it shows poor convergence. Formal tests include the Gelman and Rubin test [76], Geweke diagnostics [57] and many others.
In this study, we used both graphical and the Gelman and Rubin test. Our convergence diagnostics are presented in Figure 2 and Figure 3. Due to the fact that we have numerous predictors, we show autocorrelation and trace plots as convergence diagnostics for only two variables: household size and agroforestry Figure 2 and Figure 3 respectively provide trace and autocorrelation plots for parameters of household size and agroforestry. As shown in both figures, it can be concluded that the MCMC chains associated with parameters of both variables demonstrate good mixing while autocorrelation dies away as more lags are considered—indicating successful convergence of the MCMC chains. Formally, the Gelman and Rubin [76] test to confirm the convergence of the sequences was conducted. The test checks whether parameter estimates are stationary, by comparing the intra-and inter-chain variation and if the test statistic for all parameters is less than 1.10, then convergence was successful, otherwise, it was not [55;75;76]. The Gelman and Rubin test for all of our parameters indicate consistent results with the graphical methods. This is because, for all the parameter estimates, the Gelman–Rubin test statistics are smaller than 1.004, which provides strong evidence of convergence.


2. Autocorrelation and trace plots for the coefficient of the variable agroforestry. Chain 1 and chain 2 are the 2 Markov chains used in our MCMC techniques for all estimations. Posterior
Figure
Post burn-in iterations for the coefficient of agroforestry
Autocorrelation Chain 1
Figure 3. Autocorrelation and trace plots for the coefficient of the variable household size. Chain 1 and chain 2 are the 2 Markov chains used in our MCMC techniques for all estimations.
We report the highest density interval (HDI) and the region of practical equivalence (ROPE) for statistical inference. The 95% HDI indicates the most credible values of a posterior distribution [77]. The ROPE represents a range of posterior values that are close to zero, representing an effect that is too small to be meaningful [78,79]). Out of preference, we used default ROPE values for logistic regressions, where parameters expressed in log odds ratio can be converted to standardized differences, ranging from -0.055 to 0.055 [78,79]. Following [79], contrary to the frequentist approach, Bayesian inference is not based on statistical significance, where effects are tested against zero, but offers a probabilistic view of the parameter estimates, which allows us to assess the uncertainty related to them. Thus, instead of concluding that an effect is present when it simply differs from zero, we rely on ROPE for inference. The rule used in this study is that if 95% of the posterior distribution is outside the ROPE, a predictor’s effect is meaningfully non-zero, and thus the null hypothesis is rejected. Similarly, if 95% of the posterior distribution lies inside the ROPE, any probable predictor’s effect is therefore so small that it is not meaningful—and the null hypothesis can be accepted. Following [78,80], any other state would imply that more data are required in order to accept or reject hypotheses at our chosen 95% HDI.
3. Results
Descriptive statistics in Annex 2 show that the average climate change awareness across districts ranges from 54% to 91%, which indicates variation in climate change awareness among farmers by district. For the whole country, descriptive results suggest the mean value of awareness of climate change and its risk to agriculture among smallholder farmers in Zambia is 77%. These findings clearly suggest a high number of agricultural producers in Zambia in the sample are aware of climate change and the risk it poses on agricultural production. Estimation results are presented in Table 2. Column 1 presents variable names while columns 2 and 3, respectively, present mean odds ratios and their standard deviations. The odds ratios are the exponentiated posterior means. The respective posterior
Post burn-in iterations for the coefficient of household size
means are shown in the appendix. The 95% HDI are shown in column 4, while probability effects within the ROPE are presented in column 5. The null hypothesis decision is presented in column 6.
Our results suggest that among the socio-demographic characteristics, gender, marital status, age, basic level of education, high school education of the household head, household size, and access to farm credit do not have any effects on awareness of climate change and its risk to agriculture. This is as shown by the 95% HDIs that overlap one for respective variables. The null hypotheses that no meaningful effects exist with respect to gender, marital status, age, basic level of education, high school education of the household head (the variable no education is the reference category and is dropped from the estimation procedure to avoid perfect collinearity), household size, and access to farm credit on climate change awareness among farmers are accepted, because over 95% of respective parameters’ posterior distributions are within their ROPEs, with the exception of college education. Results suggest that college education compared to no education does have meaningful positive effects on climate change awareness, keeping other factors constant.
With regard to climate change information sources, as indicated by the probability effects within ROPE, none of the posterior distributions for parameters of ownership of a radio, a television, and access to extension services was within the ROPE, which suggests that the null hypotheses that no meaningful effects of ownership of a radio, television, and access to extension services are respectively rejected. We find that ownership of a radio or access to extension services positively affects climate change awareness among farmers. However, results suggest farm households that own a television are less likely to be aware of climate change than otherwise.
Among climate change adaptive factors, our results suggest that, planting in basins, use of animal manure, adoption of fundikila, and practicing agroforestry meaningfully affect expression of climate change awareness and its risk to agriculture. The 95% HDIs for coefficients of respective parameters do not span the value of one, while over 95% of their posterior distributions are outside their respective ROPES. This leads to rejection of the null hypotheses that no meaningful effects are associated with the mentioned variables on farmers’ expression of climate change awareness in Zambia. These findings, coupled with corresponding odds ratios (that are greater than one), imply that smallholder farmers that either plant in basins, use animal manure, practice fundikila or agroforestry are more likely to express awareness of climate change and its risk to agriculture than otherwise.
In terms of the number of rippers that a farmer uses, our results indicate that more data are required in order to accept or reject the null hypothesis that the number of rippers the farmer uses has no effect on awareness of climate change and its risk to agriculture. This is because the ROPE for the variable number of rippers contains 86.66% of the posterior distribution, which does not reach the 95% probability threshold for accepting the null hypothesis. We find similar results for the variable changing planting dates, since its parameter’s ROPE covers 19.84% of its posterior distribution. This value falls short of the 95% probability threshold, which implies that the null hypothesis that changing planting dates has no meaningful effect on expression of climate change awareness can neither be accepted nor rejected at our chosen HDI.
With regard to farmers that change crop varieties, the ROPE contains 100% of the posterior distribution of the coefficient of the variable changing crop varieties, which is over the 95% probability threshold. Thus, the null hypothesis that changing crop varieties has no meaningful effect on climate change awareness is accepted. However, we find that crop diversification positively affects awareness of climate change and its risk on agriculture because the ROPE does not include any of the posterior distribution—a finding that rejects the null hypothesis that crop diversification has no meaningful effects on expression of climate change awareness. Similar results are observed for ownership of water wells and water pumps. However, farmers that own boreholes are more likely to be aware of climate change and its risk to agriculture than otherwise, keeping other factors constant.
Variable Name
Table 2. Odds ratios, standard deviations, 95% highest density intervals, probability effects and null hypothesis decision results.
Dependent variable: Climate change awareness
Predictor variables
characteristics
change information sources
change impact-related shocks
Varying-intercept effects
The posterior distribution for the coefficient of borehole ownership is not contained in the ROPE, resulting in rejection of the null hypotheses that owning boreholes does not have meaningful effects on awareness of climate change. However, results suggest ownership of water pumps negatively affects the likelihood of one’s awareness of climate change and its risk, ceteris paribus. This could be because there are very few smallholder farm households that own water pumps in Zambia. Additionally, their ownership is linked to irrigation of vegetables within family gardens [70] and not merely for climate change awareness.
Regarding ownership of water pipes and solar panels, our results suggest their respective null hypotheses that they do not have meaningful effects on climate change awareness, are accepted at 95% HDI. This is because their ROPEs include more than 95% of their posterior distribution, which means that these variables do not significantly affect farmers’ climate change awareness. In terms of the climate change impact-related shocks (i.e., increased reliance on irrigation, reduced food consumption, experience of droughts, floods, frost, heat wave, and extreme temperature), the hypothesis that reliance on irrigation of crops has no meaningful effect on climate change awareness is rejected because the ROPE does not include any of the posterior distribution at 95% HDI. Additionally, smallholder farmers whose areas of location experience droughts, floods, frost, heat waves, and extreme temperature are more likely to be aware of climate change and its risk to agriculture than otherwise, everything else held constant. This is because, for example, the null hypothesis that experiencing droughts has no meaningful effects on climate change awareness is rejected, since the ROPE includes none of its parameter’s posterior distribution. Similar results exist for floods, frost, heat wave, and extreme temperatures.
Results presented in the last row of Table 2 show the significance of varying intercepts. As mentioned before, the varying intercepts in the estimation procedures accounted for inter-district variation of the multiple responses from the respondents located in each district. This was to account for inter-district heterogeneity, because agricultural producers from some districts would more than average be aware of climates change awareness. Results suggest that inclusion of varying intercepts is meaningful since the ROPE does not include any of the posterior distribution of the betweendistrict variance—thereby rejecting the null hypothesis that inclusion of varying-slope effects is not meaningful in our modeling strategy.
4. Discussion
This study determines smallholder farmers’ awareness of climate change and its risk to agriculture. It also examines the drivers of farmers’ expression of awareness of climate change and its risks to agriculture in Zambia. Unlike previous studies on climate change awareness, this study delivers a useful empirical application of a Bayesian hierarchical logistic model, estimated using Hamiltonian Monte Carlo (HMC), with its extension, the no-U-turn sampler. This is novel because both the HMC and no-U-turn sampler are state-of-the-art techniques that are more efficient than the Gibbs sampling and Metropolis-Hastings variants, because their Monte Carlo samples suffer less from autocorrelation between chains [58,81]. Additionally, our modeling is under a Bayesian hierarchical framework which is exact in any sample size and also allows individual intercepts to be centered thereby reducing the sensitivity of lower-level parameters to noise—thereby assuring more credible findings.
Our findings show that on average, a large number of farmers do express awareness of climate change and its risks to agriculture in Zambia. However, the number of farmers that indicated awareness of climate change varied by district. For example, only about 54% of farmers in Nyimba expressed climate awareness while Petauke had approximately 91% that reported awareness of climate change and its risks on agriculture. This suggests that while climate change awareness in the country maybe high, there is still need to promote the dissemination of the information about climate change among smallholder agricultural producers. As suggested by [12], providing farmers with climate change information would ultimately help them to adapt to the effects of climate change by using appropriate technologies. Additionally, the need to promote awareness of the climate change crisis would lay a launch pad upon which promotion of adaption technologies could be improved.
Woods et al. [35] found that the more concerned farmers are about climate change—conditional on being well informed—the more likely they would adapt to climate change impacts.
In terms of the socio-demographic characteristics, smallholder farmers with education up to college level are more likely to be aware of climate change and its risks to agriculture than those without an education (that is, those that are illiterates or are not formally educated). These findings corroborate the results by [12,36,37]. Following [82,83], education or cognitive skills theoretically affect perception or awareness because they alter people’s potential to acquire and retain information —which therefore highlights the important role the level of education plays on the science of climate change. In general, we expect a farmer with college education to be more analytical and to better understand the science of climate change than one with an up to primary, basic or high school level of education—which could be why other levels of education did not meaningfully affect climate change awareness among farmers. While not all smallholder farmers in Zambia and other countries may have college education, the opportunity to be aware of climate change and its risks to agriculture is at their disposal through climate change information sources such as the radio and agricultural extension that we found to have positive and meaningful effects on climate change awareness.
Our results show that owning either a radio or television significantly affects awareness of climate change and its risks to agriculture. However, we find that between the two media sources, farmers that own a radio are more likely to be aware of climate change and its risks to agriculture than otherwise, while those that own a television are less likely to be aware of climate change than those that do not. The result for television is unexpected, especially as a television is one of media sources of information expected to positively affect climate change awareness. The reason for this unexpected result could be that televisions (compared to radios) have extremely few programs that are aimed at raising awareness on climate change among farmers. Additionally, our experience is that most programs on Zambian televisions are usually conducted in English, which the majority of farmers do not speak [84] and therefore, they may not absorb the climate change messages shown on television. In contrast, most radio stations in Zambia are location-specific and may provide climate change awareness in local languages, which could be key for farmers’ awareness of the phenomenon. Additionally, farmers that have access to agricultural extension services are more likely to be aware of climate change and its risks to agriculture than otherwise. This result is consistent with [12,38,85].
As in [37], our study recommends increased provision of locally targeted as well as stakeholderspecific extension and advisory services directed at enriching climate change understanding and providing platforms that befit farm-level climate change adaptation among farmers.
We further found that farmers that practice some of the climate change adaptive agricultural strategies such as planting in basins, animal manure, fundikila, or agroforestry are more likely to express awareness of climate change and its risks to agriculture than otherwise. Climate change awareness is expected to increase adoption of these strategies, but practice of these strategies in the first place means climate change awareness—which is also the reason why on average, farmers that practice adaptive strategies more likely express climate change awareness than those that do not. While much of recent studies might have focused on promotion and impact evaluation of climate change adaption technologies, these results suggest that farmers that adopt them are clearly aware of climate change and its risks. Thus, we recommend continued efforts by governments and relevant stakeholders to increase awareness of climate change alongside promotion of adoption of climatesmart agricultural techniques among farmers.
Other important climate change adaptive predictors that have significant effects on expression of awareness of climate change and its risks to agriculture include ownership of water wells, boreholes or water pumps. These assets are useful for making groundwater available to farmers. We found that farmers that own boreholes, ceteris paribus are more likely to express awareness of climate change and its risk to agriculture than otherwise. However, smallholder farmers that own either water wells or water pumps are less likely to express awareness of climate change than those without such assets, holding other factors constant. The reason for the latter results could be because most farmers in Zambia and most parts of SSA traditionally tend to use groundwater for the production of vegetables or for home consumption [86]. Due to the fact that climate change effects include
droughts, farmers could own these assets not necessarily because of being aware of climate change, but rather as short-term strategy to withstand water shortages.
As put forward by [12,34,53,87], awareness or perception can as well be determined by recency effects, that is, the recent occurrence of a climate variation event such as a rainy winter or a dry summer or changes in daily temperature. Consistent with these arguments, we found that farmers that have in the past unexpectedly experienced droughts, floods, frost, heat wave, or extreme temperatures are more likely to be aware of climate change and risk to agriculture than otherwise. This is novel, especially as Zambia and other SSA countries have unsurprisingly experienced rising temperature, and uncertain rainfall patterns such as droughts and floods [7,37], which ultimately risk rain-fed agriculture that majority of smallholder farmers depends on. By experiencing such unusual weather events, farmers are more likely to become aware of climate change and its risk on agricultural production. These results demonstrate that while human perception of climate change could be complex, stochastic weather events that have plagued the current generation are clearly contributing to farmers’ awareness of climate change and the risks it poses on agricultural production.
Moreover, respondents that rely more on irrigated agriculture are less likely to be aware of climate change and its risk to agriculture than those that rely on rain-fed agriculture. This is plausible because rain-fed agriculture is more vulnerable to climate change impacts [7,15]. However, even farmers that rely on irrigated agriculture need climate change information because the droughts affect water availability. The temperatures are forecasted to rise in mid-century and beyond 2100, which could lead to more crop stress and ultimately yield reduction [6]. Additionally, farmers that diversify are more likely to express awareness of climate change and its risks to agriculture. This is expected as farmers may be diversifying crops as an adaption to climate change risks thereby avoiding losses, by planting drought-tolerant varieties that would resist climate-related droughts [20].
5. Conclusions
Using Bayesian hierarchical techniques, this study determined the drivers of awareness of climate change and its risks to agriculture among smallholder farmers in Zambia. While we found a large percentage of smallholder farmers are aware of climate change and its risks in Zambia, the awareness levels among farmers across the sampled districts was not homogenous. We recommend more rigorous efforts of promoting awareness in synergy with climate-smart adaptation strategies. This is important because farmers’ perceptions and/or awareness of climate change guide their adaptation strategies [49,88,89].
We found that several socio-demographic, climate change information sources, climate change adaptive factors, and climate change impact-related shocks to have meaningful effects on farmer’s expression of awareness of climate change and its risks to agriculture. More importantly, we found recency of factors such as droughts, frost, floods, heat wave, and extreme temperatures to positively predict climate change awareness and its risks to agriculture. Due to the fact that people’s capacity to implement adaptation measures needs both personal cognitive motivation and societal support [90], we recommend promotion of climate change awareness among farmers while providing them with the necessary information of possible mitigation measures.
Author Contributions: Conceptualization, J.N.N., M.C.T., and B.M.; methodology, J.N.N.; software, J.N.N.; formal analysis, J.N.N., M.C.T., and B.M.; investigation, J.N.N., M.C.T., and B.M.; resources, J.N.N., M.C.T., and B.M.; data curation, J.N.N., M.C.T., and B.M, and O.F.; writing—original draft preparation, J.N.N., M.C.T., and B.M; writing—review and editing, J.N.N., M.C.T., and B.M. All authors have read and agreed to the published version of the manuscript.
Funding: This work received no institutional funding.
Acknowledgments: The authors are grateful to IAPRI and -UNZA for the dataset. The authors thank the Editor and two anonymous reviewers for their constructive comments and suggestions. The authors also acknowledge Mariah Thornicroft Ng’ombe for useful comments.
Conflicts of Interest: The authors declare no conflict of interest.
A Annex 1. Descriptive statistics of variables.
Dependent variable
Predictor variables
characteristics
Climate change adaptive factors
Number of observations
Annex 2. Posterior means, standard deviations, and Bayesian 95% credible intervals.
Dependent variable
Awareness of climate change and its risks to agriculture
Predictor variables
Socio-demographic characteristics
Annex 2. Continued
Varying-intercept effects
References
1. Gelman, A.; Rubin, D.B. Inference from iterative simulation using multiple sequences. Stat. Sci. 1992, 7, 457–472, doi:10.1214/ss/1177011136.
2. Darnhofer, I. Strategies of family farms to strengthen their resilience. Environ. Policy Gov. 2010, 20, 212–222, doi:10.1002/eet.547.
3. Niang, I.; Ruppel, O.C.; Abdrabo, M.A.; Essel, A.; Lennard, C.; Urquhart, P. Impacts, adaptation, and vulnerability. Part B: Regional aspects, Africa. Contribution of working group II to the fifth assessment report of the intergovernmental panel on climate change. In Climate Change; Barros, V.R., Field, C.B., Dokken, D.J., Mastrandrea, M.D., Mach, K.J., Bilir, T.E., Chatterjee, M., Ebi, K.L., Estrada, Y.O., Genova, R.C., et al., Eds.; Cambridge University Press: Cambridge, UK, 2014; pp. 1199–1265.
4. Porter, J.R.; Xie, L.; Challinor, A.J.; Cochrane, K.; Howden, S.M.; Iqbal, M.M.; Mastrandrea, M.D. Food security and food production systems. Part A: Contribution of working group II to the fifth assessment report of the intergovernmental panel on climate change. In Climate Change; Field, C.B., Barros, V.R., Dokken, D.J., Mastrandrea, M.D., Mach, K.J., Bilir, T.E., Chatterjee, M., Ebi, K.L., Estrada, Y.O., Genova, R.C., et al., Eds.; Cambridge University Press: Cambridge, UK, 2014; pp. 485–533.
5. Masipa, T.S. The impact of climate change on food security in South Africa: Current realities and challenges ahead. Jàmbá J. Disaster Risk Stud. 2017, 9, 1–7, doi:10.4102/jamba.v9i1.411.
6. Hamududu, B.H.; Ngoma, H. Impacts of climate change on water resources availability in Zambia: Implications for irrigation development. Environment. Dev. Sustain. 2019, 1-22, doi:10.1007/s10668-01900320-9.
7. Bounoua, L. Climate Change is Hitting African Farmers the Hardest of All: The Conversation. 2015. Available online: http://theconversation.com/climate-change-is-hitting-african-farmers-the-hardest-of-all40845 (accessed on 24 January 2020).
8. Ubisi, N.R.; Mafongoya, P.L.; Kolanisi, U.; Jiri, O. Smallholder farmer’s perceived effects of climate change on crop production and household livelihoods in rural Limpopo province, South Africa. Chang. Adapt. Socio Ecol. Syst. 2017, 3, 27–38, doi:10.1515/energyo.0130.00001.
9. Wu, J.; Qu, J.; Li, H.; Xu, L.; Zhang, H.; Aryal, S.; Zeng, J.; Fan, Y.; Wei, Q.; Liu, X. What Affects Chinese Residents’ Perceptions of Climate Change? Sustainability 2018, 10, 4712, doi:10.3390/su10124712.
10. Waldman, K.B.; Vergopolan, N.; Attari, S.Z.; Sheffield, J.; Estes, L.D.; Caylor, K.K.; Evans, T.P. Cognitive biases about climate variability in smallholder farming systems in Zambia. Weather Clim. Soc. 2019, 11, 369–383, doi:10.1175/wcas-d-18-0050.1.
11. Wineman, A.; Crawford, E.W. Climate change and crop choice in Zambia: A mathematical programming approach. NJAS Wagening. J. Life Sci. 2017, 81, 19–31, doi:10.1016/j.njas.2017.02.002.
12. Roco, L.; Engler, A.; Bravo-Ureta, B.E.; Jara-Rojas, R. Farmers’ perception of climate change in Mediterranean Chile. Reg. Environ. Chang. 2015, 15, 867–879, doi:10.1007/s10113-014-0669-x.
13. Nyanga, P.H.; Johnsen, F.H.; Aune, J.B. Smallholder farmers’ perceptions of climate change and conservation agriculture: Evidence from Zambia. J. Sustain. Dev. 2011, 4, 73, doi:10.5539/jsd.v4n4p73.
14. Wheelan, C. Naked Statistics: Stripping the Dread from the Data; WW Norton & Company: New York, NY, USA, 2013.
15. Mulenga, B.P.; Wineman, A.; Sitko, N.J. Climate trends and farmers’ perceptions of climate change in Zambia. Environ. Manag. 2017, 59, 291–306, doi:10.1007/s00267-016-0780-5.
16. Assan, E.; Suvedi, M.; Schmitt Olabisi, L.; Allen, A. Coping with and adapting to climate change: A gender perspective from smallholder farming in Ghana. Environments 2018, 5, 86, doi:10.3390/environments5080086.
17. Arslan, A.; McCarthy, N.; Lipper, L.; Asfaw, S.; Cattaneo, A.; Kokwe, M. Climate smart agriculture? Assessing the adaptation implications in Zambia. J. Agric. Econ. 2015, 66, 753–780, doi:10.1111/14779552.12107.
18. Kuntashula, E.; Chabala, L.M.; Chibwe, T.K.; Kaluba, P. The effects of household wealth on adoption of agricultural related climate change adaptation strategies in Zambia. Sustain. Agric. Res. 2015, doi:10.5539/sar.v4n4p88.
19. Lipper, L.; Thornton, P.; Campbell, B.M.; Baedeker, T.; Braimoh, A.; Bwalya, M.; Hottle, R. Climate-smart agriculture for food security. Nat. Clim. Chang. 2014, 4, 1068–1072.
20. Khonje, M.; Manda, J.; Alene, A.D.; Kassie, M. Analysis of adoption and impacts of improved maize varieties in eastern Zambia. World Dev. 2015, 66, 695–706, doi:10.1016/j.worlddev.2014.09.008.
21. Ngoma, H.; Mason, N.M.; Sitko, N.J. Does minimum tillage with planting basins or ripping raise maize yields? Meso-panel data evidence from Zambia. Agric. Ecosyst. Environ. 2015, 212, 21–29, doi:10.1016/j.agee.2015.06.021.
22. Sutcliffe, C.; Dougill, A.J.; Quinn, C.H. Evidence and perceptions of rainfall change in Malawi: Do maize cultivar choices enhance climate change adaptation in sub-Saharan Africa? Reg. Environ. Chang. 2016, 16 , 1215–1224, doi:10.1007/s10113-015-0842-x.
23. Ng’ombe, J.N.; Kalinda, T.H.; Tembo, G. Does adoption of conservation farming practices result in increased crop revenue? Evidence from Zambia. Agrekon 2017, 56, 205–221, doi:10.1080/03031853.2017.1312467.
24. Spear, D.; Chappel, A. Livelihoods on the Edge without a Safety Net: The case of Smallholder crop farming in north-central Namibia. Land 2018, 7, 79, doi:10.3390/land7030079.
25. Tambo, J.A.; Abdoulaye, T. Smallholder farmers’ perceptions of and adaptations to climate change in the Nigerian savanna. Reg. Environ. Chang. 2013, 13, 375–388, doi:10.1007/s10113-012-0351-0.
26. Masasi, B.; Ng’ombe, J.N. Does a market systems approach revitalize smallholder irrigation schemes? Evidence from Zimbabwe. Sustain. Agric. Res. 2019, 8, 36, doi:10.5539/sar.v8n2p36.
27. Mulungu, K.; Ng’ombe, J.N. Climate Change Impacts on Sustainable Maize Production in Sub-Saharan Africa: A Review. Maize Prod. Use 2019, doi:10.5772/intechopen.90033.
28. Amadu, F.O.; Miller, D.C.; McNamara, P.E. Agroforestry as a pathway to agricultural yield impacts in climate-smart agriculture investments: Evidence from southern Malawi. Ecol. Econ. 2020, 167, 106443, doi:10.1016/j.ecolecon.2019.106443.
29. Hachigonta, S.; Nelson, G.C.; Thomas, T.S.; Sibanda, L.M. (Eds.). Southern African Agriculture and Climate Change: A Comprehensive Analysis; International Food Policy Research Institute: Washington, DC, USA, 2013; Volume 3.
30. Mekonnen, Z.; Kassa, H.; Woldeamanuel, T.; Asfaw, Z. Analysis of observed and perceived climate change and variability in Arsi Negele District, Ethiopia. Environ. Dev. Sustain. 2018, 20, 1191–1212, doi:10.1007/s10668-017-9934-8.
31. Hamilton, L.; Keim, B. Regional variation in perceptions about climate change. Int. J. Climatol. 2009, 29, 2348–2352, doi:10.1002/joc.1930.
32. Lata, S.; Nunn, P. Misperceptions of climate-change risk as barriers to climate-change adaptation: A case study from the Rewa Delta, Fiji. Clim. Chang. 2012, 110, 169–186, doi:10.1007/s10584-011-0062-4.
33. Barnes, A.; Toma, L. A typology of dairy farmer perceptions toward climate change. Clim. Chang. 2012, 112, 507–522, doi:10.1007/s10584-011-0226-2.
34. Hansen, J.; Marx, S.; Weber, E. The Role of Climate Perceptions, Expectations, and Forecasts in Farmer Decision Making: The Argentine Pampas and South Florida; IRI Technical Report 04-01; Academic Commons: New York, NY, USA, 2004.
35. Woods, B.A.; Nielsen, H.Ø.; Pedersen, A.B.; Kristofersson, D. Farmers’ perceptions of climate change and their likely responses in Danish agriculture. Land Use Policy 2017, 65, 109–120, doi:10.1016/j.landusepol.2017.04.007.
36. Gbetibou, G.A. Understanding Farmers’ Perceptions and Adaptations to Climate Change and Variability: The Case of the Limpopo Basin, South Africa. Environment and Production Technology Division; Discussion Paper 00849; IFPRI (International Food Policy Research Institute): Washington, DC, USA, 2009.
37. Habtemariam, L.T.; Gandorfer, M.; Kassa, G.A.; Heissenhuber, A. Factors influencing smallholder farmers’ climate change perceptions: A study from farmers in Ethiopia. Environ. Manag. 2016, 58, 343–358, doi:10.1007/s00267-016-0708-0.
38. Uddin, M.N.; Bokelmann, W.; Dunn, E.S. Determinants of farmers’ perception of climate change: A case study from the Coastal Region of Bangladesh. Am. J. Clim. Chang. 2017, 6 , 151–165, doi:10.4236/ajcc.2017.61009.
39. Liu, Z.; Smith, W.J.; Safi, A.S. Rancher and farmer perceptions of climate change in Nevada, USA. Clim. Chang. 2014, 122, 313–327, doi:10.1007/s10584-013-0979-x.
40. Stevenson, K.T.; Peterson, M.N.; Bondell, H.D.; Moore, S.E.; Carrier, S.J. Overcoming skepticism with education: Interacting influences of worldview and climate change knowledge on perceived climate change risk among adolescents. Clim. Chang. 2014, 126, 293–304, doi:10.1007/s10584-014-1228-7.
41. Rebetez, M. Public expectations as an element of human perception of climate change. Clim. Chang. 1996 , 32, 495–509.
42. Rural Agricultural Livelihood Survey (RALS) ; Indaba Agricultural and Policy Research Institute (IAPRI): Lusaka, Zambia, 2012.
43. Tembo, M.C.; Kuntashula, E.; Kalinda, T. Climate change awareness and joint decision to adopt agro forestry and conservation agriculture practices in Zambia. J. Sustain. Dev. 2017, 10 , doi:10.5539/jsd.v10n4p107.
44. Haggblade, S.; Tembo, G. Conservation Farming in Zambia; International Food Policy Research Institute: Washington, DC, USA, 2003.
45. Teklewold, H.; Kassie, M.; Shiferaw, B. Adoption of multiple sustainable agricultural practices in rural Ethiopia. J. Agric. Econ. 2013 , 64 , 597–623, doi:10.1111/1477-9552.12011.
46. Shiferaw, B.; Tesfaye, K.; Kassie, M.; Abate, T.; Prasanna, B.M.; Menkir, A. Managing vulnerability to drought and enhancing livelihood resilience in sub-Saharan Africa: Technological, institutional and policy options. Weather Clim. Extrem. 2014 , 3, 67–79, doi:10.1016/j.wace.2014.04.004.
47. Ng’ombe, J.; Kalinda, T.; Tembo, G.; Kuntashula, E. Econometric analysis of the factors that affect adoption of conservation farming practices by smallholder farmers in Zambia. J. Sustain. Dev. 2014, 7 , 124, doi:10.5539/jsd.v7n4p124.
48. Abdulai, A.N.; Abdulai, A. Examining the impact of conservation agriculture on environmental efficiency among maize farmers in Zambia. Environ. Dev. Econ. 2017, 22, 177–201, doi:10.1017/s1355770x16000309.
49. Elum, Z.A.; Modise, D.M.; Marr, A. Farmer’s perception of climate change and responsive Startegies in three selected provinces of South Africa. Clim. Risk Manag. 2017, 16, 246–257, doi:10.1016/j.crm.2016.11.001.
50. Samuel, O.O.; Micheal, A.; Nkonki-Mandleni, B. Determinants of climate change awareness among rural farming households in South Africa. J. Econ. Behav. Stud. 2018, 10 , 116–124, doi:10.22610/jebs.v10i5(j).2502.
51. Ng’ombe, J.N. Impact of Conservation Farming on Smallholder Farm Household Incomes in Zambia: Evidence Using an Endogenous Switching Regression Model. Master’s Thesis, The University of Zambia, Lusaka, Zambia, 2013. Available online: https://pdfs.semanticscholar.org/0b39/07fa6894007787ae90704768fbe49aa2c426.pdf (accessed on 27 February 2020).
52. Matthews, R.B.; Holden, S.T.; Volk, J.; Lungu, S. The potential of alley cropping in improvement of cultivation systems in the high rainfall areas of Zambia I. Chitemene and Fundikila. Agrofor. Syst. 1992 , 17, 219–240, doi:10.1007/bf00054149.
53. Marx, S.M.; Weber, E.U.; Orlove, B.S.; Leiserowitz, A.; Krantz, D.H.; Roncoli, C.; Phillips, J. Communication and mental processes: Experiential and analytic processing of uncertain climate information. Glob. Environ. Chang. 2007, 17, 47–58, doi:10.1016/j.gloenvcha.2006.10.004.
54. Greene, W.H. Econometric Analysis; Pearson Education India: Bengaluru, India, 2003.
55. Shalizi, C.R. Advanced Data Analysis from an Elementary Point of View. 2013. Available online: http://www.stat.cmu.edu/~cshalizi/ADAfaEPoV/.Google Scholar (Accessed on December 3, 2020).
56. Ng’ombe, J.N. Technical efficiency of smallholder maize production in Zambia: A stochastic metafrontier approach. Agrekon 2017 , 56 , 347–365, doi:10.1080/03031853.2017.1409127.
57. Gelman, A.; Carlin, J.B.; Stern, H.S.; Dunson, D.B.; Vehtari, A.; Rubin, D.B. Bayesian Data Analysis; Chapman and Hall/CRC: Boca Raton, FL, USA, 2013.
58. McElreath, R. Statistical Rethinking: A Bayesian Course with Examples in R and Stan; Chapman and Hall/CRC: Boca Raton, FL, USA, 2018.
59. Baldos, U.L.C.; Viens, F.G.; Hertel, T.W.; Fuglie, K.O. R&D spending, knowledge capital, and agricultural productivity growth: A Bayesian approach. Am. J. Agric. Econ. 2019, 101, 291–310, doi:10.1093/ajae/aay039.
60. Ng’ombe, J.N.; Boyer, T.A. Determinants of earthquake damage liability assignment in Oklahoma: A Bayesian Tobit censored approach. Energy Policy 2019 , 131 , 422–433, doi:10.1016/j.enpol.2019.05.013.
61. Neal, R.M. MCMC using Hamiltonian Dynamics. In Handbook of Markov Chain Monte Carlo; Brooks, S., Ed.; CRC Press/Taylor & Francis: Boca Raton, FL, USA, 2011; pp. 113–162.
62. Hoffman, M.D.; Gelman, A. The no-U-turn sampler: Adaptively setting path lengths in Hamiltonian Monte Carlo. J. Mach. Learn. Res. 2014 , 15 , 1593–1623.
63. Bolstad, W.M.; Curran, J.M. Introduction to Bayesian Statistics; John Wiley & Sons: Hoboken, NJ, USA, 2016.
64. Gill, J. Bayesian Methods: A Social and Behavioral Sciences Approach; Chapman and Hall/CRC: Boca Raton, FL, USA, 2014.
65. Skevas, I.; Emvalomatis, G.; Brümmer, B. Heterogeneity of long-run technical efficiency of German dairy farms: A Bayesian approach. J. Agric. Econ. 2018, 69, 58–75, doi:10.1111/1477-9552.12231.
66. Gelman, A.; Hill, J. Data Analysis Using Regression and Multilevel/Hierarchical Models; Cambridge University Press: Cambridge, UK, 2006.
67. Gelman, A.; Jakulin, A.; Pittau, M.G.; Su, Y.S.A. Weakly Informative Default Prior. Distribution for Logistic and Other Regression Models. Ann. Appl. Stat. 2008, 2, 1360–1383, doi:10.1214/08-aoas191.
68. Gelman, A. Prior Choice Recommendations. Available online: https://github.com/standev/stan/wiki/PriorChoice-Recommendations (accessed on 21 October 2019).
69. Girolami, M.; Calderhead, B. Riemann Manifold Langevin and Hamiltonian Monte Carlo Methods. J. R. Stat. Soc. Ser. B 2011 , 73 , 123–214, doi:10.1111/j.1467-9868.2010.00765.x.
70. Plastina, A.; Lence, S.H. A parametric estimation of total factor productivity and its components in US agriculture. Am. J. Agric. Econ. 2018, 100, 1091–1119, doi:10.1093/ajae/aay010.
71. Plastina, A.; Lence, S.H. Theoretical production restrictions and agricultural technology in the United States. Am. J. Agric. Econ. 2019, 101, 849–869, doi:10.1093/ajae/aay106.
72. Ng’ombe, J.N.; Brorsen, B.W. Using Hamiltonian Monte Carlo to Estimate Crop Response Functions with Stochastic Plateaus. In Proceedings of the Selected presentation at the 2020 Southern Agricultural Economics Association Annual Meeting, Louisville, Kentucky, 1–4 February 2020. doi:10.22004/ag.econ.302333
73. Stan Development Team. Stan Modeling Language Users Guide and Reference Manual, Version 2.18.0; Stan Development Team: 2018. http://mc-stan.org
74. R Core Team. R: A Language and Environment for Statistical Computing; R Foundation for Statistical Computing: Vienna, Austria, 2018.
75. Bürkner, P.C. “Brms: An R Package for Bayesian Multilevel Models using Stan.” J. Stat. Softw. 2017, 80, 1–28, doi:10.18637/jss.v080.i01.
76. Bürkner, P.C. Advanced Bayesian Multilevel Modeling with the R package brms. arXiv 2017, arXiv:1705.11123.
77. Ng’ombe, J.N. Economics of the Greenseeder Hand Planter, Discrete Choice Modeling, and On-Farm Field Experimentation. Ph.D. Dissertation, Oklahoma State University, Stillwater, OK, USA, 2019.
78. Kruschke, J. Doing Bayesian Data Analysis: A Tutorial with R, JAGS, and Stan; Academic Press: Cambridge, MA, USA, 2014.
79. Kruschke, J.K.; Liddell, T.M. The Bayesian new statistics: Hypothesis testing, estimation, meta-analysis, and power analysis from a Bayesian perspective. Psychon. Bull. Rev. 2018, 25, 178–206, doi:10.3758/s13423016-1221-4.
80. Makowski, D.; Ben-Shachar, M.S.; Lüdecke, D. bayestestR: Describing Effects and their Uncertainty, Existence and Significance within the Bayesian Framework. J. Open Source Softw. 2019, 4, 1541, doi:10.21105/joss.01541.
81. Holding, B.C.; Sundelin, T.; Cairns, P.; Perrett, D.I.; Axelsson, J. The effect of sleep deprivation on objective and subjective measures of facial appearance. J. Sleep Res. 2019, 28, e12860, doi:10.1111/jsr.12860.
82. Van de Schoot, R.; Veen, D.; Smeets, L.; Winter, S.D.; Depaoli, S. A tutorial on using the WAMBS checklist to avoid the misuse of Bayesian statistics. In Small Sample Size Solutions: A Guide for Applied Researchers and Practitioners; van de Schoot, R., Miocevic, M., Eds.; Routledge: Abingdon, UK, 2020; pp. 30–49.
83. Goebbert, K.; Jenkins-Smith, H.C.; Klockow, K.; Nowlin, M.C.; Silva, C.L. Weather, climate, and worldviews: The sources and consequences of public perceptions of changes in local weather patterns. Weather Clim. Soc. 2012, 4, 132–144, doi:10.1175/wcas-d-11-00044.1.
84. Krosnick, J.A.; Holbrook, A.L.; Lowe, L.; Visser, P.S. The origins and consequences of democratic citizens’ policy agendas: A study of popular concern about global warming. Clim. Chang. 2006, 77, 7–43, doi:10.1007/s10584-006-9068-8.
85. Mpundu, L. Link between Farmers, Education. Zambia Daily Mail Ltd. Available online: http://www.dailymail.co.zm/link-between-farming-education/ (accessed on 27 February 2020).
86. Adesina, A.A.; Mbila, D.; Nkamleu, G.B.; Endamana, D. Econometric analysis of the determinants of adoption of alley farming by farmers in the forest zone of southwest Cameroon. Agric. Ecosyt. Environ. 2000, 80, 255–265, doi:10.1016/S0167-8809(00)00152-3.
87. Giordano, M. Agricultural groundwater use and rural livelihoods in sub-Saharan Africa: A first-cut assessment. Hydrogeol. J. 2006, 14, 310–318, doi:10.1007/s10040-005-0479-9.
88. Weber, E.U.; Stern, P.C. Public understanding of climate change in the United States. Am. Psychol. 2011, 66, 315, doi:10.1037/a0023253.
89. Abraham, T.W.; Fonta, W.M. Climate change and financing adaptation by farmers in northern Nigeria. Financ. Innov. 2018, 4, 11, doi:10.1186/s40854-018-0094-0.
90. Munthali, C.K.; Kasulo, V.; Matamula, S. Smallholder farmers’ perception on climate change in Rumphi District, Malawi. J. Agric. Ext. Rural. Dev. 2016, 8, 202–210, doi:10.5897/jaerd2016.0798.
© 2020 by the authors. Licensee MDPI, Basel, Switzerland. This article is an open access article distributed under the terms and conditions of the Creative Commons Attribution (CC BY) license (http://creativecommons.org/licenses/by/4.0/).