Introduction
The diagnosis and prognosis of electrical systems is still a relevant field of research. The research that has been carried out over the years has made it possible to acquire enough knowledge, to build a base from which we can delve further into this field of research. This study is a new challenge that estimates the remaining lifetime of the analyzed process. Many studies have been carried out to establish a diagnosis of the state of health of an electric motor, for example. However, making a diagnosis is like giving binary information: the condition is either healthy or defective. Of course, this may seem simplistic, but detecting a failure requires the use of suitable sensors that provide signals. These will be processed to monitor health indicators (features) for defects. Then, we witnessed a multitude of research activities around classification. It was indeed appropriate to distinguish the operating states, to differentiate them from one another and to inform the operator of the level of severity of a failure or even of the type of failure among a predefined panel. A major effort has been made to estimate the remaining lifetime or even the lifetime consumed. This is a challenge that many researchers are still trying to meet.
This book, which has been divided into two volumes, informs readers about the theoretical approaches and results obtained in different laboratories in France and also in other countries such as Spain, and so on. To this end, many researchers from the scientific community have contributed to this book by sharing their research results.
Introduction written by Abdenour SOUALHI and Hubert RAZIK
Chapter 1, Volume 1, “Diagnostic Methods for the Health Monitoring of Gearboxes”, by A. Soualhi and H. Razik, presents state-of-the-art diagnostic methods used to analyze the defects present in gearboxes. First of all, there is a bibliographical presentation regarding different types of gears and their defects. We conclude that gear defects represent the predominant defect at this level, thus justifying the interest in detecting and diagnosing them. Then, we present various gear analyses and monitoring techniques proposed as part of the condition-based maintenance and propose a diagnostic method. Thus, we show the three main phases of diagnosis: First, the analysis presented as a set of technical processes ensuring control of the representative quantities of operation; then the monitoring that exploits the fault indicators for detection; finally, the diagnosis which is the identification of the detected defect.
Chapter 2, Volume 1, “Techniques for Predicting Defects in Bearings and Gears”, by A. Soualhi and H. Razik, deals with strategies based on features characterizing the health status of the system to predict the appearance of possible failures. The prognosis of faults in a system means the prediction of the failure imminence and/or the estimation of its remaining life. It is in this context that we propose, in this chapter, the three methods of prognosis. In the first method, the degradation process of each system is modeled by a hidden Markov model (HMM). In a measured sequence of observations, the solution consists of identifying among the HMMs the one that best represents this sequence which allows predicting the imminence of the next degradation state and thus the defect of the studied system. In the second method (evolutionary Markov model), the computation of the probability that a sequence of observations arrives at a degradation state at the moment t+1, given the HMM modeled from the same sequence of observations, also allows us to predict the imminence of a defect. The third method predicts the imminence of a fault not by modeling the degradation process of the system, but by modeling each degradation state.
Chapter 3, Volume 1, “Electrical Signatures Analysis for Condition
Monitoring
of Gears
in
Complex Electromechanical Systems,”
written by S. Hedayati Kia and M. Hoseintabar Marzebali, deals with a review of their most remarkable research, which has been carried out in the last 10 years. A particular emphasis has been placed on the topic of noninvasive fault detection in gears using electrical signatures analysis. The main aim is to utilize the electrical machine as a sensor for the identification of gear defects. In this regard, a universal approach is developed for the first time by the authors which allows evaluating the efficacy of noninvasive techniques in the diagnosis of torsional vibration induced by the faulty gear located
within the drive train. This technique can be considered an upstream phase for studying the feasibility of gear fault detection using noninvasive measurement in any complex electromechanical system.
Chapter 4, Volume 1, “Modal Decomposition for Bearing Fault Detection”, by Y. Amirat, Z. Elbouchikri, C. Delpha, M. Benbouzid and D. Diallo, deals with induction machine bearing faults detection based on modal decomposition approaches combined to a statistical tool. In particular, a comparative study of a notch filter based on modal decomposition, through an ensemble empirical mode decomposition and a variational mode decomposition, is proposed. The validation of these two approaches is based on simulations and experiments. The achieved simulation and experimental results clearly show that, in terms of fault detection criterion, the variational mode decomposition outperforms the ensemble empirical mode decomposition.
Chapter 5, Volume 1, “Methods for Lifespan Modeling in Electrical Engineering”, by A. Picot, M. Chabert and P. Maussion, deals with the statistical methods for electrical device lifespan modeling from small-sized training sets. Reliability has become an important issue in electrical engineering because the most critical industries, such as urban transports, energy, aeronautics or space, are moving toward more electrical-based systems to replace mechanical- and pneumatic-based ones. In this framework, increasing constraints such as voltage and operating frequencies enhance the risk of degradation, particularly due to partial discharges (PDs) in the electrical machine insulation systems. This chapter focuses on different methods to model the lifespan of electrical devices under accelerated stresses. First, parametric methods such as design of experiments (DoE) and surface responses (SR) are suggested. Although these methods require different experiments to organize in a certain way, they reduce the experimental cost. In the case of nonorganized experiments, multilinear regression can help estimate the lifespan. In the second part, the nonparametric regression tree method is presented and discussed, resulting in the proposal of a new hybrid methodology that takes advantages of both parametric and nonparametric modeling. For illustration purpose, these different methods are evaluated on experimental data from insulation materials and organic light-emitting diodes.
Chapter 1, Volume 2, “Diagnosis of Electrical Machines by External Field Measurement”, by R. Pusca, E. Lefevre, D. Mercier, R. Romary and M. Irhoumah, presents a diagnostic method that exploits the information
delivered by external flux sensors placed in the vicinity of rotating electrical machines in order to detect a stator inter-turn short circuit. The external magnetic field measured by the flux sensors originates from the airgap flux density and from the end winding currents, attenuated by the magnetic parts of the machine. In the faulty case, an internal magnetic dissymmetry occurs, which can be found again in the external magnetic field. Sensitive harmonics are extracted from the signals delivered by a pair of flux sensors placed at 180° from each other around the machine, and the data obtained for several sensor positions are analyzed by fusion techniques using the belief function theory. The diagnosis method is applied on induction and synchronous machines with artificial stator faults. It is shown that the probability of detecting the fault using the proposed fusion technique on various series of measurements is high.
Chapter 2, Volume 2, “Signal Processing Techniques for Transient Fault Diagnosis”, by J.A. Daviu and R.A.O. Rios, revises the most relevant signal processing tools employed for condition monitoring of electric motors. First, the importance of the predictive maintenance area of the electric motors due to the extensive use of these machines in many industrial applications is pointed out. In this context, the most important predictive maintenance techniques are revised, showing the advantages such as the simplicity, remote monitoring capability and broad fault coverage of motor current analysis methods. In this regard, two basic approaches based on current analysis are explained: the classical methods, relying on the Fourier transform of steady-state current (motor current signature analysis – MCSA), and novel methods based on the analysis of startup currents (advanced transient current signature analysis – ATCSA). In the chapter, the most significant signal processing tools employed for MCSA and ATCSA are explained and revised. For MCSA, the basic problems derived from the application of the Fourier transform as well as other constraints of the methodology are explained. For ATCSA, the most suitable signal processing techniques are described, classifying them into continuous and discrete transforms. One representative of each group is accurately described (the discrete wavelet transform for discrete tools and the Hilbert-Huang transform for continuous tools), accompanying the explanation with illustrative examples. Finally, we discussed several examples of the application of each tool to electric motor fault diagnosis.
Chapter 3, Volume 2, “Accurate Stator Fault Detection in an Induction Motor Using the Symmetrical Current Components”, by M. Bouzid and G. Champenois, deals with the accurate detection of stator faults such as inter-turns short circuit, phase-to-phase and phase-to-ground faults of the
induction motor, using the symmetrical current components. The detection method is based on the monitoring of the behavior of the negative and zero sequence stator currents of the machine. This chapter also develops analytical expressions of these components obtained using the coupled inductance model of the machine. However, despite its efficiency, the negative sequence current-based method has its own limitations to detect accurate incipient stator faults in an induction motor. This limit can be explained by the fact that the negative sequence current generated in a faulty motor does represent not only the asymmetry introduced by the fault, but also by other superposed asymmetries, such as the voltage imbalance, the inherent asymmetry in the machine and the inaccuracy of the sensors. This aspect can generate false alarm and make the achievement of accurate incipient stator fault detection very difficult. Thus, to increase the accuracy of the fault detection and the sensitivity of the negative sequence current under different disturbances, this chapter proposes an efficient method able to compensate the effect of the different considered disturbances using experimental techniques having the originality to isolate the negative sequence current of each disturbance. The efficiency of all these proposed methods is validated experimentally on a 1.1-kW motor under different stator faults. Moreover, an original monitoring system, based on neural networks, is also presented and described to automatically detect and diagnose incipient stator faults.
Chapter 4, Volume 2, “Bearing Fault Diagnosis in Rotating Machines”, by C. Delpha, D. Diallo, J. Harmouche, M. Benbouzid, Y. Amirat and E. Elbouchikhi, is focused on detection, estimation and diagnosis of mechanical faults in electrical machines. Nowadays, it is necessary to rapidly assess the structural health of a system without disassembling its elements. For this in situ diagnosis purpose, the use of experimental data is very imperative. Moreover, the monitoring and maintenance costs must be reduced while ensuring satisfactory security performances. In this chapter, we focus on vibration-based signals combined with statistical techniques for bearing fault evaluation. Based on a four-step diagnosis process (modeling, preprocessing, feature extraction and feature analysis), the combination of several techniques such as principal components analysis and linear discriminant analysis in a global approach is explored to monitor the condition of vibration-based bearings. The main advantage of this approach is that prior knowledge on the bearing characteristics is not required. A particularly reduced frequency analysis has led to efficiently differentiate the bearing fault types and evaluate the bearing fault severities.
Chapter 5, Volume 2, “Diagnosis and Prognosis of Proton Exchange Membrane Fuel Cells”, by Z. Li, Z. Zheng and F. Gao, deals with the diagnostic and prognostic issues of fuel cell systems, especially the proton exchange membrane (PEMFC) type. First, the basic functioning principle of PEMFCs and their current development and application status are presented. Their high cost, low reliability and durability make them unfit for commercialization. In the following sections, degradation mechanisms related to both the aging effect and the system operations are analyzed. In addition, typical variables and characterization tools, such as polarization curve, electrochemical impedance spectroscopy, linear sweep voltammetry and cyclic voltammetry, are introduced for the evaluation of PEMFC degradation. Various diagnostic and prognostic methods in the literature are further classified based on their input-to-output process model of the system, namely model-based, data-driven and hybrid methods. Finally, two case studies for diagnosis and prognosis are given at the end of each part to give the readers a general and clearer illustration of these two issues.
Diagnostic Methods for the Health Monitoring of Gearboxes
1.1. Introduction
Maintaining the safety and availability of electromechanical systems (machines) while minimizing operating costs is one of the major challenges industry faces today. To achieve this, machinery health monitoring becomes a necessity. The choice of monitoring techniques depends on the nature of installation and potential degradation. These are usually processes that can either be performed during operation (e.g., monitoring temperature) or delayed (e.g., lubricant analysis), thus requiring scheduled shutdowns of the machines. Moreover, upon diagnosis and depending on the reliability level of the machine operation, a maintenance process can be implemented. The first form of maintenance is called “corrective maintenance.” This strategy is followed only after the appearance of a failure. This strategy involves sudden and uncontrolled shutdowns. The second form of maintenance is called “preventive maintenance.” This is conducted at predetermined intervals or based on a certain pre-established criterion. Hence, preventive maintenance includes two types of maintenance strategies: systematic and conditional. Systematic preventive maintenance is scheduled periodically without taking into account the machine diagnostic operation, and there is no intervention before a predetermined deadline.
It is based on different criteria, for example, the number of hours of operation or the number of cycles of use. Maintenance operations such as lubrication or oil changes are examples of preventive maintenance. These are
Chapter written by Abdenour SOUALHI and Hubert RAZIK
not curative interventions but actions, usually simple and inexpensive, seeking to minimize the failure rate. Nevertheless, following the geometry dispersions of components, the heterogeneity of materials used and the possible surcharges of operations, degradation may occur before the scheduled deadline. In addition, a defect does not appear during the expected period of time, leading to the replacement of components in a good condition which in turn leads to added maintenance cost. Thus, conditional preventive maintenance must be adopted when reliability is the key factor. This strategy is based on features characterizing the health status of the machine to predict and diagnose the appearance of possible failures before they reach the stage causing the breakdown of the machine. Hence, this chapter details and contextualizes the diagnosis of gears. It also presents failures that appear in gearboxes comprising gears and their types. Then, it introduces analysis methods that are generally used, followed by the presentation of main monitoring tools. Finally, we present the state-of-the-art of various techniques for diagnosing gear defects.
1.2. Identification of critical components in gearboxes
Figure 1.1 shows a gearbox with a set of interconnected mechanical components integrated within a housing. The gearbox mainly comprises a gear train that performs the reduction of motion connected to an electric motor that acts as a power generator. Bearings are also part of the gearbox, to guide rotation. They are connected to rotating shafts, thus serving as a supporting structure for the gearbox. Finally, the last elements of the gearbox are the driven mechanisms, including the couplings that ensure transmission of torque, mechanical load output or brakes that allow the slowing down, or even immobilization, of the movement of the assembly. All of the aforementioned elements have influence on the dynamic behavior of the gearbox, but it is generally accepted that the gear train is one of the main sources of excitation, and gears also respond very well to the specific performance, efficiency and power requirements imposed by modern standards. However, conditions such as comfort, vibratory behavior and reliability impose new technological and economic pressure on this component. At the same time, bearings are also subjected to relatively important functional constraints.
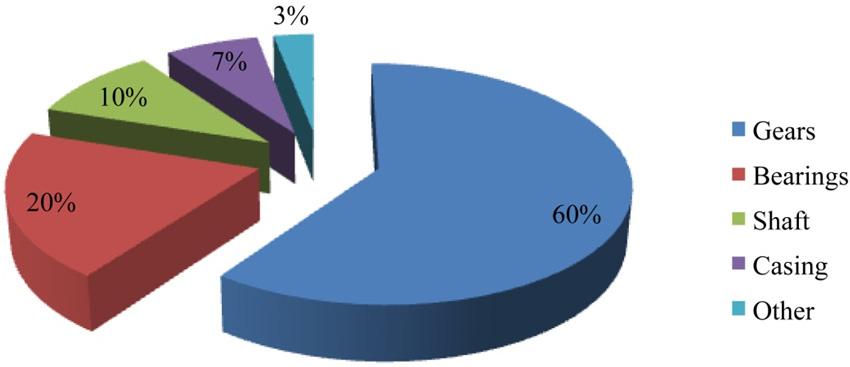
Figure 1.2 shows the results of various researches studying origins of faults and their location in a power transmission-based gearbox and also demonstrate that gears are the most sensitive component [BRE 02]. Bearings
come in second. Thus, in addition to manufacturing and/or assembly defects, there are numerous causes that lead to damage and hence give rise to anomalies with several degrees of severity. So, from both industrial and scientific points of view, it is important to focus gearbox diagnostic efforts primarily on gears and secondarily on bearings.
Figure 1.2. Fault distribution in gearbox transmissions. For a color version of the figures in this book, see www.iste.co.uk/soualhi/electrical1.zip
Figure 1.1. Example kinematic diagram of a gearbox
1.2.1. Types of gears
A gear mechanism contains two gears – driving and driven gears –meshing with each other. This association ensures the transmission of movement, and hence mechanical energy, between two shafts with a constant speed [MS 85].
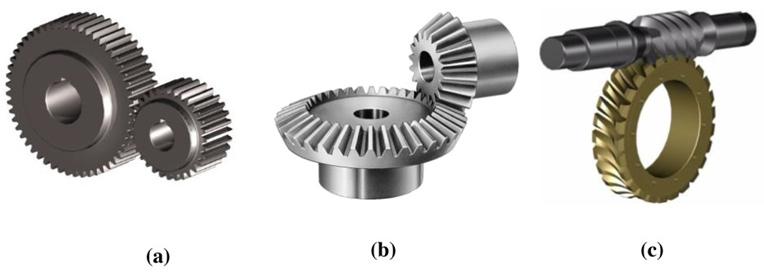
Figure 1.3 shows the following classes of gears, depending on the relative position of the two connected shafts:
– Parallel gears, when the alignment of shafts is parallel (the planetary gears, for example, are part of it);
– Bevel gears, when there is an intersection of shaft extensions;
– Worm gears, when shafts are in any relative position (wheels and worms, for example, are part of it).
The teeth of gears may be straight, helical or herringbone. Thus, forces are either (i) only radial on the parallel gears with straight teeth or chevrons or (ii) mixed (radial and axial) on the gears with helical gears as well as on the worm and bevel gears.
Gears have two major operations: they either reduce or multiply the transmission rotation speed and hence the associated engine torque. The rotation speed increases when the number of teeth of the driven wheel is higher than that of the driving wheel and decreases when its number of teeth is lower. Thus, the speed ratio R between the two wheels is given by
Figure 1.3. (a) Parallel gears, (b) bevel gears and (c) worm gears
where Z1 and Z2 are the number of teeth of the driven and driving wheels, respectively.
Consider a gear mechanism grouping two gears with the number of teeth Z1 and Z2 rotating at frequencies f1 and f2, respectively. When a tooth of the driving wheel meshes with that of the driven wheel, a periodic load is generated at the meshing rate of the teeth [AUG 02]. This shock occurs according to the mesh frequency fe, which is equal to the rotation frequency of the considered wheel multiplied by its number of teeth, as shown in the following equation:
Owing to the change in rigidity, the meshing process causes a sliding of the teeth that produces vibrations and torque variations. The majority of natural phenomena are nonlinear, and most of these signals have variable frequency. Thus, a defect in a tooth changes the amplitude and phase modulations of the dynamics of the gear, which will be analyzed specifically for possible faults.
1.2.2. Types of gear defects
Gears are generally subjected to high torque and severe operating conditions, thus causing failures that must be monitored. For this purpose, it is imperative to understand the different types of defects encountered [BAD 99]. The main damages occurring in gears are: (i) degradation distributed over all the teeth and (ii) degradation located on a part of the teeth. They appear mainly during the transmission. Manufacturing damages, such as the error of tooth profiles and wheel eccentricity, and installation faults, such as parallelism defects, are not discussed in this chapter.
1.2.2.1. Distributed faults
Figure 1.4. (a) Wear and (b) pitting
1.2.2.1.1. Wear
Wear is a phenomenon of material loss due to the abrasive friction of two surfaces in contact with each other, as shown in Figure 1.4(a). This phenomenon is thus caused by repeated surface stresses, of which its importance exceeds the permissible endurance of the material. This type of wear increases with increasing sliding speed and hence the resulting mechanical load, as well as with the influence of the abrasive elements introduced into the lubricating product. The progression of natural wear is inversely proportional to the surface hardness of the tooth and propagates on the surface continuously. This wear occurs when the lubricant contains abrasive particles or when it has a corrosive nature. The lack of wear can lead to faulty operation as a result of the abnormal change in friction, which can hinder the movement.
1.2.2.1.2. Pitting
Pitting are shallow cavities, not exceeding 0.3–0.5 mm in depth, which may affect all teeth of the gear, as shown in Figure 1.4(b). This type of defect particularly affects the areas of the pitch circle of the teeth. This deterioration generally takes place in less-hard steel construction gears and, therefore, is more sensitive to cumulative effects of the overloads. When the viscosity of the lubricant is sufficiently high, the oil film separating the contact surfaces is thick and, therefore, the risk of occurrence of pitting is less. Thus, the existence of pits is related to a ratio of the lubricating film thickness to the composite roughness of the material, which is too insufficient to avoid the contact between the irregularities of the surfaces. This failure occurs as a result of misalignments and deviations of axes.
1.2.2.2. Localized defects
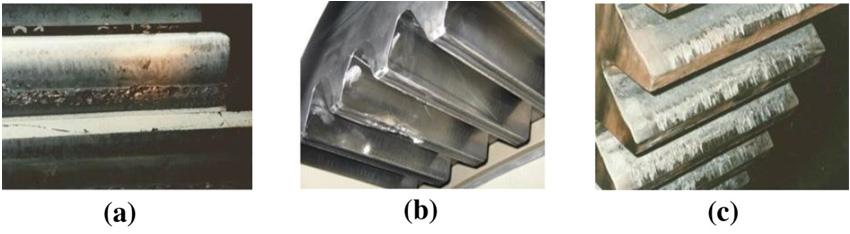
Figure 1.5. (a) Chipping, (b) cracking and (c) scuffing
1.2.2.2.1.
Chipping
Chipping is a phenomenon appearing in the form of deep and wide holes but is less common compared to pitting, as shown in Figure 1.5(a). The failure occurs under the effect of undercoating fatigue, particularly at the maximum shear point of the gear. It is caused by the effect of the surface pressure of the contact when it exceeds the permissible tolerance threshold of the material. This overshoot is often attributed to the poor mechanical load distribution. Chipping usually occurs in cemented gears which have a superficial hardened surface layer and are therefore not affected by the wear phenomenon. These gears are widely used for their ability to transmit considerable mechanical torque while being characterized by reduced dimensions. The spread of chipping can quickly cause tooth breakage, which is considered a consequence of this phenomenon rather than a defect, thus causing disengagement of the meshing operation.
1.2.2.2.2. Cracking
Cracking occurs under the effect of fatigue mainly in charging cycles, as shown in Figure 1.5(b). It occurs in areas such as in the rounded toe of the teeth or the edges of the teeth solicited in traction, where stress is important. The manifestation of this phenomenon is caused by exceeding the stresses applied to the toe of the teeth compared to the limit of fatigue and the elastic limits of the gears. The induced cracking weakens the tooth and reduces the rigidity of the material, thus promoting the propagation of cracks on its entire surface. This degradation usually occurs in fine and hardened steels which prove to be particularly sensitive to the concentration of traction stresses at the level of the teeth.
1.2.2.2.3. Scuffing
Scuffing is the result of the destruction of the lubricant-protecting film under the effect of friction under load, and this degradation is generated by the increase in temperature (see Figure 1.5(c). This damage is related to the metal–metal contact occurring during meshing and leads to the removal of the metallic material. The probability of the occurrence of this scuffing phenomenon depends primarily on the condition of the lubricant and the service conditions. Scuffing is confined to the sliding zones and increases the deformation of the profiles of the teeth. This deformation induces anomalous variations in angular velocities and pressure angles.
1.3. Diagnostic methodology
In the context of the conditional preventive maintenance strategy, the detection of a defect must be part of a well-defined diagnostic methodology in order to optimize the maintenance process. This methodology is part of the supervision which is the set of processes needed to respond correctly to abnormal changes in the state of a system. These changes occur in the form of failures, malfunctions or untimely stops of the operation. Thus, the supervision process helps make the right decisions in terms of scheduled maintenance actions in a timely manner to maximize reliability.
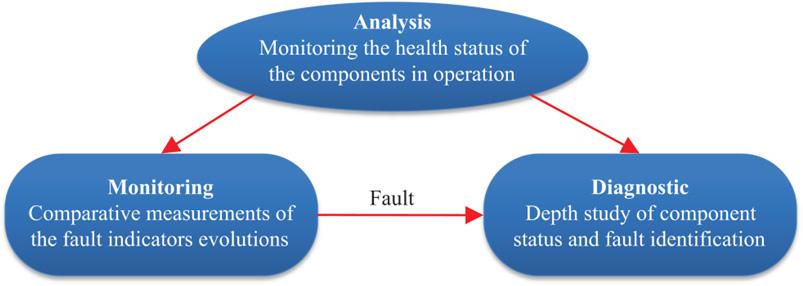
Figure 1.6 presents the three main tasks associated with the general concept of diagnosis in the context of supervision [AYA 15]:
– Analysis. It consists of a set of technical and physical processes that ensure the control of magnitudes representative of good or bad functioning of the component studied. It is, therefore, necessary to monitor the state of health of the elements of the system based on their measured response in operation.
– Monitoring. It is the action of evaluating the state of the process during operation. For example, monitoring uses knowledge and information about the condition in question, including defect indicators. This step then detects the symptoms indicating a possible abnormal change and characterizes it.
– Diagnosis. It is the identification and location of the detected defect. This knowledge serves to characterize the severity emanating from the defect and guides the action to follow accordingly. It exploits the symptoms detected in the monitoring phase to confirm or deny the presence of defects and categorize them before the decision is made.
Figure 1.6. Diagnostic methodology
1.4. Methods of analysis
As discussed above, analysis techniques are methods that monitor the operation of machines as part of the conditional preventive maintenance. The most commonly used techniques for diagnosing rotating machines are temperature analysis, oil analysis, acoustic analysis and, especially, vibration analysis. Recently, new analysis techniques, including electromagnetic torque analysis, flow analysis and electrical current analysis, are receiving increased interest. These techniques are discussed in detail in the following sections.
1.4.1. Temperature analysis
Temperature analysis consists of controlling the temperature at the neighborhood or surface of a given material. It is based on the use of temperature probes or infrared thermography. The result of the latter is a two-dimensional cartographic measurement, called a “thermogram.” The infrared radiation acquired is mainly emitted by the observed surface, and after prior calibration, it can be converted into a measurement of the temperature. This analysis detects most of the defects involved in heating of the material, such as lubrication problems. The interpretation of the results of the temperature control is often fast, however the analysis does not allow for a thorough diagnosis. In addition, monitoring is limited by the visibility of the outputs of the sensors used (infrared cameras) and it is generally difficult to detect early defects [LEE 08].
1.4.2. Oil analysis
The analysis of the oil is susceptible to give an indication on the state of the oil, especially on the state of systems soaked in oil baths such as gears or bearings. Several factors can be monitored, such as the degradation of the oil over time following the oxidation which is often detected by a spectrographic analysis. Also, the physicochemical properties, such as the viscosity of the oil and the water content, indicate an increase in temperature of the element concerned. Also mentioned is the chip detector that determines the presence of metal particles polluting the oil and characterizing the wear of the component. However, it also has limitations such as the inability to precisely locate the defect and the necessary precautions to be taken to carry out the sampling [ARQ 09].
1.4.3. Acoustic analysis
Acoustic analysis is based on the study of sounds in low or high frequency via acoustic emission based on ultrasound (sounds with frequency exceeding 20 kHz) to define the state of health of materials. This technique is capable of detecting phenomena such as the propagation of cracks and friction within the rotating elements.
Numerous analogies exist between vibratory analysis and acoustic emission. Acoustic emission is caused by static or dynamic deformation within a mechanical element under stress. The deformation creates internal micro-displacements, thus producing high-frequency waves. The rapid attenuation of these waves forces the acoustic sensor to be placed near the source. This constraint introduces sensitivity errors, especially with regard to the ambient noise. Thus, this analysis is often difficult to implement and presents problems inherent in the repeatability of the measurements [MIG 11].
1.4.4. Vibration analysis
Vibration analysis is the most commonly used analysis technique in industries. The study of the defects of rotating machines via vibration signals ensures the detection of a wide range of defects, including mechanical. Indeed, it is possible to detect kinematic defects such as eccentricities and misalignments, as well as structural defects such as wear and cracks. Vibratory analysis retranscribes the kinematic behavior generated by a structure solicited by a dynamic excitation. Acceleration is the magnitude most often measured using accelerometers placed on structures in radial, axial and vertical directions. Also, velocity and displacement, which are the mathematical integrals of acceleration and which can be measured using encoders and position sensors, fall within the scope of vibration analysis [SHKB 95].
This analysis has the advantage of detecting failures at an early stage and, therefore, offers the possibility of a thorough diagnosis. However, it also has several limits which stem mainly from the technical constraints of the sensors. It is necessary to place the sensor as close as possible to the process due to the sensitivity problems. Thus, this constraint generates an accessibility problem as well as difficulties in the installation of the sensors in order to make acquisitions in a neighborhood sufficiently close to the defect. In addition, vibration analysis also involves considerable economic
constraints in view of the implementation costs and sensor prices significantly higher than other techniques. Hence, research increasingly tends to focus on other methods that may complement or even replace vibration analysis [CAS 03].
1.4.5. Electromagnetic torque analysis
Electromagnetic torque analysis is based on the detection of faults through the search for harmonics in the frequency domain. These harmonics come from an interaction between the flux and the current. Thus, reconstruction of this torque from the measurements of the electric machine or by using a physical model representing the system is possible. Use of this analysis may prove to be a wise choice for the detection of defects in the mechanical load. Indeed, fluctuations of the load torque have repercussions on the flows and the currents of the machine, causing their variations. As a result, when anomalies occur in the induction machine, such as misalignment of the shaft or degradation of the bearing, the electromagnetic torque generates oscillations, resulting in the appearance of harmonics [HTS 15].
1.4.6. Flux analysis
Flux analysis is based on the principle that imbalances, whether mechanical or electromagnetic, can have an impact on the distribution of the electromagnetic field as well as on the electromechanical conversion of the drive motor. In this context, several studies have been carried out to implement the extraction of flux measurement at the air gap of the motor and also the axial and leakage flux. For these measurements, exploratory coils installed on the cast iron of the motor are used. Thus, leak flow analysis, for example, identifies electrical faults such as short circuit in the induction motor. Also, some components of the axial flow ensure the detection of defects related to bearings and rupture of rotor bars. The main limitation of this process is its high dependence on the resulting load, as the best sensitivity is obtained at full load [CAS 03].
1.4.7. Analysis of electric currents
The current analysis of electrical motors is a promising method for monitoring a wide range of mechanical faults, particularly phenomena involving torque or rotational speed fluctuations, in addition to failures of an
electrical nature. The electric current signal of the electric motor is sensitive to the modulations induced by dynamic excitations, in particular, torque oscillations. From there, it is possible to quantify the frequencies and forms of the modulations in order to locate the origin of the defect. This technique is based on amperometric clamps and transformers for a measure that has the advantage of being noninvasive and inexpensive [KHC 15].
The global applications of current analysis in the scientific and industrial fields can be classified into four main areas [VPM 15]:
– The most common area is equipment diagnostics and power grids. The majority of these installations have already been controlled for several years in terms of usual electrical measurements, such as insulation and supply controls. Recently, the novelty consists of adding to the classical systematic controls, the conditional analysis of the modulations of the electric currents in order to characterize locally the functioning of the elements of the system.
– Current analysis is also used in the study of shaft defects. These failures occur in the form of clearance in clutches, keyways or in torsional resonances and introduce abnormal fluctuations in rotational speed and mechanical torque.
– The analysis of defects in manufacturing processes is also an area of application of current analysis. Indeed, manufacturing errors generate problems of acyclism or regulation at the level of the transmission, inducing relatively large modulations in the electrical signal.
– The last field of application represents the control of alternative machines, such as heat engines or alternative pumps, where acyclism is inherent to the operation. The influence of the acyclic phenomenon on the driving motor current induces modulations that allow for the monitoring of the operation.
1.5. Monitoring methods
Monitoring a machine consists of tracking the evolution of the defect before it causes an untimely and unplanned shutdown. Thus, it maximizes reliability by reducing downtime and improving the life of the system. Monitoring ensures control of the behavior of the machine by comparing the successive readings of the signals collected during the analysis phase. A possible malfunction of the system is signaled, as soon as there is a noticeable change in the given indicators compared to the reference values.
In this context, the notion of a fault signature is introduced, which is defined as the quantized reference that indicates the occurrence of a given defect by comparison with a detection threshold representing its ability to detect the defect concerned. When the indicator changes during operation, at least two thresholds can be defined: (i) an alarm threshold which detects the presence of a fault and (ii) a danger threshold which indicates an impending failure caused by the defect in question (see Figure 1.7). Generally, the signature of the defect is established following a first measurement campaign in the system in the healthy state which constitutes the reference operation [AYA 15].

Monitoring is based on the processing of the signal acquired previously during the analysis step. The signal processing is based on a set of techniques dedicated to the study and the transformation of the input signals in order to carry out the extraction of the characteristics of the defects, in particular, the signatures. In fact, the information contained in the measures is often not directly accessible and requires an intermediate processing step before it can be used. Several monitoring techniques have been used in the literature [PCE 13, CLW 12, TMMZ 12, NY 10]. Thus, it is possible to classify these techniques into three domains: (i) time analysis, (ii) frequency analysis and (iii) time–frequency analysis. The most frequently used techniques for gear monitoring are presented in this chapter.
Figure 1.7. Notion of a health indicator [AYA 15]
1.5.1. Temporal analysis
Conventional time analysis aims at exploiting the temporal information as well as the information relative to the amplitudes contained in the signals to detect the defects. The variation in the amplitude of the signal reflects the presence of the fault, and the periodicity indicates the possible source of the fault [LOU 04]. Time domain approaches are appropriate when periodic Amplitude (m/s²)
Figure 1.8. Waveform of a temporal vibration signal: (a) healthy and (b) with defect
components are observed and when faults generate broad frequency bands following periodic pulses. As shown in Figure 1.8, time waveforms show changes in fault signatures, but it is often difficult to diagnose the source of failures. Indeed, some mechanical systems generate significant torque variations during their operation. When a progressive fault arises, the level of variation in the torque is likely to increase steadily over time, but this increase may be difficult to assess [HLC 00].
Mechanical processes are said to be deterministic if their properties, such as displacement or acceleration, are predicted over time. In addition to these deterministic components, mechanical systems such as faulty gears have random or nondeterministic characteristics that are difficult to predict but can nevertheless be estimated using statistical indicators. These indicators are called “statistics,” as they are based on the analysis of the temporal characteristics of registered signals [TCZ 15]. The most commonly used indicators are: the root mean square (RMS) used to measure the mean energy of a signal, the peak-to-peak value used to quantify the maximum amplitude between the extreme values of the signal, the kurtosis used to quantify the impulsiveness of the signal, and so on (see Table 1.1). The basic reason behind using these indicators is that any appearance of a defect causes a significant change in the statistical characteristics of the signal and therefore on the features.
Table 1.1. Statistical features
For example, the peak-to-peak value and the kurtosis are sensitive to the shock-type defects, whereas the RMS value is sensitive to energy dissipations. The advantages of temporal analysis are its simplicity of implementation and its interpretability. This technique is, therefore, particularly well suited for online monitoring. Nevertheless, these features often generate “false alarms” when the signals are not Gaussian.
Here xi is the ith sample of the recorded signal x(t) and N is the number of samples.
The most popular indicators used in the literature are the following:
– The standard deviation is a measure of the signal’s dispersion about the mean. It should be noted that the standard deviation is similar to the RMS. This feature is sensitive to the energy dissipations and used as a metric in classifiers such as dynamic Bayesian networks [BS 95] and neural networks [LEE 13].
– The RMS value is the second statistical moment of the signal. It is the most interesting measure of vibration amplitudes. In addition to taking into account the evolution of the signal over time, the calculation of the RMS value is related to the vibratory energy and therefore to the “potential for deterioration” of the vibration. Recently, the RMS was used to verify the effectiveness of exploiting only a selection of the vibration signals instead of the original ones. Results showed that when RMS is applied after the selection step, it provides more significant information about the faulty cases [FWZ +16].
– The peak-to-peak value indicates the difference between the maximum and minimum magnitudes of the movement. It is a useful quantity to determine the displacement of a component, of which displacement is critical for considerations of maximum stress or mechanical slack.
– The peak value gives the maximum amplitude and is useful in measurements concerning phenomena of short duration (e.g., shocks). However, it does not take into account the evolution of the vibration over time.
– The average value takes into account this evolution but, unlike the RMS value, it has no relation to any physical quantity.
– The crest factor is defined as the ratio of the peak value to the RMS value of the signal. A localized fault generates a strong peak amplitude vibration and low effective amplitude, thus generating a large crest factor. For generalized faults, the vibrations generated have strong peak and
effective amplitudes, and therefore a low crest factor. The crest factor remains low (between 2 and 6). A localized defect generates a high peak amplitude and low RMS amplitude, and so an important peak factor (greater than 6). However, as the RMS value increases for progressive failure, the crest indicator decreases [DBLR 04]. The major inconvenience of this indicator is that it presents approximately the same values in the good state and in the end of the bearing life.
– Besides these basic quantities (RMS value, peak value and crest factor), kurtosis is another more complex indicator. This is related to the shape of the distribution representing the noise generated by a bearing. Normally, the statistical distribution of this variable obeys Gaussian law. However, when a fault appears, the shape of the distribution changes. Kurtosis (or statistical moment of order 4) then allows us to characterize “flattening.”
Thomas [THO 02] used kurtosis to establish a criterion of severity for the diagnosis of machines, as shown in Table 1.2. As it is calculated on several frequency bands starting from just a few hertz and the first defects are manifested by low-frequency shocks, kurtosis can detect the degradation of bearings at an early stage. In addition, it is suitable for monitoring rotating shaft bearings at low rotational speeds (less than 600 rpm).
This method also has the same drawback as the crest factor. Kurtosis decreases when the defects develop. At an advanced degradation state of the bearing, the kurtosis value is close to 3, representing a state without fault.
Kurtosis Severity
Table 1.2. Quantification of the severity according to kurtosis
– Skewness is defined by the statistical moment of order 3 normalized by the cube of the standard deviation. It is considered as an asymmetry coefficient measuring the asymmetry distribution of a vibration signal compared to its mean value. This indicator gives information about the morphology of the signal’s envelope. A positive skewness value corresponds to a distribution shifted to the lowest peaks (the distribution is shifted to the