KILLER VISUAL STRATEGIES
Engage Any Audience, Improve Comprehension, and Get Amazing Results
Using Visual Communication
Copyright © 2020 by ReelRandom LLC. All rights reserved.
Published by John Wiley & Sons, Inc., Hoboken, New Jersey.
Published simultaneously in Canada.
No part of this publication may be reproduced, stored in a retrieval system, or transmitted in any form or by any means, electronic, mechanical, photocopying, recording, scanning, or otherwise, except as permitted under Section 107 or 108 of the 1976 United States Copyright Act, without either the prior written permission of the Publisher, or authorization through payment of the appropriate per-copy fee to the Copyright Clearance Center, Inc., 222 Rosewood Drive, Danvers, MA 01923, (978) 750-8400, fax (978) 646-8600, or on the Web at www.copyright.com. Requests to the Publisher for permission should be addressed to the Permissions Department, John Wiley & Sons, Inc., 111 River Street, Hoboken, NJ 07030, (201) 7486011, fax (201) 748-6008, or online at http://www.wiley.com/go/permissions.
Limit of Liability/Disclaimer of Warranty: While the publisher and author have used their best efforts in preparing this book, they make no representations or warranties with respect to the accuracy or completeness of the contents of this book and specifically disclaim any implied warranties of merchantability or fitness for a particular purpose. No warranty may be created or extended by sales representatives or written sales materials. The advice and strategies contained herein may not be suitable for your situation. You should consult with a professional where appropriate. Neither the publisher nor author shall be liable for any loss of profit or any other commercial damages, including but not limited to special, incidental, consequential, or other damages.
For general information on our other products and services or for technical support, please contact our Customer Care Department within the United States at (800) 762-2974, outside the United States at (317) 572-3993 or fax (317) 572-4002.
Wiley publishes in a variety of print and electronic formats and by print-on-demand. Some material included with standard print versions of this book may not be included in e-books or in print-on-demand. If this book refers to media such as a CD or DVD that is not included in the version you purchased, you may download this material at http://booksupport.wiley.com. For more information about Wiley products, visit www.wiley.com.
Library of Congress Cataloging-in-Publication Data is Available:
ISBN 9781119680222 (Paperback)
ISBN 9781119680321 (ePDF)
ISBN 9781119680260 (ePub)
Cover and Interior Design: Killer Visual Strategies
Cover Illustration: Killer Visual Strategies
Author Photo: Jennifer Findlay
KILLER VISUAL STRATEGIES
Engage Any Audience, Improve Comprehension, and Get Amazing Results
Using Visual Communication
Amy Balliett
Foreword by Guy Kawasaki
FOREWORD
just about the words we used—it was about how we told our story as a company. And that story was about envisioning a better future—with an emphasis on “vision.”
For any individual or company looking to make a real difference, storytelling is not just powerful— it’s essential. In my career as a venture capitalist, I’ve heard more pitches than I can count that used hot-button words and jargon, but failed to really deliver a sense of the company’s value. To succeed, every organization needs to focus on their purpose, not their product. They must be clear on how they will contribute to a better, brighter future. And communicating that purpose requires visual storytelling.
That’s why, in 2014, I became the chief evangelist of Canva, an online service whose goal was to make graphic design easy for people without access to a dedicated design team. Visual content has become intrinsic to how we all communicate, and I knew there was potential in a company that could facilitate such communication. As it turns out, I was right—demand for visual content from consumers and brands alike seems to be growing exponentially. We now expect brands to communicate visually; anything less is not enough.
Today’s marketing is therefore visual by necessity. Quality visual communication—from motion graphics to interactive experiences to social-media micronarratives—is no longer an option for brands. Whether you’re taking a photo of your office,
preparing a pitch deck for investors, or designing an ebook, you’re putting content out in the world that represents your brand. And it needs to represent your brand well.
Visual content doesn’t just offer a way for you to build brand recognition. High-quality content will demonstrate your company’s commitment to delivering real value. And, perhaps most importantly, the right visual identity for your business will empower you to tell your story in a way that attracts and retains your audience’s attention. Because in the end, no brand will succeed without building meaningful relationships with customers and potential customers. Visual communication shows them how their story aligns with yours and envisions what you can accomplish together.
More and more, I’m seeing brands embrace visual content in their internal communication efforts as well. From video training and interactive professionaldevelopment modules to company newsletters and boardroom presentations, visual content is driving meaning-making in every aspect of our lives. Branding, meanwhile, is now a company-wide endeavor. Everyone from the CEO to the summer intern should know what your brand identity is and why.
A decade after Killer Visual Strategies was founded, this agency remains at the forefront of innovation in visual communication. They produce more types of visual content than I can count, but they offer much more than that. The Killer team specializes
INTRODUCTION
I am not a graphic designer. I am a visual strategist.
This may seem like a small detail, but it’s an important one to get out of the way at the onset of this book. Like a food critic who isn’t a chef, my skills do not lie in the execution of design, but rather in a unique understanding of how the ingredients of good design come together to create exceptional visual content that is far more palatable than simple eye candy.
While this book will include myriad takeaways for designers, visual communication should be mastered across all avenues of an organization. In fact, this book is made for business professionals of all kinds. It is as much for marketers, brand-builders, educators, and communicators as it is for designers.
This isn’t to suggest that designers are not a necessary part of the equation―far from it. If you’re like me, and graphic design is not your strong suit, then you’ll still need to find a great design partner to fully realize the lessons gleaned from this book.
If you don’t have that partner yet, then this book will give you all of the tools and understanding you need to find the right designer or agency partner for your needs. More importantly, it will help you own the outcome of that design work and forge a strong client-vendor partnership to ensure success in the work you do together.
We have entered a world in which 91 percent of today’s audiences prefer visual content over any other form of content, according to Demand Gen Report.
This means that anyone charged with communicating information in any organization, whether internally or externally, must rethink how they deliver that information. Visual communication, when properly executed, has the power to greatly increase engagement, comprehension, and follow-through.
So if your goal is to meet the visual content demands of your audience, then this book is for you!
With the help of this book, you’ll learn how to connect with your target audiences in new and unique ways. You’ll gain insights into the shared instincts that subconsciously drive our impressions of brands today. And you’ll learn practical strategies to harness the power of visual communication, thus revolutionizing your own content and brand strategy.
You don’t need to be a graphic designer to read this book, but when you’re done, I hope you will proudly call yourself a visual strategist!
HOW TO READ THIS BOOK
This book is not meant to be an academic beast of information about the scientific application of visual communication and storytelling. There are dozens of books out there that already fill that need. Instead, this book is actionable. It is written for all levels of understanding with the goal of being easy to digest so that you’re empowered to take immediate action within your organization.
This book is broken into three parts, each building on the last without being dependent on it. This means you can start reading at any part of the book; that way, you can gather the information that you find most relevant to your immediate needs. Of course, if you choose to read it cover-to-cover, you’ll gain an even more thorough understanding of the subject matter.
THE ACCIDENTAL AGENCY
To lay the foundation for this book, I begin with the story of how my company, Killer Visual Strategies, got started. This story offers a setting for the narrative that follows.
PART 1: VISUAL CONTENT IS KING
To prepare you for the lessons ahead, this section provides critical context that will be applied to the
rules outlined in part 2 of this book. It includes a thorough overview of the environmental factors that have contributed to our present-day consumer demand for visual content by summarizing key moments in recent history that have shifted audience expectations.
Part 1 continues by delivering insights into key elements of audience psychology that inform visual communication today, along with some examples of the varying use cases for visual strategy. This section concludes by exploring the expectations and motivations of audiences today and how this impacts their perception of quality in visual media.
PART 2: 8 RULES OF VISUAL COMMUNICATION
The second part of this book is intended to be both a practical reference guide and a deeper dive into each topic, allowing for either continued reading or immediate application, depending on your needs.
Every chapter in part 2 explains a key rule in visual communication design. You can read these chapters in any order, and do not need to read them all the way through to learn how to apply each rule to your own visual content. Each chapter is broken into three distinct parts that can be read independently of one another or together, depending on how deep you want to delve into the topic. Those parts are as follows:
Rule: Each chapter will open with a rule about visual communication followed by a thorough explanation of why the rule exists.
Exercise: To best exemplify the rule and put it to the test, an exercise continues the chapter. These exercises do not require knowledge of design software, but from time to time will require you to be near a computer and utilize free online tools.
Key Takeaways: To sum up the chapter, I’ll share a number of conclusions. If you’re short on time, start by reading the key takeaways, which provide concise steps that you can apply to your visual content immediately, along with a summary of the reasoning behind each rule.
You may choose to read just the rules in part 2 and save the exercises for another time. Or you may choose to only read the key takeaways and start applying the lessons to your own content strategy. Ultimately, this section is presented in a way that allows for quick referencing throughout the content development process.
PART 3: YOUR VISUAL STRATEGY
The final narrative section of this book will draw from the lessons in parts 1 and 2 to define a process for developing great visual content. You’ll also learn about the different types of teams you can build
to achieve your visual strategy. At the end of each chapter, you’ll again find a set of key takeaways. This section is designed to be read from beginning to end to obtain full context, but the key takeaways can also act as easy points of reference for daily use.
APPENDIXES
This book concludes with appendixes comprised of multiple quick-reference materials. You’ll find a breakdown of key terms used in visual strategy; tools used for developing great content; productiontime estimates for different types of content; and a detailed time line that will take you through the history of visual communication.
Finally, if you ever feel lost, take advantage of the detailed index on the final pages. These will help you find answers quickly so that you can start meeting today’s demand for visual content immediately!
Any images in this book accompanied by this symbol [ ] can be viewed at higher resolution at killervisualstrategies.com/book.
THE ACCIDENTAL AGENCY
"It’s fine to celebrate success, but it is more important to heed the lessons of failure."
—Bill Gates
In 2010, during the final weeks of June, I designed my first infographic. I had just left the comfort of a sixfigure job in marketing for the unpredictable world of startup life. I had worked at startups before, but this was the first time I was truly venturing out on my own with nothing to protect me but a slim safety net of savings.
While my then–business partner and I had been working on launching our business for much of 2009, we had both continued working full-time jobs to keep us afloat. But in June of 2010, I took a leap of faith and quit my day job running search marketing for a directory of colleges. It was the first time that I could realistically dedicate my full attention to our business at the time, an e-commerce software-review service called ZippyCart.com.
ZippyCart was one of many websites we owned, and it was our most successful. We had launched it in 2009 and grown it to a sizeable monthly income as a review and affiliate website. Our goal was to create a handful of other affiliate websites and use content marketing to grow their audience.
I was extremely excited about what was possible within our planned business model. A world of opportunity was in front of me, but financial security—and the peace of mind that came with it— had been thrown out the proverbial window.
I had been the breadwinner of my household. Two years prior, I’d committed to a Seattle mortgage that secured me just 900 square feet of living space for
an investment that would have bought me a ninethousand-square-foot mansion in my hometown of Cleveland. The country was beginning to rebound from the 2008 financial crisis and the cost of living was going nowhere but up. With the weight of the world (or at least my family’s financial livelihood) bearing down on me, I needed a disruptive marketing tool that would help grow ZippyCart into a worthwhile brand so that I could provide a reliable income again.
Enter the infographic: the one piece of content that I could not convince my previous employer to even test. I was certain that an infographic would help put ZippyCart on the map, and was willing to bet three crucial weeks of non-revenue-generating productivity on it.
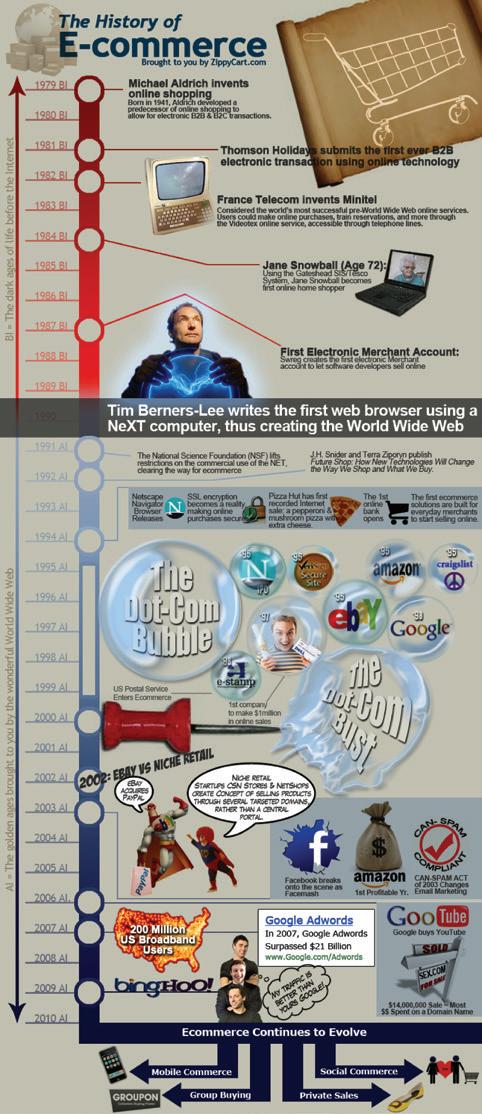
A few weeks later, it was clear that the investment of my time had paid off in spades. The infographic, entitled “The History of E-commerce” (Figure AA.1), delivered more than a thousand inbound links to our website. We moved to page 1 of Google search results for multiple coveted terms, including our target key phrase, “shopping cart reviews.” We also saw our PageRank score increase almost overnight.
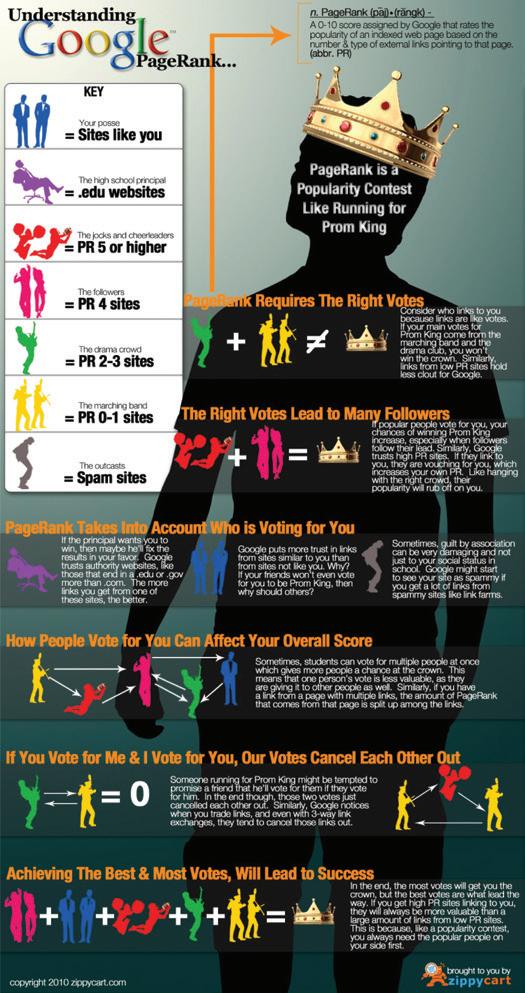
I was certain that I had mastered a new medium of content marketing, and I was hooked! I quickly jumped at the opportunity to create another infographic, this time on the topic of Google’s PageRank methodology. My next infographic (Figure AA.2) took only a weekend for me to produce and led to two thousand inbound links!
I was on cloud nine and nothing could stop me. Infographics were my new secret weapon, so I quickly immersed myself in this burgeoning new world of content strategy.
FIRST LESSON LEARNED: BEING IN THE RIGHT PLACE AT THE RIGHT TIME IS LUCK, NOT SKILL
Fueled by an inflated ego, I began sharing my designs with more experienced entrepreneurs and industry experts. While some chose to remain impartial and offered positive reinforcement, others understood that silence or compliance would only hurt me. One tweet from a business leader I highly respected stood out above the rest and changed everything for me.
Rand Fishkin, founder and CEO of Moz (then SEOMoz), responded to my Google PageRank infographic with four simple words: “That’s not an infographic.” Nothing more, nothing less.
With those four simple words, I was deflated. What did he mean―my design wasn’t an infographic? I had combined images with text and sized the content in the same way other infographics were delivered online. What could I have possibly done wrong?
I considered shrugging off the comment. After all, with thousands of backlinks, I had hard data backing up my success. But Fishkin had made a name for himself by staying ahead of trends and predicting how those trends might impact content marketing best practices. I, on the other hand, had made a living following the advice of Fishkin and people like him. I wanted to dig in and defend myself, but I also wanted to heed the words of someone whose thought leadership had guided much of my marketing career up to that point.
Figure AA.2 [ ]
Figure AA.1 [ ]
After stepping away and reviewing the infographics (Figures AA.1 and AA.2), it became clear that Fishkin was right. They weren’t infographics. If all of the text disappeared from these images, they would no longer make any sense. So how could the graphics possibly be depicting information? And yet, more importantly, how was it that those designs had led to so much success?
The answer, simply put, was that I was in the right place at the right time. Visual content marketing was very new at the time. In fact, from 2008 until early 2012, a marketer could use the word “infographic” to describe almost any piece of visual content and get traction for their efforts. It was because of this that I was stuck in a positive feedback loop—one that had just been throttled by a single tweet.
Fishkin was right. What I had released to the world as “infographics” were anything but. Instead, they were paragraphs of information juxtaposed with imagery that only made sense if you read the text. They were poorly designed and riddled with mistakes, and today they live on multiple lists of the worst infographics of all time!
THE WORST INFOGRAPHICS
OF ALL TIME
Now that you’ve had a moment to look at the “infographics” in question, you likely see what Fishkin saw. If you don’t, it’s OK. By the end of this book, you’ll be able to look at myriad types of visual content and quickly discern what works and what doesn’t.
Sometimes you have to learn what not to do before you can truly understand how to change your approach and do things right. Because of this, in future chapters, I will reverse-engineer a number of designs to break down all of the issues within them.
These two designs, for example, taught me a great deal about what not to do when developing a visual communication strategy, while also helping to lay the foundation for the award-winning visual content that I will be sharing in this book. At a high level, here are just a few key takeaways I gleaned from my first two projects:
Great visual communication relies on tools like Adobe Illustrator. For my first two projects, I relied on Adobe Photoshop because it was a tool I felt more comfortable with. Illustrator would have been a far better choice due to its agility and robust toolset. More on this later, but for now it’s important to note that Photoshop should be used to color-correct and adjust photos, just like its name implies.
A reading assignment is not an infographic. If you have to read the text to understand the visuals, it’s not true visual communication.
Stock imagery is not the answer. Great visual communication relies on a skilled illustrator creating custom design, not a mix of stock illustrations and imagery.
A strict process should be followed to create great visual content. Without one, you cannot
predict timelines, let goals guide decisions, or deliver a narrative that speaks to your target audience.
Great visual content takes time―but not forever. One weekend and three weeks are both incorrect timelines to develop this type of content.
These points, and more, will be explained in-depth in part 2 of this book.
MOVING FROM BAD TO KILLER
So how did I go from developing bad infographics for a completely different business to building one of the country’s leading visual communication agencies? Partly by accident, to be honest.
Within a month of my Google PageRank infographic, ZippyCart was still benefiting from the associated marketing campaign. If this was the success of a bad design, what could happen with a good one? My business partner at the time was wondering the same thing. In fact, he, more than me at the time, saw the power of infographics and wanted to capitalize on them.
It was because of this that, one August morning of that same summer, he came to me with a domain name and an idea. KillerInfographics.com would be the go-to destination for visual content online. The
plan was to create a directory of infographics and provide reviews to build credibility into the directory. This site would then bolster our main business model and add to our portfolio of websites.
Having an SEO background, I added another domain to the idea: SubmitInfographics.com. At the time, Google ranked websites higher in their search engine results pages (SERPs) if the domain name matched the keyword query. We found that “submit infographics” was a highly searched phrase and quickly scooped up the domain. Within a few hours, we had a WordPress site up and running, complete with an automated submission tool, and dubbed it “Submit Infographics by Killer Infographics.”
Within a few weeks, I had immersed myself in the hundreds of infographics and motion graphics that were submitted to our site. By reviewing a robust and diverse set of visual content, best practices and patterns began to emerge. It was clear that this was an industry begging for guidance and fraught with internal conflicts between the marketers wanting to capitalize on visual content and the designers asked to deliver it.
I realized that Submit Infographics could be more than a directory of designs. We were uniquely positioned to be thought leaders in a new industry, but in order to do so, we would need to build a better brand. With Killer Infographics, we could define standards for infographic design and lead the conversation in visual communication. I knew we were onto something, but I couldn’t yet predict how that would manifest into a business.
ENTER KILLER INFOGRAPHICS, THE AGENCY
At the end of September of 2010, I found clarity. In response to a bad review, a Submit Infographics customer emailed us with a challenge. Their sentiment was simple: they felt that we were hiding behind a screen and a review site and needed to get down off our high horse, so to speak. If we thought we could do better, then they wanted us to prove it, so they offered to pay us to design an infographic for their company.
Immediately, I accepted the challenge. The customer provided me with clear research and gave me an opportunity to put my newly identified best practices to the test. I knew I could produce a great design with the foundation they laid for me, even if the money they offered us wasn’t much.
The resulting design was such a success that the customer asked if we had the capacity to take on more work. This presented a unique conflict: our business model was not created to take on clients and offer a subjective service. In fact, this direction was the antithesis of what we had set out to do when starting a company. Our goal had been to create content for ourselves, not for clients.
At the same time, however, that original business model was not working out. By pivoting to design services, I was certain we could buy ourselves some time for our other websites to move up in SERPs
and start generating more revenue. As a result, I convinced my business partner that we could do both. My passion for visual communication was only growing. With infographic design, I saw an opportunity that I couldn’t walk away from, even at the risk of my business partnership.
We began by hiring freelancers, a practice that is still common among design agencies, but one that we avoid today. (In part 3 of this book, I’ll explain the differences between freelance and in-house design and how these options impact your visual content.)
But back in 2010, when I was still testing a new business model, starting with freelance designers was ideal.
In the final quarter of 2010, we landed a few more clients and designed fourteen infographics. We moved out of my then–business partner’s townhome office and into a commercial space that could squeeze in five desks. We filled the space with writing interns, focusing their attention on ZippyCart, because we still believed that that would remain our core focus.
But during the first quarter of 2011, it became impossible to juggle both. In that quarter alone, we designed nearly 140 infographics! To keep our eye on the original prize, my business partner kept much of his focus on ZippyCart; meanwhile, I switched much of my attention to Killer.
I threw all of my time into Killer's needs, which included account management, project management, research, art direction, and taking on designs when a
freelancer fell through. By touching every part of the process, I continued to hone best practices and learn from past mistakes. This, in tandem with valuable insight from our freelancers, helped to inform the foundations of the process we still follow today.
By June of 2011, we had designed nearly four hundred infographics and began making a name for ourselves. A full year had passed since I took the leap of faith that set me in motion to grow my own business. In just twelve short months, the business I had originally planned for was no longer my focus. Instead, I had experienced a fast and reactive pivot into a very unexpected space.
In the coming years, I would change our company name to Killer Visual Strategies (reflecting a suite of expanded offerings), run visual strategy for some of the world’s largest brands, and speak at more than 175 conferences around the globe on the subject of visual communication.
But in June of 2011, I wasn’t yet aware of how this new venture would change my life. I still felt just as excited as I had a year prior. I had a world of opportunity in front of me, but so much—including my financial stability—hung in the balance. Only one thing was certain: a year of leaning into my mistakes had brought me further than expected, and there was still so much to learn.
This world of opportunity now lies in front of you. In the coming chapters, I’ll share a decade’s worth of mistakes and the subsequent lessons learned. More
importantly, I’ll explain how you can apply those lessons and build upon the killer visual strategies that lead the industry today.
PART ONE: VISUAL CONTENT IS KING
What fuels widespread consumer demand? Is it driven by environmental factors such as trends and new platforms, or by a subconscious and innate need for the end product?
We live in a world where technological advancements have drastically altered consumer expectations, but it would be risky to ignore how our natural expectations have informed the evolution of these technologies. The power and influence of visual content today offers a perfect example of how these forces work in tandem: as a result of modern platforms in combination with our own fundamental instincts, we are driven to communicate visually more than ever before.
Is the rise of today’s visual communication era guided primarily by our surroundings and learned actions,
of buyers prefer visual content to any other form of content
Figure P1.1
Source: Demand Gen Report.
or is it fueled by a set of inherent behaviors? In the chapters that follow, you’ll learn about the historical, environmental, and inherent factors contributing to our visual communication–driven world.
In the pages that follow, we’ll learn how the demand for visual content grew in tandem with the emergence of new technologies and new ways to connect. Then we’ll explore how both our nurtured and natural inclinations have pushed us toward a visually inclined world.
Understanding how nature and nurture work together to engage viewers will not only prove why visual content is truly king when combined with an understanding of perceived quality in design, it will provide you with a universal set of motivators to apply to any audience.
CHAPTER 1 ENVIRONMENTAL INFLUENCES AND THE RISE OF VISUAL CONTENT
"Content is where I expect much of the real money will be made on the Internet, just as it was in broadcasting."
—Bill Gates “Content Is King," (1996)
In 1996, with the dot-com boom in its infancy, Bill Gates published an essay on Microsoft’s website that delivered a game-changing prediction for the future of the internet. In that essay, he surmised that “societies will see intense competition—and ample failure as well as success—in all categories of popular content—not just software and news, but also games, entertainment, sports programming, directories, classified advertising, and on-line communities devoted to major interests.”
Entitled “Content Is King,” this short, yet poignant essay quickly entered the vernacular of brand leaders and marketers looking to capitalize on an exciting new technology called the World Wide Web. Organizations everywhere saw the internet as a new frontier of possibilities, but many were equally apprehensive about the future it held. With his essay, Gates was offering a guiding light: a controllable solution for tackling the unknown. Simply put, to find success online, a brand would simply need to focus its efforts on creating great content.
Of course, anything that seems simple in theory is often more complex in practice. In the world of content, this was and still is quite true.
At the time, the general user would connect to the internet using a dial-up modem and consumerfriendly tools such as Netscape Navigator, AOL, and Prodigy. All of these controlled access to content by leading with their own carefully curated experiences first. There were only so many points of entry for logging on to the internet. Meanwhile, the big players
online were not time-tested brands; instead, they were new names that had centered their business around chat rooms and connecting people to each other, rather than to information.
What defined great content was still up for debate, and would be for many years to follow. Advancements in technology would continue to shift what was possible, but in 1996, most content had to be text-based in order to load quickly and remain consumable.
Gates acknowledged this while also predicting future demands as technology improved. In a key takeaway, he noted that “if people are to be expected to put up with turning on a computer to read a screen, they must be rewarded with deep and extremely up-todate information that they can explore at will. They need to have audio, and possibly video. They need an opportunity for personal involvement that goes far beyond that offered through the letters-to-the-editor pages of print magazines.”
Surprisingly, he saw one of the largest barriers to success as the computer screen itself. As with most new technologies entering the market, audiences were wary and set in their ways. Information was consumed in print, not in a digital format. To change consumer habits and ensure they would “put up with turning on a computer” (italics mine), brands would have to offer creative and wholly unique ways to consume content.