remote sensing
Article
Step-By-StepDownscalingofLandSurfaceTemperature ConsideringUrbanSpatialMorphologicalParameters
XiangyuLi 1 ,GuixinZhang 2, *,ShanyouZhu 1 andYongmingXu 1
Citation: Li,X.;Zhang,G.;Zhu,S.; Xu,Y.Step-By-StepDownscalingof LandSurfaceTemperature ConsideringUrbanSpatial MorphologicalParameters. Remote Sens. 2022, 14,3038.https:// doi.org/10.3390/rs14133038
AcademicEditors:YuyuZhou, ElhadiAdam,JohnOdindiand ElfatihAbdel-Rahman
Received:21May2022
Accepted:21June2022
Published:24June2022
Publisher’sNote: MDPIstaysneutral withregardtojurisdictionalclaimsin publishedmapsandinstitutionalaffiliations.
Copyright: ©2022bytheauthors. LicenseeMDPI,Basel,Switzerland. Thisarticleisanopenaccessarticle distributedunderthetermsand conditionsoftheCreativeCommons Attribution(CCBY)license(https:// creativecommons.org/licenses/by/ 4.0/).
1 SchoolofRemoteSensingandGeomaticsEngineering,NanjingUniversityofInformationScience andTechnology,Nanjing210044,China;lxyxzs@nuist.edu.cn(X.L.);zsyzgx@nuist.edu.cn(S.Z.); xym30@nuist.edu.cn(Y.X.)
2 SchoolofGeographicalSciences,NanjingUniversityofInformationScienceandTechnology, Nanjing210044,China
* Correspondence:001631@nuist.edu.cn
Abstract: Landsurfacetemperature(LST)isoneofthemostimportantparametersinurbanthermal environmentalstudies.Comparedtonaturalsurfaces,thesurfaceofurbanareasismorecomplex,and thespatialvariabilityofLSTishigher.Therefore,itisimportanttoobtainahigh-spatial-resolution LSTforurbanthermalenvironmentalresearch.Atpresent,downscalingstudiesaremostlyperformed fromalowspatialresolutiondirectlytoanotherhighresolution,whichoftenresultsinloweraccuracy withalargerscalespan.First,astep-by-steprandomforestdownscalingLSTmodel(SSRFD)is proposedinthisstudy.Inourwork,the900-mresolutionSentinel-3LSTwassequentiallydownscaled to450m,150mand30mbySSRFD.Then,urbanspatialmorphologicalparameterswereintroduced intoSSRFD,abbreviatedasSSRFD-M,tocompensateforthedeficiencyofremote-sensingindicesas drivingfactorsinurbandownscalingLST.TheresultsshowedthattheRMSEvalueoftheSSRFD resultswasreducedfrom2.6 ◦ Cto1.66 ◦ Ccomparedtothedirectrandomforestdownscalingmodel (DRFD);theRMSEvalueoftheSSRFD-Mresultsinbuilt-upareas,suchasGulouandQinhuai District,wasreducedbyapproximately0.5 ◦ C.WealsofoundthattheunderestimationofLSTcaused byconsideringonlyremote-sensingindicesinplacessuchasflowerbedsandstreetswasimprovedin theSSRFD-Mresults.
Keywords: step-by-stepdownscalingofLST;landsurfacetemperature;urbanspatialmorphology
1.Introduction
Asanimportantphysicalvariabledrivingtheenergyexchangebetweenthesurface andtheatmosphere,thesurfacetemperature(LST)isoneofthekeyparametersfor studying theenergybalanceofthesurfaceatglobalorregionalscales.Currently,LSTiswidely usedto assesssurfacemoistureanddroughtlevels[1–4],calculateurbanheatislandintensity [5–7] andsimulatesurfaceenergyexchange[8–11].Inurbanareas,thespatialandtemporal heterogeneityofurbansurfacetemperatureisobviousduetotheextremelycomplex surface,thestrongdifferencesinthree-dimensionalspatialgeometryandthevarietyof surfacecomponentsandtypes.Therefore,studiesoftheurbanthermalenvironmentand otherurban-relatedresearchfieldsusuallyrequireLSTdatawithahigherspatiotemporal resolution.
TheLSTdataobtainedbythermalinfraredremote-sensingtechnologygenerallyhave theproblemofconflictingspatialandtemporalresolutions.Forexample,theModerate ResolutionImagingSpectroradiometer(MODIS)LSTproducthasahightemporalresolution,butthespatialresolutionisonly1000m;Sentinel-3operatesthroughabinaryorbit withatemporalresolutionoffewerthan0.9days,butthespatialresolutionoftheLST productisalso1000m;thelandsurfacetemperatureproductretrievedfromLandsatTIRS hasaspatialresolutionof100m,buttherevisitperiodisaslongas16days.Togetherwith theinfluenceofclouds,theavailablevalidLandsatLSTdataareevenfurtherdiminished.
High-temporal-resolutiondataaredifficulttogenerateforrefinedsurfacetemperature studiesatanurbanscaleduetotheirlowspatialresolution,whilethehighspatialresolution LSTdataareunabletostudythevariationpatternofLSTintimeduetotheirlowtemporal resolution.Tosolvethecontradictionofspatialandtemporalresolutionsofremote-sensing thermaldata,scholarshaveproposedalargenumberoftechnicalmethodsfromvarious perspectives,suchasimageprocessingandstatisticalregression,toobtainlandsurface temperaturedatawithhighspatialandtemporalresolutions.
ThestatisticalregressionmethodhasgainedwideapplicationinLSTdownscaling studiesduetoitslowcomputationalcomplexityandsatisfactorydownscalingresults.The applicationofthismethodhasbecomerelativelymatureinsuburbanandmountainousareaswithsimplelandcoversatalargespatialscale[12,13].However,therearetwoproblems thatcannotbeignoredwhenapplyingthestatisticalmethodtourbanareaswithcomplex landsurfacetypes.Firstly,thelargerthespatialresolutionspanofthedownscaling,the lowertheaccuracytendstobe.Fromtheavailablethermalinfraredremote-sensingdata, therearelotsofLSTproductswithahighertemporalresolutionatabout1000-mspatial resolution.Whentheyaredownscaledtothe100-mleveloreventhe10-mlevel,thespatial resolutionofthedownscaledLSTdiffersfromtheoriginalresolutionbyafactorof10or even100,andthedownscaledaccuracydecreasesasthespatialresolutionincreases.The mainreasonforthisproblemisthattheassumptionofa“constantspatialscalerelationship” betweenLSTandthedrivingfactordoesnotholdwhentheresolutiondifferenceislarge. Secondly,thetraditionaltwo-dimensionalremote-sensingspectralindicesandsurface parametersarenotsufficienttoaccuratelydescribethespatialpatternofanurbansurface. Currently,commonlyusedremote-sensingindicesfordownscalingmodels,suchasthe normalizeddifferencevegetationindex(NDVI),normalizeddifferencemoistureindex (NDMI),normalizeddifferencewaterindex(NDWI)andnormalizeddifferencebuilding index(NDBI)[14]usesurfaceparametersincludingtheDEM,slope,slopedirection,latitude,longitudeandsurfacecovertype[15,16],aswellasmultispectraldata[17]describing thevegetationcover,moisturestatusandtopographicreliefofthelandsurfacefromthe two-dimensionalperspective.Incontrast,citiesaredominatedbybuildingsandimperviouspavements,buttheinfluenceofthethree-dimensionalmorphologicalstructureon locallandsurfacetemperatureislessconsidered.Infact,alargenumberofstudieshave demonstratedthaturbanspatialmorphologicalparameterssuchastheskyviewfactor (SVF),frontalareaindex(FAI)andbuildingdensity(BD)arecloselyrelatedtoLST[18–21], meaningtheyneedtobeconsideredindownscalingmodels.
Toaddresstheabovetwoproblems,thisstudyaimedtodevelopastep-by-stepLST downscalingmethodbyfurtherconsideringurbanspatialmorphologicalparametersto obtaintheurbanlandsurfacetemperatureataspatialresolutionof30mwithhighaccuracy. ThepapertakesthecentralurbanareaofNanjing,JiangsuProvince,Chinaasthestudyarea, andselectsmulti-sourceremote-sensingdata,three-dimensionalspatialdistributiondata ofurbanbuildingstodownscaletheSentinel-3LSTwiththespatialresolutionof1000m totheresolutionsof450,150and30mstep-by-stepusingsurface2Dand3Dparameters asdrivingfactors.ThedownscalingresultsareevaluatedbyLandsatTIRSLSTatthe resolutionof30m.Then,theinfluenceofurbanspatialmorphologicalparametersonland surfacetemperaturedownscalingisdiscussed.Thestep-by-stepLSTdownscalingmethod changesthetraditionalstudiesthatdirectlydownscaleLSTfromalowspatialresolutionto ahighone,selectingseveralspatialresolutionsfortheintermediatedownscalingprocess. Theintermediatedownscalingprocessisequivalenttosupplementingthemodelwiththe landsurfaceinformationandreducingthedifferenceinspatialresolution,thusensuring thatthestatisticalregressionmodelvarieslesswiththespatialscale.
2.ResearchReview
Alotofresearchhasbeencarriedoutonlandsurfacetemperaturedownscalingby scholarsaroundtheworld.ThemainmethodsusedforLSTdownscalingcanbedividedinto twocategories:image-basedspatiotemporalfusionandkernel-drivendownscalingmethods.
Theimagefusionmethodobtainsahighspatialandtemporalresolutionlandofsurface temperaturebyconstructingamodeltogeneratefusedimages,basedonthecombined weightofspectral,temporalandspatialinformation,byselectingsimilarimagesinthe spatiotemporalneighborhoodtobefused.Unlikethestatisticaldownscalingmethod,the imagefusionmethoddoesnotdirectlymodeltherelationshipbetweenlandsurfacetemperatureandinfluencingparametersatlow-spatial-resolutionscales.Classical algorithmsareas follows.Wengetal.[22]improvedtheSTARFMmodel toestablishtherelationship between MODISandTMradiometricbrightnessbylinearspectralmixinganalysis,andproposeda spatiotemporaladaptivefusionalgorithm(SADFAT)forlandsurfacetemperaturedownscaling.Wuetal.[23]proposedaspatiotemporalintegratedtemperaturefusionmodel(STITFM) forestimatinghigh-spatiotemporal-resolutionLSTfrommulti-scalepolarandgeostationary orbitingsatelliteobservations.Theimagefusion-basedapproachesassumethattheradiative brightnessforsimilarpixelsbehavesconsistentlyatanyspatialresolution,whileinpractice, theradiativebrightnesswillinevitablyvaryinspaceandtime.So,thisapproachgenerally performspoorlyinurbanareaswithhigh-spatial-heterogeneitycharacteristics.
Kernel-drivendownscalingmethodscanbeclassifiedintophysicalmodelsandstatisticalregressionmethodsaccordingtowhetherthemodelisphysicallymeaningfulor not.PhysicaldownscalingmethodsestablishtherelationshipbetweenLSTandauxiliary databyusingthephysicalmechanismofamixturepixelandthethermalradiationprinciple.Inthisway,low-spatial-resolutionpixelsaredecomposedtomultiplesubpixelsto obtainthehigh-spatial-resolutionLST.Forexample,L.JandMoore[24]developedthe pixelblockintensitymodulation(PBIM)methodtoimprovethespatialinformationin thelow-spatial-resolutionthermalinfraredbandbyusingmultispectraldatawithahigh spatialresolution.Nichol[25]proposedtheemissivitymodulation(EM)modeltoimprove thespatialresolutionofthermalradiationbyusinglandsurfaceemissivityandlandcover data.Wangetal.[26]downscaledMODISLSTtoa30-mresolutionbasedonthethermal decompositionequation.However,thedesignofphysicalmodelsisusuallydifficultand themodelsarecomputationallycomplexandtime-consuming.
Thebasicprincipleofastatisticalregressionmethodistoassumethattherelationship betweenlandsurfacetemperatureanddrivingfactorsdoesnotchangewiththespatial scale.Astatisticalregressionmodelisbuiltusingthelow-spatial-resolutionLSTandthe drivers, afterwhichthehigh-spatial-resolutiondriversareaddedtothemodeltopredictthe high-spatial-resolutionLSTs.Uptonow,thestatisticalregressionmethodisthemostwidely usedmethodinLSTspatialdownscalingstudies.Basedonthenumberofdrivingfactors, statisticalregressionmethodscanbedividedintosingle-andmulti-factormodels.For example,DistradmodelsusedNDVIasthedriver[27],andtheTsHARPmodelused vegetationcoverinsteadofNDVI[28].Inaddition,Anthonyetal.[29]developedahigh-resolution urbanthermalfusion(HUTS)techniquetodownscaleLandsatTIRSto30mbasedonNDVI andsurfacealbedo.Lacerdaetal.[30]usedtheTsHARPmodelto downscaletheMODIS LSTtoahighspatialresolutionof10m.Vaculiketal.[31]downscaledthe GOES-RLST withtheresolutionof2000mto30mbyestablishingalinearrelationshipbetweenNDVI andLST.J.M.etal.[32]modifiedtheTsHARPalgorithmtodownscaleMODISLSTdata coveringoneSpanishfarm.However,single-factormodelsareonlyapplicabletoaregion withhighvegetationcover;theydonotperformwellinurbanoraridareas,limitedbythe predictorvariables.Multi-factormodelswithmultipleremote-sensingindicesandland surfaceparametersasdrivingfactorsweregraduallyproposedandapplied.Forexample, Liuetal.proposedtheG_DistradmodelbyaddingNDBIandNDWItothetraditional Distradmodel[14].Pereiraetal.[33]proposedageographicallyweightedregressionmodel (GWRK)byusingNDVIandmultispectraldatatodownscaletheASTERthermalinfrared dataforthenaturalregionsandurbanareasofPantanal,Brazil.Consideringthecomplex nonlinearrelationshipsbetweenlandsurfacetemperatureandvariousgeophysicalparametersinurbanareas[12,13],thethree-layerstructural(TLC)model[34],neuralnetwork[35], supportvectormachines[6],randomforests[36]andothermultivariatenonlinearstatistical modelshavebeencontinuouslydevelopedandappliedtourbanLSTdownscalingstudies.
RandomforestmodelshavebeenwidelyusedinurbanLSTdownscalingstudiesinrecent yearsbecauseoftheirlowmodelcomplexity,fasttrainingspeedandabilitytoeffectively avoidoverfittingproblems.Lietal.[36]comparedthreemachinelearningalgorithms, randomforest(RF),supportvectormachine(SVM)andartificialneuralnetwork(ANN),to thetraditionalTsHARPmethodinbothurbanandsuburbanareasofBeijing,andfound thattheLSTdownscalingaccuracyofthemachinelearningalgorithmwashigherthan thatoftheTsHARPalgorithm.Wangetal.[37]comparedthedownscalingresultsfrom amultiplelinearregressionmodel(MRL),TsHARPmodelandrandomforest(RF),and foundthattheRFmodelismoresuitableforheterogeneoussurfacessuchasurbanareas. Ebrahimyetal.[38]usedanadaptiverandomforestregressionmethodtodownscale MODISLSToverIranto30mintheGEEplatform.Njuketal.[39]proposedanimproved downscalingmethodforlow-resolutionthermaldatabasedonminimizingthespatial meanbiasofrandomforest,andtheresultsdemonstratedthatthemethodreducesthe inherentmeanbiasintheLSTdownscalingprocessandismoresuitableforLSTdownscalingapplicationsincomplexenvironments.Here,wecomprehensivelyanalyzedmost landsurfacetemperaturedownscalingmethodsandbuiltglobalmodelsandassumedthat thestatisticalrelationshipswerespatiallyinvariant,however,globalmodelsmayproduce largeerrorsinlocalareaapplications.Inrecentyears,manyscholarshavedevotedtheir worktousinglocalmodelstocapturethespatialnon-stationarycharacteristicsofland surfacevariables,andthenestablishedthelocalrelationshipsbetweenLSTandinfluencing factorstoimprovetheaccuracyofLSTdownscaling[15].
3.MaterialsandMethods
3.1.StudyArea
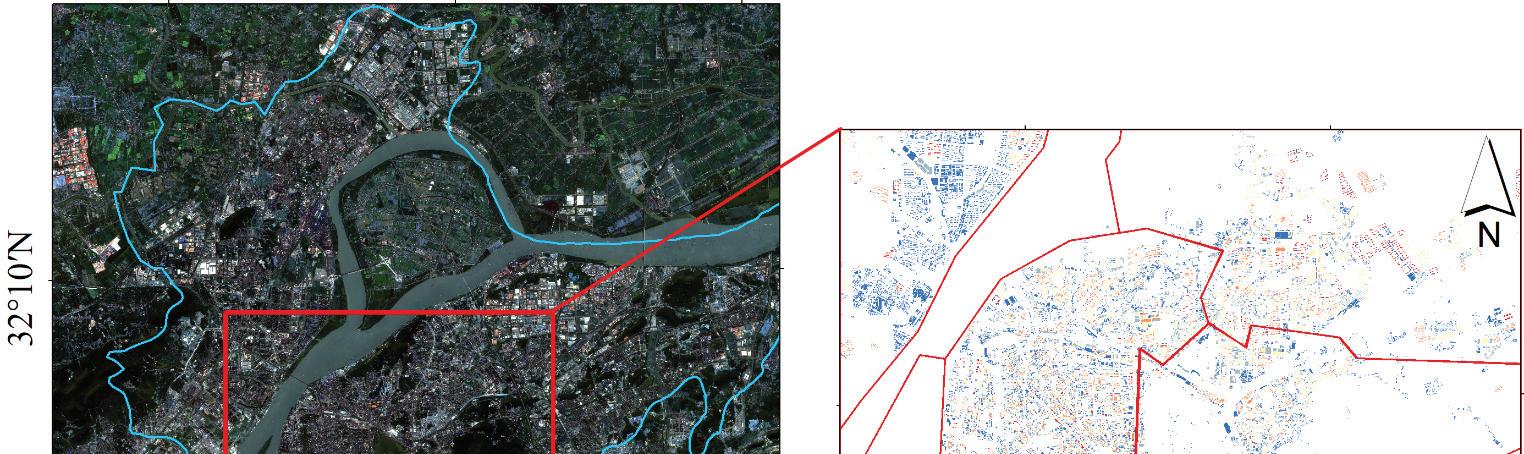
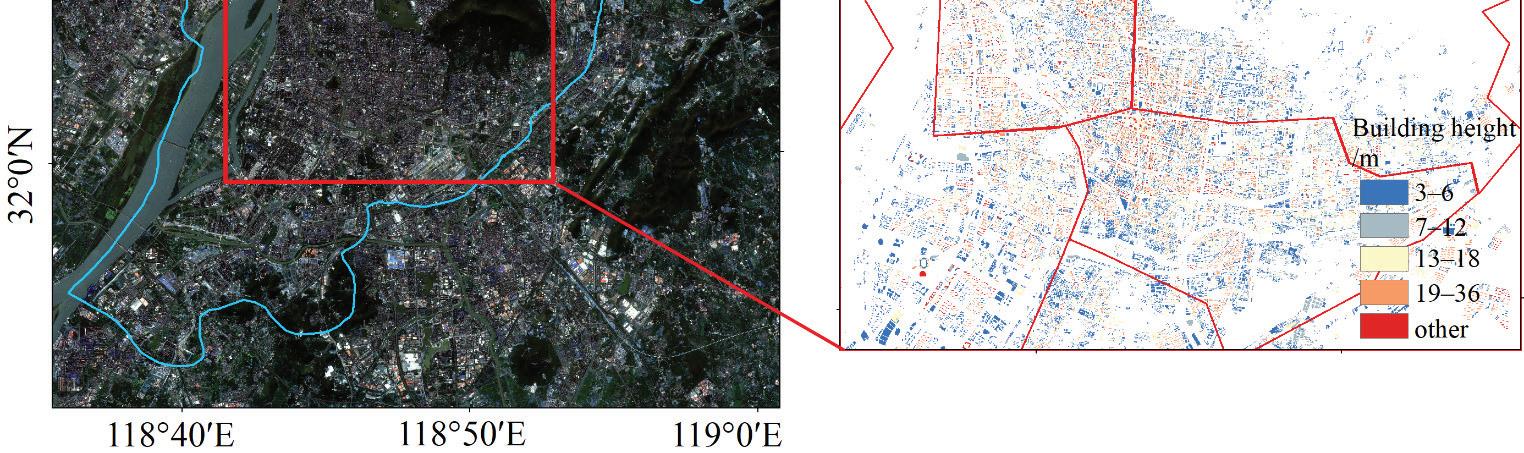
ThecentralurbanregionofNanjing,JiangsuProvince,Chinawaschosenasthestudy areabecauseitcontainsavarietyofunderlyingsurfacetypessuchasbuildings,vegetation andwaterbodies,whichhelpstocarryoutlandsurfacetemperaturedownscalingstudiesof complexgroundcovertypes.Figure 1 presentsatrue-colorimageandbuildingdistribution mapofthestudyareaataspatialresolutionof10m.
Figure1. Sentinel-2true-colorcompositeimageandbuildingdataofthestudyarea(blueline representsthemainurbanareaofNanjing;redlinesrepresentthestudyareaboundaries).
Thestudyareaincludesseveralurbanadministrativedistricts,includingtheQixia, Xuanwu,Gulou,QinhuaiandJianyeDistricts,withanareaofapproximately18 × 18km2 ThestudyareaislocatedinthecentralregionofthelowerYangtzeRiver,withgeographic coordinatesbetween31◦ 14 Nand32◦ 37 Nand118◦ 22 Eand119◦ 14”E.Thetotalbuilt-up areaisapproximately823km2 .Althoughthestudyareaisnearahillyarea,thetopography isflat,andtherearemanylowhillsandgentlehills.Nanjinghasahumidsubtropical climatewithfourdistinctseasons,abundantrainfallandsignificanttemperaturedifferences betweenwinterandsummer.Theaverageannualprecipitationis1106mm,andtheaverage annualtemperatureis15.4 ◦ C.Nanjinghadapopulationof10,312,200attheendof2019, witharesidentpopulationof8.5million,including7.072millioninurbanareas,andan urbanizationrateof83.2%.Nanjingisoneoftheeconomic-centercitiesinChina,witha regionalGDPof$1.6billionin2021.
3.2.Data
TheSentinel-3LSTproductata1000-mspatialresolutionfordownscalingand Sentinel-2 multispectralimagedataweredownloadedfromtheESAwebsite(https://scihub.copernicus. eu/dhus/#/home,accessedon14May2022).TheLandsatLSTproductata30-mspatial resolutionforvalidationofdownscalingresultswasdownloadedfromtheUSGSwebsite (https://earthexplorer.usgs.gov/,accessedon30December2021).Sentinel-2visiblelight andshortwaveinfraredbands(B2–B4,B8,B11andB12)wereusedtocalculatenormalized remote-sensingspectralindices.Nanjingdowntownbuildingandwinddatawereusedto calculateurbanspatialmorphologicalparameters.Nanjingwinddatafrom2016to2020 wereusedtocalculatethewinddirectionfrequency,whichweredownloadedfromthe ChinaAirQualityOnlineMonitoringandAnalysisPlatform(https://www.aqistudy.cn/ historydata/,accessedon14May2022).Thedetailsofallthedatainvolvedinthisstudy arepresentedasfollows.
3.2.1.LandsatLSTProduct
LandsatLSTproductsweregeneratedbyEROSbasedonasingle-channelinversion algorithm,byusingtheLandsatC2L1thermalinfraredbandandotherancillarydata[40,41]. LandsatLSTproductswereresampledfrom100to30mforreleasetousersbyEROSusing thenearest-neighborresamplingmethod.TheLandsatLSTimagesusedinthisstudywere imagedat10:37a.m.on4October2021,withorbitalrow/columnnumbers120/038[42].
3.2.2.Sentinel-3LSTProduct
TheSentinelseriesisanEarthobservationsatellitemissionoftheEuropeanCopernicus program.Sentinel-3carriesavarietyofpayloads,suchasOLCI(seaandlandcolorimeter) andSLSTR(seaandlandsurfacetemperatureradiometer),whicharemainlyusedfor high-precisionmeasurementsoftheseasurfacetopography,seaandsurfacetemperatures, oceanwatercolorandsoilproperties[43].Both3Aand3Bsatellitesinorbithaverevisit periodsoflessthanonedayforareaswithin30◦ latitudeoftheequator.SLSTRhassix solarreflectionbands(S1–S6)andfourthermalinfraredbands(S7–S9,F1,F2)withspatial resolutionsof500and1000m,respectively.TheSentinel-3LSTproductsareproduced byasplit-windowalgorithmusingthreebandsofS7–S9andotherauxiliarydata,and theproductsareaccurateto1K.TheLSTproductofSentinel-3BSLSTRwasselectedfor thisstudy,withanimagingtimeof10:04amon4October2021.TheSentinelLSTwas resampledtoaspatialresolutionof900mbyusingthebilinearinterpolationmethodfor downscalinginthisstudytomatchthereferenceLSTwithaspatialresolutionof30m.
3.2.3.Sentinel-2MultispectralData
Sentinel-2isamultispectralhigh-resolutionimagingsatellitewithtwosatellitesin orbit,2Aand2B,witharevisitperiodoffivedays[44].Eachsatellitecarriesamultispectral imager(MSI),whichcancover13spectralbandswithgroundresolutionsof10,20and 60mandanamplitudeof290km.Theblue,green,red,andnear-infraredbandsneededfor
thisstudyaretheB2,B3,B4andB8bandsoftheSentinel-2satellite,eachwitharesolution of10m.B11andB12areshortwaveinfraredbandswitharesolutionof20m,resampledto 10mtomatchthevisiblebands.
3.2.4.UrbanBuildingData
ThebuildingdatausedinthisstudywereprovidedbyUrbanDataCorps,obtainedin around2012.UrbanDataCorpsisrankedinthetop10inthebig-datafieldaccordingtothe 2017ChinaBigDataDevelopmentReportpublishedbytheNationalInformationCenterof China.UrbanDataCorpscanprovideavarietyofhigh-precisiondataforurbanresearch.
Thebuildingvectordatacontainthepolygonofthebuildingdistribution,building floordataandbuildingheightdatainashapefileformatwiththeWGS-84coordinate system.Comparingtheurbanbuildingdistributiondatawithsatelliteimagesin2012, wefoundthatthebuildinglocationandoutlinehighlyoverlapwiththesatelliteimages, andthebuildingfloornumberisalsoveryconsistentwiththefieldsurveyresults,which indicatesthehighaccuracyofthebuildingdistributiondata.Thefieldsurveyfoundthat thegroundcovertypesinmostofthestudyareas,suchasGulouDistrictandQinhuai District,didnotchangesignificantlybetween2012and2021,exceptforQixiaDistrict. Inthisstudy,thebuildingvectordataintheshapefileformatwerefirstlyconvertedto rasterdataintheTIFformatwithaspatialresolutionof10m.Afterthat,theurbanspatial morphologicalparameterswerecalculatedbasedonthebuildingrasterdataandother auxiliarydatausingcorrespondingformulas.
3.3.CalculationoftheDownscalingDrivingFactor
3.3.1.CalculationoftheRemote-SensingSpectralIndex
TheL2A-levelsurfacereflectancedatafromSentinel-2Bwereselectedforthisstudyto calculateremotelysensedspectralindicesthatarecloselyrelatedtosurfacetemperature, includingthemodifiednormalizeddifferencewaterindex(MNDWI),normalizeddifferencebuildingindex(NDBI),normalizeddifferencebuilt-upandsoilindex(NDBSI)[28], normalizeddifferencemoistureindex(NDMI),normalizeddifferencevegetationindex (NDVI)andsoiladjustedvegetationindex(SAVI).Thecalculationprocesswasperformed usingSNAP8.0,aprofessionalpieceofsoftwarefordata-processingintheSentinelseries. ThecalculationformulaisshowninTable 1
Table1. Remote-sensingspectralindicesrequiredfordownscalingandcalculationformulas.
Var.DescriptionEquations MNDWI Improvethenormalizeddifferencewaterbodyindextohighlightwater bodyinformation
NDBI Normalizethedifferencebuildingindextohighlightbuilding information
NDBSIIndicatethedegreeofdrynessofthegroundsurface[45]
NDMIIndicatethevegetationmoisture
NDVIHighlightvegetationinformation
SAVI Reducethesensitivityofvegetationindicestochangesinreflectanceof differentsoils
Notes: ρ1–ρ12denotethesurfacereflectanceofSentinel-2bands1–12.
3.3.2.CalculationofUrbanSpatialMorphologicalParameters
ThebuildingvectordataofNanjingwereconvertedtorasterdatawitha10-mresolutiontocalculateurbanspatialmorphologicalparametersincludingthebuildingdensity (BD),frontalareadensity(FAD),floorarearatio(FAR),meanheight(MH)andskyview
2022, 14,3038
factor(SVF).TheSVFwascalculatedbytherasteralgorithm.Theinfluenceofbuildings withinaradiusof100mwasconsideredwhencalculatingtheSVFofeachpixel.FADwas calculatedusingthebuildingrasterdataandthewinddirectionfrequencydatabyaselfdevelopedrasteralgorithmwithaplotareaof100 × 100m2 .Otherspatialmorphological parameters,suchasBD,FARandMH,werecalculatedusing10-mbuildingrasterdataand thecorrespondingequationsinTable 2 withaplotareaof100 × 100m2 .
Table2. UrbanspatialmorphologicalparametersrequiredforLSTdownscaling.
Var.DescriptionEquations
BDBuildingDensity
FADFrontalAreaDensity
= ∑ n
Ai A T Aiindicatesthe ithbuildingareaandATindicatesthecalculatedplotarea
λf(z) indicatestheweightedfrontalareadensity(FAD); A ( θ ) proj ( z ) indicatestheprojectedareaatacertainheight z inthewinddirection θ, Pθ ,i indicatesthefrequencyofthewinddirection θ , i =1,...,16
FARFloorAreaRatio FAR = ∑ n i 1 Fi × Ai A T Fi indicatesthei thbuildingfloornumberand A i indicatesthe ithbuildingarea
MHMeanHeight
MH = ∑ n i 1 Hi n
Hi indicatesthe ithbuildingheightand n indicatesthenumberofbuildings
SVFSkyViewFactor Ψ sky = 1 360/ α ∑ i =1 sin2 β × ( α /360) β = tan 1 ( H / X )
ψsky indicatesSVF, β indicatesthebuildingheightangle, H indicatesthebuilding height, X indicatesthecalculatedradiusandissetto100minthisstudy
Note:ExceptforSVF,theplotareaATcalculatedbyallotherparameterstakesthevalueof100 × 100m.
3.4.DownscalingLSTMethodBasedonRandomForest
Thecoreideaofsurfacetemperaturedownscalingistheinvarianceoftherelationship betweenLSTanddrivingfactorsatdifferentspatialresolutionssothatthestatistical relationshipbetweenLSTandtheregressionkernelatalowresolutioncanbeappliedto ahighspatialresolutiontocompletethedownscalingprocess.Thespecificformulasare asfollows:
where varc denotesthelow-resolutionexplanatoryvariable, varf denotesthehigh-resolution explanatoryvariable, Tc denotesthelow-resolutionLST, Tc ’denotesthepredictedlowresolutionLST, Δ T denotesthesimulationresidualand Tf ’denotesthepredictedhighresolutionLST.
ThisstudyusedtherandomforestalgorithmtoconstructtheLSTdownscalingmodel. Randomforestisanintegrateddecisiontree-basedlearningalgorithmproposedbyBreiman in2001asasupervisedlearningalgorithm[32].Thealgorithmusesthebootstrapresamplingmethodtorandomlyselectsamplesfromthetrainingsampleset.Theextracted bootstrapsamplesaretrainedseparatelyforeachdecisiontree,andanalgorithmforrandomlyselectingasubsetoffeaturesisintroducedintheprocessofsplittingthenodesof thedecisiontree.Thepredictionresultsofeachdecisiontreearecountedandvotedon toobtainthefinalpredictionresultsoftheinputdata.Therandomforestalgorithmhas strongernoiseimmunitythanotheralgorithmsbecauseoftheintroductionofrandomly selectedtrainingsamplesandrandomlyselectedfeaturesubsetsthatmakethecorrelation
amongeachdecisiontreesmaller.Therandomforestalgorithmisbetterathandlingnonlinearproblemsthantraditionalstatisticalregressionalgorithms.Aslongasthenumberof decisiontreesissufficient,therandomforestalgorithmcaneffectivelyavoidtheoverfitting problem,andthetrainingspeedisfaster.Therandomforestalgorithmcanexaminethe interactionbetweenfeaturesduringthetrainingprocessandoutputthefeatureimportance, whichisareferenceforanalyzingthedegreeofinfluenceoffeatures.Inthisstudy,the experimentaldatasetwasdividedintotrainingandvalidationdatasetsaccordingtothe ratioof8:2.Themainparametersthatneedtobesetmanuallytobuildarandomforest downscalingmodelusingthePycharmplatformincludethenumberofdecisiontrees (n_estimators)andthemaximumnumberoffeatures(max_features).n_estimatorsrefersto thenumberofdecisiontreesbuiltintherandomforest,whichwassetto700aftertestingin thisstudy.max_featurereferstothemaximumnumberoffeaturesselectedwhenbuilding eachdecisiontree,whichwassettolog(n_estimators)inthisstudy.Otherparameterswere settodefaultvalues.
3.5.Step-By-StepRandomForestDownscalingMethod(SSRFD)
Whenthespatialresolutionspansalargerrange,thedownscalingresultscannot accuratelycharacterizethespatialdistributionofLST,whichtendstounderestimatethe surfacetemperatureinbuildingareasandoverestimateitforwaterbodiesandvegetated areas.Thisstudyproposedastep-by-stepdownscalingLSTmethodbasedontherandom forestmodel(SSRFD),whichachievesasignificantincreaseinthespatialresolutionof LSTwithoutexcessivelossofaccuracythroughmultiple,small-scalespatialresolution downscalingprocesses.DuringtheSSRFDmodel’swork,eachintermediatedownscaling addsadditionalandfinersurfaceinformationtothemodel.Inthisway,modelsaretrained toaccuratelyexpresstherelationshipbetweenlandsurfacetemperatureanddrivingfactors.
Inthisstudy,thedirectrandomforestdownscaling(DRFD)methodwasperformedto directlydownscale900-mSentinel-3LSTtoa30-mresolution,andthentwodownscaling methodswereconductedusingtheproposedSSRFDmethod.Thefirstmethod,named SSRFD,downscaledthe900-mSentinel-3LSTto30mafter450mand150msequentially, wheretheSSRFDwasdrivenbythesixremote-sensingindicesmentionedabove.Thesecondmethod,namedSSRFD-M,downscaled900-mSentinel-3LSTto30mbythesame processthroughSSRFD,wherefiveadditionalurbanspatialmorphologicalparameters wereaddedastheSSRFDdriverfactors.Afterthat,LSTdownscalingresultsofDRFD, SSRFDandSSRFD-Mwerecomparedata30-mspatialresolution,whichwereallevaluatedbyusingthe30-mLandsat-8LSTasthereference.Moreover,theinfluenceofurban spatialmorphologicalparametersonLSTwasanalyzedbasedonSSRFD-Mata30-m spatialresolution.
3.6.AccuracyEvaluationMethods
Pearson’scorrelationcoefficient(r),themeanabsoluteerror(MAE)androotmean squareerror(RMSE)wereusedtocomprehensivelyevaluatethedownscalingresults. Meanwhile,themaximum/minimum,mean(Mean)andstandarddeviation(SD)were calculatedtoevaluatethespatialvariabilitycharacteristicsofLSTimagesbeforeandafter downscaling.TheSDcanreflectthespatialvariabilityofthermalfeatures.
4.Results
4.1.ComparisonoftheResultsObtainedwithSSRFDandDRFD ToreducedatadifferencescausedbydifferentsensorsandLSTinversionalgorithms andincreasethecomparabilityandverifiabilitybetweenLandsat-8andSentinel-3LST products,asimplelinearcorrectionwasappliedtoSentinel-3LSTbeforethedownscaling work.Afterperformingthelinearitycorrection,themaximum,minimumandmeanvalues ofSentinel-3LSTchangedfrom38.80,27.57and35.18 ◦ Cto41.25,30.84and37.90 ◦ C, respectively,whichwereclosertoLandsatLSTintherangeofvalues.TheRMSEofthe
twoLSTproductschangedfrom3.22to1.59 ◦ C,indicatingthatthesystematicdifferences betweenSentinel-3LSTandLandsatLSTwerereducedtosomeextent.
ComparativeplotsofthedownscalingresultsaregiveninFigure 2,wherethe900-m Sentinel-3LSTwasdownscaledto30musingtheDRFDmethodandSSRFDmethod.ComparingFigure 2b,cwithFigure 2a,bothresultscapturedfinerspatialdiscrepancycharacteristicsandtexturefeatures,andtheresultingLSTdistributionisbasicallyconsistentwith LandsatLST.However,accordingtoFigure 2b,therearelargeareasofhigh-temperature regionsinthestudyarea.TheresultsobtainedwithDRFDasawholearesignificantly overestimated.Forexample,theregionsalongthenorthwesterncoastoftheYangtze River,XuanwuLakeandZijinshanMountainshowobvioustemperatureoverestimation errors.Thedifferencecharacteristicsbetweenthehigh-temperatureregionandthesub-hightemperatureregionarelessclearlyexpressedthanLandsatLSTinFigure 2a.Incontrastto Figure 2b,theresultsobtainedwithSSRFD(Figure 2c)capturedthespatialdistribution differencesandtexturalcharacteristicsmoreaccurately.Thedistributioncharacteristicsof boththebuildinghigh-temperaturezoneandthewaterandvegetationlow-temperature zoneareingoodagreementwithFigure 2a.Overall,theresultsobtainedwithDRFDshow anoverallunderestimationofthehigh-temperatureregionandanoverestimationofthe low-temperatureregion,whichcannotaccuratelydepictthespatialdistributionpatternof LSTinthestudyarea.

Figure2. SpatialdistributionofLSTat30-mspatialresolution.(a)LandsatreferenceLST.(b)DownscaledLSTresultsofDRFD.(c)DownscaledLSTresultsofSSRFD.
Thestatistics(Table 3)showthattheresultsfromDRFD,withanSDof2.64,are0.82 lowerthanLandsatLST,buttheirmeanvalueis1.41 ◦ ChigherthanLandsatLST.Thisis consistentwiththeperformanceoftheDRFDresultsinFigure 2b,whichfurtherillustrates theoverallhighsurfacetemperaturepredictedbyDRFD.Incomparison,themaximum, meanandSDoftheresultsfromSSRFDare50.76,36.78and3.73 ◦ C,respectively,which onlydifferfromthecorrespondingindexofLandsatLSTbyapproximately0.3 ◦ C.In summary,thedownscalingresultsofSSRFDaremoreaccurate,whichisalsodemonstrated inFigure 3
Table3. StatisticalvaluesofLSTdownscaledfromDRFD,SSRFDmethodsandLandsatreference LSTdataata30-mresolution.
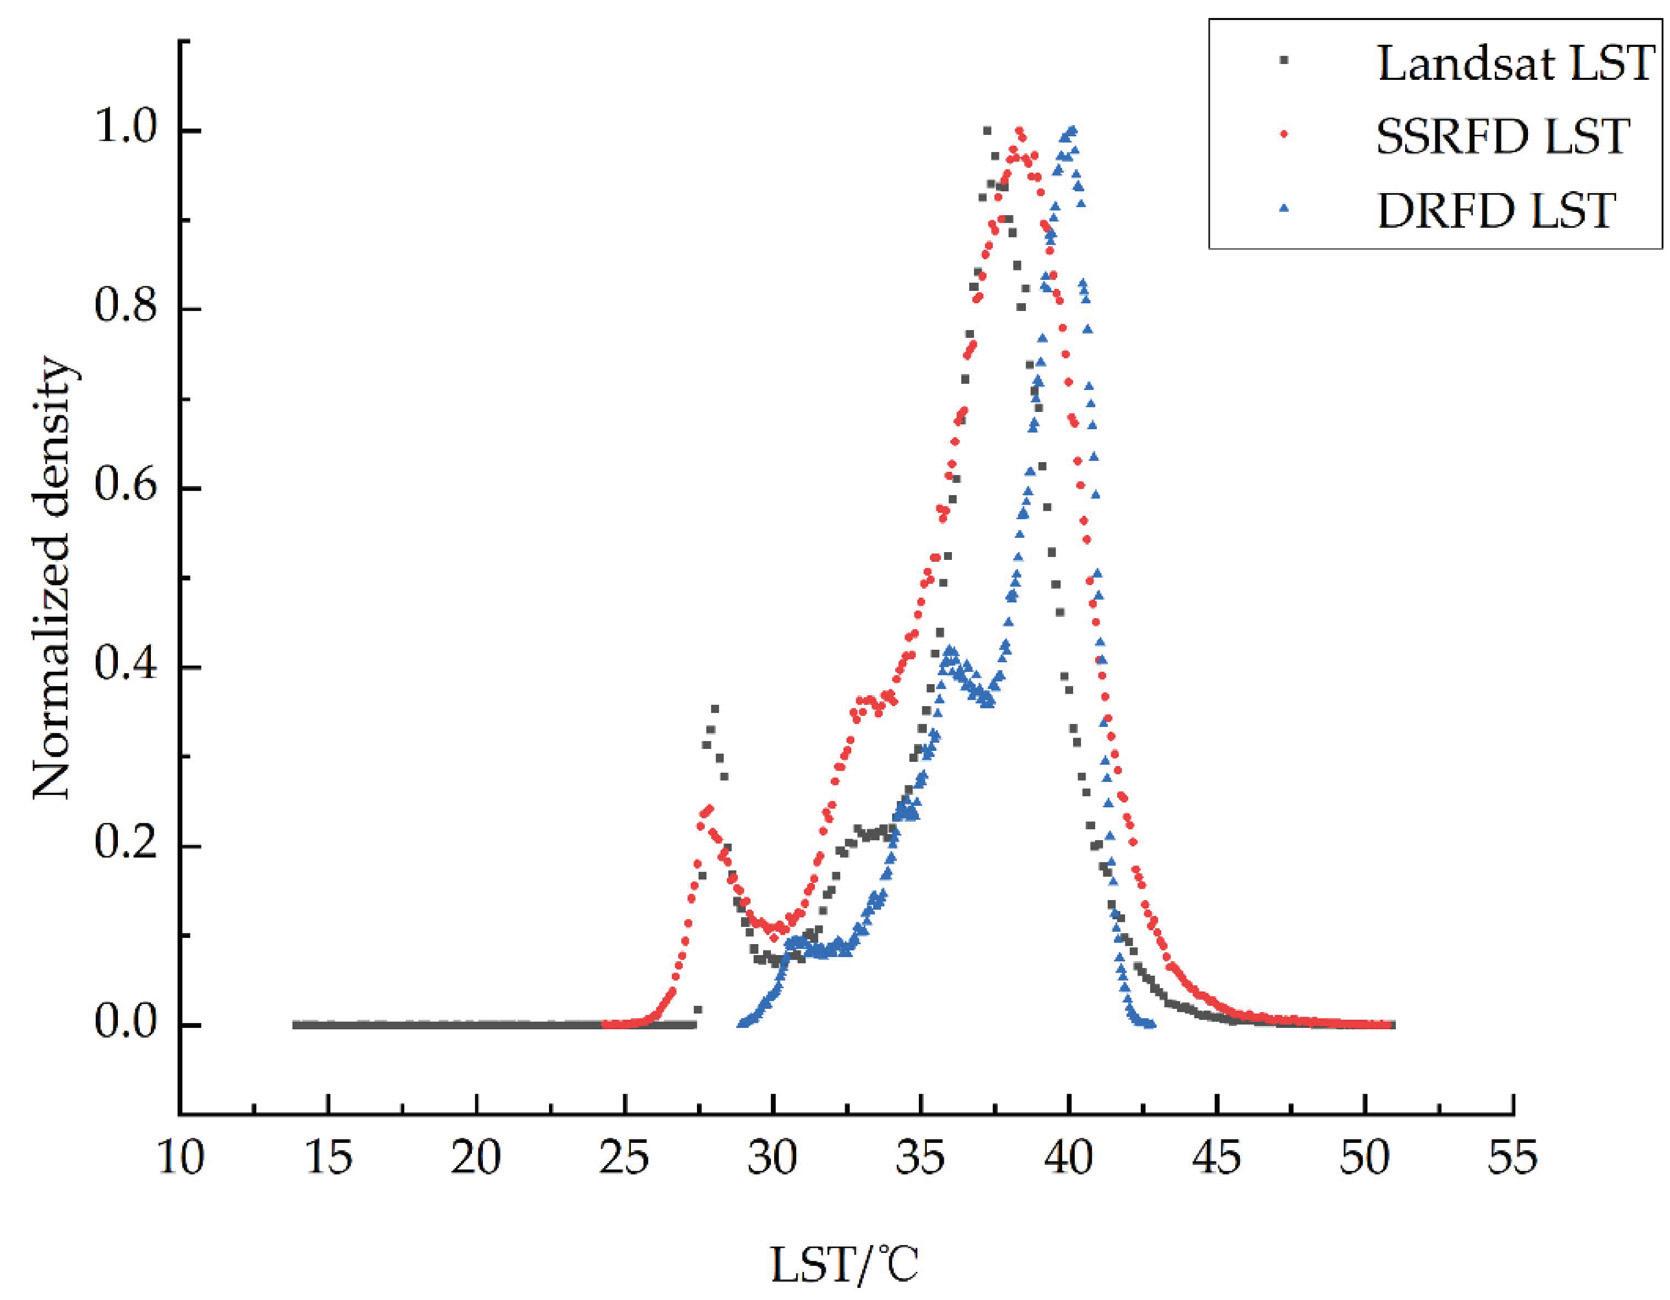
Figure3. HistogramofdownscaledLSTandLandsatLSTat30-mresolution(blackcubesreferto LandsatLST,redcirclesrefertodownscaledLSTobtainedbytheSSRFDmethod,bluetrianglesrefer todownscaledLSTobtainedbytheDRFDmethod).
AccordingtoFigure 3,ThehistogramcurvesofSSRFDresultsfitbetterwiththatofthe LandsatLST,astheybothhaveclear“peak”valuesbetween27.5–29and37–39 ◦ C,which indicatesthattheSSRFDresultsarereasonableoverall.TheDRFDresultsdiffersignificantly fromtheLandsatLSTintermsofhistogramshapecharacteristics,datadistributioninterval anddatavaluerange,e.g.,the“peaks”oftheresultsfromDRFDaredistributedbetween 40and41 ◦ C.Overall,Figure 3 showsthatthedensetemperatureintervaloftheimage elementdistributionofDRFDishigherthanthatofSSRFDLSTandLandsatLST. Furthermore,thecorrespondingscatterplotsofthetwodownscalingresultsfrom SSRFDandDRFDwithLandsatLSTaregiveninFigure 4a,b,respectively.Accordingto Figure 4,thecorrelationrvaluebetweentheDRFDresultsandLandsatLSTis0.6,while theSSRFDresultsimprovethisto0.81.TheMAEandRMSEvaluesoftheDRFDresultsare 2and2.6 ◦ C,respectively,whiletheSSRFDresultsdecreaseto1and1.66 ◦ C,respectively. ThisindicatesthatusingtheSSRFDmethodcanobtainahigher-accuracyLSTthanthe DRFDmethodwhenthespatialresolutionspansalargerange.


(a) (b)
Figure4. ScatterplotsofthecorrelationanalysisbetweendownscaledLSTandLandsatreferenceLST ata30-mresolution.(a)DownscaledLSTofSentinel-3fromDRFDmethod.(b)DownscaledLSTof Sentinel-3fromSSRFDmethod.
4.2.InfluenceofUrbanSpatialMorphologicalParametersonDownscalingLST
4.2.1.AnalysisoftheOverallDownscalingResultsintheStudyArea
ToevaluatetheinfluenceofurbanspatialmorphologicalparametersonLSTdownscaling,thefivespatialmorphologicalparameterscalculatedinTable 2 wereintroduced intothedrivingfactorsofSSRFDtodownscaleSentinel-3LSTfromaspatialresolutionof 900to30m.ThedownscalingresultswerealsovalidatedbyLandsatLST.
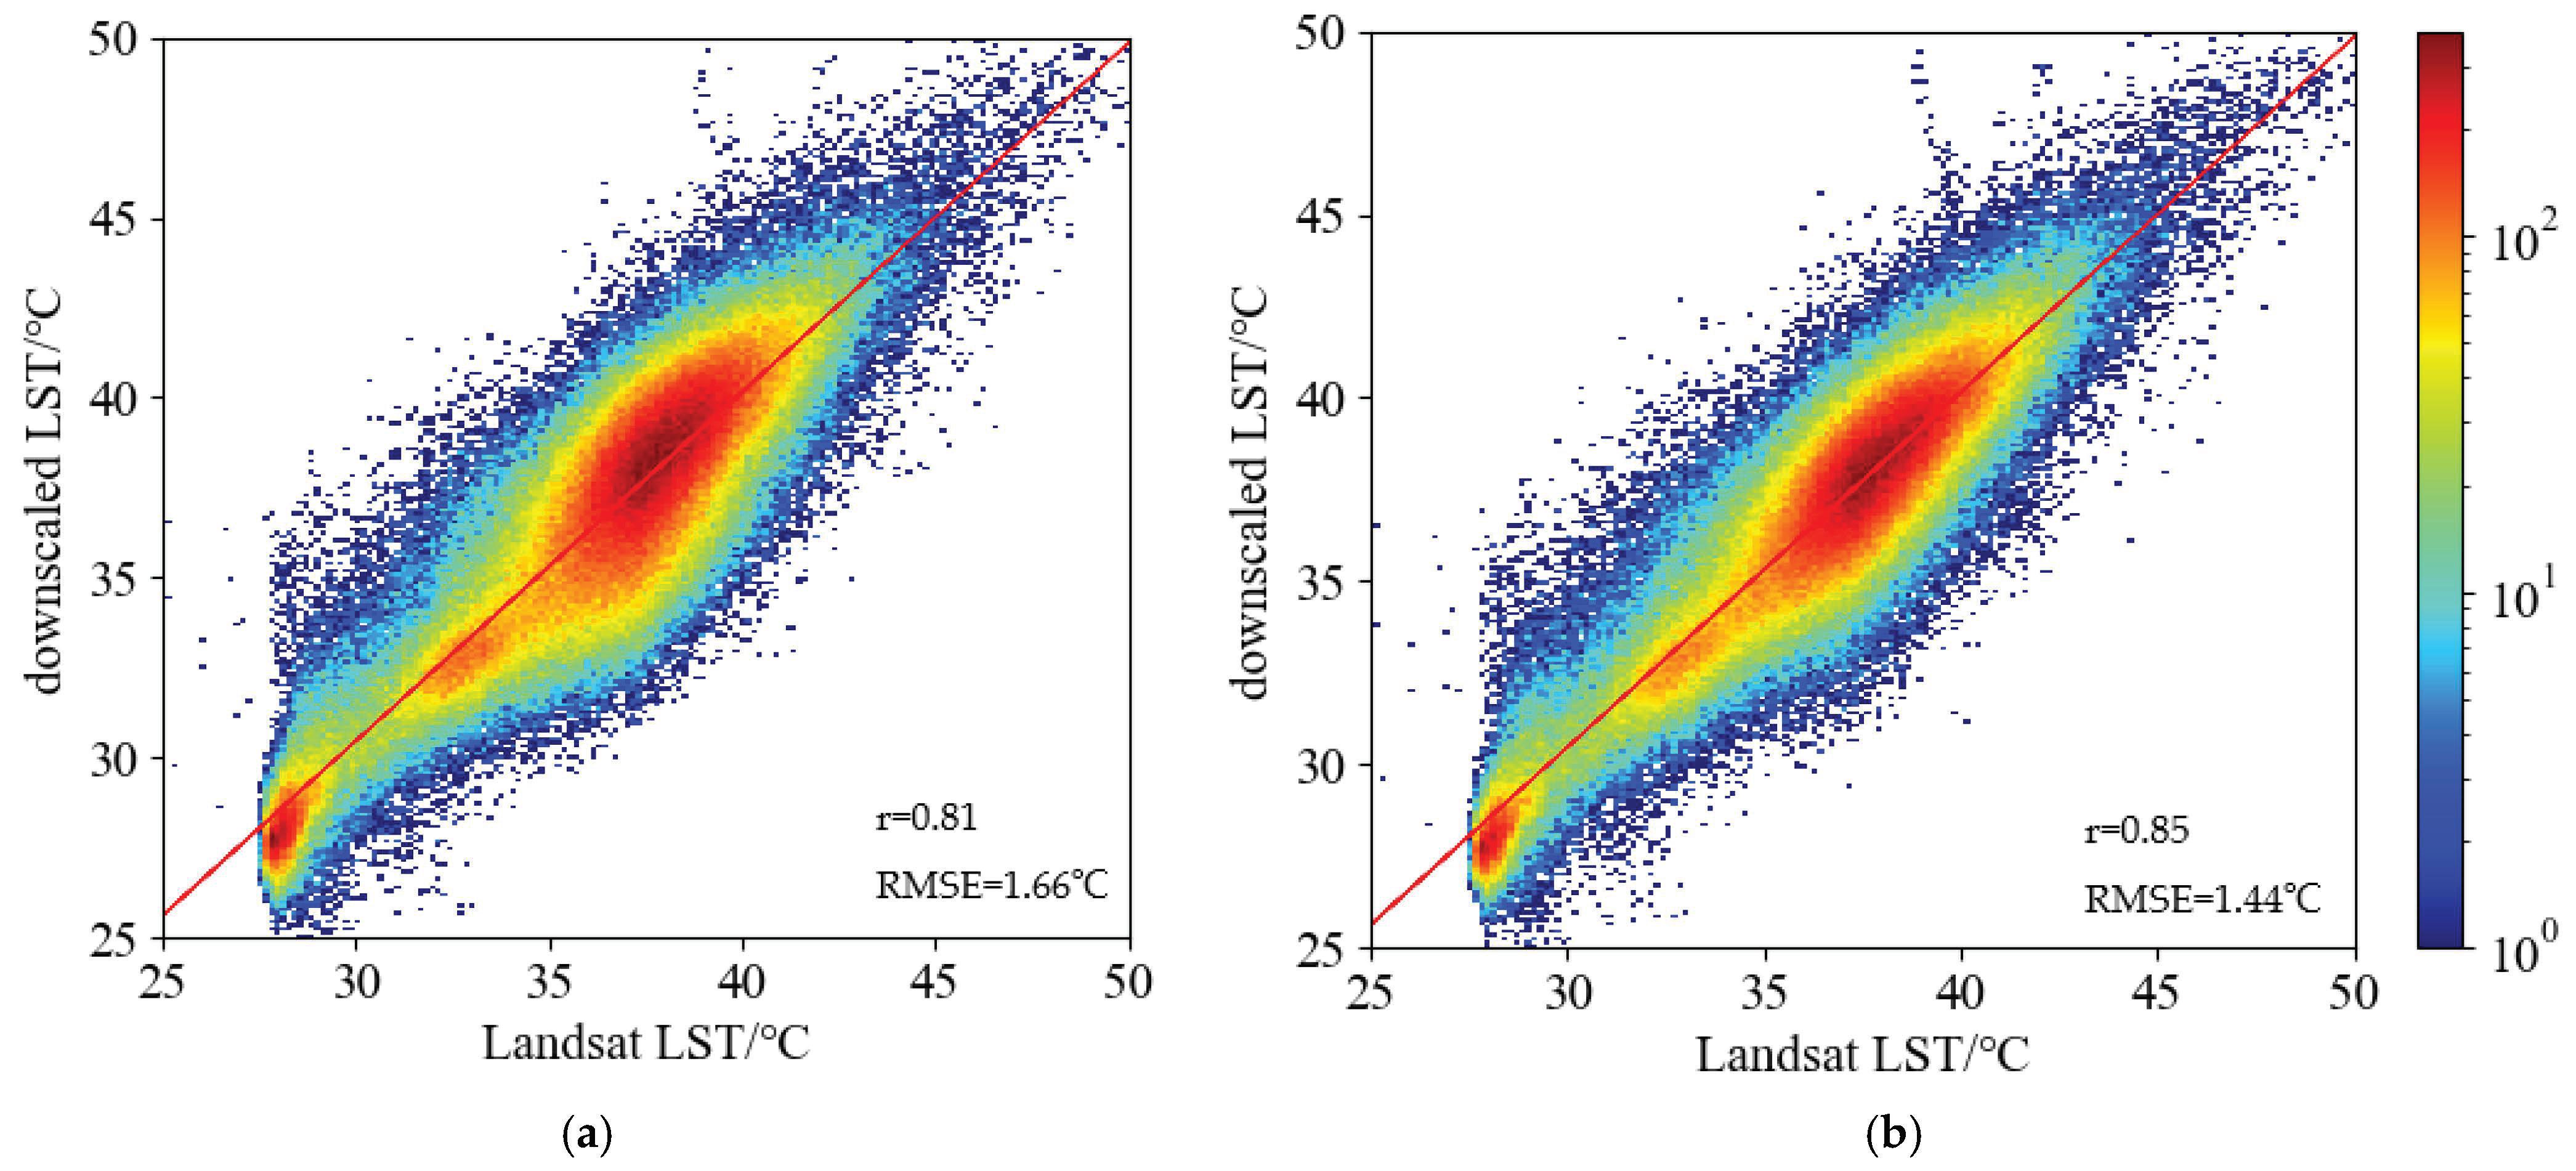
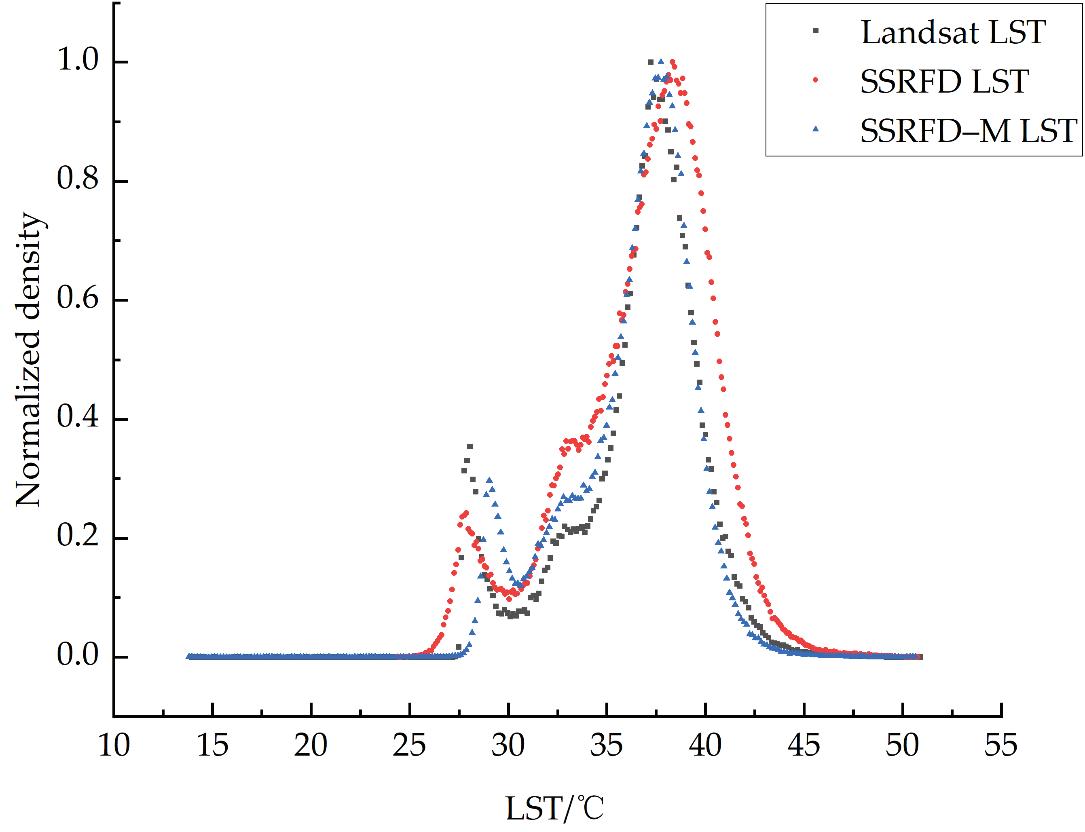
Figure 5a,bshowsthecorrelationplotsofLandsatLSTwiththeresultsfromSSRFD andSSRFD-M,respectively,ata30-mspatialresolution,whererimprovesfrom0.81to0.85 andRMSEdecreasesfrom1.66to1.44 ◦ Cafteraddingthespatialmorphologicalparameters. ThestatisticalhistogramsofLandsatLSTanddownscalingresultsaregiveninFigure 6. ComparedtotheSSRFDresult,SSRFD-MismorematchedwithLandsatLSTindistribution shape,especiallybetween35and40 ◦ Cwherebuildingsandconcretepavementsaremainly distributed.Otherwise,thefeatureswithtemperaturesbetween28and35 ◦ Caremainly vegetationandwaterbodies.Thecurvesofthetwodownscalingresultsinthisinterval arehigherthanLandsatLST,indicatingthattheremaybesomeLSToverestimationin downscalingresultsforvegetationandwaterbodyareas.Combinedwiththeanalysisof Figure 5,weconcludethattheSSRFD-MmodelperformsbetterthanSSRFD,especiallyfor densebuildingareas.
Figure5. ScatterplotsofthecorrelationanalysisbetweendownscaledLSTandLandsatLSTonthe overallregionata30-mresolution.(a)SSRFDresult.(b)SSRFD-Mresult.
Figure6. HistogramofdownscaledLSTandLandsatLSTata30-mresolution(blackcubesreferto LandsatLST,redcirclesrefertotheSSRFDresultsandbluetrianglesrefertotheSSRFD-Mresults).
4.2.2.AnalysisofRegionalDownscalingResultsintheStudyArea
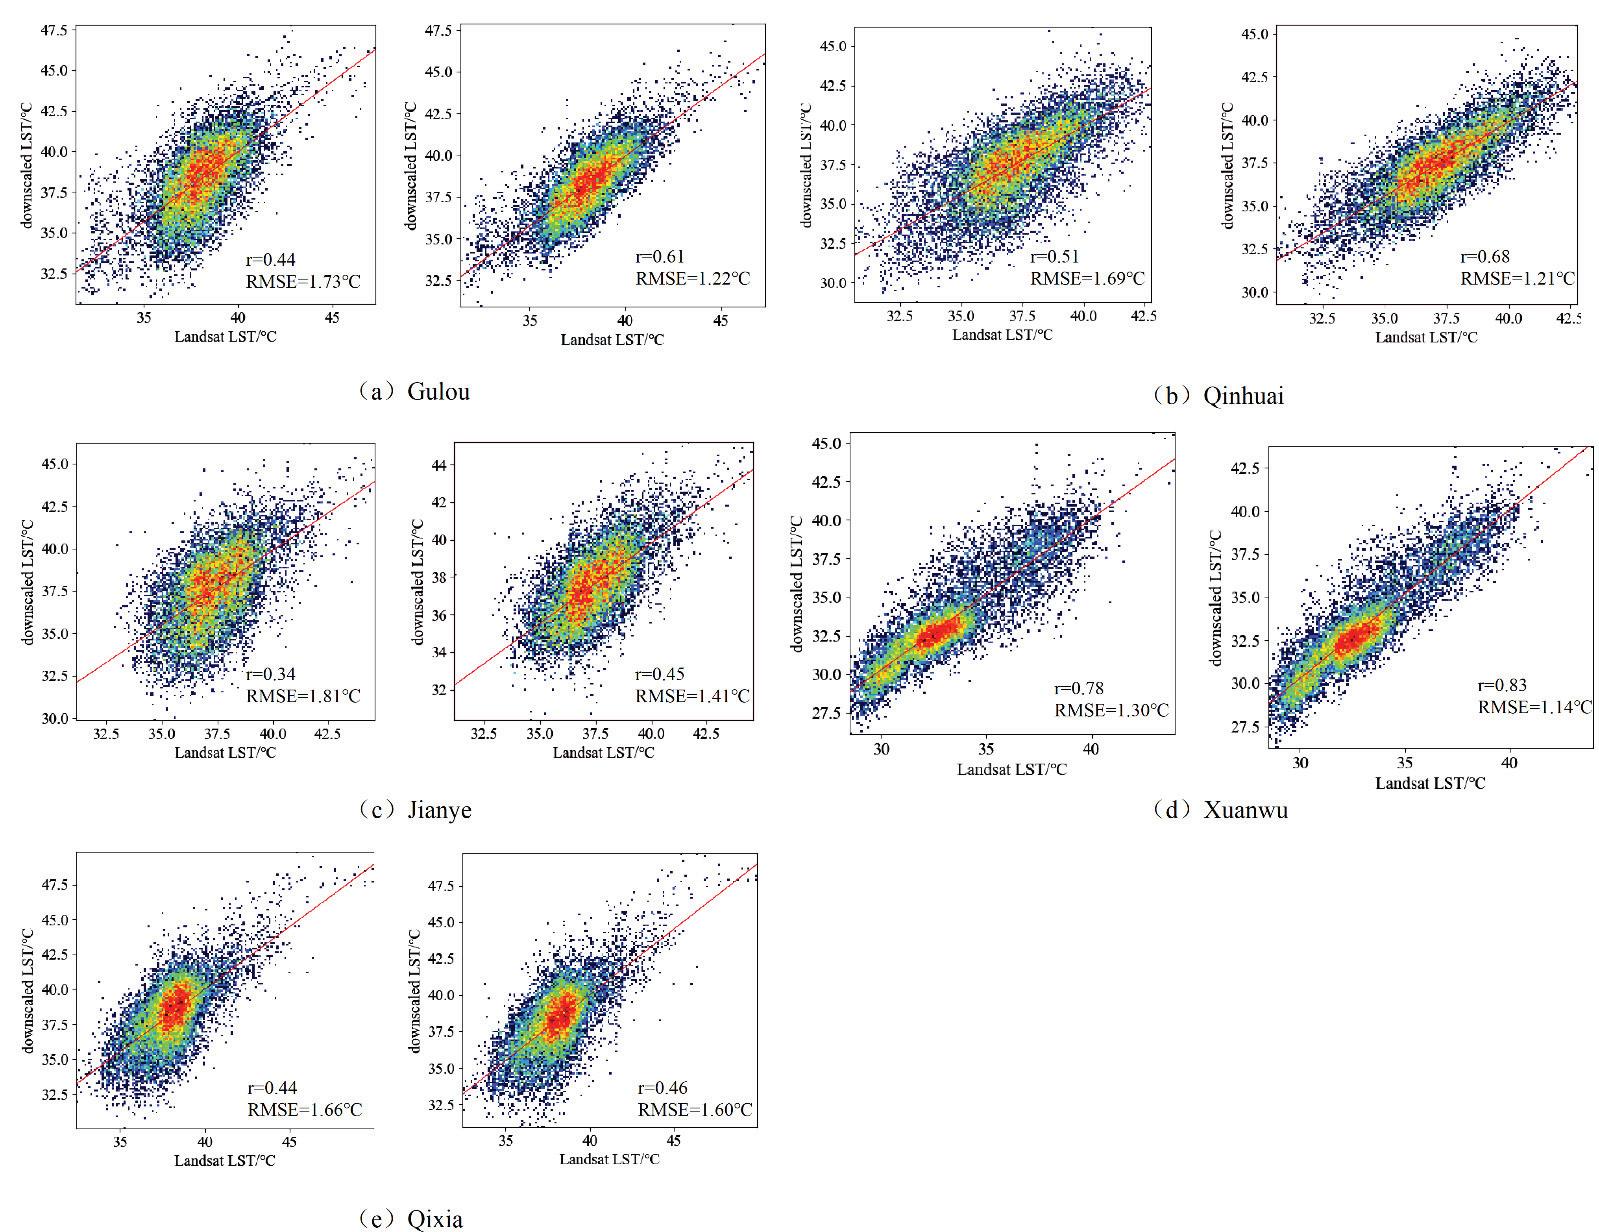
InSection 4.2.1,wefoundthatthespatialmorphologicalparametershavesome favorableeffectsontheLSTdownscaling,especiallyforbuildingareas.However,we remainedunawareofhowtheurbanspatialmorphologicalparametersaffecttheLST downscalingresultsfordifferentlocationswithinthestudy.Inthissection,weintend todiscussthedownscalingresultsforfivesubregionsata30-mresolutiontofurther analyzetheroleofurbanspatialmorphologicalparametersinthedownscalingprocess. ThedistributionofcorrelationsbetweenthedownscalingresultsandLandsatLSTfor fivesubdistricts,Qixia,Gulou,Xuanwu,QinhuaiandJianye,aregiveninFigure 7.The influenceofurbanspatialmorphologicalfeaturesonLSTdownscalingcanbefurther verifiedbecauseofthecomplexityoftheurbangroundcovertypesconsidered.
Figure7. ScatterplotofcorrelationanalysisbetweendownscaledLSTandLandsatLSTataspatial resolutionof30m(downscaledLSTsobtainedfromSSRFDandSSRFD-Mcorrespondtotheleftand rightpanelsin a–e).
Figure 7a–cshowsthatthervalueoftheSSRFD-MdownscalingresultsfortheGulou, QinhuaiandJianyeDistrictsimprovesfrom0.44,0.51and0.34to0.61,0.68and0.45,respectively,whiletheRMSEvaluedecreasesfrom1.73,1.69and1.81 ◦ Cto1.22,1.21and 1.41 ◦ C,respectively.Accordingtothestatisticalanalysisofdifferentareas,allthreeareas arelocatedinadenseareaofmiddle-risebuildings[33],wherebuildingsandimpervious surfacesdominateandthevegetationdistributionisrelativelylowandsparse.There-
fore,theLSTdistributioniscloselyrelatedtothespatialmorphologicalcharacteristicsof buildings.ThesefiguresallexhibitthatthedownscalingresultsofSSRFDunderestimated theLSTforsomeregionsbetween35and40 ◦ C.AccordingtoFigure 7d,randRMSE valueschangedfrom0.78and1.30 ◦ Cto0.83and1.14 ◦ Cbeforeandafterconsidering spatialmorphologicalparametersinXuanwuDistrict,respectively,withaslightlysmaller improvementinaccuracyrelativetotheGulouandQinhuaiDistricts.Statistically,among theXuanwuDistrictcoveredbythestudyarea,non-built-upareassuchasZhongShan ScenicAreaandXuanwuLakeaccountforapproximately50%ofthedistrict.Therefore, theinclusionofspatialmorphologicalparametershaslessinfluenceonthedownscaling resultsoftheseareas.IfthedownscalingresultsofbuildingareasinXuanwuDistrictare countedseparately,theRMSEofSSRFD-Mdecreasesfrom1.96to1.17 ◦ Ccomparedto theSSRFDresults,whichprovesthatSSRFD-Mcaneffectivelyimprovethedownscaling effectindensebuildingareas.Figure 7eindicatesthattheSSRFD-MresultsforQixia onlyimproved/decreasedrandRMSEvaluesby0.02/0.06 ◦ C,respectively,comparedto SSRFD.ThereasonforthisismainlythedifferenceinyearsbetweenSentinel-3LSTdata andbuildingdata.ThetypeoflandsurfacecoverinsomeregionsofQixiahaschanged significantly.Forexample,theeasternsideofNingluoExpresswayandthenorthernsideof QixiaAvenuehavechangedfromnaturalsurfacestobuildingandroadtypes.Thebuilding datausedcannotaccuratelyexpressthespatialmorphologicalcharacteristicsoftheseareas andcannoteffectivelyimprovetheaccuracyofLSTdownscaling.Inaddition,wefound thataspatialresolutionof30mmaynotbesufficienttoshowthesurfacetemperature distributionpatterninsidecomplexbuildingareas.
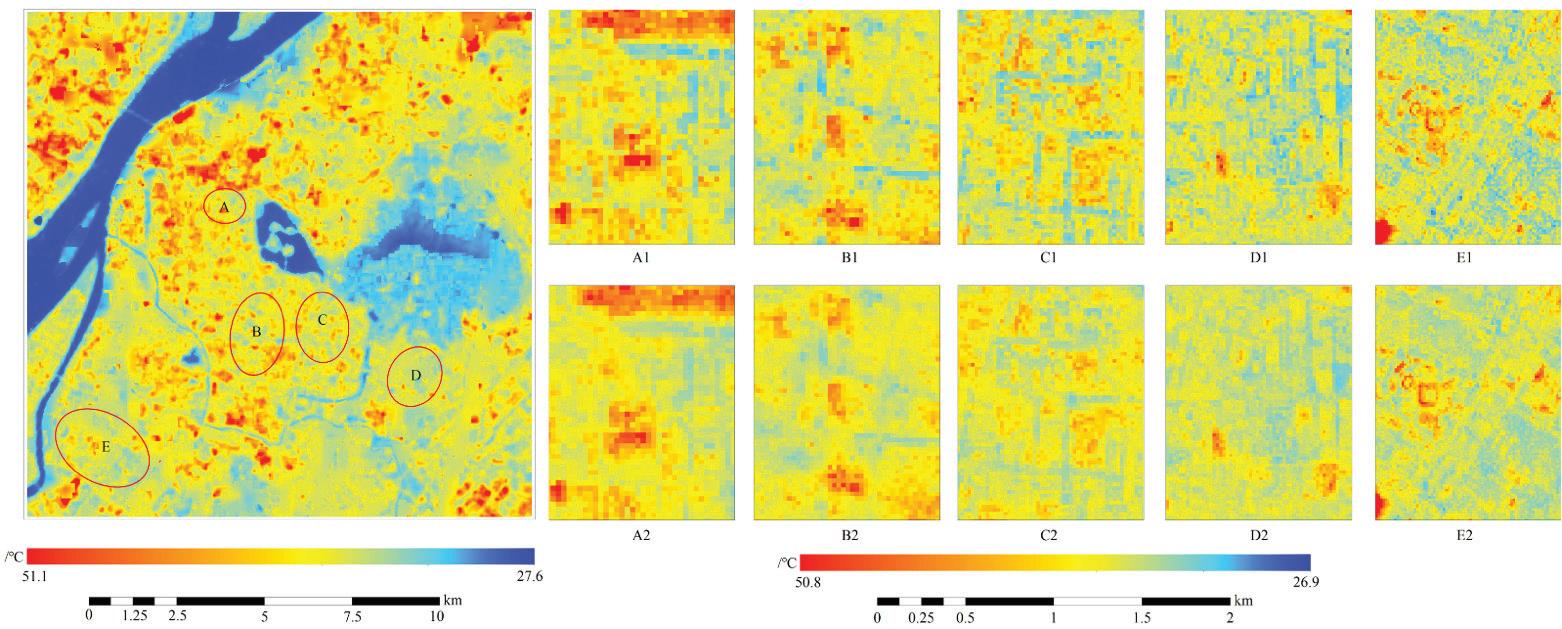
Wefurtherselectedfivebuilding-denseareasnearthewesternsideofXuanwuLake, Xinjiekou,NanjingMuseum,NanjingForestryUniversityandtheOlympicSportsCenter, fordownscalingresultscomparison,asshownbyA,B,C,DandEinFigure 8a,respectively. Acomparativeanalysisofthedownscalingresultswithandwithoutincludingspatial morphologicalparameterswascarriedout,andtheresultsareshowninFigure 8b.When comparingthelocaldownscalingresultsofSSRFDwithSSRFD-M,itcanbefoundthat theregionalLSTofthevegetation-coveredregionsinthebuilt-upareachangedafter consideringthespatialmorphologicalparameters.AccordingtotheSSRFDresultsof A1–E1,vegetation-coveredareasnearbuildings,suchasstreetsplantedwithtreesand flowerbeds,showedaclearlow-temperaturezone(approximately30–33 ◦ C),whichwas5–8 ◦ Clowerthanthesurfacetemperatureofnearbybuildingareas(approximately 35–40 ◦ C). Incontrast,thetemperatureinthecorrespondingregionsillustratedbyA2–E2wasonly approximately3–5 ◦ Clowerthanthatofthenearbybuildings.Noobviouslow-temperature regionsappearedinA2–E2,whichweremoreconsistentwiththeLandsatLST.Therefore, thisstudyinfersthattheunderestimationofLSTgeneratedbytheSSRFDusingonly remote-sensingspectralindiceswaspartiallyeliminatedinSSRFD-M.
4.3.ParameterImportanceAnalysisofLSTDownscaling
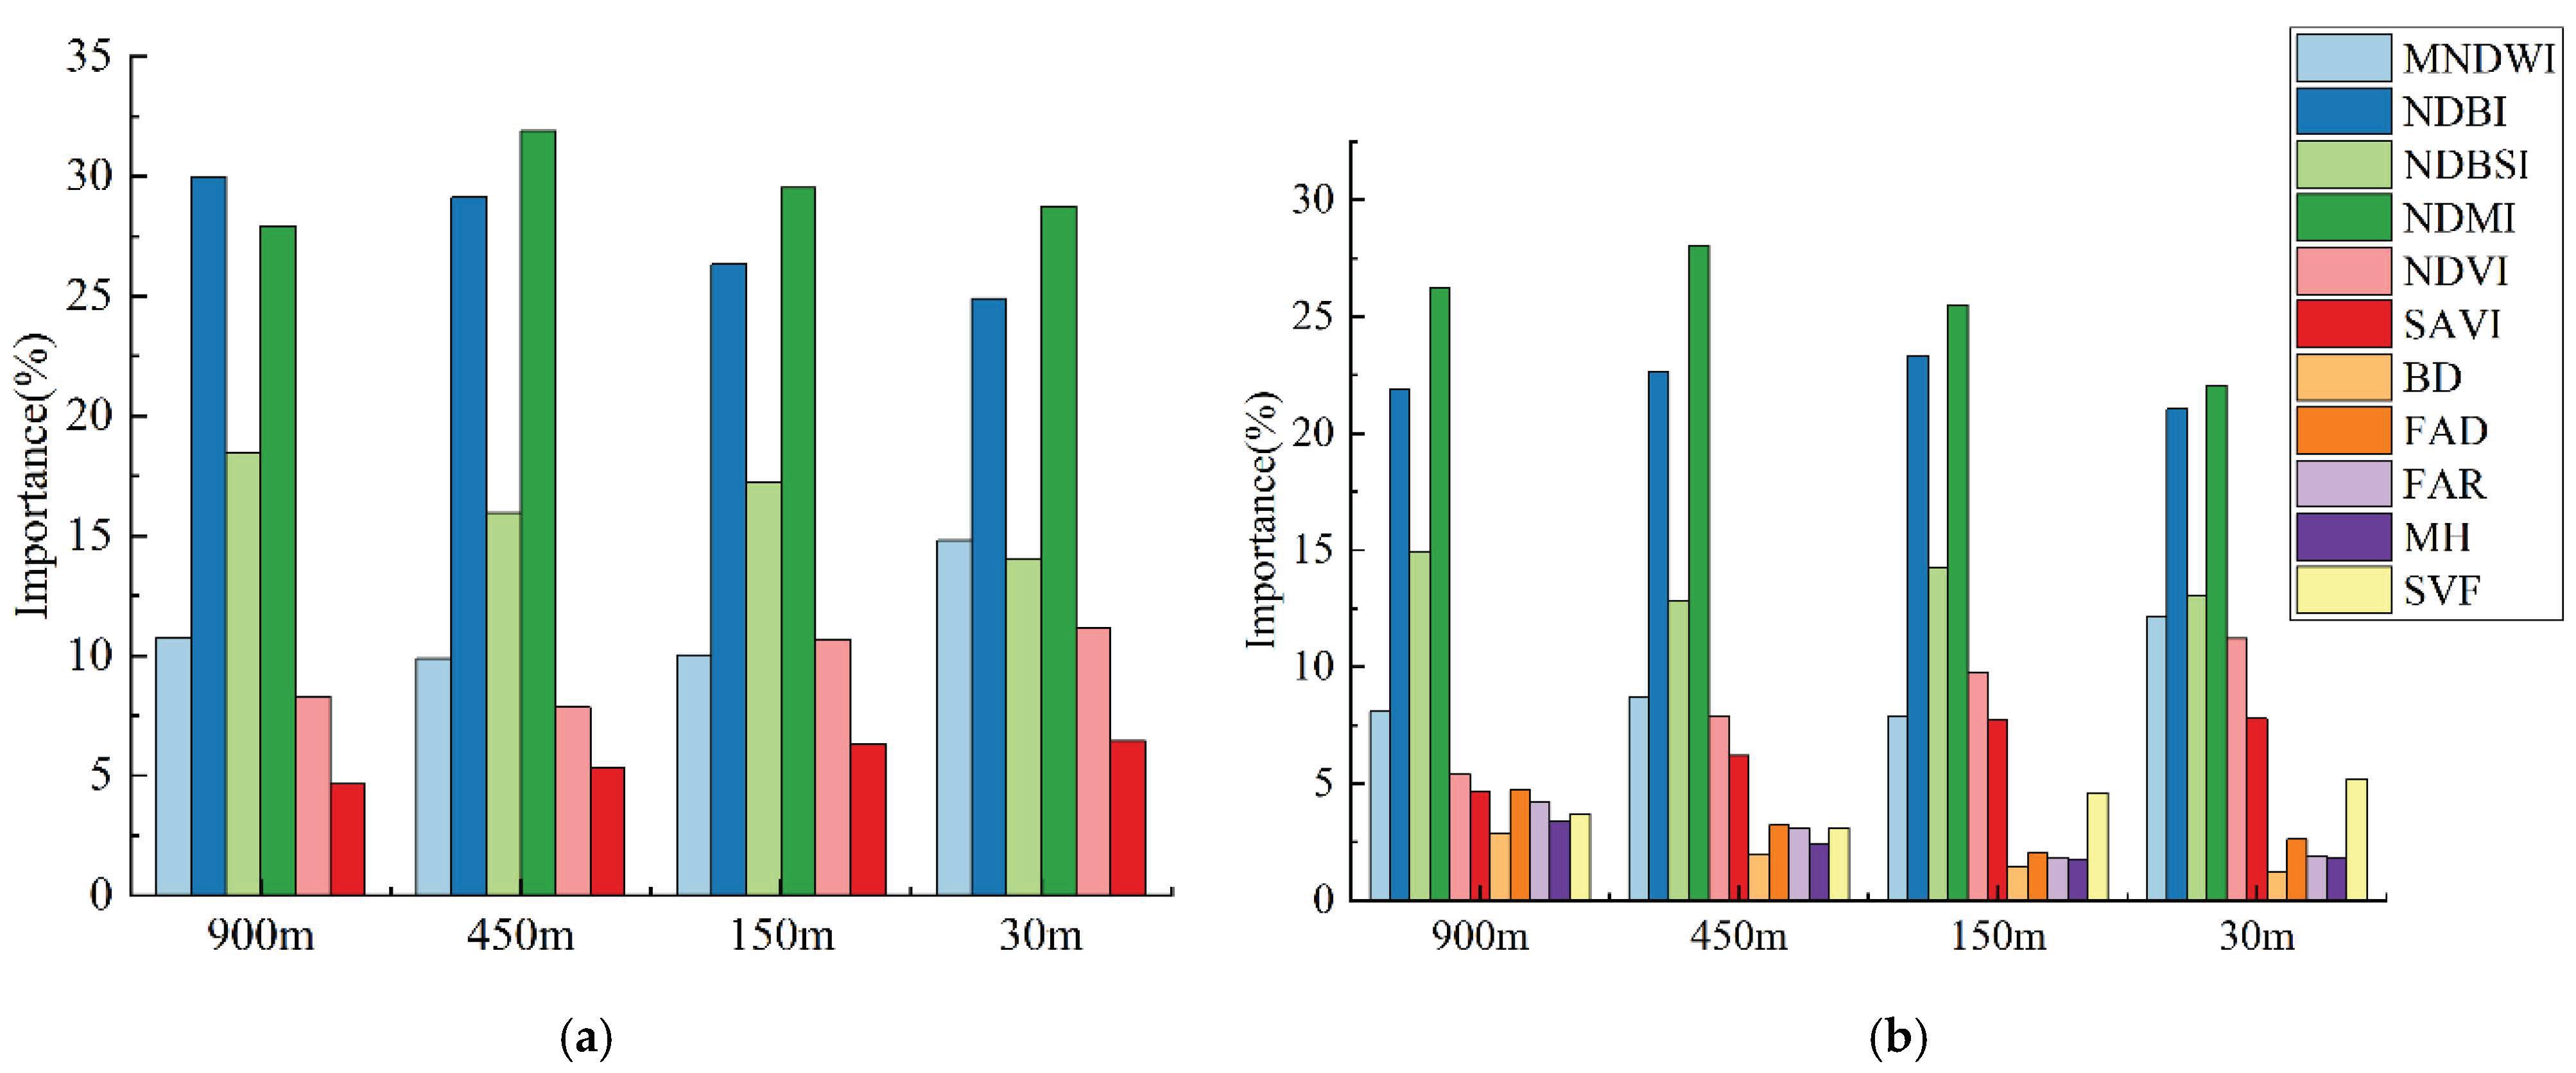
Theimportanceofeachdriverat90-,450-,150-and30-mresolutionscalculatedby therandomforestmodelisshowninFigure 9.AccordingtoFigure 9a,theNDBIhasthe highest importanceata900-mresolutionwithoutspatialmorphologicalparameters,which indicatesthattheNDBIissignificantlycorrelatedwithLSTinurbanareas.Withthe increaseinspatialresolution,theimportanceoftheNDBItendstodecrease,anditdrops tothelowestvalue(25%)ata30-mresolution.Vegetationmoistureisanimportantfactor affectingLSTinurbanareasatanyspatialresolutionbecausetheimportanceoftheNDMI ismaintainedat28–30%asthespatialresolutionchanges.TheimportanceoftheMNDWI increasesfrom11to15%,andtheNDVIincreasesfrom8%to11%,whichindicatesthatthe contributionofwaterbodiesandvegetationtoLSTincreasesastheresolutionincreases. Thereasoncouldbethatsomesmallerlakes,greenareasandnarrowriversareidentified atahighspatialresolution.Figure 9bshowsthattheoverallimportanceoftheremotesensingindexdidnotchangesignificantlyintheSSRFD.Amongthespatialmorphological parameters,theimportanceofBD,FAD,FARandMHdecreasedwithincreasingspatial
resolution,whiletheSVFincreasedfromapproximately3%toapproximately6%.The reasonforthisisthattheregionalspatialmorphologicalparameters,suchasBD,FAD andFAR,calculatedbyasinglesize(100 × 100m),cannotrepresentfinerarchitectural information.Therefore,theregionalspatialmorphologicalparametersarelessrelevantto LSTastheresolutionincreases.AsshowninFigure 9a,b,comparedtootherremote-sensing indices(allvariationswereinarangeof1–3%),therewasasignificantdecreaseinthe importanceoftheNDBIatlowerresolutionsof900and450m,from30and29%inFigure 9a to22and23%inFigure 9b,respectively.Thespatialmorphologicalparametersatalow resolutiontosomeextentcompensatedforthedeficiencyoftheNDBIinthedescriptionof thespatialmorphologicalfeaturesofbuildings.
Figure8. SpatialdistributionofthedownscaledLSTattheresolutionof30minfivelocalitiesofthe studyarea(in b,A1–E1refertothedownscaledLSTfromSSRFD,andA2–E2refertothedownscaled LSTfromSSRFD-M).(a)LandsatLST.(b)thedownscaledLSTforrepresentative5localarea.
Figure9. Importanceofeachdriveratspatialresolutionsof900,450,150and30m.(a)Nospatial morphologicalparametersadded.(b)Spatialmorphologicalparametersadded.
5.Discussion
Withrespecttothescaleeffectofthelandsurfacetemperaturedownscalingmodel, Puetal.[46,47]concludedthatthe“constantscalerelationship”betweenLSTanddriving factorsdoesnotholdundercertainconditions.ComparingFigure 2awithFigure 2bfor
(a) (b)
themainurbanareaofNanjing,whenthespatialresolutionspans30times,thedirect downscalingresultscannotaccuratelyrepresentthespatialdistributionoflandsurface temperature,andtherootmeansquareerrorofthetraditionalDRFDmodelis2.6 ◦ C (Figure 4a).ThisissimilartoLSTdownscalingresultsindifferentregionssuchasthat coveredbyNjukietal.[39]inKenya,Valdesetal.[13]inanaridAntarcticrivervalley, Zhuetal.[15]inBeijingandEbrahimyetal.[38]inIran.WhentheSentinel-3LSTwas downscaledto450,300,150and30musingtheDRFDmethod,respectively,theresearch processrevealedaphenomenonwherergraduallydecreaseswhileRMSEincreasesasthe spatialresolutionspanincreasesstep-by-step,whichisconsistentwith Zhuetal.(2020)[14] andCao(2020)[48].Usingthestep-by-stepdownscalingmodel(SSRFD),therootmean squareerroroftheLSTdownscalingforthewholestudyareadecreasesto1.66 ◦ C,and theaccuracyimprovesbyabout1 ◦ C(Figure 4b).Tangetal.[16]conductedasecond downscalingprocedureusingtheLSTspatialfeaturesextractedfromtheinitialdownscaling resultsandobtainedahigheraccuracyofdownscalingresult,similartotheresultsofthis study.Thestep-by-stepdownscalingmethodreducesthespatialresolutiondifference beforeandafterdownscalingbyaddinganintermediateLSTdownscalingprocessbetween low(e.g.,1km)andhighresolutions(e.g.,30m),fromwhichwecanapproximatethatthe statisticaldownscalingmodeldoesnotchangewithsmallerscales.TheSSRFDcanobtain ahigheraccuracyforLSTdownscalingandismoresuitablefordownscalingstudiesin urbanareaswithcomplexsurfacecoverageandhigh-LSTspatialheterogeneity.However, 900mwasusedastheinitialresolutioninthestudy,andthestep-by-stepdownscalingof resolutionwasperformedsubjectivelybyintegermultiplesof2,3and5.Toobtainbetter LSTdownscalingresults,furtherstudiesmaybeneededtodeterminetheoptimalspatial resolutionchangeduringstepwisedownscaling.
Inrecentyears,duetothecontinuousdevelopmentofspatialdata-acquisitiontechnology,urban3Dspatialdistributiondataarebecomingmoreandmorerefinedandcanbe betterusedtocalculatevariousurbanspatialmorphologicalparametersatdifferentscales. Therearemoreandmorestudiesselectingurbanmorphologicalparameterstoanalyzethe urbanthermalenvironment.Forexample,Middeletal.[19]validatedtheeffectsofurban morphologyandlandscapetypeonlocalmicroclimatezonesinthesemi-aridregionof Phoenix,Arizona;Qaidetal.[20]furtherexploredtheeffectofSVFonthethermalenvironmentofstreetswithdifferentorientations;Wongetal.,Lietal.andNicholetal.studiedthe characteristicsofurbanspatialmorphologyinKowloonPeninsula,HongKongandconfirmedthattheurbanspatialmorphologyprofoundlyaffectstheurbanmicroclimate[49]. Basedontheresultsofthesestudies,itappearsthatthespatiotemporalvariabilityofthe urbanthermalenvironmentiscloselyrelatedtothespatialmorphologicalparameters,and theinfluentialroleofthesethree-dimensionalparametersneedstobeconsideredin-depth inurbanLSTdownscalingstudies.Inthisstudy,basedonthetraditionaltwo-dimensional surfaceparametersofthedownscalingmodel,fivespatialmorphologicalparameters,SVF, FAD,FAR,BDandMH,wereaddedtodownscaletheSentinel-3LSTtoahighspatial resolutionof30m.Itwasfoundthattheurbanspatialmorphologicalparametersdidaffect thespatialdistributionofLST,especiallyforthebuilt-upareas.
Thedownscalingerrorsinthefivebuilding-denseareasdecreasedby0.51,0.48,0.4, 0.16and0.06 ◦ C(Figure 7).Analysisoftheimportanceofthedrivingfactorsshowedthat theimportanceoftheurbanspatialmorphologicalparameterswaslowerthanthatofthe 2Dremote-sensingspectralindex(Figure 9).ThereasonmaybethatthefactorsforBD, FAD,FARandMHwerecalculatedthroughamovingwindowof100 × 100m,makingit difficulttoaccuratelydescribethe3Dspatialfeaturesatahighspatialresolutionof30m. Comparedtotheotherfourspatialmorphologicalparameters,SVFcanbecalculatedpixel bypixel,anditsimportancegraduallybecomeslargerasthespatialresolutionincreases, whichgenerallyindicatesthattheroleofurbanspatialmorphologicalparameterscannot beneglectedforLSTdownscalingathigherspatialresolutionsthan30m.Lietal.[17] andLiuetal.[50]alsomentionedthenecessityofconsideringurbanspatialmorphological parametersinurbanLSTdownscaling.
Intermsofdownscalingaccuracyvalidation,duetothelackofreallandsurface temperaturewithahigherspatialresolution,wejustdownscaledLSTtotheresolutionof 30m.IfthereareLSTsatahighspatialresolution,suchasthedatacollectedbythermal infraredsensorsloadedonunmannedaerialvehiclesorfieldmeasurementtemperature probes,LSTdownscalingforahigherspatialresolutioncouldbeperformedtofurther discusstheinfluenceofmorphologicalparameters.
Finally,aglobalrandomforestdownscalingmodelwasestablishedinthestudy. Consideringthecharacteristicsofdifferenturbanregionsandestablishingsub-regionallocal modelstoimproveLSTdownscalingaccuracyneedtobefurtherdiscussed.Forexample, Stewartetal.[51]proposedtoestablishlocalurbanclimatezonesbyconsideringbuilding andlandcovertypes,anapproachthatcanbeusedtodownscaleLSTforvariousclimate zones.Moreaccuratedownscalingresultsmaybeobtainedbyfurtheranalysisofthe relationshipbetweenLSTandurbanspatialmorphologicalparametersbasedonlocal urbanclimatezones.
6.Conclusions
ThisstudycarriedoutdownscalingLSTinurbanareasusingtheSSRFDandDRFD methods,andthedownscalingeffectsofthetwomethodswerecomparedandanalyzed. Urbanspatialmorphologicalparameterswereintroducedinthedrivertoverifytheirrole inhigh-spatial-resolutiondownscalingLST.Fromtheaboveinvestigations,thefollowing conclusionsweredrawn:
(1) The900-mLSTwasdownscaledstep-by-stepontheorderof450,150and30m. ComparedtotheresultsobtainedwithDRFD,thervaluebetweentheSSRFDresults andLandsatLSTwasimprovedby0.21,andtheRMSEvaluewasreducedby0.94 ◦ C. TheSSRFDresultsmoreaccuratelycapturedthespatialdistributioncharacteristicsof thesurfacetemperature,includingthehigh-temperaturezoneofbuildingsandthe low-temperaturezoneofwaterandvegetation.Theunderestimation/overestimation phenomenonofDRFDresultinginlargeerrorsinthehigh/lowtemperaturezonewas avoidedorattenuatedwhenusingtheSSRFDmethod.
(2) TheresultsobtainedwithSSRFD-Mwerepartiallysignificantlyimprovedinthe Gulou,QinhuaiandJianyebuilt-upareascomparedtoSSRFD,inwhichrandRMSE valuesimproved/decreasedbyapproximately0.15and0.46 ◦ C,respectively.The phenomenonoflow-temperaturezonesinvegetation-coveredareaswhenonlyremotesensingspectralindiceswereusedwasimproved.TheSSRFD-Mresultstosome extentcompensatedforthedeficiencyofremote-sensingspectralindicesusedfor urbanLSTdownscaling.
Inthisstudy,900mwasusedastheinitialresolution,anddownscalingwascarried outinintegermultiplesof2,3and5.Furtherresearchisneededtodeterminetheoptimal downscalingresolutionchangemultiplestoobtainbetterdownscalingresults.Inaddition, thispaperestablishedarandomforestdownscalingLSTmodelforthestudyareaasa whole,whileurbanclimatezonescouldbedividedaccordingtobuildingandlandcover types.Moreaccuratedownscalingresultsmaybeobtainedbyfurtheranalysisofthe relationshipbetweenLSTandurbanspatialmorphologicalparametersbasedonurban localclimatezones.
AuthorContributions: Conceptualization,G.Z.andX.L.;methodology,G.Z.andS.Z.;software,X.L.; validation,Y.X.;datacuration,X.L.;writing—originaldraftpreparation,X.L.;writing—reviewand editing,G.Z.andY.X.;projectadministration,G.Z.;fundingacquisition,S.Z.andY.X.Allauthors havereadandagreedtothepublishedversionofthemanuscript.
Funding: ThisresearchwassupportedbytheNationalNaturalScienceFoundationofChina (42171101,41871028).
DataAvailabilityStatement: Notapplicable.
RemoteSens. 2022, 14,3038
Acknowledgments: TheauthorswouldliketoacknowledgetheUnitedStatesGeologicalSurveyfor theprovisionoftheLandsat-8LSTproduct,andtheEuropeanSpaceAgencyfortheprovisionofthe Sentinel-3LSTproductandSentinel-2remote-sensingdata.
ConflictsofInterest: Theauthorsdeclarenoconflictofinterest.
References
1. Jaafar,H.;Mourad,R.;Schull,M.AGlobal30-mETModel(HSEB)UsingHarmonizedLandsatandSentinel-2,MODISandVIIRS: ComparisontoECOSTRESSETandLST. RemoteSens.Environ. 2022, 274,112995.[CrossRef]
2. Paolini,G.;Escorihuela,M.J.;Bellvert,J.;Merlin,O.DisaggregationofSMAPSoilMoistureat20mResolution:Validationand Sub-FieldScaleAnalysis. RemoteSens. 2022, 14,167.[CrossRef]
3. Joshi,R.C.;Ryu,D.;Sheridan,G.J.;Lane,P.N.J.ModelingVegetationWaterStressovertheForestfromSpace:Temperature VegetationWaterStressIndex(TVWSI). RemoteSens. 2021, 13,4635.[CrossRef]
4. Chu,H.-J.;Wijayanti,R.F.;Jaelani,L.M.;Tsai,H.-P.TimeVaryingSpatialDownscalingofSatellite-BasedDroughtIndex. Remote Sens. 2021, 13,3693.[CrossRef]
5. Baqa,M.F.;Lu,L.;Chen,F.;Nawaz-ul-Huda,S.;Pan,L.;Tariq,A.;Qureshi,S.;Li,B.;Li,Q.CharacterizingSpatiotemporal VariationsintheUrbanThermalEnvironmentRelatedtoLandCoverChangesinKarachi,Pakistan,from2000to2020. Remote Sens. 2022, 14,2164.[CrossRef]
6. Sismanidis,P.;Bechtel,B.;Perry,M.;Ghent,D.TheSeasonalityofSurfaceUrbanHeatIslandsacrossClimates. RemoteSens. 2022, 14,2318.[CrossRef]
7. Niu,L.;Zhang,Z.;Peng,Z.;Jiang,Y.;Liu,M.;Zhou,X.;Tang,R.ResearchonChina’ssurfaceurbanheatislanddriversandits spatialheterogeneity. ChinaEnviron.Sci. 2021, 13,4428.
8. Romaguera,M.;Vaughan,R.G.;Ettema,J.;Izquierdo-Verdiguier,E.;Hecker,C.A.;vanderMeer,F.D.DetectingGeothermal AnomaliesandEvaluatingLSTGeothermalComponentbyCombiningThermalRemoteSensingTimeSeriesandLandSurface ModelData. RemoteSens.Environ. 2018, 204,534–552.[CrossRef]
9. Hrisko,J.;Ramamurthy,P.;Yu,Y.;Yu,P.;Melecio-Vázquez,D.UrbanAirTemperatureModelUsingGOES-16LSTandaDiurnal RegressiveNeuralNetworkAlgorithm. RemoteSens.Environ. 2020, 237,111495.[CrossRef]
10. Westermann,S.;Langer,M.;Boike,J.SpatialandTemporalVariationsofSummerSurfaceTemperaturesofHigh-ArcticTundraon Svalbard—ImplicationsforMODISLSTBasedPermafrostMonitoring. RemoteSens.Environ. 2011, 115,908–922.[CrossRef]
11. Mahour,M.;Tolpekin,V.;Stein,A.;Sharifi,A.AComparisonofTwoDownscalingProcedurestoIncreasetheSpatialResolution ofMappingActualEvapotranspiration. ISPRSJ.Photogramm.RemoteSens. 2017, 126,56–67.[CrossRef]
12.Bartkowiak,P.;Castelli,M.;Notarnicola,C.DownscalingLandSurfaceTemperaturefromMODISDatasetwithRandomForest ApproachoverAlpineVegetatedAreas. RemoteSens. 2019, 11,1319.[CrossRef]
13. LezamaValdes,L.-M.;Katurji,M.;Meyer,H.AMachineLearningBasedDownscalingApproachtoProduceHighSpatioTemporalResolutionLandSurfaceTemperatureoftheAntarcticDryValleysfromMODISData. RemoteSens. 2021, 13,4673. [CrossRef]
14. Zhu,J.;Zhu,S.;Yu,F.;Zhang,G.;Xu,Y.AdownscalingmethodforERA5reanalysislandsurfacetemperatureoverurbanand mountainareas. Natl.RemoteSens.Bull. 2021, 25,1778–1791.
15. Zhu,X.;Song,X.;Leng,P.;Hu,R.Spatialdownscalingoflandsurfacetemperaturewiththemulti-scalegeographicallyweighted regression. Natl.RemoteSens.Bull. 2021, 25,1749–1766.
16. Tang,K.;Zhu,H.;Ni,P.SpatialDownscalingofLandSurfaceTemperatureoverHeterogeneousRegionsUsingRandomForest RegressionConsideringSpatialFeatures. RemoteSens. 2021, 13,3645.[CrossRef]
17. Li,N.;Wu,H.;Luan,Q.LandSurfaceTemperatureDownscalinginUrbanArea:ACaseStudyofBeijing. Natl.RemoteSens.Bull. 2021, 25,1808–1820.
18.Golany,G.S.UrbanDesignMorphologyandThermalPerformance. Atmos.Environ. 1996, 30,455–465.[CrossRef]
19. Middel,A.;Häb,K.;Brazel,A.J.;Martin,C.A.;Guhathakurta,S.ImpactofUrbanFormandDesignonMid-AfternoonMicroclimate inPhoenixLocalClimateZones. Landsc.UrbanPlan. 2014, 122,16–28.[CrossRef]
20. Qaid,A.;Lamit,H.B.;Ossen,D.R.;Rasidi,M.H.EffectofthePositionoftheVisibleSkyinDeterminingtheSkyViewFactor onMicrometeorologicalandHumanThermalComfortConditionsinUrbanStreetCanyons. Theor.Appl.Climatol. 2018, 131, 1083–1100.[CrossRef]
21. Xiong,Y.;Peng,F.;Zou,B.SpatiotemporalInfluencesofLandUse/CoverChangesontheHeatIslandEffectinRapidUrbanization Area. Front.EarthSci. 2019, 13,614–627.[CrossRef]
22. Weng,Q.;Fu,P.;Gao,F.GeneratingDailyLandSurfaceTemperatureatLandsatResolutionbyFusingLandsatandMODISData. RemoteSens.Environ. 2014, 145,55–67.[CrossRef]
23. Wu,P.;Shen,H.;Zhang,L.;Göttsche,F.-M.IntegratedFusionofMulti-ScalePolar-OrbitingandGeostationarySatelliteObservationsfortheMappingofHighSpatialandTemporalResolutionLandSurfaceTemperature. RemoteSens.Environ. 2015, 156, 169–181.[CrossRef]
24. Guo,L.J.;Moore,J.M.PixelBlockIntensityModulation:AddingSpatialDetailtoTMBand6ThermalImagery. InternationalJ. RemoteSens. 1998, 19,2477–2491.[CrossRef]
RemoteSens. 2022, 14,3038
25. Nichol,J.AnEmissivityModulationMethodforSpatialEnhancementofThermalSatelliteImagesinUrbanHeatIslandAnalysis. Photogramm.Eng.RemoteSens. 2009, 75,547–556.[CrossRef]
26. Wang,J.;Schmitz,O.;Lu,M.;Karssenberg,D.ThermalUnmixingBasedDownscalingforFineResolutionDiurnalLandSurface TemperatureAnalysis. ISPRSJ.Photogramm.RemoteSens. 2020, 161,76–89.[CrossRef]
27. Kustas,W.P.;Norman,J.M.;Anderson,M.C.;French,A.N.EstimatingSubpixelSurfaceTemperaturesandEnergyFluxesfromthe VegetationIndex-RadiometricTemperatureRelationship. RemoteSens.Environ. 2003, 85,429–440.[CrossRef]
28. Agam,N.;Kustas,W.P.;Anderson,M.C.;Li,F.;Neale,C.M.U.AVegetationIndexBasedTechniqueforSpatialSharpeningof ThermalImagery. RemoteSens.Environ. 2007, 107,545–558.[CrossRef]
29. Dominguez,A.;Kleissl,J.;Luvall,J.C.;Rickman,D.L.High-ResolutionUrbanThermalSharpener(HUTS). RemoteSens.Environ. 2011, 115,1772–1780.[CrossRef]
30. Lacerda,L.N.;Cohen,Y.;Snider,J.;Huryna,H.;Liakos,V.;Vellidis,G.FieldScaleAssessmentoftheTsHARPTechnique forThermalSharpeningofMODISSatelliteImagesUsingVENμSandSentinel-2-DerivedNDVI. RemoteSens. 2021, 13,1155. [CrossRef]
31. Vaculik,A.F.;RachidBah,A.;Norouzi,H.;Beale,C.;Valentine,M.;Ginchereau,J.;Blake,R.DownscalingofSatelliteLand SurfaceTemperatureDataOverUrbanEnvironments.InProceedingsoftheIEEEInternationalGeoscienceandRemoteSensing Symposium,Yokohama,Japan,28July–2August2019;pp.7475–7477.
32. Sánchez,J.M.;Galve,J.M.;González-Piqueras,J.;López-Urrea,R.;Niclòs,R.;Calera,A.Monitoring10-mLSTfromthe CombinationMODIS/Sentinel-2,ValidationinaHighContrastSemi-AridAgroecosystem. RemoteSens. 2020, 12,1453.[CrossRef]
33. Pereira,O.J.R.;Melfi,A.J.;Montes,C.R.;Lucas,Y.DownscalingofASTERThermalImagesBasedonGeographicallyWeighted RegressionKriging. RemoteSens. 2018, 10,633.[CrossRef]
34. Guo,F.;Hu,D.;Schlink,U.ANewNonlinearMethodforDownscalingLandSurfaceTemperaturebyIntegratingGuidedand GaussianFiltering. RemoteSens.Environ. 2022, 271,112915.[CrossRef]
35. Guijun,Y.;Ruiliang,P.;Wenjiang,H.;Jihua,W.;Chunjiang,Z.ANovelMethodtoEstimateSubpixelTemperaturebyFusing Solar-ReflectiveandThermal-InfraredRemote-SensingDatawithanArtificialNeuralNetwork. IEEETrans.Geosci.RemoteSens. 2010, 48,2170–2178.[CrossRef]
36. Li,W.;Ni,L.;Li,Z.-L.;Duan,S.-B.;Wu,H.EvaluationofMachineLearningAlgorithmsinSpatialDownscalingofMODISLand SurfaceTemperature. IEEEJ.Sel.Top.Appl.EarthObs.RemoteSens. 2019, 12,2299–2307.[CrossRef]
37. Wang,R.;Gao,W.;Peng,W.DownscaleMODISLandSurfaceTemperatureBasedonThreeDifferentModelstoAnalyzeSurface UrbanHeatIsland:ACaseStudyofHangzhou. RemoteSens. 2020, 12,2134.[CrossRef]
38. Ebrahimy,H.;Aghighi,H.;Azadbakht,M.;Amani,M.;Mahdavi,S.;Matkan,A.A.DownscalingMODISLandSurfaceTemperature ProductUsinganAdaptiveRandomForestRegressionMethodandGoogleEarthEnginefora19-YearsSpatiotemporalTrend AnalysisOverIran. IEEEJ.Sel.Top.Appl.EarthObs.RemoteSens. 2021, 14,2103–2112.[CrossRef]
39.Njuki,S.M.;Mannaerts,C.M.;Su,Z.AnImprovedApproachforDownscalingCoarse-ResolutionThermalDatabyMinimizing theSpatialAveragingBiasesinRandomForest. RemoteSens. 2020, 12,3507.[CrossRef]
40. Malakar,N.K.;Hulley,G.C.;Hook,S.J.;Laraby,K.;Cook,M.;Schott,J.R.AnOperationalLandSurfaceTemperatureProductfor LandsatThermalData:MethodologyandValidation. IEEETrans.Geosci.RemoteSens. 2018, 56,5717–5735.[CrossRef]
41. Cook,M.;Schott,J.R.;Mandel,J.;Raqueno,N.DevelopmentofanOperationalCalibrationMethodologyfortheLandsatThermal DataArchiveandInitialTestingoftheAtmosphericCompensationComponentofaLandSurfaceTemperature(LST)Product fromtheArchive. RemoteSens. 2014, 6,11244–11266.[CrossRef]
42. LSDS-1619_Landsat-8-9-C2-L2-ScienceProductGuide-v4.pdf.Availableonline: https://d9-wret.s3.us-west-2.amazonaws.com/ assets/palladium/production/s3fspublic/media/files/LSDS-1619_Landsat-8-9-C2-L2-ScienceProductGuide-v4.pdf (accessed on30December2021).
43. SLSTR_Level-2_LST_ATBD.pdf.Availableonline: https://sentinel.esa.int/documents/247904/0/SLSTR_Level-2_LST_ATBD. pdf/8a4322ef-c7e0-4abc-9cac-8f5fd69e1fd7 (accessedon14May2022).
44. S2-PDGS-TAS-DI-PSD-V14.9.pdf.Availableonline: https://sentinel.esa.int/documents/247904/4756619/S2-PDGS-TAS-DIPSD-V14.9.pdf/3d3b6c9c-4334-dcc4-3aa7-f7c0deffbaf7 (accessedon14May2022).
45.Xu,H.Aremotesensingurbanecologicalindexanditsapplication. ActaEcol.Sin. 2013, 33,7853–7862.
46. Pu,R.AssessingScalingEffectinDownscalingLandSurfaceTemperatureinaHeterogenousUrbanEnvironment. Int.J.Appl. EarthObs.Geoinf. 2021, 96,102256.[CrossRef]
47. Pu,R.;Bonafoni,S.ReducingScalingEffectonDownscaledLandSurfaceTemperatureMapsinHeterogenousUrbanEnvironments. RemoteSens. 2021, 13,5044.[CrossRef]
48.Cao,C.;Yang,Y.DownscalingMulti-resolutionLandsurfaceTemperatureResearch. Mod.Surv.Mapp. 2018, 41,3–8.
49. Wong,M.S.;Nichol,J.;Ng,E.AStudyofthe“WallEffect”CausedbyProliferationofHigh-RiseBuildingsUsingGISTechniques. Landsc.UrbanPlan. 2011, 102,245–253.[CrossRef]
50. Liu,Y.;Xu,Y.;Zhang,F.;Shu,W.InfluenceofBeijingSpatialMorphologyontheDistributionofUrbanHeatIsland. ActaGeogr. Sin. 2021, 76,1662–1679.
51. Stewart,I.D.;Oke,T.R.LocalClimateZonesforUrbanTemperatureStudies. Bull.Am.Meteorol.Soc. 2012, 93,1879–1900. [CrossRef]