Introduction to Lung CT AI
AI: An Intelligent Agent
The foundation for this book about lung CT AI is the application of what Alan Turing described in 1936 as the “universal Turing machine.”1 This is what is known today as the computer hardware and software that dominates so much of our lives, and is at the heart of lung CT AI. In his recent book, Stuart Russell describes succinctly what Alan Turing meant by the universal Turing machine.1 The essence of Turing’s discovery was to define two new mathematical objects. The first was defined as a machine, what is known today as computer hardware. The second, mathematical object, Turing defined as a program that is known as software code that runs on the computer hardware. Together, the machine (computer hardware) and the program (software code) define a sequence of events, or a sequence of state changes, that occur in the machine (computer CPU, computer memory, etc.) to accomplish a task.
Russell describes the key concept in modern artificial intelligence (AI) as being the concept of an intelligent agent.1 The intelligent agent exists in the software programs running on a computer. How the AI agent is built depends on the objective(s) to be achieved or the problem(s) to be solved. The functioning AI agent then depends on four important things: (1) environment; (2) observations; (3) actions; and (4) objective(s)1 (Fig. 1.1). The environment is the physical and electronic space that the AI agent can access. Using the word processing (WP) AI agent as an example, the WP AI agent environment includes keyboard commands, computer display, and computer hardware and software, as well as any internet connections that are running. The observations that the WP can make are the keystrokes pressed, and it can read the WP files that exist on the computer and in the cloud. The actions that the WP can take are: recording the keystrokes and displaying those on the screen; storing them on the computer or the Internet; and reading and writing existing WP files from the computer memory, hard disk drive, and the Internet (Fig. 1.2). The objectives for the WP AI agent are determined by the people who wrote the software to run on the computer. These objectives can be summarized as taking keystroke inputs and creating a software file that records the keystrokes and displays them on the computer screen. It is also important to recognize that one AI agent can pass the objectives to another AI agent to perform additional objectives, and this process can continue with as many AI agents as desired. For example, the WP files on a computer can be sent to a typesetting program that a publisher would use to generate the final output for a book.
AI DEFINITIONS AND LEVELS
AI is a rapidly expanding field, and definitions of the different levels of AI are changing as a result of this growth. AI, for the purpose of this book, includes four levels: (1)
Star t AI Program
Objective 3
Environment
Obser vations
Decide and Take Action
Objective 1
Objective 2
Fig. 1.1 The four elements of an intelligent agent (AI agent): environment, observations, actions, and objective(s). Star t Program
in a
Fig. 1.2 How the four elements of an AI agent work to enable the objective(s) of a simple word processing program.
BOX 1.1 n Four Levels of Increasing AI Capabilities
Level 1
Level 2
Level 3
Level 4
Reactive Machine AI
Limited-Memory AI
Theory-of-Mind AI
Self-Aware AI
reactive machine; (2) limited-memory; (3) theory of mind; and (4) self-aware2 (Box 1.1). Since the late 1960s and early 1970s, reactive machine type AI has driven the development of multiple AI technologies to visually and, subsequently, quantitatively assess the presence and extent of lung diseases using x-ray CT scanning. More recently, limitedmemory levels of AI have been added to the list of technologies driving progressive improvements in the visual and quantitative CT assessment of lung disease. Reactive machines are the most basic type of AI system. This means that they cannot form memories or use past experiences to influence presently made decisions; they can only react to currently existing situations—hence the term “reactive.” An existing form of a reactive machine is Deep Blue, a chess-playing supercomputer created by IBM in the mid1980s.2 Reactive machine AI programs will only react in the present in the way they are programmed. Examples of reactive machine AI programs in CT lung AI would include analytic CT image reconstruction algorithms, analytic CT image lung segmentation programs, computing the lung CT image voxel histogram, and relevant voxel histogram statistics that have been previously shown to correlate with normal and diseased lung tissue. These reactive machine lung CT AI metrics of lung disease can be used to detect and assess the extent of normal and abnormal lung structure and function caused by underlying lung disease, such as emphysema, asthma, or pulmonary fibrosis. The advantage of reactive machine learning AI is that it is very clear what the software program is doing. However, it is not as powerful as limited-memory AI. Limited-memory AI is comprised of machine learning models that derive knowledge from previously learned information, stored data, or events. Unlike reactive machines, limited-memory learns from the past by observing actions, or data fed to them, in order to build experiential knowledge.2 Limited-memory machine learning AI has been used in identifying specific patterns of lung disease, such as honeycombing in patients with ILD. Limited-memory machine learning AI has also been applied to CT image reconstruction, reducing noise in reconstructed CT images. It has also been implemented in segmentation software to extract the lungs from the rest of the thoracic anatomy on CT images. Limitedmemory AI machine learning has been used to identify unique patient CT phenotypes in patients with COPD3 and asthma.4 Limited-memory AI machine learning has also been used to classify lung nodules into benign and malignant categories.5
Lung CT AI involves a number of simpler AI agents that are linked together to produce a final lung CT AI objective, which is to detect and assess normal and diseased lung structure and function and make these results widely available to patients and healthcare providers. The lung CT AI agents that are included in this book, in the order in which they are usually performed, are: (1) generate high-quality CT images of the thorax; (2) display the CT images of the thorax; (3) separate or segment the lung CT images from the rest of the thoracic anatomy; (4) extract quantitative features from the
lung CT images that represent meaningful metrics of normal and diseased lung structure and function; (5) analyze these features to predict the presence or absence of lung disease, and to assess the extent and impact of any detected lung disease; and (6) make these results available in near real time for patients and their health care providers (Fig. 1.3). The routine lung CT AI outputs for individual patient care can then be systematically collected and examined across healthcare systems and countries; these results can
the
Use QCT Features to Detect and Assess Lung Disease Generate High Quality Lung CT Images
Extract QCT Features from the CT Images
Fig. 1.3 The sequence of lung CT AI agents in the order in which they are performed: generate high-quality CT images of the thorax, display the CT images of the thorax, separate or segment the lung CT images from the rest of the thoracic anatomy, extract quantitative CT (QCT) features from the lung CT images that represent meaningful metrics of normal and diseased lung structure and function, analyze these features to predict the presence or absence of lung disease and to assess the extent and impact of any detected lung disease, and make these results available in near realtime for patients and their health care providers.
Display CT Images of the Thorax
Segment
Lungs and Airway from the Other Thoracic Anatomy
be used in near real time to assess world lung health and disease, and to inform how best to allocate scarce resources needed to decrease the prevalence and severity of lung disease. My biggest reason for writing this book is to make everyone aware that the lung CT AI objectives outlined above are now achievable. I believe lung CT AI will work best in a healthcare environment where everyone has access to quality healthcare, regardless of ability to pay or preexisting conditions.
This book will follow the sequence of AI agents that have been developed over the last 50 years to generate a 3D digital representation of the lung using x-ray CT,6,7 and finally develop an AI agent that is useful in detecting and predicting the malignant potential of pulmonary nodules;5 the presence and severity of diffuse lung diseases, such as chronic obstructive pulmonary disease (COPD),8 idiopathic pulmonary fibrosis (IPF),9 and, most recently, COVID-19 viral pneumonia.10 The progressive improvements in CT scanner technology have advanced the 3D visualization of normal lung structure and function and made it possible to develop new AI methods to accurately detect and assess normal and diseased states of the lung. The progressive increases in our knowledge of lung CT AI will help guide our narrative from describing the first digital images of the lung obtained from x-ray computed tomography, to the very recent exciting application of quantitative CT AI methods for the detection and assessment of the severity of lung nodules and acute and chronic diffuse lung disease. The high spatial and contrast resolution of modern chest CT images of the lung has also enabled the creation of sophisticated software to build silicon computer models of normal and diseased lungs, and has increased our fundamental understanding of lung physiology and pathophysiology.11,12
Diagnosis of COPD, ILD, Lung Cancer, and Other Smoking-Related Diseases
The inhalation of cigarette smoke or other environmental combustion products is the leading cause of COPD and lung cancer. The inhalation of these combustion products leads to inflammation and oxidative stress in the lung tissues. COPD decreases the effectiveness of gas exchange through the destruction of alveolar walls and increases the resistance of getting gas to the alveoli through the narrowing and destruction of airways. The combination of these processes greatly impairs the function of the lungs in a COPD patient. COPD is the fourth leading cause of death in the United States behind heart disease, cancer, and accidental deaths.13 COPD is usually diagnosed late in the course of the illness and is often misdiagnosed. Lung cancer screening in the United States, using low-dose chest CT scans, is an opportunity to detect early lung cancers caused by exposure to cigarette smoking, but also to diagnose COPD at earlier stages when there is more time to intervene and alter the course of the disease.
Earlier detection of chronic interstitial lung disease (ILD) provides the opportunity for early therapeutic intervention and improved patient outcomes.14 Chronic ILD produced by IPF, HP, and CTD produces thickening of the alveolar walls, which decreases the efficiency of gas exchange. These diseases can also distort and destroy the normal architecture of the lung acinus, decreasing the effective surface–to–volume ratio of the lung. ILD is also a disease that is often diagnosed in more advanced stages and often misdiagnosed. People with IPF frequently have a significant history of cigarette smoking, and ILD is often present in patients with COPD.
Information for Healthcare Providers and Administrators, Patients, and Researchers
I believe there is a need for a book on lung CT AI to inform healthcare providers and administrators, patients, researchers, and government agencies about the development, validation, and commercial availability of lung CT AI products that can detect and assess several lung diseases, including lung cancer, COPD, COVID-19 pneumonia, and ILD. COPD and ILD are often diagnosed in later stages of the disease and often missed in the earlier stages of disease when the disease is more treatable. The lung CT AI assessment of COVID-19 viral pneumonia during the ongoing worldwide pandemic of 2020 has been helpful in countries and healthcare systems where access to timely quality RT-PCR testing is not available or is unreliable. Lung CT AI programs can help identify COVID-19 pneumonia from other forms of pneumonia and assess which patients will need to be hospitalized and are at increased risk of dying.
Lung cancer is the leading cause of cancer deaths in the United States, and there now exists AI software that can help identify benign versus malignant lung nodules.5 Until recently, these lung CT AI technologies were only used in research studies because of the difficulty in deploying the software in busy radiology practices within clinics and hospitals. This has changed with the advent of software programs, like VIDA Insight, that can be deployed independently or in larger enterprise AI ecosystems of large computer companies.15 Small agile software companies, like VIDA, can develop specialized AI software to assess lung CT images for the presence and severity of lung structural and functional changes due to disease, and these specialized AI software programs can now be accessed at the point of care without slowing down the radiology workflow; this novel CT lung AI software can increase efficiency in radiology practices. There are potential broader favorable impacts on human health than just the care of individual patients. QCT metrics of lung disease that are driven by environmental pollution, such as COPD and lung cancer, can be assessed in an objective way across hospital systems, states, and nations. This will inform governments and leaders on how best to spend limited resources on improving the environment and lessening the spread of environmentally driven lung diseases.
Describing Lung CT AI in Three Stages
This book includes a historical description of the technological developments that were necessary to achieve the current success of lung CT AI software in the clinical care of patients with lung disease. The structure of the book is divided into three segments. The first segment, Chapters 2 and 3, discusses the development of x-ray CT scanners and scanning protocols that are used to scan the thorax and generate 3D images of the lungs. Chapter 2 begins with the invention of the x-ray computed tomographic (CT) scanner that, at first, could only generate a limited number of low-spatial-resolution contiguous 2D digital images of the thorax with a long scan time. The first whole-body CT scanner, ACTA CT scanner, had very slow scan times, 4.5 minutes to obtain two 7.5-mm nearly contiguous axial images of the thorax with a spatial resolution in the axial x-y plane of 1.5 mm and the z-axis of 7.5 mm.6 The ACTA CT scan time for an adult male lung that is 30 cm in length would take a minimum of 90 minutes, longer if
x-ray tube cooling was needed. The scan time and the spatial resolution of the CT scanner are important metrics that drive what can be done with AI in analyzing images of the lung. Chapter 2 also follows several key technologies that were developed to improve the spatial resolution and decrease scan times of x-ray CT scanners; scan time and spatial resolution have greatly improved over the last 40 years.
Chapter 3 discusses the latest generation of x-ray CT scanner technologies and lung CT scanning protocols available in 2020. The latest generation of CT scanners can scan the entire thorax in less than 10 seconds with an isotropic resolution of 0.5 mm. Chapter 3 details the important CT scanning variables that need to be carefully selected, such as x-ray dose, scan time, z-axis resolution, and image reconstruction method, to produce the best lung CT images.
The second segment of the book, Chapters 4 through 7, describes the lung CT AI methods that have been developed to detect and quantitatively assess focal lung nodules, pulmonary emphysema, pulmonary fibrosis, and acute COVID-19 viral pneumonia from the CT-generated density maps of the lung.
Chapter 4 discusses the concept of the lung nodule and how CT is used to detect and quantitatively assess the malignant potential of a lung nodule. Exposure to environmental factors, especially cigarette smoke, increases the risk of developing lung cancer. It has been shown recently that the use of screening lung CT scans can decrease mortality in people exposed to cigarette smoke.
Chapters 5, 6, and 7 introduce increasingly more sophisticated lung CT AI methods to assess diffuse lung disease, starting with CT image voxel histograms in Chapter 5 and ending with sophisticated limited-memory AI machine learning algorithms in Chapter 7.
Chapter 5 describes the QCT metrics that are readily obtained from a single total lung capacity (TLC) CT scan done with an appropriate CT protocol, as outlined in Chapter 3. Lung CT density metrics were the first lung CT AI metrics to be reported and focused mainly on the reduced density of the lung produced by pulmonary emphysema. Pulmonary fibrosis produces increased density in the lung and can also be assessed using density measures from lung CT images. Chapter 5 describes the research studies that were performed to determine if the QCT metrics described do, in fact, represent important features of normal and diseased lung tissue by correlating CT image findings to other measures of lung disease (e.g., pulmonary function tests, lung pathology).
Chapter 5 discusses how quantitative CT lung images provide critical new information regarding COPD that was not obtained from other methods (e.g., clinical history, pulmonary function testing).16 Determining the value of lung CT AI versus other means of assessing patients with COPD required the funding of large multicenter NIH grants that studied thousands of subjects with and without COPD. These studies established the relative value of lung CT AI metrics with other data characterizing COPD-related lung disease, including genetic studies, pulmonary physiology testing, and standardized healthcare questionnaires. These studies included COPDGene, MESA Lung, and SPIROMICS. One QCT lung AI study in the SPIROMCS study identified four unique clusters of subjects with COPD that had different QCT metrics and different disease trajectories.3 Chapter 5 also discusses the results of multiple smaller-size research studies in assessing the value of lung CT AI in groups of patients with pulmonary fibrotic lung disease associated with idiopathic pulmonary fibrosis (IPF), connective tissue disease
(CTD), and hypersensitivity pneumonitis (HP). A number of QCT density metrics are shown to be effective in assessing pulmonary fibrosis in ILD. These metrics include whole lung histogram measurements of the lung and their associated statistics, including mean lung density, skewness, and kurtosis.17,18 They also include QCT measures of the amount of lung density between -600 HU and -250 HU.19
Chapter 6 introduces dynamic QCT metrics that can be generated using two CT scans done sequentially at different lung volumes. These metrics provide a means of assessing lung structure and function. The assessment of lung ventilation can be done using an inspiratory and expiratory CT scan and looking at the change in lung density, or change in lung volume, between the two scans. There are several ways to apply this methodology to assessing lung ventilation at the whole lung level, lobe level, segment level, acinar level, and voxel level. Lung biomechanics can also be assessed using two chest CT scans obtained at different lung volumes, typically TLC and RV.
Chapter 7 looks at limited-memory type AI metrics in assessing COPD, ILD, and COVID-19 pneumonia. Limited-memory type AI algorithms are trained in three stages (Fig. 1.4) to detect and assess the presence of lung disease. The first stage is feature extraction. This can be done using supervised or unsupervised approaches. Supervised approaches have an expert imaging physician label the normal and abnormal tissue features on the lung CT images. Unsupervised approaches let the AI algorithm determine the normal and abnormal tissue types. The second stage used to train the AI algorithm is to have it recognize and quantitate the amount of the normal and abnormal tissue features, or textures, within the lung CT images that correspond to important pathologic features associated with different lung diseases. The number of supervised or unsupervised training CT cases can be increased to improve the performance of the limitedmemory lung CT AI program. The design of the limited-memory lung CT AI program can also be altered to improve its performance. The third stage tests the performance of the trained AI algorithm on a test set of chest CT scans from a cohort of human subjects separate from the training cohort. The performance of the lung CT AI algorithm is based on its ability to identify the different tissue features on the test set of chest CT scans, including features such as emphysema, honeycombing, and consolidation.
The third segment of the book includes Chapters 8 and 9. Chapter 8 discusses the concept of physiomics. The goal of lung physiomics is to generate computer models of all the anatomical and physiologic functions of the lung to gain new insights into normal and diseased lung function. A specific lung physiome model of lung ventilation and perfusion are discussed that can be used to better assess the risk of acute pulmonary emboli (APE). APE can acutely increase the mean pulmonary artery pressure and induce right ventricular failure. Simply computing the volume of acute blood clots occluding the lumen of pulmonary arteries does not predict increased pulmonary artery pressures as accurately as the lung physiome model of ventilation and perfusion. 3D lung CT images provide the spatial information of lung structure for this lung physiome model. The lung physiome model builds a complete picture of lung structure and function across multiple spatial scales, physical functions, and their integration.
Chapter 9 discusses how the AI methods described in Chapters 2 through 8 can now be applied to the routine care of patients in the normal clinical workflow. This has been the goal of lung CT AI for many decades and is now possible in the 2020s due to numerous advances in computing that have occurred over the past three decades. One
Super
Classify Training CT Cases
Classify Training CT Cases
Acceptable
Test CT Scans Test CT Scans
Fig. 1.4 The three steps used to train limited-memory type lung CT AI algorithms to detect and assess normal and diseased lung tissue. The first stage is feature extraction. This can be done using supervised or unsupervised approaches. Supervised approaches have an expert imaging physician label the normal and abnormal tissue features on the lung CT images. Unsupervised approaches let the AI algorithm determine by itself the normal and abnormal tissue types. The second stage trains the AI algorithm to recognize and quantitate the amount of the normal and abnormal tissue features, or textures, within the lung CT images that correspond to important pathologic features associated with different lung diseases. The number of supervised or unsupervised training CT cases can be increased to improve the performance of the limited-memory lung CT AI program. The design of the limited-memory lung CT AI program can also be altered to improve its performance. The third stage tests the performance of the trained AI algorithm on a test set of chest CT scans from a cohort of human subjects separate from the training cohort. The performance of the lung CT AI algorithm is based on its ability to identify the different tissue features on the test set of chest CT scans including features such as emphysema, honeycombing, and consolidation.
of the main goals of this book is to show how the advancement of lung CT AI over the past 45 years has made it possible to provide lung CT AI technologies in the current clinical medical imaging environment. These advances in computing have enabled the emergence of several small clinical CT lung AI imaging companies that began as research-only enterprises, to help provide the lung CT AI tools needed for large NIH studies such as COPDGene, Mesa Lung, and SPIROMICS. The success of lung CT AI in the research realm has motivated these small lung CT AI companies to develop new clinical products in lung CT AI.
VIDA is one of these companies that has developed lung CT AI software that can run independently, or on large enterprise-scale medical imaging AI ecosystems so that the previously validated quantitative CT metrics of lung disease can be extracted in near real time, and made available to the imaging and referring physician for the immediate care of the patient at the point of care. Chapter 9 reviews the current information technologies (IT) that are in use in modern healthcare hospitals and clinics to support the acquisition, storage, and distribution of medical imaging studies, including x-ray CT studies of the thorax and how the imaging IT interacts with the larger healthcare IT that supports the patient’s electronic medical record (EMR). We then discuss the lung CT AI technology that is now available within the imaging IT ecosystem to automatically assess lung CT images for quantitative metrics of lung disease. Specifically, we discuss VIDA Insights v3.0 Density/tMPR module and Texture/Subpleural View module. Both use reactive machine AI and limited-memory AI methods to analyze each lung and lobe of a chest CT scan for the following quantitative CT metrics: lung and lobe volume in liters, LAA-950 metric for emphysema, HAA-700 to -250 metric for COVID19 pneumonia and ILD, and the texture patterns that make up the HAA-700 to -250 that include ground-glass/reticular opacities, consolidation, and honeycombing. The chapter concludes by discussing the importance of responsible AI in any application of AI, along with guidelines to achieve responsible lung CT AI. The current technology state of lung CT AI can accomplish what could only have been dreamed about by investigators when the “Density Mask” CT technique was first published in 1988 as a CT method of assessing reduced lung density by emphysema.20
References
1. Russell S. Human Compatable: Artificial Intelligence and the Problem of Control. New York, NY: Viking; 2019:336.
2. Reynoso R. 4 Main Types of Artificial Intelligence. 2019. Available at: https://www.g2.com/ articles/types-of-artificial-intelligence.
3. Haghighi B, Choi S, Choi J, Hoffman EA, Comellas AP, Newell Jr. JD, et al. Imagingbased clusters in current smokers of the COPD cohort associate with clinical characteristics: the SubPopulations and Intermediate Outcome Measures in COPD Study (SPIROMICS). Respir Res. 2018;19(1):178.
4. Choi S, Hoffman EA, Wenzel SE, Castro M, Fain S, Jarjour N, et al. Quantitative computed tomographic imaging-based clustering differentiates asthmatic subgroups with distinctive clinical phenotypes. J Allergy Clin Immunol. 2017;140(3):690–700.e8.
5. Uthoff J, Stephens MJ, Newell Jr. JD, Hoffman EA, Larson J, Koehn N, et al. Machine learning approach for distinguishing malignant and benign lung nodules utilizing standardized perinodular parenchymal features from CT. Med Phys. 2019;46(7):3207–3216.
6. Ledley RS, Di Chiro G, Luessenhop AJ, Twigg HL. Computerized transaxial x-ray tomography of the human body. Science. 1974;186(4160):207–212.
7. Schellinger D, Di Chiro G, Axelbaum SP, Twigg HL, Ledley RS. Early clinical experience with the ACTA scanner. Radiology. 1975;114(2):257–261.
8. Humphries SM, Notary AM, Centeno JP, Strand MJ, Crapo JD, Silverman EK, et al. Deep learning enables automatic classification of emphysema pattern at CT. Radiology. 2020;294(2):434–444.
9. Humphries SM, Yagihashi K, Huckleberry J, Rho BH, Schroeder JD, Strand M, et al. Idiopathic pulmonary fibrosis: data-driven textural analysis of extent of fibrosis at baseline and 15-month follow-up. Radiology. 2017;285(1):270–278.
10. Li L, Qin L, Xu Z, Yin Y, Wang X, Kong B, et al. Artificial intelligence distinguishes COVID-19 from community acquired pneumonia on chest CT. Radiology. 2020:200905.
11. Tawhai M, Clark A, Donovan G, Burrowes K. Computational modeling of airway and pulmonary vascular structure and function: development of a “lung physiome”. Crit Rev Biomed Eng. 2011;39(4):319–336.
12. Tawhai MH, Bates JH. Multi-scale lung modeling. J Appl Physiol. (1985). 2011;110(5):1466–1472.
13. Heron M. Deaths: leading causes for 2017. National Vital Statistics Reports. 2019;68(6):1–76.
14. Fischer A, Patel NM, Volkmann ER. Interstitial lung disease in systemic sclerosis: focus on early detection and intervention. Open Access Rheumatol. 2019;11:283–307.
15. VIDA. VIDA 2020. Available at: https://vidalung.ai.
16. Lowe KE, Regan EA, Anzueto A, Austin E, Austin JHM, Beaty TH, et al. COPDGene((R)) 2019: redefining the diagnosis of chronic obstructive pulmonary disease. Chronic Obstr Pulm Dis. 2019;6(5):384–399.
17. Best AC, Lynch AM, Bozic CM, Miller D, Grunwald GK, Lynch DA. Quantitative CT indexes in idiopathic pulmonary fibrosis: relationship with physiologic impairment. Radiology. 2003;228(2):407–414.
18. Best AC, Meng J, Lynch AM, Bozic CM, Miller D, Grunwald GK, et al. Idiopathic pulmonary fibrosis: physiologic tests, quantitative CT indexes, and CT visual scores as predictors of mortality. Radiology. 2008;246(3):935–940.
19. Podolanczuk AJ, Oelsner EC, Barr RG, Hoffman EA, Armstrong HF, Austin JH, et al. High attenuation areas on chest computed tomography in community-dwelling adults: the MESA study. Eur Respir J. 2016;48(5):1442–1452.
20. Muller NL, Staples CA, Miller RR, Abboud RT. “Density mask”. An objective method to quantitate emphysema using computed tomography. Chest. 1988;94(4):782–787.
Three-Dimensional (3D) Digital Images of the Lung Using X-ray Computed
Tomography
This chapter will discuss the digital lung, x-rays, and key components of the x-ray CT scanner to help better understand lung CT AI scanning protocols, and to briefly review the historical progression of advancements in x-ray computed tomography of the lungs from the 1970s through the development of multidetector spiral CT (MDCT) scanners in the early 2000s. Each CT technology advancement improved visual and quantitative assessment of x-ray CT images of the lung. The challenges that needed to be overcome included decreasing the examination time, increasing the spatial resolution of the CT images, and decreasing the x-ray dose to the patient. Each of these improvements, during this timeframe, was very important toward enabling future AI approaches in the diagnosis and assessment of lung diseases.
The Digital Lung
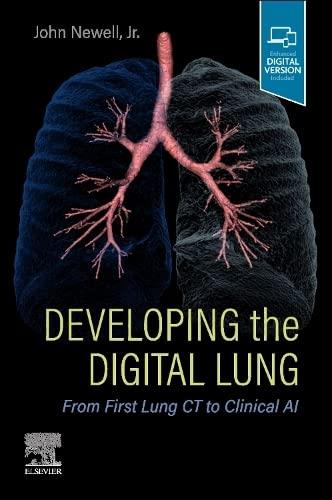
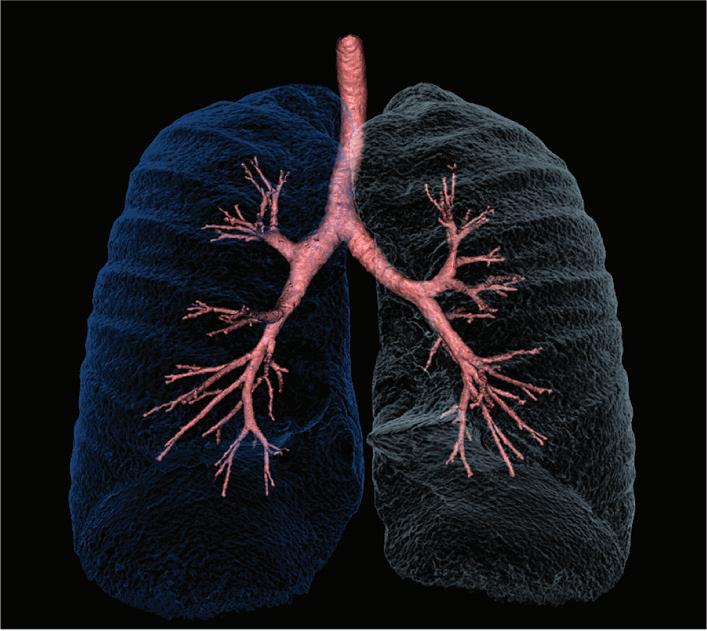
The digital lung is defined as a true three-dimensional (3D) representation of the right and left lungs (Fig. 2.1A). The digital lung, using human whole-body x-ray CT scanners available in 2020, is a collection of volume elements (voxels) that collectively represent the lung, and each voxel is assigned a value that corresponds to the average linear attenuation of the x-ray photons by the lung tissue within that voxel (Fig. 2.1B). The average volume of both human lungs is about 5 liters.1 The size of the voxel, using modern MDCT scanners, can be as small as 0.5 mm for each axis. The total number of voxels contained in the lungs, in this case, is 40 million voxels. The first in a series of lung CT AI agents is the computer program running the x-ray CT scanner. Its objective is to generate 3D digital images of the lung that can then be viewed by patients and their physicians. This digital lung is the environment that additional AI agents can observe and, depending on the actions available to the particular AI agent, achieve additional objectives, such as segmenting the lungs from the other thoracic tissue and analyzing the lung voxels for measures of normal and diseased lung tissue (see Chapters 4 through 7).
X-ray Computed Tomography
X-ray computed tomography is a transmission computed tomographic method through which a precisely collimated external x-ray beam is transmitted through the human thorax (Fig. 2.2); the location and energy intensity of the x-ray photons that are not scattered or absorbed by thoracic tissue are captured on an x-ray detector designed for this purpose.
Fig. 2.1 (A) 3D rendering of both lungs obtained using a modern multidetector x-ray computed tomographic scanner and software to render the millions of voxels that were acquired into a single 3D rendering of the lungs. [Courtesy of VIDA.] (B) The cube shape of a 0.5-mm isotropic x-ray CT voxel is shown here and its relationship to a 2D axial chest CT image.
The x-ray CT scanner consists of several major components: x-ray tube and electronics, x-ray detector and electronics, CT gantry, patient table, computer hardware, software, and displays (Fig. 2.3). From the very first x-ray CT scanner to the current modern x-ray CT scanners of the 2020 s, they all have needed these components to produce and display a CT image.2 The advances in CT technology over the past five decades were made possible by advances in each of these key x-ray CT scanner components. It should be emphasized that without the AI software program running the x-ray CT scanner, there would be no practical way to reconstruct the CT images. The advent of relatively small and capable minicomputers in the 1960s made it possible to construct commercially viable x-ray CT scanners. The basic design of CT scans from the 1970s to the present share several common design features. Since the advent of human CT scans, it has been desirable to have the patient lay still in a supine position on the CT “scanning” table. The table moves the patient along their long axis, head-to-toe or z-axis, so the entire body can be scanned, if desired. The need to obtain multiple 1D projections of the supine patient laying in one position on the scanning table led to a CT scanner design where the x-ray tube rotates around the supine stationary subject with its corresponding x-ray detector on the opposite side of the patient (Fig. 2.4). The x-ray tube produces a beam of x-rays and these x-ray beams can have several geometric shapes including pencil beam, broad parallel beam, fan beam, or cone beam, depending on the CT scanner design. The most common current configuration of the x-ray beam is a rotating 50- to 60-degree cone beam (Fig. 2.5). The shape of the x-ray beam determines the shape of the x-ray detector array. The rotation axis of the x-ray tube and x-ray detector assembly is around the z-axis of the subject, and the highly collimated x-ray beam travels through the patient and onto the x-ray detectors. Today, the xy and z-axis width of individual detectors is less than 1 mm depending on the x-ray CT scanner model.
x-ray tube anode
Patient
x-ray detector elements
Z Axis
Fig. 2.2 Graphical representation of a tightly collimated x-ray beam in the z-axis that is transmitted through the thorax of a subject. The tightly collimated x-ray beam reduces the ionizing radiation exposure to adjacent tissues and increases the contrast resolution of the scan over what is possible with projection radiography, also shown here.
There are other medical imaging techniques that can generate 3D digital images of the lung; including magnetic resonance computed tomography (MRI), single-photon emission computed tomography (SPECT), positron emission computed tomography (PET), and hybrid imaging that combines two of these techniques (e.g., PET/CT, SPECT/CT, PET/MRI). X-ray transmission computed tomography (CT) is the most widely available computed tomographic method and is uniquely capable of rapid 3D imaging of the lungs, with both high image contrast and high spatial resolution, linear density scale over typical lung density values (−1000 HU to 0 HU), low claustrophobia, and low dose radiation (0.15 mGy to 1.5 mGy using modern x-ray CT scanners).3
CT Gantr y
Patient Patient
CT Table
Fig. 2.3 Several major components of an x-ray CT scanner, including the gantry containing the x-ray tube, high energy voltage generator and corresponding x-ray detectors, and the CT scanning table with a patient positioned supine at the isocenter of the gantry. The CT technologist’s computer and monitors are typically located in an adjoining room.
tube
x-ray beam isocenter
Fig. 2.4 The geometric relationships of the x-ray tube, patient, maximum scan field of view, and the x-ray detector array of third-generation CT scanner. Many 1D projections of the patient’s anatomy are obtained as the x-ray tube and x-ray detector move around the patient on the CT scanning table. The patient is positioned at the isocenter of rotation of the CT gantry. The maximum scan field of view is indicated. The reconstruction or display field of view (DFOV) can be smaller than the maximum scan field of view.
Fig. 2.5 Narrow 3D cone x-ray cone beam and its corresponding curved 2D x-ray detector array. This is the most common current geometric configuration of the x-ray beam and detector array used in clinical x-ray CT scanners.
The arrival of MDCT scanners in the 2000s, with 64 or more z-axis detector channels, has fueled multiple high-quality research studies that have increased our understanding of lung CT AI, its application in detecting, and assessing lung cancer and diffuse lung disease. Many research studies that have been done using x-ray CT in assessing COPD, ILD, and lung cancer, and these research studies provide the scientific foundations for this book (see Chapters 4 through 8).
X-RAYS
There are two forms of ionizing electromagnetic radiation, x-rays, and gamma rays. They are both high-energy photons capable of breaking covalent chemical bonds and because they can break covalent chemical bonds, are referred to as ionizing electromagnetic radiation.4 Liquid water is the most abundant molecule in the human body and the ionization energy to remove an electron from water is 11.2 electron volts (eV).4 A photon with an energy equal to or greater than 11.2 eV is considered ionizing radiation.4 Covalent organic chemical bonds link together atoms in carbon-based living organisms and breaking these bonds can have serious consequences for the organism. The 3D distribution of energy concentration in units of joules per kilogram of the x-ray photons passing through the body is referred to as ionizing radiation absorbed dose. X-ray and gamma-ray photons are defined by how they are produced. The x-ray is produced outside the nucleus of an atom. In contrast, gamma rays are produced within the nucleus of the atom through radioactive decay of an excited nucleus. The energy of the gamma-ray is equal to the difference in the initial excited energy state of the nucleus and a lower state, or a ground state, of the nucleus.
x-ray tube
2D detector array
3D x-ray cone beam
The differential attenuation of the x-ray beam photons in biologic material provides the mechanism to generate diagnostic medical images of the human body. The differential attenuation of the photons involves elastic (Rayleigh) scattering of x-ray photons, photoelectric absorption of x-ray photons, and Compton scattering of x-ray photons, as the principal mechanisms of differential attenuation of the x-ray beam (using peak x-ray tube voltages (kVp) between 25 kV and 150 kV).5 The dominant attenuation mechanism of x-rays in lung tissue and other soft tissue using a kVp between 70 kV and 150 kV (typical of non-contrast x-ray CT of the thorax) is Compton scattering.5 The probability of a Compton scattering event per unit mass of incident x-rays on low atomic number materials (typical of normal lung tissue) is nearly independent of the atomic number (Z) of the scattering lung tissue.5 The probability of a Compton scattering event per unit volume of incident x-rays on low atomic number materials is proportional to the density of the material.5 The reason for this is, except for the hydrogen atom, the number of electrons per gram of tissue for low atomic number materials, such as carbon and oxygen, is relatively constant, so the number of electrons per gram of tissue is driven mainly by tissue density; the result is that the attenuation of x-rays in the lung tissue is proportional to the density of the lung tissue.5 A good friend and colleague of mine, Jim Hogg, MD, has likened the x-ray CT scanner to a lung densitometer, and the above discussion supports this view. Photoelectric absorption of x-rays does come into play when intravenous iodinated contrast material is given to the patient just before the scan is performed. The presence of a high-atomic-number material like iodine (Z = 53, with a K shell orbital electron binding energy of 33 kV) will mean that the absorption of incident x-rays by iodine atoms will depend primarily on the photoelectric effect when incident x-rays interact with an iodine atom.5
IMPORTANT COMPONENTS OF AN X-RAY COMPUTED TOMOGRAPHIC (CT) SCANNER
CT X-ray Tube
The production of x-rays for medical imaging purposes is achieved by using an x-ray tube. The x-ray tube is a vacuum tube that has a very low internal pressure so that the interior of the x-ray tube contains very few atoms that would otherwise attenuate the flow of electrons in the x-ray tube. The x-ray tube contains a cathode, typically a coiled tungsten wire, at one end of the tube and an anode, typically a flat tungsten target, at the other end of the x-ray tube.6 A current is passed through the cathode tungsten wire, which heats the wire, and the thermionic emission of electrons results in free electrons coming from the cathode.6 The electrons are accelerated from the negatively charged cathode to the positively charged anode by placing a high voltage between the cathode and the anode. This voltage ranges from 25 kV to 150 kV in medical imaging. When the high-energy free electrons collide with an anode, made of a suitable material, x-ray photons are produced. Tungsten (W, Z = 74) is one of five refractory metals in the periodic table (Nb, Mo, Ta, W, Re) and has the second-highest atomic number (Z = 74) of the refractory metals. The higher the atomic number, the greater the production of x-rays with energies that are high enough for use in x-ray CT of the lung. Tungsten has the highest melting point and lowest vapor pressure of all metals, and at temperatures over 1650°C has the highest tensile strength.7 Tungsten is a refractory metal with very high
resistance to heat and wear, as well as a high atomic number (Z = 74), so it is an ideal anode target material. A Tungsten (90%)-Rhenium (Re, Z = 75) (10%) alloy can be used to increase the resistance to anode surface damage.6
The impact of the electrons on a tungsten metal anode produces the x-ray photons using two different methods: characteristic x-ray photon method and Bremsstrahlung x-ray photon method.6 The characteristic x-rays are generated when an electron with sufficient kinetic energy strikes and ejects an inner electron (K electron orbit) in material with a high atomic number (Z), such as tungsten (W, Z = 74). Subsequently, an outer electron with the same high Z material transitions to the vacancy in the inner electron orbital and, in this process, an x-ray photon is generated with energy equal to the difference in the binding energy of the outer electron and the inner electron that was ejected. X-ray photons greater than 100 eV are termed characteristic photons whose energies are determined by the metal anode target. The most energetic characteristic x-rays from tungsten are due to transitions from the L (57.98 keV, 59.32 keV), or M shell (67.24 keV) to the K shell of tungsten.6 The Bremsstrahlung, or breaking method of x-ray production, involves the deceleration of electrons as they penetrate a high Z anode target material, such as tungsten, and the deceleration of the electrons generates x-rays with photon energies between the working function of the metal and the keV used in the x-ray tube. The Bremsstrahlung x-rays are usually more abundant than characteristic x-rays in a CT scanner x-ray tube. The efficiency of generating Bremsstrahlung x-rays increases with the atomic number of the anode (Z = 74 for tungsten) and with the kilovoltage that is applied between the cathode and the anode.6
Modern x-ray tubes designed to be used with x-ray CT scanners have high power ratings, 5–7 megajoules, to be able to produce a large number of x-ray photons in a very short period of time.1 The size of the x-ray tube focal spot on the tungsten anode is an important factor in determining the spatial resolution of the CT scanner. A smaller focal size can improve spatial resolution. However, a smaller focal spot size decreases the maximum number of x-ray photons that can be produced in a given period of time. Selection of the optimum focal spot size is an important CT scanning protocol variable for lung CT AI. The focal spot size of current x-ray CT scanners ranges from 1 to 2 mm.1
The x-ray tube peak kilovoltage (kVp) and tube current (mA) are two key variables in a lung CT scanning protocol. The kVp determines the x-ray beam peak energy, x-ray beam energy spectrum, and the efficiency of producing x-rays. The increase in efficiency of photon production will increase the ionizing radiation dose to the patient. The higher the kVp, the greater efficiency of producing x-rays for a given tube current. The higher the kVp (between 70 kV and 150 kV), the lower the tissue contrast. It is important in quantitative CT work to agree on the same kVp, since different kVp settings will change the HU values assigned to lung voxels for a given mA. The higher the kVp, the more efficient the x-ray photon production, so for a given mA, a higher kVp will result in higher radiation absorbed dose to the patient. For a given kVp, the tube current will determine the amount of x-ray photons produced. The higher the tube current, the more x-ray photons are produced for a given kVp. A higher tube current results in less image noise, but also higher radiation absorbed dose to the patient for a given kVp.
The x-ray tube current in mA determines the number of electrons that are accelerated between the x-ray tube cathode and anode per unit time. The tube current in mA multiplied by the length of time the x-ray tube is turned on, exposure time in seconds is called the tube current-time product or mAs. The mAs is proportional to the total number of x-ray photons the x-ray tube produces. The higher the mAs, the greater the number of x-ray photons produced and the higher ionizing radiation absorbed dose to the patient. The selection of a mAs value has a direct effect on the image noise and the radiation dose to the patient. Lung CT scanning protocols use mAs values that ensure adequate image quality with the lowest amount of radiation dose to the patient or subject being scanned.
Modern x-ray CT scanners use a bow tie-shaped x-ray beam filter to shape the beam so that all the detector elements in the detector array see a more uniform number of photons per unit area striking them.1 The use of additional x-ray beam filtration can also modify the spectrum and intensity of the x-ray beam before it is transmitted through the patient. The addition of 5–10 mm thick aluminum filters in x-ray CT imaging will decrease the amount of lower energy x-rays that cannot penetrate the thickness of the thorax and contribute to the formation of the image, and also increase the fraction of higher energy photons that can reach the x-ray detector if they are not scattered or absorbed.1
It is now possible to control the kVp and mAs on modern CT scanners in realtime, and these values can be adjusted to provide a consistent signal-to-noise ratio in the CT image and a lower and more uniform radiation dose to the imaged tissues. These are referred to as tube kilovoltage modulation and tube current modulation (Fig. 2.6). The use of mA modulation in lung CT AI work has been successfully implemented recently. The use of kVp modulation is an issue in lung CT AI work when CT image voxel density values need to be consistent across time and patients. The varying kVp will change the x-ray beam energy spectrum, hence the CT image contrast and voxel density values will vary in the lung in a way that is challenging to correct at the present time.
In summary, the important factors regarding the operation of the x-ray tube that need to be factored into a CT scanning protocol include focal spot size, tube currenttime product (mAs), peak kilovoltage (kVp), additional x-ray beam filtration, tube current modulation, and kilovoltage modulation.
CT X-ray Beam Shape and Energy Spectrum
The x-ray photon beam has several properties that impact scan time, image contrast, and ionizing radiation dose. Beam intensity and cross-sectional size of the photon beam determine how much tissue can be imaged per unit time. For a given beam intensity, the larger the cross-sectional size of the beam, the shorter time it takes to scan the lungs. The early CT scanners had very narrow pencil or rod-shaped photon beam crosssections. This limitation was due to the reconstruction algorithms that were used, as well as limitations in the x-ray tube power and available x-ray detectors. The scan times were very long. The size of the x-ray beam cross-section has steadily increased over time as corresponding increases in x-ray tube output, x-ray detector array size, and computer power have been able to deal with large amounts of data per unit time coming from the x-ray detectors.

Fig. 2.6 Modern x-ray dual source multidetector CT scanner, Siemens SOMATOM FORCE CT scanner, showing the patient table in relationship to the large aperture of the CT gantry. Courtesy Siemens Healthineers.
The x-ray beam photon energy spectrum that irradiates the patient is a major factor in the image contrast of the final CT image. This energy spectrum needs to be carefully selected so that adequate image signal to noise ratio and contrast to noise ratio are present in the lung CT images at the lowest possible radiation dose. The energy spectrum needs to be the same in order to compare one patient to another and to assess the same patient at multiple time points. This is an important concept in quantitative CT of the lung because the values of the linear absorption coefficients, which determine the value assigned to each voxel in the image, are a function of the x-ray beam energy spectrum. To be able to compare voxel values over time from the same lung, or between lungs