Hydrogeochemistry of Aquatic Ecosystems
Edited by Sughosh Madhav
Jamia Millia Islamia, New Delhi, India
Virendra Bahadur Singh
Ram Lal Anand College, University of Delhi, New Delhi, India
Manoj Kumar
Central University of Haryana, India
Sandeep Singh
Indian Institute of Technology Roorkee, India
This edition first published 2023 © 2023 John Wiley & Sons Ltd
All rights reserved. No part of this publication may be reproduced, stored in a retrieval system, or transmitted, in any form or by any means, electronic, mechanical, photocopying, recording or otherwise, except as permitted by law. Advice on how to obtain permission to reuse material from this title is available at http://www.wiley.com/go/permissions.
The right of Sughosh Madhav, Virendra Bahadur Singh, Manoj Kumar, and Sandeep Singh to be identified as the authors of the editorial material in this work has been asserted in accordance with law.
Registered Office(s)
John Wiley & Sons, Inc., 111 River Street, Hoboken, NJ 07030, USA
John Wiley & Sons Ltd, The Atrium, Southern Gate, Chichester, West Sussex, PO19 8SQ, UK
Editorial Office
Boschstr. 12, 69469 Weinheim, Germany
For details of our global editorial offices, customer services, and more information about Wiley products visit us at www.wiley.com.
Wiley also publishes its books in a variety of electronic formats and by print-on-demand. Some content that appears in standard print versions of this book may not be available in other formats.
Limit of Liability/Disclaimer of Warranty
In view of ongoing research, equipment modifications, changes in governmental regulations, and the constant flow of information relating to the use of experimental reagents, equipment, and devices, the reader is urged to review and evaluate the information provided in the package insert or instructions for each chemical, piece of equipment, reagent, or device for, among other things, any changes in the instructions or indication of usage and for added warnings and precautions. While the publisher and authors have used their best efforts in preparing this work, they make no representations or warranties with respect to the accuracy or completeness of the contents of this work and specifically disclaim all warranties, including without limitation any implied warranties of merchantability or fitness for a particular purpose. No warranty may be created or extended by sales representatives, written sales materials or promotional statements for this work. The fact that an organization, website, or product is referred to in this work as a citation and/or potential source of further information does not mean that the publisher and authors endorse the information or services the organization, website, or product may provide or recommendations it may make. This work is sold with the understanding that the publisher is not engaged in rendering professional services. The advice and strategies contained herein may not be suitable for your situation. You should consult with a specialist where appropriate. Further, readers should be aware that websites listed in this work may have changed or disappeared between when this work was written and when it is read. Neither the publisher nor authors shall be liable for any loss of profit or any other commercial damages, including but not limited to special, incidental, consequential, or other damages.
Library of Congress Cataloging-in-Publication Data applied for 9781119870531
Cover Design: Wiley
Cover Image: Courtesy of Virendra Bahadur Singh
Set in 9.5/12.5pt STIXTwoText by Straive, Pondicherry, India
Contents
List of Contributors xii
Editors’ Biography xvi
Preface xvii
1 Fluoride in Groundwater: Distribution, Sources, Processes, Analysis, and Treatment Techniques: A Review 1
Bedour Al Sabti, Dhanu Radha Samayamanthula, Fatemah M. Dashti, and Chidambaram Sabarathinam
1.1 Introduction 1
1.2 Permissible Limits of Fluoride in Drinking Water 3
1.3 Concentration of High Fluoride Around the Globe 4
1.4 Sources of Fluoride in Groundwater 4
1.4.1 Natural Sources 6
1.4.2 Anthropogenic Sources 7
1.4.3 Health Effects 8
1.4.4 Dental Fluorosis 8
1.4.5 Skeletal Fluorosis 9
1.5 Hazard Index 9
1.5.1 Analytical Techniques 11
1.5.2 Treatment Methods 11
1.6 High Fluoride Water Types 13
1.6.1 Relationship of pH to Fluoride 15
1.6.2 Thermodynamic Stability of High Fluoride Waters 17
1.6.3 Saturation States 18
1.6.4 Fluoride vs SI-Fluorite 18
1.6.5 SI Fluorite and SI Calcite 18
1.7 Statistical Techniques to Assess High Fluoride Waters 19
1.7.1 Correlation Analysis 19
1.7.2 Principal Component Analysis 21
1.8 Conclusion 22
Acknowledgments 22
References 23
2 Geochemical Sources, Aqueous Geochemistry, Human Health Risk of Fluoride-Enriched Groundwater, and Its Remedial Measures 33 Paulami Sahu and Chitrangada Debsarma
2.1 Introduction 33
2.1.1 Occurrence of Fluoride 33
2.1.2 Dispersion of Fluoride in Groundwater 34
2.1.2.1 International Scenario 34
2.1.2.2 National Scenario 40
2.1.3 Fluoride and Human Health 40
2.2 Environmental Origin of F in Groundwater 40
2.2.1 Geological Origins 41
2.2.1.1 Igneous, Sedimentary, and Metamorphic Minerals 41
2.2.1.2 Sea Water 43
2.2.1.3 Geothermal Fluid 43
2.2.1.4 Volcanic Sources 44
2.2.2 Anthropogenic Origins 44
2.2.2.1 Atmosphere 44
2.2.2.2 Fertilizer and Irrigation Water 44
2.3 Geochemical Mechanisms for Fluoride Occurrence in Groundwater 44
2.3.1 Stabilization 45
2.3.1.1 Adsorption 45
2.3.1.2 Precipitation 46
2.3.2 Mobilization 46
2.3.2.1 Dissolution 46
2.3.2.2 Desorption 46
2.4 Technologies for F Removal from Groundwater 47
2.5 Recommended Remedial Measures to Reduce Human Health Problems 47
2.6 Concluding Remarks 48 References 52
3 Spatial Distribution of Arsenic Contamination in India:
A Systematic Review 61
Abhra Singh, Risha Singh, Binod Kumar Nath, Mohammad Hashim, Masood Ahsan Siddiqui, Hasan Raja Naqvi, and Lubna Siddiqui
3.1 Introduction 61
3.2 Research Methodology 62
3.2.1 Framing the Research Questions 62
3.2.2 Constructing Keywords or Search Terms for Literature Collection 63
3.2.3 Databases and the Range of Years Searched 63
3.2.4 Identification of Publications 63
3.2.4.1 Inclusion Criteria 63
3.2.4.2 Exclusion Criteria 63
3.3 Arsenic in Aqueous Environment 63
3.4 Arsenic- Contaminated States 64
3.5 Medium of Contamination 67
3.6 Sources and Mobilization 68
3.6.1 Holocene Sediments 68
3.6.2 Excessive Pumping, Irrigation Practices, and Poor Economic Condition 68
3.6.3 Oxidizing and Reducing Conditions 69
3.6.4 Organic Matter 70
3.6.5 Micro-organisms and Phytoplankton 70
3.6.6 Fertilizers and Crops 70
3.6.7 Coal Mining and Industries 71
3.7 Probable Future Arsenic Zones 71
3.8 Exposure to Arsenic 73
3.9 Conclusions 74
References 74
4 Arsenic Contamination of Groundwater in Indo-Gangetic Plain 85
Samikshya Panda, Vinod Kumar Tripathi, Shrinivasa D.J., and Reema Sharma
4.1 Introduction 85
4.2 Sources and Concentration of Arsenic in Groundwater 86
4.3 Issues Related to Elevated Arsenic Concentration 86
4.4 Removal Techniques of Arsenic from Groundwater 88
4.4.1 Biological Oxidation 88
4.5 Arsenic Treatment Plant Waste Disposal 89
4.6 Challenges in Arsenic-Affected Areas 89
4.7 Indian Scenario Regarding Measures Taken to Mitigate the Problem of As Availability in Groundwater 90
4.8 Conclusion 92
References 93
5 Soil–Water Interactions and Arsenic Enrichment in Groundwater 97 Sonam Taneja, Shivani Yadav, Harsh Pipil, Oznur Karaca, and A. K. Haritash
5.1 Introduction 97
5.2 Sources and Occurrence of Arsenic in Soil, Sediments, and Groundwater 98
5.3 Global Distribution of Arsenic in Groundwater 99
5.4 Chemical Speciation of Arsenic 101
5.5 Soil–Water Interactions 103
5.5.1 Oxidative Desorption 103
5.5.2 Sulfide Oxidation 103
5.5.3 Reductive Dissolution of Iron Hydroxides 103
5.6 Health Effects of Arsenic 104
5.7 Case Studies 106
5.7.1 Arsenic- Contaminated Drinking Water in Bangladesh 106
5.7.2 Groundwater Contamination in West Bengal, India 108
5.7.3 Arsenic Contamination Through Ammunition and Its Testing 108
5.8 Treatment of Arsenic- Contaminated Water 109
5.8.1 Treatment with Activated Carbon 109
5.8.2 Adsorption by Activated Alumina 112
5.8.3 Coagulation and Precipitation 112
5.8.4 Electrodialysis Method 113
5.8.5 Reverse Osmosis Method 113
5.8.6 Ion-Exchange Process 113
5.9 Conclusion 114
References 114
6 Arsenic Contamination in Groundwater and Its Removal Strategies with Special Emphasis on Nano Zerovalent Iron 121
Shivani Thakur , Harminder Singh, Umakant Chaudhari, Sunil Mittal, and Prafulla Kumar Sahoo
6.1 Introduction 121
6.1.1 General Chemistry and Occurrence of Arsenic in Nature 122
6.1.2 Release and Mobilization Mechanism of Arsenic in Groundwater 123
6.1.2.1 Sulfide Oxidation 123
6.1.2.2 Reductive Dissolution 124
6.1.2.3 Alkali Desorption 124
6.1.2.4 Microbial-Mediated Arsenic Mobilization in Groundwater 125
6.1.3 Arsenic Status in Global Groundwater Systems 126
6.2 Conventional Methods for the Removal of Arsenic from Water 129
6.3 Arsenic Removal from Water Using Iron-Based Adsorbents 131
6.4 Zerovalent Iron Nanoparticles 134
6.4.1 Synthesis of nZVI Particles 135
6.4.2 Application of nZVI in Arsenic Removal from Groundwater/Synthetic Water 135
6.5 Merits and Demerits of Using nZVI 139
6.6 Conclusions and Future Perspectives 140
References 141
7 Chemical Speciation of Chromium and Arsenic and Biogeochemical Cycle in the Aquatic System 155 Nitin Verma, Neha Kanojia, Sourav Kalra, and Kamal Dua
7.1 Introduction 155
7.1.1 Heavy Metals 156
7.1.2 Sources 156
7.1.3 Toxic Effects 157
7.2 Chemistry of Arsenic in Aquatic System 160
7.2.1 Aqueous Arsenic Distribution and Speciation 164
7.2.2 River Water 165
7.2.3 Lake Water 166
7.2.4 Seawater and Estuaries 166
7.2.5 Groundwater 166
7.2.6 Sediment Pore Waters 166
7.2.7 Oilfield and Different Brines 167
7.2.8 Biogeochemical Cycle of Arsenic 168
7.3 Chemistry of Chromium in Aquatic System 169
7.3.1 Biogeochemical Cycle of Chromium 171
7.3.1.1 Oxidation of Cr (III) 171
7.3.1.2 Reduction of Cr(VI) 171
7.4 Conclusion 172 References 172
8 Occurrences and Mobility of Uranium in Soil Profile Due to Groundwater–Soil Interaction 181 Somenath Ganguly and Uday Bhan
8.1 Introduction 181
8.2 Uranium Mineralogy and Mode of Occurrences 183
8.3 Uranium Mobilization Due to Soil–Water Interaction 185
8.4 Hydro- Geochemistry of Uranium 187
8.5 Applicability of Uranium Mobility in Groundwater Management, Geochemical Hydrocarbon Exploration, and Earthquake Prediction 189
8.6 Uranium Health Hazard 192
8.7 Conclusions 193
8.8 Case Studies 193
References 195
9 Study of the Rate of CO2 Consumption with Silicate and Carbonate Weathering in Aquatic System 199 Uday Bhan, Vamsi Krishna Kudapa , and Ranjit Kumar
9.1 Basic Information 199
9.2 Silicate Weathering 200
9.3 Weathering of Ca and Mg Silicates 202
9.4 Carbonate Weathering 202
9.5 Rate of Silicate Weathering and CO2 Consumption 204
9.5.1 Rate of Silicate Weathering 204
9.5.2 Rate of Carbon Consumption (CCR) During Silicate Rock Weathering 205
9.6 Importance of Weathering as a Carbon Sequestration Mechanism 206
9.7 Case Study – Himalayan Glaciers 207
9.8 Conclusion 208
References 208
10 Carbonate Chemistry, Carbon Cycle, and Its Sequestration in Aquatic System 213 Mallika Vashist, Harshit Chawla, and S. K. Singh
10.1 Introduction 213
10.2 Carbon Cycle in Aquatic Systems 214
10.3 Reactivity of Carbonate System 215
10.3.1 The Contemporary Marine CaCO3 Cycle 217
10.3.2 Formation and Pathway of CaCO3 219
10.3.3 Destruction and Dissolution of CaCO3 220
10.3.3.1 Bio-erosion 221
10.4 Present-Day Changes in the Seawater CO2: Carbonic Acid System Due to Anthropogenic Activities 221
10.5 Impact on Marine CaCO3 Cycle Owing to Anthropogenic Ocean Acidification 222
10.5.1 Formation of CaCO3 222
10.5.2 Dissolution of CaCO3 223
10.6 Biological, Ecological, and Biogeochemical Impacts 224
10.7 Risk Mitigation and Adaptation Strategies 225
10.8 Conclusion 226
References 226
11 Recent Trends in Fate, Transport, and Transformation of Inorganic and Organic Carbon in Freshwater Reservoirs 233
Sanchit Kumar and Anshumali
11.1 Introduction 233
11.2 The Influx of Carbon to the Reservoir 234
11.2.1 Autochthonous 235
11.2.2 Allochthonous 237
11.3 Mineralization and Biogeochemical Transformation of C in the Reservoir 237
11.3.1 Organic Carbon 237
11.3.2 Inorganic Carbon 241
11.3.3 Accumulation and Mineralization of C 242
11.4 Driving Factors Controlling the C Cycle in Reservoirs 242
11.4.1 Biotic Factors 242
11.4.1.1 Vegetation 242
11.4.1.2 Indigenous Primary Production 243
11.4.1.3 Microbial Degradation 244
11.4.2 Abiotic Factors 244
11.4.2.1 Watershed Area 244
11.4.2.2 Photodegradation 245
11.4.2.3 Hydraulic Retention Time 245
11.4.2.4 Seasonal Variability 246
11.4.2.5 Sedimentation 247
11.5 Carbon Cycling in Relation with Other Nutrients (N and P) 247
11.6 Source vs Sink 249
11.7 Water Drawdown Area as a New Emission Hotspot 251
11.8 Climate Change Effects on C Dynamics in Reservoirs 253
11.9 Conclusion 253
References 254
12 Role of Microbes in Controlling the Geochemical Composition of Aquatic Ecosystems 265
Shilky (ORCID: 0000-0001-8292-0385), Subhashree Patra (ORCID: 0000-0002-4624-6968), Anamika Harshvardhan (ORCID: 0000-0002-0540-1220), Amit Kumar (ORCID: 0000-0002-4582-5677), and Purabi Saikia (ORCID: 0000-0001-5481-282X)
12.1 Introduction 265
12.2 Microbial Communities of Aquatic Bodies and Their Role in Geochemical Processes 267
12.3 Role of Microorganisms in Water Quality Management 271
12.4 Problems and Prospects of Using Microbes in Water Quality Management 273
12.5 Future Research Prospects and Recommendation 273
12.6 Conclusions 274
References 274
13 Impacts of Pollution on the Hydrogeochemical and Microbial Community of Aquatic Ecosystems in Bayelsa State, Southern Nigeria 283 Sylvester Chibueze Izah, Adams Ovie Iyiola, and Glory Richard
13.1 Introduction 283
13.2 Characteristics of Aquatic Ecosystems in Bayelsa State 284
13.2.1 Hydrogeochemistry of Aquatic Ecosystems in Bayelsa State 284
13.2.2 Microbial Community of Aquatic Ecosystems in Bayelsa State 289
13.3 Anthropogenic Activities Causing Pollution of Aquatic Ecosystem in Bayelsa State 289
13.3.1 Houseboat on the Water 289
13.3.1.1 Oil and Gas Pollution 292
13.3.1.2 Emissions of Carbon Dioxide 292
13.3.1.3 Cleaning Solutions and Other Chemicals 293
13.3.1.4 Impacts of Boat Repairs and Maintenance 293
13.3.1.5 Human Wastes and Garbage 293
13.3.1.6 Noise Pollution 294
13.3.2 Agricultural Activities 294
13.3.3 Lumbering Activities 295
13.3.4 Transportation 295
13.3.5 Oil and Gas Exploration 296
13.3.6 Dredging 296
13.3.7 Wastes 297
13.3.8 Flooding 297
13.3.9 Marketing Activities 297
13.3.10 Sources of Pollution 297
13.3.11 Point Source Pollutants 297
13.3.12 Non-point Pollution Source 297
13.3.13 Effects of Point and Non-point Pollutants 298
13.4 Impacts of Pollutants on Microbial Ecology and Hydrogeochemistry in Bayelsa State 299
13.4.1 Hydrogeochemistry of Aquatic Ecosystems 299
13.4.2 Microbial Ecology of Aquatic Ecosystems 300
13.5 Mitigation of Pollution on the Aquatic Ecosystem 300
13.6 Conclusion 301
References 301
14 Aquatic Eco-systems Under Influence of Climate Change and Anthropogenic Activities: Potential Threats and Its Mitigation Strategies 307 Suryadipta Mukherjee, Syed Shams Rizvi, George Biswas, Abhilash Kumar Paswan, Suantak Paolalsiam Vaiphei, Taufique Warsi, and Tarik Mitran
14.1 Introduction 307
14.2 Aquatic Ecosystems 308
14.2.1 Freshwater Ecosystem 308
14.2.1.1 Lotic Ecosystem 309
14.2.1.2 Lentic Ecosystem 310
14.2.1.3 Wetlands (Mixed Type) 310
14.2.2 Marine Ecosystem 310
Contents x
14.3 Emerging Issues in the Aquatic Ecosystem 311
14.3.1 Food Security 311
14.3.2 Fisheries 312
14.3.3 Marine and Ocean Life 312
14.3.4 Water Quality 313
14.3.5 Climate Change 313
14.3.6 Infectious Diseases 313
14.3.7 Destructive Algae 313
14.3.8 Emerging pollutants 314
14.3.9 Microplastic Contamination 314
14.3.10 Freshwater Salinization 314
14.3.11 Calcium Deficiency 314
14.4 Impact of Climate Change on Aquatic Ecosystems 315
14.4.1 Climate Change and Freshwater Ecosystems 316
14.4.2 Climate Change and Marine Ecosystem 318
14.4.2.1 Salinity 318
14.4.2.2 Ocean Heat and Sea Surface Temperature 318
14.4.2.3 pH 319
14.4.2.4 Oceanic Nutrients 320
14.4.2.5 Dissolved Gases 320
14.4.3 Climate Change and Wetland Ecosystem 320
14.5 Protection, Adaptation, and Mitigation Strategies 322
14.6 Worst Case Scenario: Evidence of Anthropogenic Impact on Bengaluru Lakes: From “City of Lakes” to the “City of Froth Lakes” 323
14.6.1 Cause of Fire in an Aquatic Environment 324
14.6.2 Protection and Mitigation to Conserve Aquatic Ecosystem 325
14.7 Conclusion 325
References 325
15 Role of Stable Isotopes in Groundwater Resource Management 333
Syed Shams Rizvi, M. A. Mohammed-Aslam, Zameer Ahmad Shah, Taufique Warsi, Mohammad Muqtada Ali Khan, Tarik Mitran, and Shyam Kanhaiya
15.1 Introduction 333
15.2 Background 334
15.2.1 Isotope Systematics 334
15.2.2 Isotope Fractionations 335
15.2.2.1 O and D in Precipitation 336
15.2.2.2 Deuterium Excess 337
15.2.2.3 Continental Effect 337
15.2.2.4 Seasonal Effect 338
15.2.2.5 Latitude Effect 338
15.2.2.6 Altitude Effect 338
15.2.3 Methodology and Precautions in the Collection of Rainwater Samples 338
15.2.3.1 Rainwater Collection Techniques 339
15.2.3.2 Principle of Isotope Ratio Mass Spectrometer 339
15.2.4 Application of Isotopes in Water Resource Management 339
15.2.4.1 Interconnections Between Surface and Groundwater 340
15.2.4.2 Tracking Sources of Groundwater Recharge 340
15.2.4.3 Groundwater Age or Groundwater Dating 341
15.2.4.4 Source and Mechanism of Groundwater Pollution 341
15.2.4.5 Sanitary Landfills 341
15.2.4.6 Agriculture Watersheds 342
15.2.4.7 Groundwater Salinization 342
15.3 Utilization of Water Isotopes in Hydrology: A Case Study 342
15.3.1 Study Site 342
15.3.2 Findings and Discussions 342
15.3.2.1 Estimation of d-excess 346
15.3.2.2 Estimation of the Amount Effect 346
15.3.2.3 Estimation of Seasonal Variations 348
15.4 Conclusion 349
15.5 Summary and Conclusions 350 Acknowledgements 350
References 351
16 Assessment of Causes and Impacts of Sand Mining on River Ecosystem 357
Soumya Pandey , Gaurav Kumar, Neeta Kumari, and Richa Pandey
16.1 Introduction 357
16.2 Why River Sand? 359
16.3 Processes of Sand Mining 360
16.4 Monitoring of Sand Mining Activities 362
16.5 Sand Mining: A Threat to Aquatic Ecosystem 364
16.6 Impacts of Sand Mining on Components of Riverine Ecosystem 365
16.6.1 Impacts on River Morphology and Sediment 366
16.6.2 Impacts on Water Quality and Aquatic Life 367
16.6.3 Sand Bank Filtration 367
16.7 Remediation Alternative 368
16.8 Conclusion 370
References 370
17 Nutrient Dynamics in the Polar Ice Sheets and Mountain Glaciers: A Review 381
Monica Sharma Shamurailatpam, AL. Ramanathan, and N. Janardhana Raju
17.1 Introduction 381
17.2 Nutrient Dynamics: Transformation, Storage, and Export in the Glacial Environment 383
17.2.1 Dissolved Organic Carbon 383
17.2.2 Nitrogen 388
17.2.3 Phosphorus 391
17.3 Factors Influencing Nutrients Concentration and Flux 393
17.3.1 Climatically Driven Export of Nutrients 393
17.3.2 Microbial Driven Nutrients Productivity 394
17.4 Conclusion 395
Acknowledgments 396
References 396
List of Contributors
Bedour Al Sabti
Water Research Center, Kuwait Institute for Scientific Research, Safat, Kuwait
Anshumali
Department of Environmental Science and Engineering, Indian Institute of Technology (Indian School of Mines), Dhanbad, Jharkhand, India
Uday Bhan
Department of Petroleum Engineering & Earth Sciences, UPES, Dehradun, Uttarakhand, India
George Biswas
Department of Geology, Presidency University, Kolkata, West Bengal, India
Umakant Chaudhari
Department of Environmental Science and Technology, Central University of Punjab, Bathinda, Punjab, India
Harshit Chawla
Department of Environmental Engineering, Delhi Technological University, Delhi, India
Chidambaram Sabarathinam
Water Research Center, Kuwait Institute for Scientific Research, Safat, Kuwait
Fatemah M. Dashti
Water Research Center, Kuwait Institute for Scientific Research, Safat, Kuwait
Chitrangada Debsarma
School of Environment and Sustainable Development, Central University of Gujarat, Gandhinagar, Gujarat, India
Dhanu Radha Samayamanthula
Water Research Center, Kuwait Institute for Scientific Research, Safat, Kuwait
Kamal Dua
Discipline of Pharmacy, Graduate School of Health, University of Technology Sydney, Broadway, NSW, Australia
Somenath Ganguly
Department of Petroleum Engineering & Earth Sciences, University of Petroleum and Energy Studies, Dehradun, Uttarakhand, India
A. K. Haritash
Department of Environmental Engineering, Delhi Technological University, Delhi, India
Anamika Harshvardhan
Silviculture and Forest Management Division, Institute of Wood Science and Technology, Bengaluru, Karnataka, India
Mohammad Hashim
Department of Geography, Faculty of Natural Sciences, Jamia Millia Islamia, New Delhi, India
Adams Ovie Iyiola
Department of Fisheries and Aquatic Resources Management; Faculty of Renewable Natural Resources Management; College of Agriculture and Renewable Natural Resources, Osun State University, Osogbo, Osun State, Nigeria
Sylvester Chibueze Izah
Department of Microbiology, Faculty of Science, Bayelsa Medical University, Yenagoa, Bayelsa State, Nigeria
Sourav Kalra
Chitkara University School of Pharmacy, Chitkara University, Baddi, Himachal Pradesh, India
Shyam Kanhaiya
Department of Earth and Planetary Sciences, VBS Purvanchal University, Jaunpur, Uttar Pradesh, India
Neha Kanojia
Chitkara University School of Pharmacy, Chitkara University, Baddi, Himachal Pradesh, India
Oznur Karaca
Department of Geological Engineering, Canakkale Onsekiz Mart University, Canakkale, Turkey
Mohammad Muqtada Ali Khan
Department of Geoscience, Faculty of Earth Science, Universitii Malaysia Kelantan, Jeli, Kelantan, Malaysia
Vamsi Krishna Kudapa
Department of Chemical Engineering, UPES, Dehradun, Uttarakhand, India
Amit Kumar
Department of Geoinformatics, Central University of Jharkhand, Ranchi, Jharkhand, India
Gaurav Kumar
Civil and Environmental Engineering, Birla Institute of Technology, Ranchi, Jharkhand, India
Ranjit Kumar
Department of Chemistry, UPES, Dehradun, Uttarakhand, India
Sanchit Kumar
Department of Environmental Science and Engineering, Indian Institute of Technology (Indian School of Mines), Dhanbad, Jharkhand, India
Neeta Kumari
Civil and Environmental Engineering, Birla Institute of Technology, Ranchi, Jharkhand, India
Tarik Mitran
Soil and Land Resources Assessment Division, National Remote Sensing Centre, Balanagar, Hyderabad, Telangana, India
Sunil Mittal
Department of Environmental Science and Technology, Central University of Punjab, Bathinda, Punjab, India
M. A. Mohammed-Aslam
Department of Geology, Central University of Karnataka, Kalaburagi, Karnataka, India
Suryadipta Mukherjee
Department of Geology, Presidency University, Kolkata, West Bengal, India
List of Contributors
Hasan Raja Naqvi
Department of Geography, Faculty of Natural Sciences, Jamia Millia Islamia, New Delhi, India
Binod Kumar Nath
Public Works (Roads) Department Office of the Chief Engineer, PWD (Roads) Chandmari, Guwahati, Assam, India
Samikshya Panda
Department of Agricultural Engineering, Institute of Agricultural Sciences, Banaras Hindu University, Varanasi, Uttar Pradesh, India
Richa Pandey
Department of Mechanical Engineering, Birla Institute of Technology, Ranchi, Jharkhand, India
Soumya Pandey
Civil and Environmental Engineering, Birla Institute of Technology, Ranchi, Jharkhand, India
Abhilash Kumar Paswan
Department of Physical Science, Academy of Scientific and Innovative Research, Ghaziabad, Uttar Pradesh, India; Department of Hydrogeochemistry, CSIRNational Geophysical Research Institute, Hyderabad, Telangana, India
Subhashree Patra
Department of Environmental Sciences, Central University of Jharkhand, Ranchi, Jharkhand, India
Harsh Pipil
Department of Environmental Engineering, Delhi Technological University, Delhi, India
N. Janardhana Raju
School of Environmental Sciences, Jawaharlal Nehru University, New Delhi, India
AL. Ramanathan
School of Environmental Sciences, Jawaharlal Nehru University, New Delhi, India
Glory Richard
Department of Community Medicine, Faculty of Clinical Sciences, Niger Delta University, Wilberforce Island, Bayelsa State, Nigeria
Syed Shams Rizvi
Department of Geology, Central University of Karnataka, Kalaburagi, Karnataka, India
Prafulla Kumar Sahoo
Department of Environmental Science and Technology, Central University of Punjab, Bathinda, Punjab, India; InstitutoTecnologico Vale, Belem, PA, Brazil
Paulami Sahu
School of Environment and Sustainable Development, Central University of Gujarat, Gandhinagar, Gujarat, India
Purabi Saikia
Department of Environmental Sciences, Central University of Jharkhand, Ranchi, Jharkhand, India
Zameer Ahmad Shah
Geological Survey of India, U.T. Jammu and Kashmir, NR-Srinagar, India
Monica Sharma Shamurailatpam
School of Environmental Sciences, Jawaharlal Nehru University, New Delhi, India
List of Contributors
Reema Sharma
Department of Agricultural Engineering, Institute of Agricultural Sciences, Banaras Hindu University, Varanasi, Uttar Pradesh, India
Shilky
Department of Environmental Sciences, Central University of Jharkhand, Ranchi, Jharkhand, India
Shrinivasa D. J.
Department of Agricultural Engineering, Institute of Agricultural Sciences, Banaras Hindu University, Varanasi, Uttar Pradesh, India
Lubna Siddiqui
Department of Geography, Faculty of Natural Sciences, Jamia Millia Islamia, New Delhi, India
Masood Ahsan Siddiqui
Department of Geography, Faculty of Natural Sciences, Jamia Millia Islamia, New Delhi, India
Abhra Singh
Department of Geography, Faculty of Natural Sciences, Jamia Millia Islamia, New Delhi, India
Harminder Singh
School of Chemical Engineering and Physical Science, Lovely Professional University, Phagwara, India
Risha Singh
Centre for the Study of Regional Development, Jawaharlal Nehru University, New Delhi, India
S. K. Singh
Department of Environmental Engineering, Delhi Technological University, Delhi, India
Sonam Taneja
Department of Environmental Engineering, Delhi Technological University, Delhi, India
Shivani Thakur
Department of Environmental Science and Technology, Central University of Punjab, Bathinda, Punjab, India
Vinod Kumar Tripathi
Department of Agricultural Engineering, Institute of Agricultural Sciences, Banaras Hindu University, Varanasi, Uttar Pradesh, India
Suantak Paolalsiam Vaiphei
Department of Hydrogeochemistry, CSIRNational Geophysical Research Institute, Hyderabad, Telangana, India
Mallika Vashist
Department of Environmental Engineering, Delhi Technological University, Delhi, India
Nitin Verma
Chitkara University School of Pharmacy, Chitkara University, Baddi, Himachal Pradesh, India
Taufique Warsi
WOTR Centre for Resilience Studies (W-CReS), Watershed Organisation Trust (WOTR), Pune, Maharashtra, India
Shivani Yadav
Department of Environmental Engineering, Delhi Technological University, Delhi, India
Editors’ Biography
Sughosh Madhav Dr. Sughosh Madhav is presently working as Dr. D. S. Kothari Postdoctoral Fellow (DSKPDF) in the Department of Civil Engineering, Jamia Millia Islamia, New Delhi, India. He has obtained his master’s degree from the Department of Environmental Science, Banaras Hindu University, Varanasi, India. He earned his doctorate from Jawaharlal Nehru University, New Delhi. The area of his doctoral research is the environmental impact of industrial effluents on groundwater and soil quality. He has published various research papers and book chapters in the field of environmental geochemistry, water pollution, wastewater remediation, and climate change. He also edited seven books for Wiley, Springer, and Elsevier publications on various environmental issues.
Virendra Bahadur Singh Dr. Virendra Bahadur Singh is presently working as an assistant professor in the Department of Environmental Studies, Ram Lal Anand College, University of Delhi, New Delhi, India. He has worked as Dr. D. S. Kothari Postdoctoral Fellow (DSKPDF) in the Department of Geology, University of Delhi, Delhi, India. He has also worked as National Postdoctoral Fellow (NPDF) at the Department of Civil Engineering, Indian Institute of Technology Delhi, New Delhi, India. He obtained his doctoral degree from School of Environmental Sciences, Jawaharlal Nehru University, New Delhi, India. His research work is mainly focused on hydrogeochemistry, biogeochemistry, hydrology, hydro-meteorological correlation, and suspended sediment transport. He has published more than 30 research papers in various reputed journals and also edited 2 books for Wiley and Elsevier publications.
Manoj Kumar Dr. Manoj Kumar is presently working as an assistant professor in the Department of Environmental Studies, Central University of Haryana, India. He has obtained his master’s degree and doctorate degree from Jawaharlal Nehru University, New Delhi, India. The area of his doctoral research is Solute Geochemistry and Arsenic Fate in the Aquifers of Central Gangetic Basin, India. He has published several research papers in journals of international repute and book chapters in the field of hydrogeochemistry, groundwater pollution, and health risk assessment.
Sandeep Singh Prof. Sandeep Singh is working as a professor in the Department of Earth Sciences, Indian Institute of Technology, Roorkee, India. He obtained his master’s and PhD degrees from the University of Roorkee (IIT, Roorkee). His research interest includes geochronology, isotope geology, exhumation processes, and Sr-isotopes in the water system. He has published more than 70 research papers in reputed journals. He is a regular reviewer of various international journals. He has earned various reputed awards, and he is a member of numerous respected academic societies. Prof. Singh is a well-known geologist and has a wide experience in isotopic geology and hydrogeochemistry.
Preface
Hydrogeochemistry has always been a subject to solve the relationships between groundwater, surface water, and aquatic systems’ chemical characteristics and their relationship with the area’s geology. The phenomenon of hydrogeochemical variations depends on various geochemical processes, like weathering, evaporation, and dissolution, and diverse anthropogenic activities that control the aquatic systems’ hydrogeochemistry. Almost all aquatic systems are affected by human interventions, causing several problems. Further climate change also impacts the hydrogeochemistry of different ecosystems. It is, therefore, vital to understand the current status of the aquatic systems to manage and mitigate the impacts. This book covers current issues related to hydrogeochemistry of natural aquatic systems, including river, glaciers, lake, and sub- surface ecosystems, processes involved, and human beings’ interference. This book tries to address all the major impending problems related to hydrogeochemistry of surface and sub- surface water with a certain degree of solutions to manage and conserve water resources. The various chapters will help to understand the processes and factors controlling the hydrogeochemistry of water resources. The book discusses multiple hydrogeochemical techniques like nutrient geochemistry, solute acquisition processes, water–sediment interactions, enrichment of geogenic elements like arsenic, fluoride, and uranium, anthropogenic addition, and biogeochemical cycling of metals, CO2 consumption rate in the surface water bodies, sand mining in rivers, and hydrogeochemical modeling. The other highlights of the book are carbon dynamics and its sequestration in surface water bodies, soil–water interactions, and sediment loading in aquatic ecosystems. The book encompasses knowledge on isotopic studies, microbial control in hydrogeochemistry along nutrient dynamics of the polar ice sheet and glaciers. The work contained in the book covers holistic and in- depth knowledge of the hydrogeochemistry of different aquatic ecosystems.
The chapters in the book address the impending problems with a certain degree of solutions to manage and conserve water resources. This book contains both practical and theoretical aspects of the hydrogeochemistry of aquatic systems. It will be helpful for undergraduate and graduate university students or researchers and teachers, environmental engineers, and scientists working in water resource management, environmental studies, and social issues. It will also be helpful for researchers and stakeholders from all
Preface
the sectors of industries and governmental agencies who are directly or indirectly associated with water resource research and management.
We tried a humble attempt to reflect upon the various aspects of aquatic hydrogeochemistry, hoping that it would be a significant addition to the already available literature. The contributors to the book having different backgrounds provide a holistic approach to the topic imbibing diverse practices and perspectives. We express our sincere gratitude to all the contributors and publishers for producing a remarkable and meaningful edited volume on an important issue.
Fluoride in Groundwater: Distribution, Sources, Processes, Analysis, and Treatment Techniques: A Review
Bedour Al Sabti, Dhanu Radha Samayamanthula, Fatemah M. Dashti, and Chidambaram Sabarathinam
Water Research Center, Kuwait Institute for Scientific Research, Safat, Kuwait
1.1 Introduction
Fluoride (F ) belongs to the halogen family and is a constituent in minerals such as fluorite, fluorspar, apatite, biotite, cryolite, and muscovite (Bretzler and Johnson 2015; Dehbandi et al. 2017), apart from its availabilities in plants, soil, and groundwater. Groundwater is one of the most important sources of drinking water and one of the fundamental human rights around the globe is an access to safe drinking. Contamination and unsustainable drinking water sources could affect human health, resulting in the transmission of diseases (WHO 2018). Fluoride is one of the ions which may lead to groundwater contamination if present in high concentrations. Although high F in groundwater is a major concern that is still being debatable around the globe, fluoride is essential for the growth of the dental and skeletal frame of the body. Fluoride concentration in groundwater differs from one region to another based on aquifer material, geology, weathering rate, aquifer depth, contact time, pH, rainfall, and temperature (Brunt et al. 2004; Onipe et al. 2020). The geochemical process governs fluoride mobility through leaching from soil and rocks to the groundwater. Studies suggest that exposure to high fluoride imparts a vulnerable effect on the mental ability of children. The IQ levels of children exposed to higher F are lower than unaffected children (Choi et al. 2012; Das and Mondal 2016). The thyroid gland is susceptible to F , which causes an increase in thyroid-stimulating hormone (TSH) leading to a drop in Triiodothyronine (T3) and Thyroxine (T4) levels, thereby resulting in hypothyroidism (McLaren 1976; Shashi 1988; Kumar et al. 2019). Fluorosis results from a high concentration of fluoride in drinking water and depends on other sources such as dietary habits that enhance the incidence of fluorosis (Brindha and Elango 2011; Srivastava and Flora 2020). Several countries, such as West Indies, India, Poland, China, Spain, Africa, and Italy, have been reported with high fluoride concentrations (Huang et al. 2017). The geochemical data for Cameroon, Algeria, Ghana, United Kingdom, Siri Lanka, Argentina, Canada, Tanzania, Kuwait, South Africa (Silom), India (Telangana), and Brazil were
Hydrogeochemistry of Aquatic Ecosystems, First Edition. Edited by Sughosh Madhav, Virendra Bahadur Singh, Manoj Kumar, and Sandeep Singh. © 2023 John Wiley & Sons Ltd. Published 2023 by John Wiley & Sons Ltd.
1 Fluoride in Groundwater: Distribution, Sources, Processes, Analysis, and Treatment Techniques: A Review
collected from the literature to understand the geochemistry of F (Table 1.1). Some of the published data for selected countries does not contain the complete analysis results. Based on the available ions in the analytical data, they were used for statistical analysis using Statistical Package for Social Sciences (SPSS) software. The same analytical data were used
Table 1.1 Lithology and analytes considered from the literature studies of various countries but clay minerals like Vermiculite have also reported to be a source of F in groundwater due to the process of Fluoride ion.
CountryLithology type
AlgeriaSedimenatary (sand and gravel, limestone, clay, and shale)
ArgentinaThick sedimentary rock and volcanoclastic mineral
Brazil Sedimentary
Canada—
Central Africa (Cameroon)
Crystalline basement (granite)/ Tertiary sedimentary rocks
GhanaPrecambrian crystalline and igneous rocks (granite)
India (Telangana)
Igneous rock (granite)
KuwaitSedimentary siliciclastic and carbonates
South Africa (Silom)
Sri LankaHigh-grade metamorphic rock
TanzaniaVolcanic rock and metamorphic
United Kingdom
Analytes
pH, EC, Ca2+, Mg2+, Cl–, SO42–, HCO3–, F–
pH, EC, temperature, Na+, K+, Ca2+, Mg2+, Cl–, SO42–, HCO3–, CO32– F–, NO3–, Si, Fe2+, Al3+, Be2+, U, B
pH, EC, Ca2+, Mg2+, Cl–, SO42–, HCO3–, F–
pH, EC, temperature, Na+, K+, Ca2+, Mg2+, Cl–, SO42–, HCO3–, CO32– F–, NO3–, Si, Fe2+, Al3+, Be2+, U, B
pH, EC, temperature, Na+, K+, Ca2+, Mg2+, Cl–, SO42–, HCO3–, F–, NO3–
pH, EC, TDS, temperature, Na+, K+, Ca2+, Mg2+, Cl–, SO42–,HCO3–,CO32– F–,NO3–
pH, EC, TDS, temperature, Na+, K+, Ca2+, Mg2+, Cl–, SO42–, HCO3–, CO32– F–, NO3–, B, NH4+, PO43–, SiO2, Fe2+, Al3+, Ba2+, Li+, Mn2+, Mo, Ni2+, Zn2+
pH, EC, TDS, temperature, Na+, K+, Ca2+, Mg2+, Cl–, SO42–, HCO3–, CO32– F–, NO3–, PO43–
pH, EC, temperature, Na+, K+, Ca2+, Mg2+, Cl–, SO42–, HCO3–, CO32– F–, NO3–, Si, Fe2+, Al3+, Be2+, U, B
Reference
Messaitfa (2007)
Ganyaglo et al. (2019); Jayawardana et al. (2012); Edmunds and Smedley (2013)
Rockett et al. (2013)
Ganyaglo et al. (2019); Jayawardana et al. (2012); Edmunds and Smedley (2013)
Fantong et al. (2009)
Sunkari an Abu (2019)
Narsimha and Sudarshan (2017)
Al-Senafy et al. (2011)
Onipe et al. (2021)
Ganyaglo et al. (2019); Jayawardana et al. (2012); Edmunds and Smedley (2013)
1.2 Permissible imits oo Fluoridein Drinninng ater 3 for different plots developed from the output results of WATEQ4F and AQUACHEM. The objective of this review is to emphasize the global distribution, sources, analysis, and treatment strategies for excessive fluoride levels in groundwater. Also, the review presents geochemical plots, statistical techniques, thermodynamic and modeling approaches to determine processes governing the fluoride release and distribution in groundwater.
1.2 Permissible Limits of Fluoride in Drinking Water
According to the WHO (2006), the maximum permitted level of F in drinking water is 1.5 mg/L. While the USPHS (1987) established a range of allowable F concentration in drinking water for regions based on their climatic conditions, because the amount of water consumed and, the amount of F ingested is primarily influenced by the air temperature. The rise in air temperature decreases the concentration of F . The maximum permissible level in tropical climates with temperatures above 26 °C is 1.4 mg/L. In light of the Indian subcontinent’s environmental and socioeconomic situation, the F desirable limit is established at 0.6–1.2 mg/L, and the highest allowed level in the absence of any other source is set at 1.5 mg/L for drinking water (ISI 1995). The limit was set based on the daily consumption rate of water, about 2 L/day for an adult body mass, and contains about 0.2–0.5 mg fluorine as a standard diet (WHO 1994). A range of environmental, social, cultural, economic, and other circumstances affecting possible exposure, as well as the default assumptions used to create the guideline values, will need to be taken into account when creating national drinking-water standards based on these guideline values. In addition, the environmental-based variation depends on the region, as regional diets and ambient temperature control the permissible limit (Apambire et al. 1997). Furthermore, in a country with a constant warm environment and piped water as the main drinking-water source, authorities may choose a lower health-based fluoride target than this guideline value as water consumption is predicted to be higher (Guidelines for drinking-water quality 2021). Drinking water from groundwater may be beneficial or harmful depending on the concentration level of fluoride. In recent years, countries have been developing drinking standards to decrease waterborne diseases and improve safe water resources management (Ali et al. 2019). As the concentration of F in drinking water is different for each country, and the amount of water consumed by a person also varies concerning the climate and availability, so each region has its own standard (Figure 1.1). Drinking high fluoride groundwater is the primary reason for endemic fluorosis in the countries such as China (Guo et al. 2007). Higher F concentration in groundwater, i.e. exceeding the permissible limit of WHO, is observed in countries like Japan, Cameroon, China, Turkey, India, Sri Lanka, Iran, Pakistan, Brazil, and Canada. Fluorosis, on the other hand, is caused by a high quantity of fluoride in drinking water and is exacerbated by other factors such as dietary choices (Brindha and Elango 2011).
Fluoride concentrations above the permissible limit are harmful to human health, such as dental fluorosis, crippling skeletal fluorosis, and skin lesions (Rasool et al. 2017), and it also depends on the amount of intake, duration of exposure, and gastrointestinal traces. The absorbed fluoride from the food sources in the digestive system is about 30–40% (Kumar et al. 2019).
Figure 1.1 A radar char t representing the maximum fluoride concentration standard for each country as specified. Data Source: Guo et al. (2007), Jagtap et al. (2012), Abu-Zeid and El-Hatow (2007), and KEPA (2017).
1.3 Concentration of High Fluoride Around the Globe
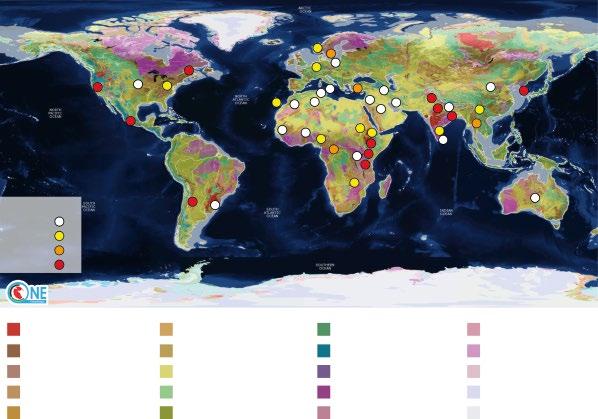
Data for groundwater samples signifying maximum value fluoride concentration were collected from literature studies to represent the highest value of F distribution in a world map (Figure 1.2). The map represents a total of 46 regions with F concentration above the allowable limits, reaching up to 160 mg/L. One of the highest F concentration values that was found with a total of 160mg/L, found to be reported in California, North America (McMahon et al. 2020). The high fluoride concentration as it is shown on the map mostly represents the igneous and metamorphic rock formations predominantly around the tropical region. However, elevated fluoride concentration may result from various sources affecting the groundwater to be discussed in the following section.
1.4 Sources of Fluoride in Groundwater
Fluoride in groundwater occurs in variable concentrations and <1.0 mg/L is generally reported in natural waters (Hem 1985). Anion exchanges, solubility of minerals, temperature, pH, nature of the aquifers, matrix, and availability of complexing ion, residence time, and chemical composition of the groundwater are the main governing factors affecting the concentration of F (Apambire et al. 1997). The presence of F in groundwater is mostly caused by natural or geogenic contamination (Manikandan et al. 2014). Chemical
>1.5–6.5
6.5–11.5
11.5–16.5
F>16.5
Extrusive volcanic rocks (Lower Paleozoic to Neoproterozoic) Fluoride
World CGMW 1:50M geological units onshore (the below legend are highlighted with respect to high F concentration locations in the map)
Large igneous province
Endogenous rocks (Mesoproterozoic)
Sedimentary rocks (Lower Paleozoic)
Endogenous rocks (Neoproterozoic)
Sedimentary rocks (Upper Paleozoic)
Sedimentary rocks (Cenozoic)
Sedimentary rocks (Mesozoic)
Sedimentary rocks (Mesozoic)
Extrusive volcanic rocks (Cenozoic)
Extrusive volcanic rocks (Paleoproterozoic to Archean)
Undifferentiated Facies (Archean)
Endogenous rocks (Paleoproterozoic)
Subglacial bedrock located below sealevel
Sedimentary rocks (Neoproterozoic)
Sedimentary rocks (Cenozoic)
Endogenous rocks (Paleoproterozoic)
Endogenous rocks (Paleoproterozoic)
Undifferentiated Facies (Archean) Glacier, Inland Ice
Figure 1.2 Global map represents the maximum fluoride values concentration which is above the standard limits in different regions. The lithology legend highlights only the areas of high fluoride concentration in groundwater. Source: Reproduced with the permission of the OneGeology. All rights reserved.
in Groundwater: Distribution, Sources, Processes, Analysis, and Treatment Techniques: A Review
weathering, atmospheric dust from continental sources, industrial pollutants, and magmatic emissions are also potential sources of F (Gizaw 1996). In other words, F reaches groundwater due to input from natural or anthropogenic sources or both. Fluorides can be transported to groundwater via water–rock interaction by different fluoride-bearing minerals (Narsimha and Sudarshan 2017). This interaction is used to examine the geogenic input of fluoride in groundwater aquifers from various forms of fluoride minerals.
1.4.1 Natural Sources
The parent rock serves as the primary source of fluoride in groundwater. Thus, various geochemical studies have been performed on various aspects of fluoride in groundwater. Some rock types showed a higher fluoride concentration than others with groundwater, such as volcanic zones with geothermal sources, sedimentary basins, and crystalline basement aquifers (Edmunds and Smedley 2005). An average F concentration of 715 mg/kg is observed in igneous rocks globally (Gizaw 1996). These rocks are likely to be formed in volcanic areas with magmas enriched with fluoride concentration, and the sodium plagioclase is most likely to form soft groundwater that allows higher fluoride production when reaching equilibrium (Ozsvath 2006). Fluorine can be present in different igneous rockforming minerals such as mica, apatite, amphiboles, pegmatite, and certain types of clay (Ayoob and Gupta 2006). The predominant minerals are depicted in Table 1.2, but clay minerals like Villiaumite have also reported to be a source of F in groundwater due to the process of ion exchange (Handa 1975; Pickering 1985; Wenzel and Blum 1992; Bardsen et al. 1996; Subba Rao and Devadas 2003). Fluoride concentrations, on the other hand, are frequently related to water–rock interaction to a certain degree because fluoride is mostly from lithology (Manikandan et al. 2014). The hydrogeochemical studies in groundwater had reported several mechanisms of F release based upon the composition of the aquifer matrix, the physio chemical conditions, and the rock–water interaction. They have also inferred that the residence time in the aquifer and temperature also play a major role in release of F from the rock matrix to groundwater. Some researchers have studied the
Table 1.2 Classification of fluoride minerals in different rock types with their chemical composition.
S.No.Mineral Rocks Chemical composition
1 Fluorite
CaF2 Pegmatite, Metamorphosed, Limestone CaF2
2 Fluorspar Pegmatite Pneumatolitic, Deposits
3 Tremolite Actinolite Clay
4 Rock PhosphateLimestone, Fossils
5 Lepidolite Gabbros, Dolerites
Source: Adapted from Yadav and Khan (2010).
CaF2.3Ca3(PO4)2
Ca2(MgFe2+)5(Si8O22)(OHF)2
NaCa2(MgFe2+)4(AlFe3+) (SiAl)8O22(OHF)2
K2(Li, Al)5(Si6Al2)O20(OHF)4
1.4 Sourcesoo Fluoridein Groundwater 7 relationship between water–rock interaction and F concentration in various aquifers having different geologic settings (Saxena and Ahmed 2003; Gaciri and Ad Davis 1993; Edmunds and Smedley 1996; Nordstrom et al. 1989; Nordstrom and Jenne 1977).
Groundwater development and management have encountered a serious issue due to the prevalence of F when harvesting or recharging structure areas located in granitic terrain. Fluorite is one of the minerals responsible for the presence of fluorine in nature, and it acts as an accessory mineral in granitic rocks (Ayoob and Gupta 2006). Deeper wells in granitic and gneissic aquifers often have higher fluoride contents. Fluorite (CaF2) present in the granitic formation is a dominant source of F (Deshmukh et al. 1995). It is to be noted that the rate of dissolution and stability of the mineral in freshwater is relatively low (Nordstrom and Jenne 1977). Hence, few studies have indicated that biotite mica is present as an accessory mineral in the granitic formation, to be the prime source of F in hosted groundwater for their favorable F , (OH) exchange (Saxena and Ahmed 2001). A pattern that has been documented in several inferences on groundwater collected from granitic regions (Yun et al. 1998a; White et al. 1963). The studies on samples from deep groundwater have indicated that the dissolution of F minerals in the rock matrix was governed by the depth of well, residence time, and temperature (Saxena and Ahmed 2003; Nordstrom et al. 1989). Higher residence time is generally found in massive hard rock aquifers and lesser in porous sedimentary formations. This is also an important fact that higher F in groundwater is more prevalent in hard rock aquifers. Fluoride can mix with clay by displacing the hydroxide from its surface in acidic water. F is adsorbed on the clay surface but desorbed from solid phases in alkaline water. The evaporation process can also cause fluoride enrichment in groundwater; however, the evaporation process is usually characterized by the preponderance of Cl ion in groundwater (Manikandan et al. 2014). Because of its granitic-type composition (alkaline), augen gneiss has the largest potential for higher groundwater fluoride. The augen gneiss is metamorphosed granite that contains fluoride-bearing minerals like biotite, hornblende, and distinctive Na-feldspar mega crystals that serve as a secondary source of sodium for fluoride enrichment (Addison et al. 2020). One of the important fluoride-bearing minerals is muscovite, with fluorine in its hydroxyl groups and crystal lattices that can act as fluoride substitutes due to their similar ionic charges. Among the micas apart from muscovite, biotite is also reported to have exchangeable F of octahedral sheet at the hydroxyl sites (Chidambaram et al. 2007). The lithological influences of F in groundwater were investigated by Singaraja et al. (2013), where the study stated that elevated F concentrations in groundwater were due to charnockite, hornblende biotite gneiss marine alluvium, and by flood plain alluvium. Higher concentration of F in hydrological systems also depends on the rate of recharge and the transport of the ion along with the groundwater flow. There is also a probability of reduction of F along the flow direction either due to mineral precipitation or removal by adsorption or by ion exchange process. The studies on the thermodynamic properties and the relative F enrichment in groundwater in the different geochemical environments are still scanty.
1.4.2 Anthropogenic Sources
Pollution that results from industries such as fabrication of aluminum, fertilizers, and steel has been reported to generate higher F through anthropogenic means to the natural environment (Datta et al. 2014). The use of phosphate fertilizer in agricultural operations also
1 Fluoride in Groundwater: Distribution, Sources, Processes, Analysis, and Treatment Techniques: A Review
results in the probable presence of fluoride in groundwater (Thivya et al. 2015) where phosphate fertilizers generally contain fluorine ranging from 1.3 to 3.0% (Mclaughlin et al. 1996). Apart from the above anthropogenic sources, pesticides, sewage and sludge, groundwater table depletion, and other agricultural practices have also been linked to a rise in F concentrations in groundwater (Srinivasamoorthy et al. 2007). F may infiltrate streams through adjacent uneven joints, cracks, and through damaged pipelines transporting household, agricultural, and industrial effluents (Datta et al. 2014). Farooqi et al. (2009) study illustrated that familiar source of F in the environment including air pollution from coal combustion and phosphate fertilizers, whereas soluble F in fertilizers ranged from 60 to 255 mg/kg, with a mean of 175 mg/kg. In contrast, total F in coal samples ranged from 5.12 to 20.1 mg/kg, with an average value of 10.2 mg/kg (Farooqi et al. 2009). However, only a small portion of overall fluoride exposure is typically attributed to air (Fawell et al. 2006). Another study by Loganathan et al. (2006) reported that fluoride concentrations in New Zealand agricultural surface soils varied from 212 to 617 μg F , which was significantly lower than the fluoride values reported in the literature for sites polluted with fluoride from industrial sources.
1.4.3 Health Effects
The association between human health and fluoride was first explored in the late nineteenth century when chemists discovered varying levels of fluorine in human bones, tissues, and teeth (Kanduti et al., 2016). Fluoride is vital to human health for developing strong bones and teeth, but only in trace amounts ranging between 0.5 and 1 mg/L worldwide (Addison et al. 2020; Ozsvath 2006). However, fluoride is also known to be a very toxic element to human health if it exceeds the average standard limits published by WHO (Narsimha and Sudarshan 2017). Fluoride operates as hydrofluoric acid and is absorbed by humans and animals through their skin, where it travels quickly through the circulatory system and is stored in teeth and bones, according to Hodge and Smith (1977). According to another study, fluorosis is widespread in more than 200 million people globally (Ayoob and Gupta 2006). High fluoride levels can result in severe health issues in both adults and children, including dental fluorosis, bone deformation, and skeletal fluorosis (Narsimha and Sudarshan 2017).
1.4.4
Dental Fluorosis
Dental fluorosis considers as an irreparable toxic condition that affects the human teeth cells as an early-stage sign of having a fluoride increase in the body (Ayoob and Gupta 2006). Any fluoride ingestion in water with a concentration above the standard limits may cause dental fluorosis (Apambire et al. 1997). A case study in India illustrated that out of 258 children in the study area were examined, and 84 of them were diagnosed with dental fluorosis with ages ranging between 3 and 17 years old. The dental signs of the patients were identified from their teeth, such as chalky white color stain, browning of the tooth surface, yellowish stain, deep brown or black discoloration, pitting, and teeth loss (Jha et al. 2009). Opaque white patches on teeth characterize the diagnosis of early-stage dental fluorosis, unlike the advanced stages where the teeth are displayed as pitting on the surface of the teeth and brown to black staining (Figure 1.3) (Apambire et al. 1997). In addition, it was also suggested that calcium fluoroapatite crystals replaced the calcium in the teeth during

a process known as mineralization. This process happens when the fluoride accumulates and combines with the calcium, and further on, the calcium will be reduced and lost from the teeth (Ayoob and Gupta 2006).
1.4.5 Skeletal Fluorosis
The consumption of water with F concentration greater than the permissible limit that ranges between 4.0 and 8.0 mg/L and higher (Apambire et al. 1997), will lead to severe and long-term damage to the human skeleton, a disease known as skeletal fluorosis (Ayoob and Gupta 2006). The lowest limit that has been noticed, which causes skeletal fluorosis, is 3.0 mg/L (Manikandan et al. 2014). Moreover, higher the duration and amount of fluoride entering the human body, the higher the severity of the disease (Ayoob and Gupta 2006). The symptoms shown on people with a possibility of having skeletal fluorosis vary in severity, with excess fluoride concentration consumption by Sutter from muscle and joint pain or mild rheumatic pain. In addition, to severe pain in the cervical spine region, stiffness and rigidity in joints, and crippling; skeletal fluorosis can occur once the fluoride concentration in drinking water exceeds 10 mg/L (Apambire et al. 1997; WHO 1970). Likewise, skeletal fluorosis can also be witnessed in the X-ray by increasing the bone density in adults (Mohammadi et al. 2017). Fluoride can disrupt the equilibrium of bone mineral metabolism by affecting the accretion and desorption of bone tissue (Ayoob and Gupta 2006). A study by Mohammadi (2017) analyzed two categories one with high fluoride concentration above the standard limit was diagnosed in a total of 445 people, and the other one containing low fluoride concentration below the standard limit was observed in a total of 470 people. The first area with high F showed that 21.1% of the people have skeletal fluorosis, only 3% from the second area suffered from skeletal fluorosis. The rates of the fluoride concentration in this study ranged from 0.22 to 10.33 mg/L (Mohammadi et al. 2017).
1.5 Hazard Index
The Hazard Index or Hazard Quotient (HQ) is the ratio of a single drug exposure level (dose or concentration) during a defined time period to the RfD computed for the same substance over the same time period. HQ, ratio greater than one indicates that the chemical
Figure 1.3 Effect of dental fluorosis due to high concentration of F
1 Fluoride in Groundwater: Distribution, Sources, Processes, Analysis, and Treatment Techniques: A Review
Table 1.3 Calculated and standard values of the parameters needed for the HQ calculation. The mean value of F from Kuwait’s groundwater samples.
VariableDescription
Source: Data from Worldbank – Kuwait Data (2021).
concentration is enough to induce persistent noncarcinogenic effects. In this review, samples of Kuwait (Table 1.3) are considered to check the effect of high concentration of fluoride using the following equation:
This value is according to the USEPA’s Integrated Risk Information System (USEPA 2014). The estimated daily intake (EDI) of F from groundwater is used to calculate the F exposure dosage. The EDI values were calculated using Eq. 1.9 from the US Environmental Protection Agency. EDI can be determined using the following equation:
The optimum level of oral intake was assessed to depend on the baby weight and annual mean maximum temperature (Galagan et al. 1957)
E is the estimated average daily water intake for children <10 years old.
AMMT is for a period of five years but due to malnutrition the amount of water intake is more and then the equation is modified (Ramadan and Hilmi 2014) as 0022 056
The mean fluoride concentration in Kuwait groundwater samples is 1.98 mg/L. HQ was calculated to indicate the impact of high intake fluoride concentration for the lifetime. Using the data from Table 1.2, HQ was calculated for women and men are above 1.0 indicating the noncarcinogenic affects in future if the groundwater is utilized for drinking purpose. Also, it indirectly affects through food chain as groundwater is being used for agricultural purposes.
1.5.1 Analytical Techniques
The standard analytical methods adopted for F determination in groundwater are Orion fluoride ion electrode model, ion-selective electrode, ion chromatography, Spectrophotometer method by zirconyl oxychloride, SPADNS (Sodium 2-(parasulfophenylazo)-1,8-dihydroxy-3, 6-naphthalenedisulfonate), and ion-sensitive electrodes (Table 1.3) (Srinivasamoorthy et al. 2008; Singaraja et al. 2012; Addison et al. 2020; Aravinthasamy et al. 2019; Shyam and Kalwania 2012; Dehghani et al. 2019; Sreedevi et al. 2006).
1.5.2 Treatment Methods
High fluoride in groundwater is treated through several processes like adsorption, sorption, electro dialysis, reverse osmosis, electrocoagulation, coagulation, precipitation, ion exchange, and by using nano membranes. These techniques have been tested on different scales at lab and field conditions (Table 1.4).
Table 1.4 Common treatment methods for the removal of fluoride preferred in different countries.
Removal
Type
Adsorbent ColumnCharcoal Fly-ash Brick, Red soil, Serpentine Rural waterChidambaram et al., 2013
AdsorbentsApophy, China clay, llitestilbite, clinoptilolite, Fuller’s earth, gibbsite, goethite, halloysite, kaolinite, Magnesite, bentonite, vermiculite, zeolite(s), serpentine, alkaline soil, acidic clay, kaolinitic clay, natrolite, aiken soil, diatomaceous earth and Ando soil
AdsorbentsLow grade Assam coal
WaterBower and Hatcher,1967; Bjorvartn and Bårdsen, 1997; Singano et al 1997
GroundwaterBorah and Dey, 2009
Adsorbent Alumina Drinking water Chidambaram et al., 2013 Bauxite, Alumn impregnate Alumina, H3PO4 and lime Flyash
Synthetic Zeolites
(Continued)