Analytical Techniques for the Elucidation of Protein Function
Edited by Isao Suetake
Nakamura Gakuen University, Japan
Rohit K. Sharma
Panjab University, India
Hironobu Hojo
Institute for Protein Research, Osaka University, Japan
This edition first published 2023 © 2023 John Wiley & Sons Ltd
All rights reserved. No part of this publication may be reproduced, stored in a retrieval system, or transmitted, in any form or by any means, electronic, mechanical, photocopying, recording or otherwise, except as permitted by law. Advice on how to obtain permission to reuse material from this title is available at http://www.wiley.com/go/permissions.
The right of Isao Suetake, Rohit K. Sharma, and Hironobu Hojo to be identified as the authors of the editorial material in this work has been asserted in accordance with law.
Registered Office(s)
John Wiley & Sons, Inc., 111 River Street, Hoboken, NJ 07030, USA
John Wiley & Sons Ltd, The Atrium, Southern Gate, Chichester, West Sussex, PO19 8SQ, UK
For details of our global editorial offices, customer services, and more information about Wiley products visit us at www.wiley.com.
Wiley also publishes its books in a variety of electronic formats and by print-on-demand. Some content that appears in standard print versions of this book may not be available in other formats.
Trademarks: Wiley and the Wiley logo are trademarks or registered trademarks of John Wiley & Sons, Inc. and/or its affiliates in the United States and other countries and may not be used without written permission. All other trademarks are the property of their respective owners. John Wiley & Sons, Inc. is not associated with any product or vendor mentioned in this book.
Limit of Liability/Disclaimer of Warranty
In view of ongoing research, equipment modifications, changes in governmental regulations, and the constant flow of information relating to the use of experimental reagents, equipment, and devices, the reader is urged to review and evaluate the information provided in the package insert or instructions for each chemical, piece of equipment, reagent, or device for, among other things, any changes in the instructions or indication of usage and for added warnings and precautions. While the publisher and authors have used their best efforts in preparing this work, they make no representations or warranties with respect to the accuracy or completeness of the contents of this work and specifically disclaim all warranties, including without limitation any implied warranties of merchantability or fitness for a particular purpose. No warranty may be created or extended by sales representatives, written sales materials or promotional statements for this work. The fact that an organization, website, or product is referred to in this work as a citation and/or potential source of further information does not mean that the publisher and authors endorse the information or services the organization, website, or product may provide or recommendations it may make. This work is sold with the understanding that the publisher is not engaged in rendering professional services. The advice and strategies contained herein may not be suitable for your situation. You should consult with a specialist where appropriate. Further, readers should be aware that websites listed in this work may have changed or disappeared between when this work was written and when it is read. Neither the publisher nor authors shall be liable for any loss of profit or any other commercial damages, including but not limited to special, incidental, consequential, or other damages.
Library of Congress Cataloging-in-Publication Data
Names: Suetake, Isao, editor. | Sharma, Rohit K., editor. | Hojo, Hironobu, editor.
Title: Analytical techniques for the elucidation of protein function / edited by Isao Suetake, Rohit K. Sharma, Hironobu Hojo.
Description: Hoboken, NJ : John Wiley & Sons, 2023. | Includes bibliographical references and index.
Identifiers: LCCN 2022038118 (print) | LCCN 2022038119 (ebook) | ISBN 9781119886327 (hardback) | ISBN 9781119886334 (pdf) | ISBN 9781119886341 (epub) | ISBN 9781119886358 (ebook)
Subjects: LCSH: Proteins. | Electron paramagnetic resonance spectroscopy. | Nuclear magnetic resonance spectroscopy.
Classification: LCC QP551 .A485 2023 (print) | LCC QP551 (ebook) | DDC 572/.6--dc23/eng/20221005
LC record available at https://lccn.loc.gov/2022038118
LC ebook record available at https://lccn.loc.gov/2022038119
Cover Image: Courtesy of Tomohiro Hojo
Cover Design: Wiley
Set in 9.5/12.5pt STIXTwoText by Integra Software Services Pvt. Ltd, Pondicherry, India
Contents
Preface ix
Editor’s Biographies xi
List of Contributors xiii
1 EPR Spectroscopy 1
1.1 Outline of EPR Spectroscopy 2
Hiroyuki Mino
1.1.1 Overview 2
1.2 Biological Applications of EPR 13
Isao Suetake, Risa Mutoh, Yuichi Mishima, Masatomo So, and Hironobu Hojo
1.2.1 Proteins and Their Structures: Domain and Intrinsically Disordered Region 13
1.2.2 Introduction of Spin Probes on Proteins 14
1.2.3 Measurement of Constant Wave (CW)-EPR Spectrum 19
1.2.4 Application of CW-EPR to Protein (Clock Protein, Amyloid Proteins, and HP1) 21
1.2.4.1 Clock Proteins 22
1.2.4.2 Amyloid Proteins (Aβ Peptide, β2-microglobulin, α-synuclein, Tau, and Prion) 23
1.2.4.3 Heterochromatin Protein 1 (HP1) 26
1.2.5 Measurement of Longer Distance between Spin-spin (HP1, Tau, α-synuclein) 29
1.2.6 Biophysical Functions of Protein Dynamics 31
1.2.7 Summary/Conclusion 31
2 Introduction to Incoherent Neutron Scattering: A Powerful Technique to Investigate the Dynamics of Bio-macromolecules 39 Tatsuhito Matsuo and Judith Peters
2.1 Introduction 39
2.2 Basic Theory and Dynamical Information Obtained from iNS 42
2.2.1 Basic Principle of iNS Experiments 42
2.2.2 Incoherent Scattering Function 45
2.2.3 Dynamical Information Obtained by iNS 51
2.2.3.1 Elastic Incoherent Neutron Scattering (EINS) 52
2.2.3.2 Quasi-elastic Neutron Scattering (QENS) 53
2.3 Examples of Biological Applications of iNS 58
2.3.1 Dynamical Modulation of Proteins Caused by a Disease-causing Point Mutation 58
2.3.2 Dynamical Differences between Amyloid Polymorphic Fibrils Showing Different Levels of Cytotoxicity 59
2.3.3 New Theoretical Framework to Describe the Dynamical Behavior of Lipid Molecules 60
2.3.4 Separation of Dynamics of Protein-detergent Complexes 61
2.3.5 Hydration Water Mobility around Proteins 62
2.4 Summary 63
3 Elucidation of Protein Function Using Raman Spectroscopy 69 Saima Malik, Maitrayee U. Trivedi, Gurpreet K. Soni, and Rohit K. Sharma
3.1 Introduction 69
3.2 Basic Principle and Working of Raman Spectroscopy 71
3.2.1 Theory and Frequencies of Raman Spectroscopy 71
3.2.2 Instrumentation 73
3.3 Advances in Raman Spectroscopy Techniques 74
3.3.1 Resonance Raman Spectroscopy for Protein Analysis 74
3.3.1.1 Ultraviolet Resonance Raman Spectroscopy 75
3.3.1.2 Time-resolved Resonance Raman Spectroscopy 76
3.3.2 Surface-enhanced Raman Spectroscopy (SERS) 77
3.3.3 Tip-enhanced Raman Spectroscopy 80
3.3.4 Polarized Raman Spectroscopy 83
3.3.5 Raman Crystallography 85
3.3.6 2D-COS Raman Spectroscopy 88
3.4 Applications 91
3.5 Conclusion 92
4 Fundamental Principles of Impedance Spectroscopy and its Biological Applications 101
Yusuke Tsutsui
4.1 Introduction 101
4.1.1 Basic Concept of Impedance Spectroscopy 101
4.1.2 Description of Impedance for Capacitors and Inductors 105
4.1.3 Nyquist Plot 106
4.1.4 Debye Model 108
4.1.5 Constant Phase and Warburg Element to Model Distorted and Diffusive Components 111
4.2 Biological Applications of Impedance Spectroscopy 113
4.2.1 Detection of DNA Hybridization and Photodamage 113
4.2.2 Detection and Analysis of Proteins 115
4.3 Conclusion 119
5 Mass Spectrometry Imaging 125
Shuichi Shimma
5.1 Introduction 125
5.2 Workflow of MSI 126
5.3 Mass Microscope 128
5.4 Visualization of Small Molecules (Pharmaceutical) 128
5.5 Structural Isomer Discrimination Imaging (Steroid Hormones) 130
5.6 Visualization of Proteins (Intact, Digestion) 133
5.7 Visualization of Protein Function (Enzymatic Activity Visualization) 134
5.8 Summary 139
6 Elucidation of Protein Function Using Single-molecule Monitoring by Quantum Dots 143 Maitrayee U. Trivedi, Deepika Sharma, Alisha Lalhall, Rohit K. Sharma, and Nishima Wangoo
6.1 Introduction 143
6.1.1 Introduction to Quantum Dots 144
6.1.2 Types of Quantum Dots 145
6.1.2.1 Core Type QDs 145
6.1.2.2 Core/shell-type QDs 147
6.1.2.3 Alloyed-type QDs 148
6.2 Synthesis Methods 148
6.2.1 Wet-chemical Methods 150
6.2.2 Vapor-phase Methods 150
6.3 Bioconjugation 151
6.4 Analytical Methods for Single-molecule Monitoring by Quantum Dots 152
6.4.1 Epifluorescence Microscopy 152
6.4.2 Total Internal Reflection Fluorescence Microscope 153
6.4.3 Confocal Microscopy 154
6.4.4 pseudo-TIRFM 154
6.4.5 Single-point Edge Excitation Subdiffraction Microscopy 156
6.5 Applications 156
6.5.1 Application of Single-molecule Monitoring Using QD for Enlightening Nanoscale Neuroscience 156
6.5.2 Investigation of Diffusion Dynamics of Neuroreceptors in Cultured Neurons 157
6.5.3 Single-molecule Tracking of Neuroreceptors in Intact Brain Slices (in Vivo) 158
6.5.4 QD-tagged Neurotransmitter Transporters 160
6.5.5 QD Labeled Serotonin Transporter (SERT) to Understand Membrane Dynamics 160
6.5.6 Membrane Trafficking and Imaging of Dopamine Transporter (DAT) Using QDs 161
6.6 Limitations of QDs 163
6.7 Conclusion 163
7 Biological Solid-state NMR Spectroscopy 169
Toshimichi Fujiwara
7.1 Introduction 169
7.2 Magnetic Interactions for NMR 170
7.2.1 Zeeman Interaction 170
7.2.2 Isotropic and Anisotropic Chemical Shifts 170
7.2.3 Homo- and Heteronuclear Dipolar Interactions 171
7.3 Methods for Solid-state NMR 173
7.3.1 Sample Preparation of Solid-state NMR 173
7.3.2 Experimental NMR Techniques for High-resolution Solid-state NMR 174
7.3.3 Fast MAS for 1H NMR 176
7.3.4 Multidimensional High-resolution NMR Experiments with Recoupling RF Pulse Sequences 176
7.3.5 Paramagnetic Effects for Structural Analysis 177
7.3.6 High-field DNP for Sensitivity Enhancement 178
7.3.7 Oriented Molecular Systems 179
7.4 Applications of Solid-state NMR to Biological Molecular Systems 180
7.4.1 Membrane Proteins and Peptides 180
7.4.2 Amyloid Fibrous Proteins 182
7.4.3 In-situ Cellular Biomolecules 184
7.5 Concluding Remarks 184
8 Electrically Induced Bubble Knife and Its Applications 191
Yoko Yamanishi
8.1 Introduction 191
8.2 Electrically Induced Bubble Knife 192
8.3 Electrically Induced Bubble Injector 199
8.3.1 Bubble Formation with Reagent Interface 200
8.3.2 Simultaneous Injection and Ablation 200
8.4 Plasma-induced Bubble Injector 201
8.5 Protein Crystallization by Electrically Induced Bubbles 202
8.6 Protein Crystallization by Plasma-induced Bubbles 207
Index 215
Preface
Proteins are fundamental biomolecules in living organisms and play various essential roles. They are composed of twenty amino acid connected by amide bonds and form secondary structures, such as α-helix and β-sheet, and ultimately, tertiary structures (also quaternary structures in the case of protein complexes). As the structure of proteins is very important for their function, various methods have been used to analyze them. The first structure clarified was myoglobin, which was reported in 1958 using X-ray crystallography. Nuclear magnetic resonance spectroscopy has also been highly advanced and widely used for protein structural analysis. Recently, cryoelectron microscopy has also become a powerful tool for this purpose. The structural data is deposited on the Protein Data Bank, and the number of solved structures is rapidly increasing. As the data is accessible from all over the world, it supports the progress of research on protein as well as the development of therapeutics.
Recently, the region in a protein that does not assume a particular threedimensional structure, namely, the intrinsically disordered region (IDR), has been attracting much attention due to its importance for protein functions. IDR tends to form a liquid-liquid separated structure, which provides a site for various biological processes. IDR often receives various post-translational modifications, which are important to modify the function of proteins. In addition, the posttranslational modifications often occur heterogeneously. To analyze the structure and function of these regions, the use of the above mentioned methods, such as X-ray crystallography and NMR, are not sufficient, as the regions are highly heterogeneous, mobile, and do not have firm tertiary structures. In addition, the analysis to identify the site and the kind of post-translational modification is required to elucidate how these modifications play roles.
In this book, we want to provide a brief introduction to less popular yet promising techniques to undertake functional and structural analyses of proteins, especially the intrinsically disordered region and the post-translational modifications.
Preface x
We anticipate that many of the readers are not familiar with the described techniques nor their theoretical background. Therefore, the authors describe each technique starting from a simple introduction and including a theoretical background, followed by the application of the method to the analysis of protein structure and function.
Chapter 1 describes the electron paramagnetic resonance spectroscopy technique. The method can be applied to the analysis of long-range interaction and fast motion of the proteins by specific spin labeling. Neutron scattering, described in Chapter 2, is an efficient method to analyze the dynamics of proteins. The method is particularly effective to analyze the dynamics of membrane proteins in lipid bilayers. Chapter 3 deals with Raman spectroscopy, which can clarify biological processes, such as protein-protein interaction and folding, by the analysis of scattering at the specific wave number indicative of a specific bond. This can be done with a small amount of sample without labeling. In Chapter 4, the author describes that the structure and aggregate formation of proteins can be globally analyzed by impedance measurement of a protein solution, which can be done without introducing any probes. Mass spectrometry imaging, described in Chapter 5, can analyze the distribution of various compounds in tissue samples with extreme high sensitivity using mass spectrometry. This method can be applied for the analysis of a wide range of compounds, as it identifies the target compounds by their molecular weight. Chapter 6 describes the single-molecule monitoring by quantum dots, which achieves the analysis of protein molecules one by one and is clearly advantageous when proteins with heterogeneous posttranslational modifications are analyzed. Chapter 7 deals with solid-state NMR. The method can analyze proteins even in an aggregated state and micelles, which is very effective for the analysis of amyloid formation and membrane proteins in lipid bilayers. In Chapter 8, the novel method for the introduction of materials into cells as well as protein crystallization using bubble knife is described. These techniques are of great use for the analysis of proteins, which are difficult to be treated by conventional analytical methods.
We would like to express our sincere thanks to all the authors who contributed to this book. We also appreciate the efforts of reviewers who helped revise the text. Our thanks also go to Ms. Jenny Cossham and Ms. Elke Morice-Atkinson of John Wiley & Sons for their continuous help to realize the publication of this book.
We hope that the book will be a good introduction to the described techniques and contribute to increase their popularity for protein analysis, especially through research on the IDR. Also, we hope that the book will contribute to the further advance of protein science in the future.
Isao Suetake
Rohit K. Sharma Hironobu Hojo
Editor’s Biographies
Isao Suetake, professor at the Graduate School of Nutritional Sciences, Nakamura Gakuen University, Japan.
Isao Suetake is a professor of nutrition at Nakamura Gakuen University. He graduated from the Faculty of Science, Osaka University, in 1990 with a bachelor’s degree and got his PhD in 1996 from the university. He specializes in biochemistry and molecular epigenetics and has researched the properties of enzymes responsible for DNA methylation and molecular mechanisms recognizing histone modifications. For more than ten years, he has collaborated with Prof. Hojo, who is one of editors of this book, to combine chemistry and bioscience for elucidating protein modifications.
Rohit K. Sharma, assistant professor at the Department of Chemistry, Panjab University, India.
Rohit K. Sharma obtained his PhD in medicinal chemistry, National Institute of Pharmaceutical Education and Research (NIPER) in 2009. His thesis was on the design and synthesis of antimicrobial peptides. In 2007, he underwent a research sojourn in the Helmholtz Centre for Infection Research (HZI), Germany. In 2009, he moved to Nanyang Technological University, Singapore, as a postdoctoral research fellow. He moved to his present position in Panjab University in 2011, where his research interests include understanding nano-peptide conjugates and self-assembling organic networks with applications in drug delivery and bio-sensing.
Hironobu Hojo, professor at the Institute for Protein Research, Osaka University, Japan.
Hironobu Hojo obtained his PhD in organic chemistry from Osaka University in 1994. His thesis was on the development of the method for chemical protein synthesis, the thioester method. In 1998, he moved to Tokai University and started to
Editor’s Biographies
extend the thioester method for glycoprotein synthesis. He moved to his present position, professor at the Institute for Protein Research, Osaka University, in 2013 and is developing a chemical approach toward the understanding of the function of post-translationally modified proteins.
List of Contributors
Toshimichi Fujiwara
Osaka University
Suita, Osaka
Japan
Hironobu Hojo
Osaka University
Suita, Osaka
Japan
Gurpreet K. Soni
Panjab University
Chandigarh
India
Alisha Lalhall
Panjab University
Chandigarh
India
Saima Malik
Panjab University
Chandigarh
India
Tatsuhito Matsuo
Université Grenoble Alpes
Grenoble
France
Hiroyuki Mino
Nagoya University
Nagoya
Japan
Judith Peters Université Grenoble Alpes
Grenoble
France
Deepika Sharma
Panjab University
Chandigarh
India
Isao Suetake
Nakamura Gakuen University
Fukuoka
Japan
Rohit K. Sharma
Panjab University
Chandigarh
India
Shuichi Shimma
Osaka University
Suita, Osaka
Japan
List of Contributors
Maitrayee U. Trivedi
Panjab University
Chandigarh
India
Yusuke Tsutsui
Kyoto University
Kyoto
Japan
Nishima Wangoo
Panjab University
Chandigarh
India
Yoko Yamanishi
Kyushu University
Fukuoka
Japan
Analytical Techniques for the Elucidation of Protein Function, First Edition. Edited by Isao Suetake, Rohit K. Sharma, and Hironobu Hojo. © 2023 John Wiley & Sons Ltd. Published 2023 by John Wiley & Sons Ltd.
Outline of EPR Spectroscopy
Hiroyuki Mino
Division of Material Science, Graduate School of Science, Nagoya University, Furo-cho, Chikusa-ku, Nagoya, Aichi, Japan
1.1.1 Overview
Our most familiar interaction in this world is electromagnetism. Almost all phenomena in material physics arise fromelectromagnetic interactions between light and matter. Our world is a stage for the electron as the main actor. Biosystems are also standing on the stage.
Electromagnetism is mediated by electromagnetic waves, called photons, which are the particles of the force field (the bosons, or force carriers). The electromagnetic waves are classified by frequency: γ-rays, X-rays, ultraviolet light, visible light, infrared light, microwave, and radio wave, in order of decreasing energy. Optical absorption spectroscopy using visible light is the most basic spectroscopic tool. Electron paramagnetic resonance (EPR) is also a spectroscopic tool [1–3]. Optical absorption detects the transition of the electron dipole moment, while EPR detects the transition of spin angular momentum. Spin (S) is classically modeled by the behavior of a small bar magnet. In quantum mechanics the bar magnet is allowed to be only in two states, parallel or antiparallel to the external magnetic field. In the simple case of S = 1/2, only the transition between two states, the up-spin state, |α> (mI = –1/2), and down-spin state, |β> (mI = 1/2), are allowed. Under an external magnetic field, energy levels are separated, called Zeeman interaction (Figure 1.1.1). The transition between two states is performed by microwave irradiation. Since the two transitions, |α> to |β> and |β> to |α>, have the same probabilities, the periodic transitions between the |α> and |β> states continue during microwave irradiation and is called
Analytical Techniques for the Elucidation of Protein Function, First Edition. Edited by Isao Suetake, Rohit K. Sharma, and Hironobu Hojo.
© 2023 John Wiley & Sons Ltd. Published 2023 by John Wiley & Sons Ltd.
1.1.1
“Rabi oscillation” (Figure 1.1.2). This oscillation is not unique for magnetic resonance but general for all spectroscopies. If we can detect very fast measurements, the oscillation should be observed in optical light spectroscopy.
The energy for the spin transition might be smaller than that for the other electronic transitions. However, the electron spin is coupled with the orbital symmetry in the molecules. Therefore, the spin states determined by the EPR method are an indispensable tool to determine the quantum properties of the molecular orbits.
EPR and nuclear magnetic resonance (NMR) are categorized as magnetic resonance techniques. The differences between EPR and NMR are mainly ascribed to the spin size. Considering spin interaction between the spins, the effective interacting distance for a nuclear spin is around 10 Å, while that for electron spin is around 100 Å. Therefore, the EPR spectrum includes many magnetic interactions, such as the nuclei and electron spins within these distances (Figure 1.1.3). The difference in magnitude of the spins is also reflected in the
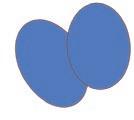
S = 1/2
External magnetic field
Figure 1.1.1 Energy levels for S = 1/2 spin in the magnetic field B0.
Figure 1.1.2 Illustration for the transitions in two levels |α> and |β>. Microwave irradiation gives oscillation between two levels (Rabi oscillation).
NMR (6 Å)
EPR (100 Å)
spin
Protein
Pulse NMR
Covered by pulse
Pulse EPR
Covered by pulse
*rich information
*too much to pass
NMR spectrum
Figure 1.1.3 Scale for the interaction of the nucleus and electron spins relative to protein size.
∼10µs
EPR spectrum
10ns ∼100KHz ∼100MHz
(∼30Gauss)
Figure 1.1.4 Coverage area for NMR pulse and EPR pulse relative to spectral width.
spectral linewidth. NMR is generally estimated as several kilohertz, while the EPR spectral width is estimated as 1 THz (0.3 nm). In the case of the visible light spectrum, it reaches about 300 THz (~100 nm). The differences directly reflect the pulsed technique. In pulse spectroscopy (Figure 1.1.4), the object is irradiated with a strong electromagnetic wave in a short period. The detectable spectral linewidth depends on the pulse width and intensity. For example, the pulse with a length of 10 μs covers a 100 kHz width in the spectrum. Therefore, the short pulse covers the whole NMR spectrum, while only a small region in the spectrum is detected in EPR and visible optical spectroscopy. In the case of EPR, the limitation of a strong microwave pulse is around 20 ns, indicating a linewidth of 50 MHz, about 20 G, in the spectrum. Therefore, EPR may be an intermediate methodology between NMR and visible light spectroscopy (Figure 1.1.5). The pulsed EPR technique has two options, whether to detect a wide range in the spectrum or conversely to detect frequency selective beaching in a spectrum (a hole), denoted as “Hole burning.”
Figure 1.1.5 Comparison of EPR spectrum linewidth with NMR and optical spectral linewidth. Gray marker shows the detectable area for a single-pulse excitation.
The application to protein structure studies contributes to the advancement and popularity of the NMR technique. Protein studies are also an important application for EPR. The slow spin relaxation in the protein is suitable for EPR measurements, where the protein works as a kind of solvent virtually. As the electron spin interaction covers proteins, a lot of information in the spectrum disturbs the extraction of the necessary information. Therefore, many EPR techniques have been proposed.
In the external magnetic field B0 along the z-axis, the energy for a bar magnet with a magnetic moment μ is described as:
H = µθ B0 cos, (1.1.1)
where θ is the angle between the B0 and μ vectors. The angle θ is arbitrarily selected in classical mechanics. But in quantum mechanics, only two states, parallel or antiparallel to the external magnetic field, are allowed. Using quantum mechanics ( g β S ), the formula is rewritten as:
H = gB S ee z β 0 , (1.1.2)
where ge and βe are the g-factor and Bohr magneton for the electron, respectively, and Sz = 1/2 or −1/2 (Figure 1.1.2). Considering the magnetic resonance in the two levels, the transition probabilities from the down spin to the up spin and from the up spin to the down spin are the same. As the number of lower levels (β) is larger than the number of upper levels (α) in the Boltzmann distribution, irradiated microwave energy is absorbed in the spin system. When the microwave energy is continuously supplied, the numbers of spin in both levels become equal, resulting in the loss of absorption. Therefore, the absorption signal is observed in the balance of suppling energy and spin relaxation. The evaluation of the spin relaxation gives the magnetic interaction between spins (Figure 1.1.2).
In the pulse EPR method, microwaves are irradiated only for a short time. Therefore, spin relaxation can be suppressed and evaluated. The electron-nucleus spin interaction can be directly observed by the ENDOR (electron nuclear double resonance) and ESEEM (electron spin echo envelope modulation) methods, and the electron-electron spin interaction is observed by the PELDOR (pulsed electron-electron double resonance) / DEER (double electron-electron resonance) [4] hole burning [5, 6], RIDME (relaxation-induced dipolar modulation enhancement) [7], etc.
When an external magnetic field is applied to the electron spin in the z-direction, the electron spin is quantized in the z-direction (Figure 1.1.6a). The electron spin inverts to the opposite direction by irradiating a microwave pulse with an appropriate length (Figure 1.1.6a). The inverted spin recovers with the thermal divergence to the outside. The recovery time is called spin-lattice relaxation time (T1). T1 is influenced by several different processes, such as the direct process, Raman process, and Orbach process, where the spin-spin interaction is also included. The T1 measurement is one of the traditional distance measurement techniques.
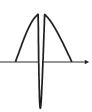
Another relaxation time is the spin-spin relaxation time (T2). The mechanism is classically expressed as spin relaxation on the xy-plane. As the spin is quantized along the z-axis direction in the external magnetic field, there is no energy dissipation in the xy-plane in the first order. The spin-spin relaxation is mainly described as the perturbation from the local magnetic field to the electron spin. When we consider the interaction between electron and nucleus spins, the local magnetic field from a nucleus spin is not always along to the z-axis. Therefore,
Figure 1.1.6 (a) Recovery of the magnetization to the z-direction in the rotation xyz-frame. After a single inversion pulse (π), the magnetization inverted to the −z-axis and recovered to the z-axis after T1. (b) The two-pulse sequence with π/2 and π and magnetization irradiated along the x-axis. First, the magnetization is oriented from the y-axis to the x-axis after the π pulse. After the period of τ, the magnetization is dephasing on the xy-plane. Second, the magnetizations are refocused on the −x-axis after a period of τ
fluctuations occur in the quantum transitions as phase relaxation. Inhomogeneity of the external magnetic field also contributes to T2. Note that the single quantum relaxation, denoted as Tm (phase memory time), should be distinguished from the external factors. Figure 1.1.6b shows a basic pulsed technique for detecting spin echo. The xyz-frame is defined as the rotation frame, where the xy-plane is rotating around the z-axis in the Larmor frequency. Applying the first microwave pulse (π/2 pulse) with a microwave pulse from the y-axis, the spin magnetization is oriented along the x-axis, in the xy-plane. After time τ, the magnetizations are dephasing in the xy-plane. By applying a second microwave pulse (π pulse), the magnetizations are refocusing after time τ. The refocused magnetizations are called spin echo (Hahn echo). T2 is obtained by measuring the τ-dependence. As the magnetization is quantized, spins are actually not oriented in the xy-plane, which simply consisted of the mixing of the up-spin and down-spin states. However, the classical mechanics model for spin dynamics is effective for quantum mechanics in many cases.
Spectral diffusion is another relaxation process, which is an exchange process in the spectrum consisting of inhomogeneous lines. Figure 1.1.7 shows a pulse sequence for the detection of spectral diffusion. The first soft pulse makes a sharp absorption hole in the spectrum. Afterwhile, the hole is dispersed. The dispersion of the hole can be monitored by a spin echo sequence using second and third pulses. As the process is due to the interaction with the local spin, we can evaluate the interaction. Notably, the spectral diffusion should be eliminated for T1 measurements, and some useful techniques have been proposed for this purpose.
Magnetic dipole interaction is the basic interaction for magnetism. Although many kinds of complicated interactions are explained in the EPR books, most of the interactions are physically caused by the magnetic dipole interaction. As an
Figure 1.1.7 (a) A pulse sequence for the detection of the spectral diffusion and (b) corresponding spectral image in the frequency domain. The initial long π/2 pulse creates a sharp hole in the spectrum. During a period of T, the hole is diffused in the spectrum. The expanded hole was detected by the spin echo in the second and third pulses.
example, we consider the hyperfine interaction between an electron and a nucleus. The electron-nucleus magnetic dipole interaction is expressed by the following equation.
where gn and βn are the g-factor and Bohr magneton for nuclei, respectively.
The first term is almost the same as the classical magnetic dipole interaction, as seen in a bar magnet. Although the second term is identified as the Fermi contact interaction, it is an exception for the calculation in the classical dipole interaction. In quantum mechanics, the electron is distributed in space, and therefore it is possible to locate it at the position of the nucleus, i.e. r = 0, resulting in fraction divergence. Therefore, the second term is obtained from the first term after mathematical treatment for singularity.
The detection of hyperfine interaction is one of the main EPR subjects, which derive the molecular structure and orbitals. Techniques such as ENDOR and ESEEM are the specific tools to detect hyperfine interaction. In a narrow sense, the term “ESEEM” is used for the modulation effect of the hyperfine interaction. However, the term “ESEEM” does not specify the origin of the interaction. Note that the magnetic dipole interaction between electron spins is also denoted as ESEEM, which includes PELDOR/DEER and other techniques.
The hyperfine interaction is one of the most characterized features of the organic radical in CW EPR. Here is an example of a simple case, one unpaired electron (S = 1/2) and one nucleus (I = 1/2) coupled with only Fermi contact interaction. When the external field B0 is directed to the z-axis, the energy is given by the following expression:
H =− gB Sg BI aI S ee zn nz zz ββ00 ,
where the first term is the electron Zeeman interaction, already defined in Eq. (1.1.2), and the second term is the nuclear Zeeman interaction. The gn and βn are the g-factor and Bohr magneton for nuclei, respectively. The Fermi contact interaction a is obtained by the spatial integral of the second term of Eq. (1.1.5).
Figure 1.1.8 shows the energy diagram for the spin system. The energy levels branch into four states, αα αβ βα ββ en en en en ,>,>, >> . The four energy levels are shifted by the hyperfine interaction a. The transitions for both spin states of S and I at the same time are forbidden. Therefore, two EPR transitions, νβ νβ ββ αβ :, : αα αα en en en en >⇔ >> ⇔> are allowed. The transitions are gB gB a ee nnββ00 12 ++ / for ν α and gB gB a ee nnββ00 12 +− / for ν β . As a result, two EPR lines are separated with hyperfine interaction and centered with gB gB ee nnββ00 + . In an I = 1 system such as 14N, three EPR lines separated with a
Figure 1.1.8 (a) Energy diagram for an S = 1/2 electron spin and an I = 1 nuclei spin with a Fermi interaction a. (a1) No magnetic field, Zeeman energy of (a2) electron, (a3) nuclei, and (a4) hyperfine interaction. (b) The spectral pattern for two allowed EPR transitions ν α and ν β on the energy axis.
are detected. If the spin system is composed of an unpaired electron and two nuclei (I = 1/2), four (22) EPR lines are detected. The number of EPR lines for N nuclei is 2N. As the multi separations bury in the inhomogeneous lines, the EPR spectrum often becomes unresolved and featureless. ENDOR/ESEEM are good tools to extract the hyperfine interaction from the unresolved EPR spectrum because the number of lines becomes only 2N, where N is the number of nuclei in the ENDOR/ESEEM spectra.
The local magnetic field surrounding the electron spin derives modulation on the envelope. When the local magnetic field is due to nucleus spin coupling, the modulation pattern is described as the hyperfine interaction. The modulation frequency of the obtained nuclear modulation is determined by the data sampling interval, pulse width, and EPR linewidth, so the higher the frequency, the more difficult it is to observe. It is most effectively used for the observation of frequencies lower than 10 MHz (nitrogen nucleus, deuterium nucleus, etc.) in ESEEM.
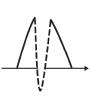
Figure 1.1.9 shows the basic ESEEM spin sequence. Panels (a) and (b) are the two-pulse and three-pulse sequences. A modulation pattern is observed on the decay pattern of the spin echo in time dependence.
In the case of the two-pulse sequence, the envelope modulation is overlapping on the decay trace of the T2 (Tm); therefore, the observable time is short. In the two-pulse ESEEM, the modulation pattern represents the multiplication of the two resonance frequencies, ν α and ν β , after Fourier transformation. In the case of the three-pulse sequence, the envelope modulation is overlapping on the decay
Figure 1.1.9 ESEEM pattern in (a) two-pulse sequence and (b) three-pulse sequence. By changing periods, the echo intensities are modulated.
trace of T1, and therefore the observation time is relatively long. In the three-pulse ESEEM, the modulation pattern represents the summation of the ν α and ν β after Fourier transformation, and therefore three-pulse ESEEM is easier to analyze than two-pulse ESEEM. However, in three-pulse ESEEM, some frequencies are lost depending on the interval between the first and second pulses, which is called blind spot. The blind spot appears in the frequencies around 1/τ.
In the case of a nucleus spin with I = 1, a quadrupole interaction is also detected, which gives important information. The quadrupole interaction of the nitrogen nucleus is often analyzed for protein backbone, amino acid, metal-binding site, etc., in biological systems.
The magnetic interaction between electrons is also described in the magnetic dipole interaction. Equation (1.1.5) is rewritten for two S spins as follows.
In the case of electron-nucleus spin interaction, the energy levels of the electron and the nucleus are quite different, where the transitions αβ βα en en ⇔ are not included, but in the spin between electrons, the transitions || αβ βα ee ee >⇔ > are included. The magnitude of the dipole interaction is described as
For the detection of the electron-electron dipole interaction, some techniques have been proposed, such as PELDOR/DEER, RIDME, 2 + 1, DQC (double quantum coherence), and hole burning. The PELDOR/DEER method is the most versatile and easy to use for distance measurement in proteins.
The PELDOR/DEER method detects the dipole interaction between two electron spins using microwaves of two different frequencies and determines the
1.1.1 Overview 11
distance between electron spins in the range of 10–100 Å with high accuracy. Figure 1.1.10a shows the basic three-pulse sequence for PELDOR/DEER.
Supposing that a spin S1 and S2 with resonance frequencies of ω1 and ω2, respectively, are located in a magnetic field. First, spin S1 is detected with spin echoes with 90°–180° pulses with interval τ. After the 180° pulse for S2 is applied at the timing t between the 90°–180° pulses, there is a periodic oscillation of cos(2πDt). From the oscillation pattern, the magnetic dipole interaction D between spins can be obtained. In the case of the three-pulse measurement, it is not possible to observe near t = 0. A four-pulse sequence is used to measure around t = 0 (Figure 1.1.10b). In the case of spin-coupled metal clusters, the internal exchange interaction can be obtained directly from the spin distribution. In this way, it is possible to extract various quantities depending on the measurement target, rather than simply finding the distance R.
RIDME is another technique for detecting the electron spin interaction. The technique is an intermediate method between PELDOR/DEER and hole burning. As described above, a sharp hole in the spectrum is diffused by dipole interaction. By monitoring the variation of the hole, the dipole interaction can be estimated. Figure 1.1.10c shows three-pulse RIDME sequences; the first and second pulses
(ω1)
(ω1)
(ω1)
(ω1)
ω1)
Figure 1.1.10 Pulse sequences for (a) three-pulse and (b) four-pulse PELDOR/DEER and (c) three-pulse RIDME.
(π/2) invert spin to the −z-axis, while the third pulse detects the interaction after spectral diffusion on T. The oscillation pattern is detected by changing τ. The reason that RIDME is not so popular is simply that PELDOR/DEER is more conventional and RIDME has some difficulties. First, the nuclear ESEEM overlaps the signal. The nitrogen nucleus is difficult to distinguish from PELDOR/DEER signals, so they should be removed by subtraction of the baseline signal. If the S1 and S2 spins are the same types of magnetism, RIDME is not so great because there are no significant differences in relaxation times. However, a large effect is observed if the relaxation times of S1 and S2 are significantly different. For example, in the measurement of the interaction between the metal center and organic radical, the relaxation time differs greatly, where RIDME gives a great effect.
References
1 Carrington, A. and McLachlan, A.D. (1979). Introduction to Magnetic Resonance Chapman and Hall Ltd.
2 Shweiger, A. and Jeschke, G. (2001). Principles of Pulse Electron Paramagnetic Resonance. Oxford University Press.
3 Slichter, C.P. (1990). Principles of Magnetic Resonance, vol. 1. Springer Nature.
4 Milov, A.D., Salikhov, K.M., and Shirov, M.D. (1981). Application of ELDOR in electron-spin echo for paramagnetic center space distribution in solids. Fiz Tverd Tela (Leningrad) 23: 975–982.
5 Dzuba, S.A., Kodera, Y., Hara, H., and Kawamori, A. (1993). The use of selective hole-burning in EPR-spectra to study spectral diffusion and dipolar broadening. J Magn Reson Ser A 102: 257–260.
6 Wacker, T., Sierra, G.A., and Schweiger, A. (1992). The concept of FID-detected hole-burning in pulsed EPR spectroscopy. Isr J Chem 32: 305–322.
7 Kulik, L.V., Dzuba, S.A., Grigoryev, I.A., and Tsvetkov, Y.D. (2001). Electron dipole-dipole interaction in ESEEM of nitroxide biradicals. Chem Phys Lett 343: 315–324.