All rights reserved. No part of this publication may be reproduced, stored in a retrieval system, or transmitted, in any form or by any means, electronic, mechanical, photocopying, recording or otherwise, except as permitted by law. Advice on how to obtain permission to reuse material from this title is available at http://www.wiley.com/ go/permissions.
The right of Clifford R. Berry, Nathan C. Nelson, and Matthew D. Winter to be identified as the author of the editorial material in this work has been asserted in accordance with law.
Registered Office
John Wiley & Sons, Inc., 111 River Street, Hoboken, NJ 07030, USA
For details of our global editorial offices, customer services, and more information about Wiley products visit us at www.wiley.com.
Wiley also publishes its books in a variety of electronic formats and by print-on-demand. Some content that appears in standard print versions of this book may not be available in other formats.
Trademarks: Wiley and the Wiley logo are trademarks or registered trademarks of John Wiley & Sons, Inc. and/ or its affiliates in the United States and other countries and may not be used without written permission. All other trademarks are the property of their respective owners. John Wiley & Sons, Inc. is not associated with any product or vendor mentioned in this book.
Limit of Liability/Disclaimer of Warranty
The contents of this work are intended to further general scientific research, understanding, and discussion only and are not intended and should not be relied upon as recommending or promoting scientific method, diagnosis, or treatment by physicians for any particular patient. In view of ongoing research, equipment modifications, changes in governmental regulations, and the constant flow of information relating to the use of medicines, equipment, and devices, the reader is urged to review and evaluate the information provided in the package insert or instructions for each medicine, equipment, or device for, among other things, any changes in the instructions or indication of usage and for added warnings and precautions. While the publisher and authors have used their best efforts in preparing this work, they make no representations or warranties with respect to the accuracy or completeness of the contents of this work and specifically disclaim all warranties, including without limitation any implied warranties of merchantability or fitness for a particular purpose. No warranty may be created or extended by sales representatives, written sales materials or promotional statements for this work. This work is sold with the understanding that the publisher is not engaged in rendering professional services. The advice and strategies contained herein may not be suitable for your situation. You should consult with a specialist where appropriate. The fact that an organization, website, or product is referred to in this work as a citation and/or potential source of further information does not mean that the publisher and authors endorse the information or services the organization, website, or product may provide or recommendations it may make. Further, readers should be aware that websites listed in this work may have changed or disappeared between when this work was written and when it is read. Neither the publisher nor authors shall be liable for any loss of profit or any other commercial damages, including but not limited to special, incidental, consequential, or other damages.
Library of Congress Cataloging-in-Publication Data
Names: Berry, Clifford R., editor. | Nelson, Nathan, 1972- editor. | Winter, Matthew D. (Matthew Damian), editor.
Title: Atlas of small animal diagnostic imaging / edited by Clifford R. Berry III, Nathan Nelson, Matthew D. Winter.
Description: Hoboken, NJ : Wiley, 2023. | Includes bibliographical references and index.
Identifiers: LCCN 2022027172 (print) | LCCN 2022027173 (ebook) | ISBN 9781118964408 (cloth) | ISBN 9781118964422 (adobe pdf) | ISBN 9781118964415 (epub)
In general, this textbook is dedicated to those radiologists who have gone before us and shown us the “light” for the acquisition and interpretation of radiographs. They have shown us the “art and science” of diagnostic imaging. Some of those would include Drs Norman Ackerman, Timothy O’Brien, David Hager, Ronald Burk, and the many others who are memorialized on the veterinary radiology website (https://acvr.org/in-memoriam/). We would be remiss not to also dedicate this text to the next generation of veterinary radiologists and diagnostic imagers who can build on some of these foundations and provide new materials and insights to the “art and science” of diagnostic imaging in veterinary medicine. We trust that your futures in veterinary imaging are as fruitful and rewarding as the careers that we have had so far in this field.
– Kip
This book is dedicated to my wife and love of my life, Brigitt, who has put up with this veterinary radiology stuff all our adult lives. There will be a special place in heaven for her with her patience. To God be the Glory (John 3:16)!
To Laura, Claire, Paul, and Sylvia, my bright lights in a dark room.
To my wife, Brandy. Without her love, support, and twinkling spirit, none of this would be possible. To my children, Mia and Damian, who make me the proudest person on the planet.
To my entire family, who have supported me always.
To all veterinarians and veterinary paraprofessionals that give of themselves day in and day out – you are Superheroes.
19 Feline Thorax 497
Martha M. Larson and Clifford R. Berry
20 Anatomy, Variants, and Interpretation
Paradigm 545
Elodie E. Huguet, Clifford R. Berry, and Robson Giglio
21 Extraabdominal Structures and the Abdominal Body Wall 598
Matthew D. Winter
22 The Peritoneal and Retroperitoneal Space 605
Matthew D. Winter
23 Hepatobiliary Imaging 616
Matthew D. Winter
24 Spleen 634
Cintia R. Oliveira
25 Gastrointestinal Tract 667
Seamus Hoey
26 Pancreas 687
Cintia R. Oliveira and Nathan C. Nelson
27 Urogenital Tract 720
Elizabeth Huynh
28 Adrenal Glands and Lymph Nodes 758
Elizabeth Huynh
APPENDIX I MUSCULOSKELETAL REVIEW PARADIGM 790
APPENDIX II THORACIC RADIOLOGY CHECKLIST 791
APPENDIX III ABDOMINAL RADIOLOGY CHECKLIST 795
INDEX 798
CLIFFORD R. BERRY, DVM, DACVR
Clinical Assistant Professor, Diagnostic Imaging Department of Molecular Biomedical Sciences College of Veterinary Medicine North Carolina State University Raleigh, NC, USA
ROBSON GIGLIO, DVM, MS, PHD, DACVR
Assistant Professor, Radiology College of Veterinary Medicine University of Georgia Athens, GA, USA
FEDERICO R. VILAPLANA GROSSO, LV, DECVDI, DACVR
Clinical Associate Professor, Diagnostic Imaging Department of Small Animal Clinical Sciences College of Veterinary Medicine University of Florida Gainesville, FL, USA
SILKE HECHT, DVM, MS, DECVDI, DACVR
Professor, Diagnostic Imaging Department of Small Animal Clinical Sciences College of Veterinary Medicine University of Tennessee Knoxville, TN, USA
SEAMUS HOEY, MVB, DECVDI, DACVR (DI AND EDI)
Lecturer/Assistant Professor School of Veterinary Medicine University College Dublin Veterinary Science Centre Dublin, Ireland
ELODIE E. HUGUET, DVM, DACVR
Clinical Assistant Professor, Diagnostic Imaging Department of Small Animal Clinical Sciences College of Veterinary Medicine University of Florida Gainesville, FL, USA
ELIZABETH HUYNH, DVM, MS, DACVR
Veterinary Radiologist
VCA West Coast Specialty and Emergency Animal Hospital Fountain Valley, CA, USA
MARTHA M. LARSON, DVM, MS, DACVR
Professor of Radiology
Department of Small Animal Clinical Sciences
VA-MD College of Veterinary Medicine
Virginia Tech
Blacksburg, VA, USA
NATHAN C. NELSON, DVM, MS, DACVR (DI, EDI)
Clinical Professor, Diagnostic Imaging
Department of Molecular Biomedical Sciences College of Veterinary Medicine North Carolina State University Raleigh, NC, USA
CINTIA R. OLIVEIRA, DVM, DACVR VetsChoice Radiology Madison, WI, USA
ERIN PORTER, DVM, DACVR (DI, EDI)
Clinical Associate Professor, Diagnostic Imaging Department of Small Animal Clinical Sciences College of Veterinary Medicine University of Florida Gainesville, FL, USA
SANDRA TOU, DVM, DACVIM (INTERNAL MEDICINE AND CARDIOL OGY)
Veterinary Cardiologist Department of Clinical Sciences College of Veterinary Medicine North Carolina State University Raleigh, NC, USA
MATTHEW D. WINTER, DVM, DACVR
Chief Medical Officer
Vet-CT Orlando, FL, USA
Clinical Associate Professor, Diagnostic Imaging Department of Small Animal Clinical Sciences College of Veterinary Medicine
University of Florida
Gainesville, FL, USA
Acknowledgments
We would like to acknowledge our colleagues, residents, interns, and students who have asked the right questions and helped us to shape our interpretation paradigms for diagnostic imaging. A special shout out to the radiologists at the University of Florida, Michigan State University, and North Carolina State University for their insights and help in our formulation of Roentgen abnormalities, tying things together, and prioritizing differentials. Of course, our programs would not be complete without the veterinary imaging technicians who go above and beyond the call of duty daily to ensure quality studies without compromising patient care. A special shout out to the technicians at the University of Florida, Michigan State University, and North Carolina State University, especially Danielle Maruagis,
Bobbie Davis, Mary Wilson, and Theresa Critcher. The residents over the years have always pushed us to be better and we greatly appreciate that.
We want to acknowledge the incredible patience of the editors and staff at Wiley Blackwell, especially Merryl Le Roux and Erica Judisch, who have not relented in their efforts to help us and have believed in this project from the beginning.
We want to acknowledge Elodie Huguet, DVM, DACVR, for doing the textbook cover and the section pages for us. She is incredibly gifted in art and gave us great images to work with for these areas. We greatly appreciate you and your talents, Elodie.
Thank you.
Why another diagnostic imaging textbook? There are many excellent textbooks on veterinary imaging that have been published previously and are still moving forward, with historical editions being replaced with new ones. We felt that this text should be first and foremost an introduction to diagnostic imaging, although most of the text deals primarily with radiology. But more importantly, this textbook was meant to be an atlas so that we could show not necessarily the “classic” cases but some average cases and how the same disease can look differently depending on the stage of the disease at the time when the images are made. Being an atlas, this textbook is not a comprehensive overview of all the different diseases that one may find in the literature, but should serve as an approach for “common things occurring commonly.” And when there is overlap between different disease presentations on the radiographs, formulating a prioritized differential diagnosis list is given precedence. It is hoped that the book will serve as a foundation upon which the reader can add layers of information (science) and clinical experience (art) over the course of their career in veterinary medicine.
It would be impossible to present all the potential images that a patient will present with any given disease process, whether dealing with multicentric lymphoma or elbow dysplasia. Again, this atlas will form a foundational pillar upon which other pillars can be built. We recognize that “pattern recognition” is a lower-order learning technique, but it is critical for building the foundation of interpretation of diagnostic images that occurs each time a new set of images is made.
As with all published works, there will be mistakes in this book. We have tried our best to minimize those mistakes, but take the ultimate responsibility for errors.
We wish you the best in your future endeavors and hope that this textbook can play some role in the diagnostic imaging part of your veterinary medicine career.
NATHAN C. NELSON (NATE)
MATTHEW D. WINTER (MATT)
CLIFFORD R. BERRY (KIP)
About the Companion Website
This book is accompanied by a companion website.
www.wiley.com/go/berry/atlas
The website includes figures from the book as downloadable PowerPoint slides and Radiology templates (Appendices I, II, III).
Introduction and Physics
The Science, Art, and Philosophy of Radiographic Interpretation
Matthew D. Winter
Department of Small Animal Clinical Sciences, College of Veterinary Medicine, University of Florida, Gainesville, FL, USA
Introduction
Diagnostic imaging is an art and a science. The science of diagnostic imaging is didactic information that is learned during veterinary training. The art is the experiential learning that takes place over the course of a lifetime as one interprets radiographs and the ability to extract information from an image. As one studies radiographs, one moves from a lower order of learning (pattern recognition) to a higher level of interpretation where different aspects of the interpretation process impact the final conclusions. Then, the interpretation is filtered through the clinical information relevant to the patient at hand.
Interpretation of a radiograph should be directed by a paradigm. An interpretation paradigm is a map that guides you along a path of thorough and complete evaluation of a radiograph. The paradigm is an essential tool to use for evaluation of all radiographic studies, and examples are provided in each section. This chapter presents an approach to and overview
of the philosophies shared by the editors of this textbook regarding radiographic interpretation.
Why Radiographs?
Why bother with radiography, or diagnostic imaging in general? Specifically, radiography is relatively fast and readily available as a diagnostic imaging test. The procedures for most standard examinations are well defined, and expectations for the capabilities of the modality are relatively well understood. In the realm of diagnostic imaging tests, it is also inexpensive and noninvasive, a rapid test to perform. Therefore, it is a great tool to monitor and stage disease and evaluate anatomy. We also use radiographs to document the results of patient management, to figure out if a treatment is working or not. And of course, when possible, we use radiographs to actually diagnose disease.
Most often, imaging is used to decrease the level of uncertainty about a diagnosis. In most cases, we do not end up with a definitive diagnosis, but we do use the imaging findings as well as any other information to narrow the list of probable diseases. We do this by gathering data. If we think of each individual finding as a test, with each of those tests as having a particular value, then when we add them together, we should hopefully paint a picture or pattern of disease. So, think of each finding as a piece of a larger pattern. As we fit more and more of these diagnostic puzzle pieces together, the pattern becomes more clear. As that pattern emerges, hopefully we can recognize that it is consistent with a specific disease, or perhaps a subset of diseases. The result should be a shorter list of potential or probable pathologic processes (differential diagnoses), and we can direct our next steps accordingly.
Imaging Findings as Tests
As mentioned, tests can be characterized by their value, and that value is best described by sensitivity, specificity, and accuracy as tested against a normal and abnormal population of animals. If we think of each radiographic finding as a test, we realize that each finding can be associated with a certain number of true and false positives as well as true and false negatives when compared to a gold standard [1]. The gold standard would be the test considered to be the best available to diagnose a given disease. That said, the test may be relatively unavailable, too expensive, or perhaps very invasive, and therefore cannot always be done. The sensitivity or specificity for each and every finding for each and every disease are not always known, but we do have data for some of this, and we often can extrapolate. We also have our clinical experience and diagnostic acumen to draw on, which continue to grow over time. As more and more clinical research is done, we get new information on the value of findings as tests through science. Perhaps most importantly, the combination of findings can be most powerful as a diagnostic tool, and can further increase the sensitivity, specificity, and accuracy of radiography as a diagnostic tool for a given disease.
It is important to recognize that some individual findings may be very nonspecific, and that they are not exact for any particular disease and can be features of many different, completely unrelated diseases [1]. This means that, individually, they do not contribute to the reduction of uncertainty that we hope to attain. However, when we combine multiple findings, the added value of each finding narrows our scope in the “cone of certainty” (Figure 1.1).
For example, an unstructured interstitial pulmonary pattern that is moderate in severity and hilar in distribution could result in a large list of potential differential diagnostic considerations from multiple etiologies. If we combine this finding with other radiographic changes, such as left-sided cardiomegaly, elevation of the carina on the lateral images, widening of the caudal bronchi on the ventrodorsal image and enlargement of the pulmonary veins in a dog, our differential list narrows very quickly to pulmonary edema secondary to
Cone of cer taint y Specific diagnosis
Non-Specific Change
FIGURE 1.1 The “cone of certainty.” A nonspecific change at the mouth of the funnel does not help narrow the list of differential diagnoses. However, a series of findings added together improves our degree of certainty, narrowing the list of diagnoses at the tip of the cone. There are few diseases for which imaging findings are pathognomonic. However, a series of findings with varying degrees of value can result in a short and prioritized list of differential diagnoses that aid in decision making, clinical progress, and improved patient care.
left-sided cardiac disease. Depending on other signalment and physical examination findings (small breed dog with a grade IV/V pansystolic cardiac murmur), our differential list narrows even more to mitral valve degenerative disease (endocardiosis) with secondary left heart failure.
This is why one of the most important and fundamental interpretation skills is learning to describe abnormal radiographic anatomy in an organized and systematic fashion. Being systematic and organized helps us to recognize patterns that might otherwise elude us.
Describing Abnormalities:
Roentgen Signs
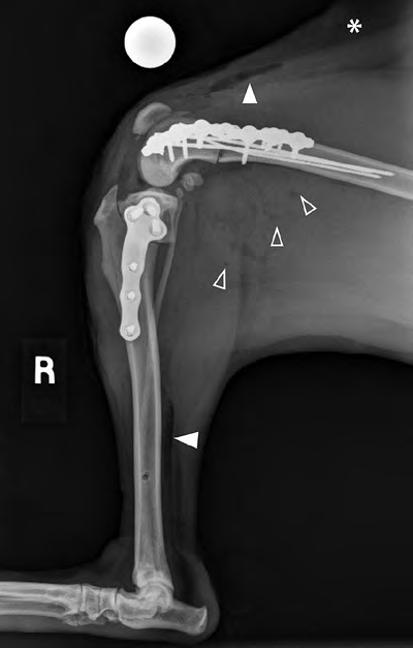
The fundamental language of radiographic interpretation is the Roentgen signs. These are the six features that we describe for every organ or body system that we evaluate: location, size, shape, number, margin, and opacity. The definitions as well as some terminology for use in description of abnormalities are listed in Table 1.1. Figure 1.2 is a radiograph that contains all radiographic opacities.
Opacity is the term we use to characterize the relative radiographic density of an organ or structure. The relative physical density of a structure and the atomic number of its components will dictate how many x-rays are stopped, or attenuated, within
TABLE 1.1 Roentgen signs, definitions, and terminology.
Roentgen sign Definitions
Size The relative extent or dimensions of an organ or object on the image. This can be an absolute measurement in mm or cm, or may be a ratio formed by comparison to a standard (i.e., vertebrae, pelvic diameter). The description should always be relative to the expectation of normal for a given species and breed
Shape The external shape or contour of an organ or object. Most organs have a narrow range of normal shapes. Intestines are tubular, kidneys are, well, kidney shaped, etc.
Abnormal descriptive terminology
Enlarged
Increased in size
Small
Reduced in size
Distended
Dilated
Round or rounded
Oval
Rectangular
Triangular
Fusiform
Broad-based
Amorphous
Number A value representing quantity or amount. In its simplest form, we might identify that there are 2 kidneys, 7 lumbar vertebrae, or 10 pulmonary nodules. But we also might use this to characterize the specific quantity of cardiac chambers or liver lobes enlarged or affected by disease
Margin The edge or border of a structure or organ.
Location Place or position. Most organs have a normal, expected position that can be altered by disease. In many cases, the position of an organ may be altered by an adjacent abnormality. Recognizing this is key to understanding the lesion. Knowledge of radiographic anatomy is of the utmost importance. Remember that “Anatomy is Power!”
Opacity The relative ability to attenuate x-rays. There are five radiographic opacities. Relative differences in the soft tissue opacity of organs are often related to physical density or thickness
the x-ray beam as it passes through a patient. Gas has a small physical density and does not attenuate x-rays. Therefore, things that contain gas are black, or less opaque on a radiograph. We see this in the lungs and the gastrointestinal tract. We should note the presence of gas where it is unexpected. Fat is more dense than gas and attenuates more x-rays. Therefore, it appears gray on radiographs. Soft tissue attenuates even more x-rays than fat, and has the same density as fluid. It is important to realize that soft tissue structures (e.g. aortic walls) and fluid (e.g. the blood within the aorta) cannot be distinguished radiographically. As with gas, it is always important to document the presence of fluid in a space in which it does not belong or is excessive (pleural space, peritoneal space, retroperitoneal space, subcutaneous tissues).
Next on the opacity continuum is mineral. Bone is probably the most recognizable mineral opacity on a radiograph, but recall that many processes result in accumulation of abnormal
Value (i.e., 3 pulmonary nodules)
Increased in number (compared to normal or a prior study)
Decreased in number
Numerous
Smooth
Well-defined
Ill-defined
Regular
Irregular
Sharp
Normal or abnormal contour
Normal
Displaced (dorsally, ventrally, laterally, to the left, etc.)
Gas, fat, soft tissue/fluid, mineral/ bone, metal
mineral, including but not limited to dystrophic mineralization, metastatic mineralization, uroliths, nephroliths, etc. At the end of the continuum is metal. Metal attenuates, or stops, all x-rays, and therefore appears white (radiopaque) on a radiograph. Examples are barium, microchips, surgical plates, and some foreign bodies. In addition to describing abnormal opacities, one may also identify the relative uniformity of an organ or structure by using terms such as homogeneous or heterogeneous. The presence of variable opacities in a structure that is normally uniform can be described in terms of heterogeneity. Recognizing heterogeneity in a normally homogeneous structure can be an important finding. While the above process is described in the context of radiographic interpretation, this tool set is similar for all imaging modalities. The Roentgen approach is still the method by which abnormalities should be characterized, though we modify the terminology around the Roentgen sign of opacity, which
FIGURE 1.2 Postoperative lateral radiographic image of the right crus of a dog that contains all radiographic opacities. Gas is evident outside the patient, but also notice the subcutaneous gas cranial to the femur and caudal to the distal tibia (arrowheads). Gas is also superimposed/within the musculature caudal to the crus (open arrowheads). Fat is present in the subcutaneous tissues (asterisk). The musculature of the limb is soft tissue opaque. The variable shades of soft tissue are related to thickness. The femur, tibia, fibula, tarsal and metatarsal bones are mineral opacity. The implants are metal opaque.
represents the relative signal or consistency of an object as defined by its ability to attenuate x-rays. Other imaging modalities also characterize the consistency of tissue relative to the signal that they generate (Table 1.2).
Using this tool set is predicated on our understanding of normal radiographic anatomy, and the many normal breed and species variations that exist. You can imagine that a dachshund and Great Dane will differ dramatically from one another, yet still be normal for the breed. Each of these Roentgen signs can be normal or abnormal and, depending on the type of abnormality we describe, can help paint a picture of disease. This tool set also requires careful and intentional application. It is very easy and tempting to skip portions of the process, which can result in clinical errors. Following a regular, standardized, and consistent approach to image evaluation will ensure that you are thorough, and that you understand your findings.
The standard approach begins with the interpretation paradigm, or map, that guides you through the anatomy present in the image. This map ensures that you do not skip any portion of the process, and you use the appropriate tools to describe
TABLE 1.2
Relative consistency (optical density on the image) by modality.
ModalityCharacteristicTerminology
RadiographsOpacity
UltrasoundEchogenicity
Computed tomography
Gas, fat, soft tissue, mineral, metal
Hyperechoic, hypoechoic, anechoic
Attenuation/densityHyperattenuating/ hyperdense
Hypoattenuating/ hypodense
Magnetic resonance imaging (Signal) IntensityHyperintense, increased signal intensity
Hypointense, decreased signal intensity
Nuclear medicine
Radiopharmaceutical Uptake Activity
Increased/decreased radiopharmaceutical uptake
abnormalities. Your knowledge base and clinical acumen will help you determine the value of each finding. Connecting the abnormal findings to abnormal pathophysiologic mechanisms is the next step, allowing you to generate differential diagnoses and, ultimately, your next clinical step.
General Interpretation Concepts
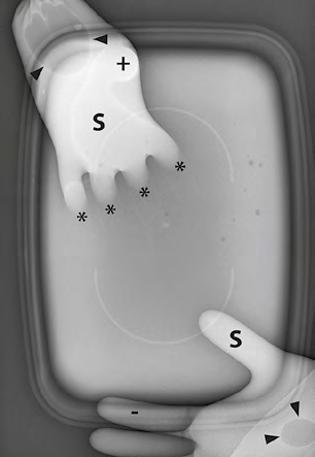
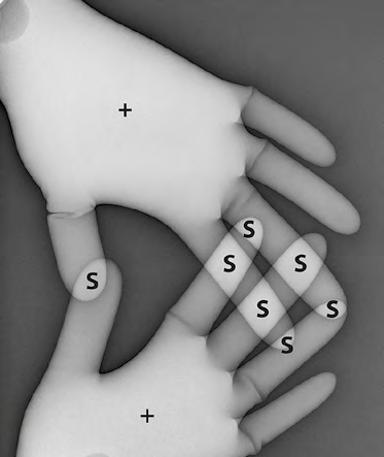
There are a few concepts that will come up regularly as we review images. In Figure 1.3 the image on the left has a plastic container and two surgical gloves filled with water. One glove is suspended over the box, while the fingers of the other glove are immersed in the container. On the right, the same two waterfilled gloves are there, and you’ll notice that some of the fingers overlap. Remember, water is soft tissue/fluid opaque, therefore these items should attenuate the same number of x-rays and therefore have the same opacity. However, you’ll notice that not all of these areas have the same exact opacity. In the upper left of the first image (Figure 1.3A), you see that in the region of the image where the glove and the container overlap, the opacity is greater than the container alone. In the right image (Figure 1.3B), where the fingers overlap, you see that the opacity is greater, and that the palms of the gloves are more opaque than the individual fingers. This is because there is a difference in the physical thickness of these regions, and that difference translates to a difference in x-ray attenuation. The thicker part attenuates more x-rays than the thinner part, despite the fact that both are fluid. When multiple soft tissue opaque structures are superimposed on one another, the overall attenuation of x-rays is additive, and is called summation.
Radiographs of a plastic container and two surgical gloves filled with water (A) and of two surgical gloves in which the fingers have various degrees of superimposition (B). In both gloves, there are small gas bubbles (black arrowheads). In (A), note that the thumb in the lower right of the image and the palm of the glove in the upper left are more opaque than the water in the container due to summation (S). The index finger of the glove in the lower right (-) is less opaque than the thumb and the palm of the same glove. Some of this can be explained by summation, but some is also a result of differences in the physical thickness of these structures. The margins of the fingers of the glove in the upper left are almost completely lost in the container. These margins are border effaced as they are immersed in the water. Both the fingers and the water in the container have the same opacity. The thumb of the glove in the upper left (+) is also very opaque. This thumb is viewed “end-on”, as if pointing down at the container, creating even greater summation in this orientation. The margins of this thumb remain visible, as it is not immersed in the water. In (B), note that in the regions in which the fingers of the two gloves overlap, the overall opacity is increased compared to the individual fingers alone (S). This is another example of summation. Note that the margins of these digits are all well defined. While there is summation, there is gas surrounding each digit, highlighting the margins. There is no border effacement here. Also, the palms of each glove (+) appear slightly more opaque than the digits. This is due to the greater physical thickness of the palms compared to the digits. There is more water for the x-rays to penetrate, therefore more x-rays are attenuated, creating a more opaque region despite the fact that this is the same material (water).
Also note that the fingers that are immersed in the waterfilled container are not visible. This is because the fingers are surrounded by the same opacity, and the margins of the fingers have become border effaced. This means that the margins of two structures of the same opacity, when in contact with one another, cannot be differentiated as separate structures (called border effacement). This is why you will not see hepatic veins or portal veins in the liver, why you will not differentiate fluid in the urinary bladder or intestines from the wall of those structures, or why you cannot see the individual chambers of the heart on a plain radiograph. These changes are seen commonly on radiographs, so make sure that you have an understanding of these radiographic concepts.
Organizing Information/ Abnormalities
It is important to organize data to assist in pattern recognition. The process of organization can be divided into four parts: the description of abnormalities, the conclusion or summary
statement, the differential diagnosis list, and next steps. The first step, the description, is the process of using Roentgen signs to evaluate anatomic abnormalities noted in the image. The second step, the conclusion, consists of interpreting the findings individually and in the context of other abnormalities and recognizing patterns. In the third step, we construct a list of probable diseases that have pathophysiologic mechanisms that could explain the imaging abnormalities or that fit the pattern observed.
There are a large number of possible radiographic presentations for a disease process. Although this text is an atlas, it cannot present all possibilities, just common examples of them. Part of the reason for this is the timeline of the disease process. The image created during radiography represents a snapshot in the timeline of a disease process. When are we taking the image relative to the severity of disease? Other factors such as individual variations in response to disease (dealing with a biological system) as well as the severity of disease are important factors.
In the final part, one must strategically select next steps that might help to arrive at a definitive or final diagnosis, or list possible treatment options for the disease process that is the primary consideration based on the signalment,
FIGURE 1.3
physical examination, and other tests done in assessing the patient.
In the description, you will use Roentgen signs to identify and describe any abnormalities on the image. Be sure to use all available projections and ensure there is a complete study (technique and position are critical).
In the next section, you draw conclusions based on your observations. For example, you may have described a soft tissue bulge in the region of the left atrium and lateral displacement of the principal bronchi on the ventrodorsal/dorsoventral image. Your conclusion on this could be “left atrial enlargement.” If you also described a bulge or enlargement in the region of the left ventricle and an increase in apical to basilar length of the heart with dorsal displacement of the carina, you might also conclude that there is “left ventricular enlargement.” If you indeed have both, you might draw a broader conclusion of “left-sided cardiomegaly.” This broader conclusion will feed into the next step, defining your differential diagnoses.
For differential diagnoses, one must reflect on the conclusions, and list the most probable diseases that might explain the conclusions or summary statements by trying to tie all the concluding statements together as one disease process. To continue with the above example, you would list the most probable diseases that could cause left-sided cardiomegaly, with consideration of the patient’s signalment. If this is a 12-year-old toy poodle, you would likely list myxomatous degeneration of the mitral valve as the primary differential diagnosis. If this is a 6-month-old lab, you might consider congenital dysplasia of the mitral valve primarily. If this is a 10-year-old German shepherd, you might consider endocarditis. And if this is an 8-year-old domestic shorthair cat, you might consider feline cardiomyopathy in all its various forms, which you might prioritize based on likelihood and prevalence. Other diseases may also be on your list, and the prioritization of this list should be filtered through all the other information available at the time of interpretation. As new data is presented, always review the differential list. New information could serve to eliminate or reprioritize your differentials.
As you consider your differentials, remember that the goal is to reduce the level of uncertainty. However, you do not want to inadvertently or erroneously eliminate diseases that should remain in contention as possible causes of the patient’s disease pattern. One way to accomplish this is to consider broad categories of disease first and then decide if any can or should be eliminated. This process is incredibly important as it keeps us from excluding diseases that we might dismiss due to any of our biases.
One scheme is the DAMN IT V mnemonic. Each letter stands for one or more general disease categories that might account for the constellation of data that you have before you (Table 1.3). For those potentially offended by this scheme, you might choose to use CITIMITVAN, which functions in the same way (Table 1.4). Always evaluate these lists as you generate differentials to be sure that a disease process is not overlooked. Equally, try to eliminate categories for which a disease
TABLE 1.3 Acronym for different disease etiologies (DAMN IT V).
D Degenerative/developmental
A Anomalous (congenital)/autoimmune
M Metabolic
N Neoplastic/nutritional
I Inflammatory/infectious/iatrogenic/idiopathic
T Trauma/toxic
V Vascular
TABLE 1.4 Acronym for different disease etiologies (CITIMITVAN).
C Congenital
I Inflammatory
T Trauma
I Infectious
M Metabolic
I Idiopathic/iatrogenic
T Toxic
V Vascular
A Autoimmune
N Neoplasia/nutritional
in the specific patient is highly unlikely, improbable, or even nonexistent.
Within each of these broad categories, consider specific disease types that might explain your imaging findings and conclusions. In our cardiac example, we considered congenital, degenerative, and infectious etiologies for left-sided cardiac enlargement, and would prioritize them based on the information we have about the patient, including species, breed, and age. Always run through this list to be sure you do not unintentionally exclude diseases that may explain the patient’s history, clinical signs, and imaging findings.
Finally, you need to determine your next steps. These may be additional diagnostics, or may consist of therapeutic options. In our example, echocardiography might be the next best step in truly determining the underlying pathology and creating a treatment plan. This will obviously differ depending on the diseases that we identify or suspect. To continue the example, if the patient is in left heart failure and has clinical signs related to the radiographic changes identified, one should always stabilize the patient prior to other diagnostic tests that might add to respiratory stress and compromise the patient further.
Pitfalls of Interpretation
Many interpretation pitfalls have been characterized. Some are called different names by different specialists. Awareness of the major pitfalls can be important in their avoidance. While the following list is not exhaustive, it serves as a reminder of the more common pitfalls and biases that you may encounter as you continue on the journey toward becoming a radiologist. These are biases that should be avoided. One way to do this is to present the case and radiographic images to a colleague without the clinical information (history and signalment) to hear their interpretation and conclusions. This will help to eliminate some of the biases presented below.
Framing Bias
Framing bias is a particularly common error. The problem presented in the clinical history may erroneously or incompletely implicate a particular system that influences both the evaluation and interpretation process [2]. A patient is presented for acute vomiting, and the owner suspects that the dog ate something that they can no longer find. We are programmed to look for the foreign body, and we may be sensitized or biased to identify something abnormal in the gastrointestinal tract. The problem may be elsewhere, and if the clinical context we were given was a bit different, we may have directed our search differently. This is why some radiologists choose to review the history and clinical findings after their first review of a study.
Confirmation Bias
We are often guilty of confirmation bias, which is simply looking for evidence that supports what you already know, or think you know [2]. It is human nature to see only what we actively look for; who does not prefer to have their opinions or ideas validated rather than refuted? When our awareness is raised by new knowledge, whether that is a new journal article identifying a novel finding or an addition to our process that forces recognition of previously ignored features, we hopefully increase our ability to diagnose diseases.
Satisfaction of Search
Satisfaction of search bias is also common. It is the tendency to halt the search for abnormalities once one has been found [2]. Often patients have more than one abnormality, and while not all abnormalities may be related to the clinical complaint, additional findings may further support a diagnosis. Alternatively, additional findings may implicate an occult process that has not yet declared itself clinically. The radiologist’s goal is always to provide a complete diagnostic assessment of the study at hand.
Availability Bias
Availability bias is probably less common but still prevalent. Also known as heuristic bias, this error occurs when we allow easily recalled experiences to have a large influence on our thinking. It makes us consider diseases that we know about and recall easily, even if they do not apply specifically to a particular case [2].
Inattention Bias
Inattention bias is also called a location-related error. It is the inability to recognize an abnormal finding within the study because it does not appear in the purposefully evaluated area, or is at the periphery of the study [2]. This is a particular risk when one does not follow an interpretation paradigm, which can help ensure that the entire image is examined thoroughly.
Conclusion
Diagnostic image interpretation is exciting, challenging, and fun. This chapter has introduced the concepts on which to build a successful interpretation paradigm for evaluating all forms of imaging. Interpretation paradigms will be presented for each of the sections in this book (musculoskeletal, thorax, and abdomen). These paradigms should be used as a starting point for ensuring complete evaluation of the radiographic images. The formulation of conclusions or summaries, differentials and next steps is a critical piece of the puzzle when interpreting radiographic studies. Remember that this process involves continuous learning strategies, and journal clubs/evaluations should be a routine part of the practice of a veterinarian.
2. Gunderman, R.B. (2009). Biases in radiologic reasoning. Am. J. Roentgenol. 192: 561–564.
Physics of Diagnostic Imaging
Elizabeth Huyhn1, Elodie E. Huguet2, and Clifford R. Berry3
1 VCA West Coast Specialty and Emergency Animal Hospital, Fountain Valley, CA, USA
2 Department of Small Animal Clinical Sciences, College of Veterinary Medicine, University of Florida, Gainesville, FL, USA
3 Department of Molecular Biomedical Sciences, College of Veterinary Medicine, North Carolina State University, Raleigh, NC, USA
Overview: Uses and Advantages
Radiography is an imaging technique that uses x-ray attenuation within veterinary patients to obtain two-dimensional images of internal organs and to assess for the presence or absence of disease. Radiography in veterinary medicine can be subdivided into projectional radiography, computed tomography (CT), and fluoroscopy.
Projectional radiography utilizes electromagnetic or ionizing radiation to obtain static two-dimensional images of a three-dimensional patient (body part), which in and of itself presents projection artifacts that have to be properly interpreted as normal or abnormal. Common uses for projection radiography in veterinary medicine include thoracic, abdominal, musculoskeletal, and contrast imaging (Figure 2.1).
CHAPTER 2
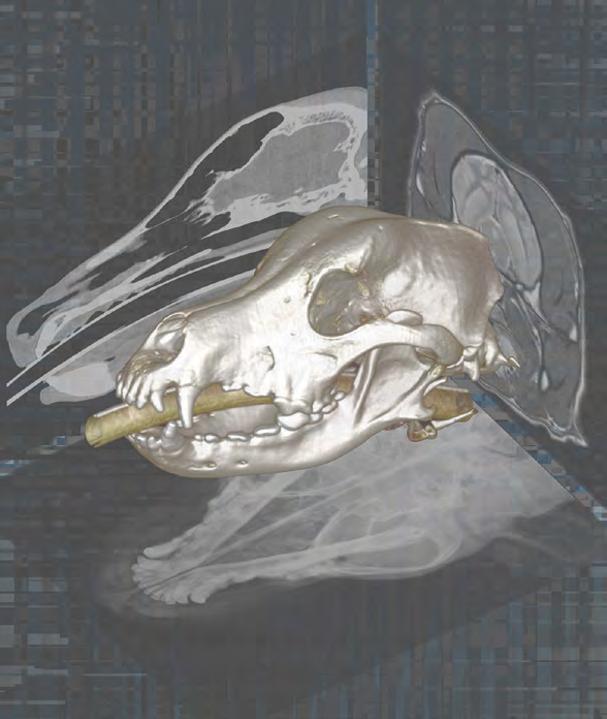
Computed tomography uses ionizing radiation reconstructed by a computer to create multiple transverse images of the patient based on the various physical densities compared with the normal attenuation of water (called a Hounsfield unit or HU).
Fluoroscopy also utilizes ionizing radiation to obtain dynamic, real-time images (usually limited by a frame rate of 30 frames/second) that are viewed over time. This modality is used to observe the movement of contrast through the esophagus, cardiac structures, or different vessels, as well as diagnosing dynamic diseases such as a collapsing trachea.
Contrast radiography can be used in projectional radiography, computed tomography, and fluoroscopy to supplement information gained from these modalities. Types of contrast radiography include positive contrast and negative contrast. Common positive contrast agents used include barium sulfate paste or liquid or iodine (i.e., nonionic, iodinated positive contrast medium). In radiography, positive contrast is metallic,
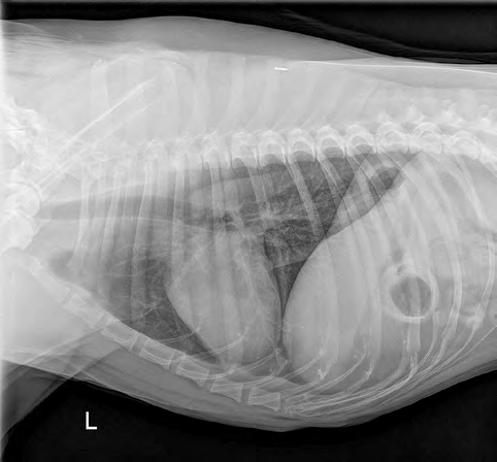
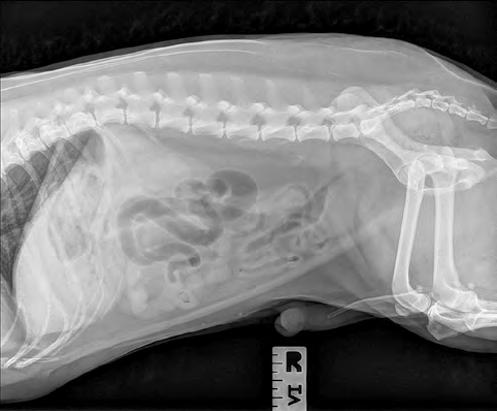
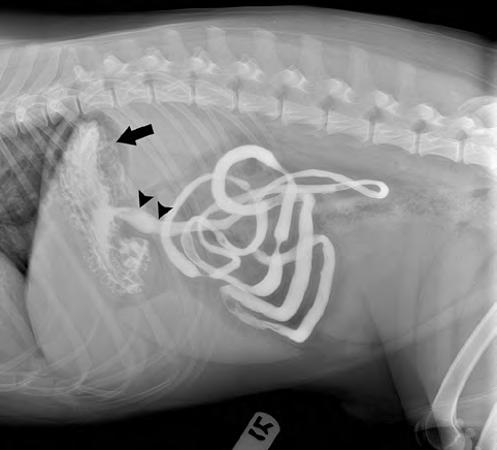
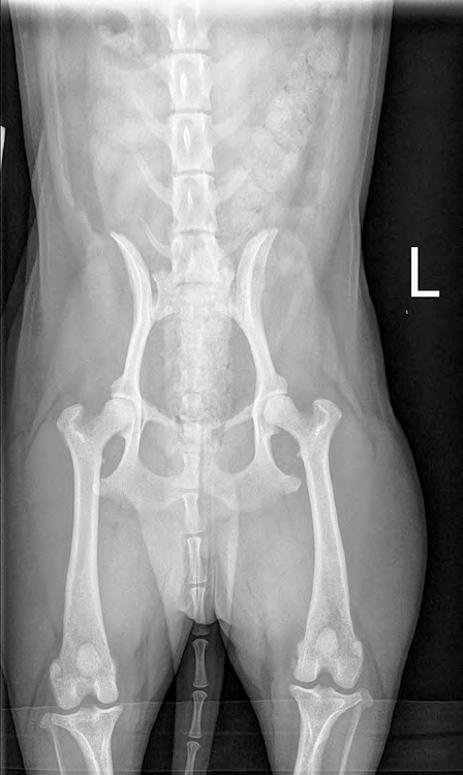
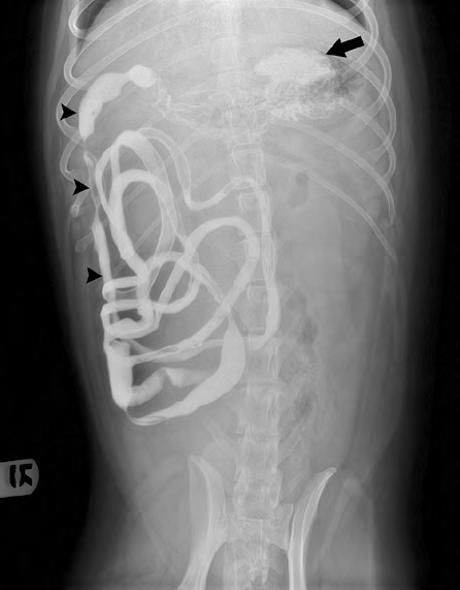
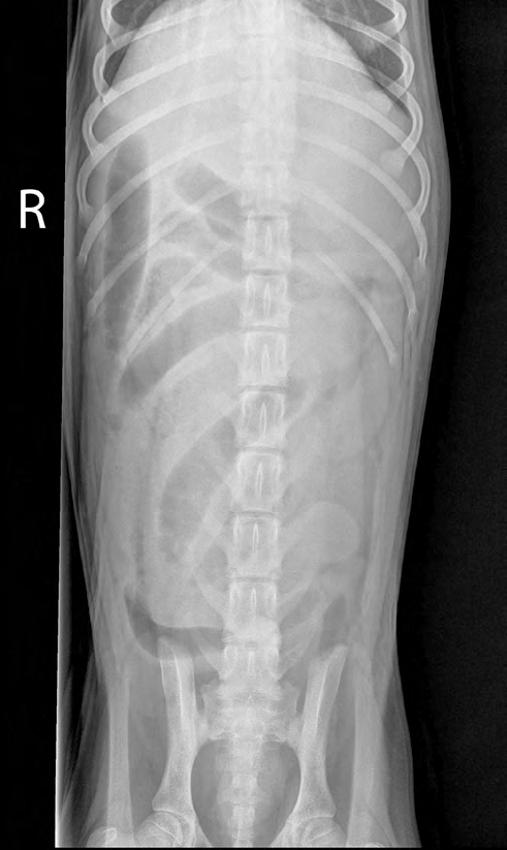
FIGURE 2.1 (A) Left lateral thoracic radiograph in a normal dog. (B) Right lateral abdominal radiograph in a normal dog. (C) Ventrodorsal pelvis radiograph in a normal dog. (D) Right lateral abdominal radiograph after barium positive contrast administration in a normal dog. (E) Ventrodorsal abdominal radiograph after barium positive contrast administration in the same patient. Note the positive barium contrast in the stomach (black arrow), duodenum (black arrowheads), and some segments of the jejunum.
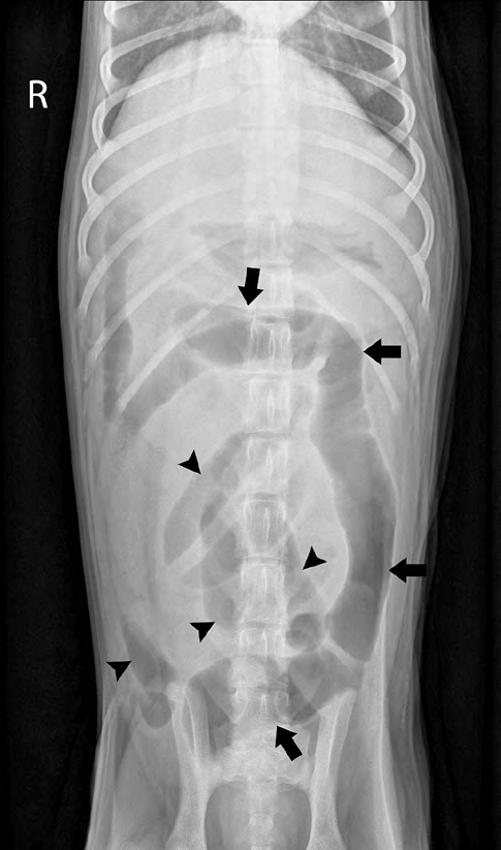
so it increases the visibility of the organ or vessel within which it is introduced (Figure 2.1). Negative contrast agents typically used are room air or carbon dioxide which is gas opaque (radiolucent) on the image (Figure 2.2). Double-contrast studies can be done using a combination of positive and negative contrast media to give optimal detail of a mucosal surface such as the urinary bladder (Figure 2.3) [1].
Digital projectional radiography is used as a common first-step modality in diagnostic imaging as it is relatively affordable and can be obtained quickly. Digital radiography has an increased dynamic range which implies that the anatomy has varying density values that can be visualized. Using a broad scale contrast display, all the anatomy can be seen in the radiographic image within the displayed range of optical densities. The displayed densities can be adjusted according to the contrast and brightness of the image. The contrast and brightness of the image are attained through window width and window level. If changes to the window width are made,
the contrast of the image will change; when the window width narrows, there is increase in the displayed contrast. If changes to the window length are made, the brightness of the image will change.
Basics of X-Ray
Interaction in Matter
To understand how radiographs are made, it is important to recognize how photons interact with matter. Photons can interact with matter via (i) coherent scattering, (ii) photoelectric effect, (iii) Compton scattering, (iv) pair production, and (v) photodisintegration [2]. Pair production and photodisintegration have no relevance to diagnostic radiology so they will not be reviewed further.
FIGURE 2.2 (A) Survey ventrodorsal abdominal radiograph. (B) Ventrodorsal abdominal radiograph after a pneumocolon. Note the distinguishing margins of the colon (black arrows) in relation to the fluid- and gas-dilated segments of the small intestine (black arrowheads).