ELECTROCHEMICAL METHODS
Fundamentalsand Applications
Allen J.Bard
Larry R.Faulkner
Department ofChemistry and Biochemistry University ofTexas at Austin
JOHN WILEY &SONS, INC
New Yorke Chichester • Weinheim
Brisbane e Singapore e Toronto
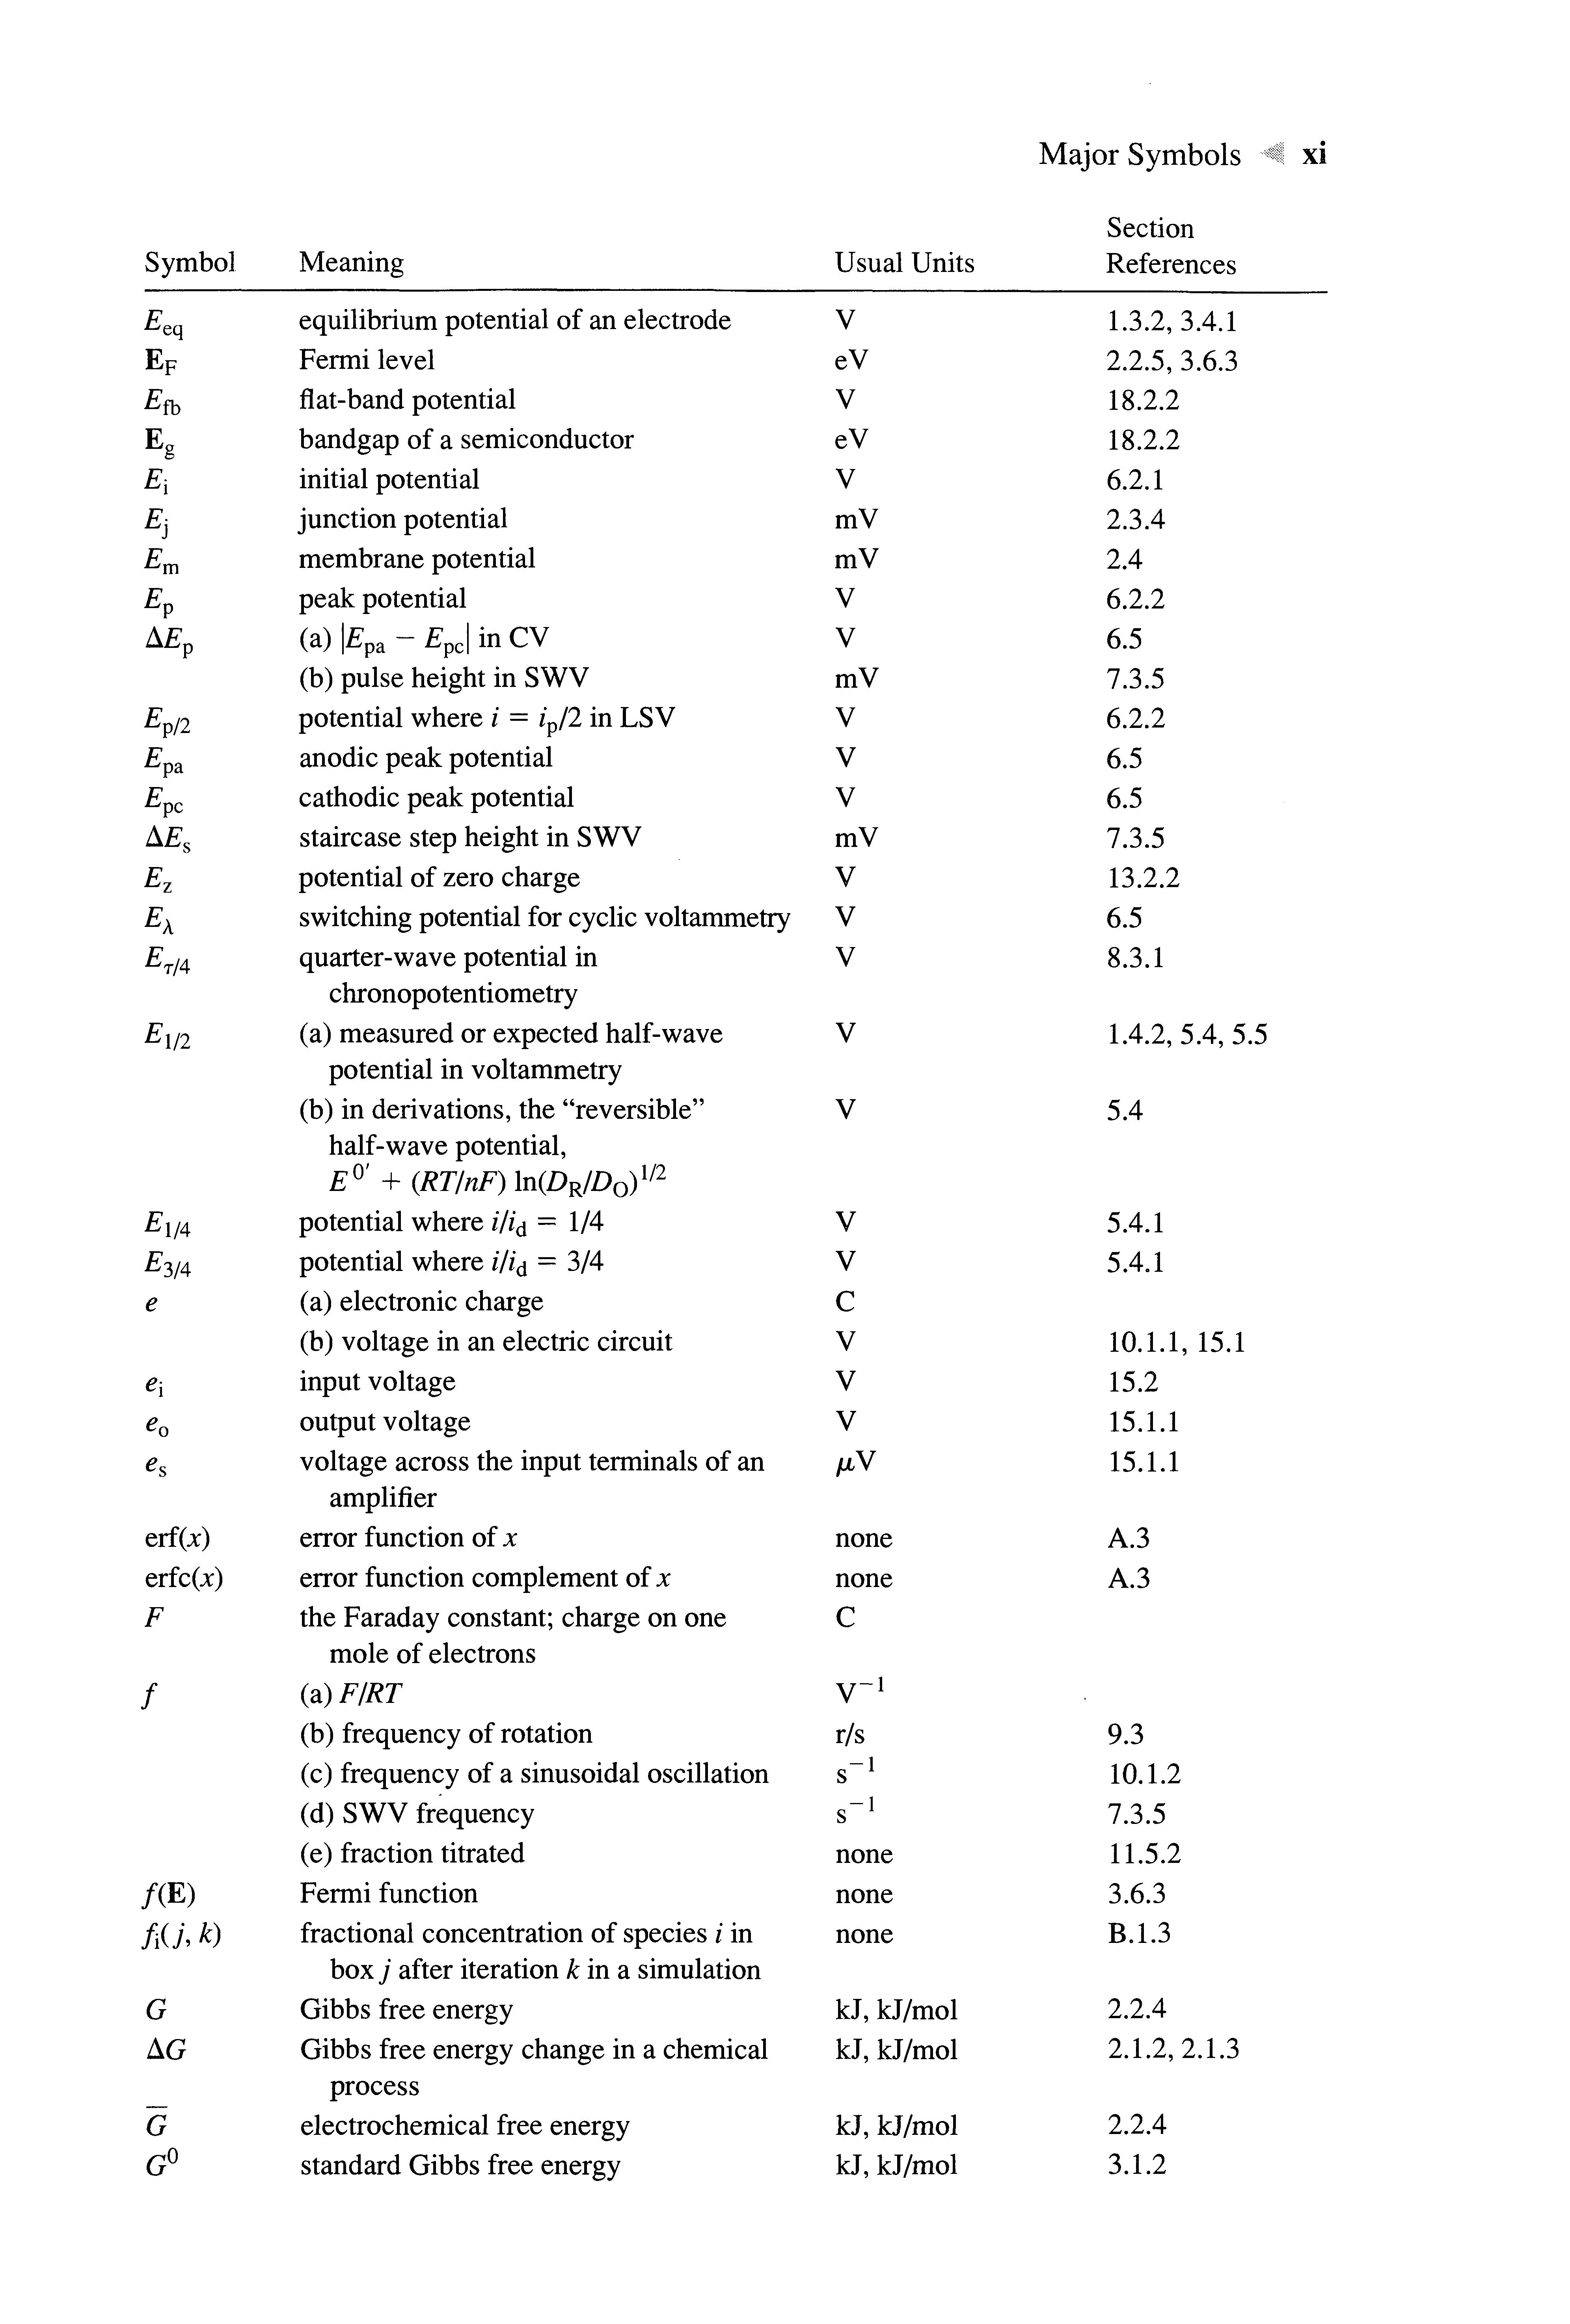
Meaning
equilibrium potential of anelectrode
Fermi level
flat-bandpotential bandgap of a semiconductor
initial potential
junction potential membrane potential peak potential
(a)|£ pa -£ pc |inCV
(b) pulse height in SWV potential where / = /p/2 in LSV anodic peak potential cathodic peak potential
staircase step height in SWV potential of zero charge switching potential for cyclic voltammetry
quarter-wave potential in chronopotentiometry
(a) measured or expected half-wave potential in voltammetry
(b) in derivations, the "reversible" half-wave potential,
Eo> + (RT/nF)\n(DR/D0)l/2 potential where i/i^ =1/4 potential where ///d = 3/4
(a) electronic charge
(b) voltage in an electric circuit input voltage output voltage voltage across the input terminals of an amplifier error function of x
error function complement of x the Faraday constant; charge on one mole of electrons
(a) F/RT
(b) frequency of rotation
(c) frequency of a sinusoidal oscillation
(d) SWV frequency
(e) fraction titrated
Fermi function
fractional concentration of species / in boxy after iteration к in a simulation
Gibbs free energy
Gibbs
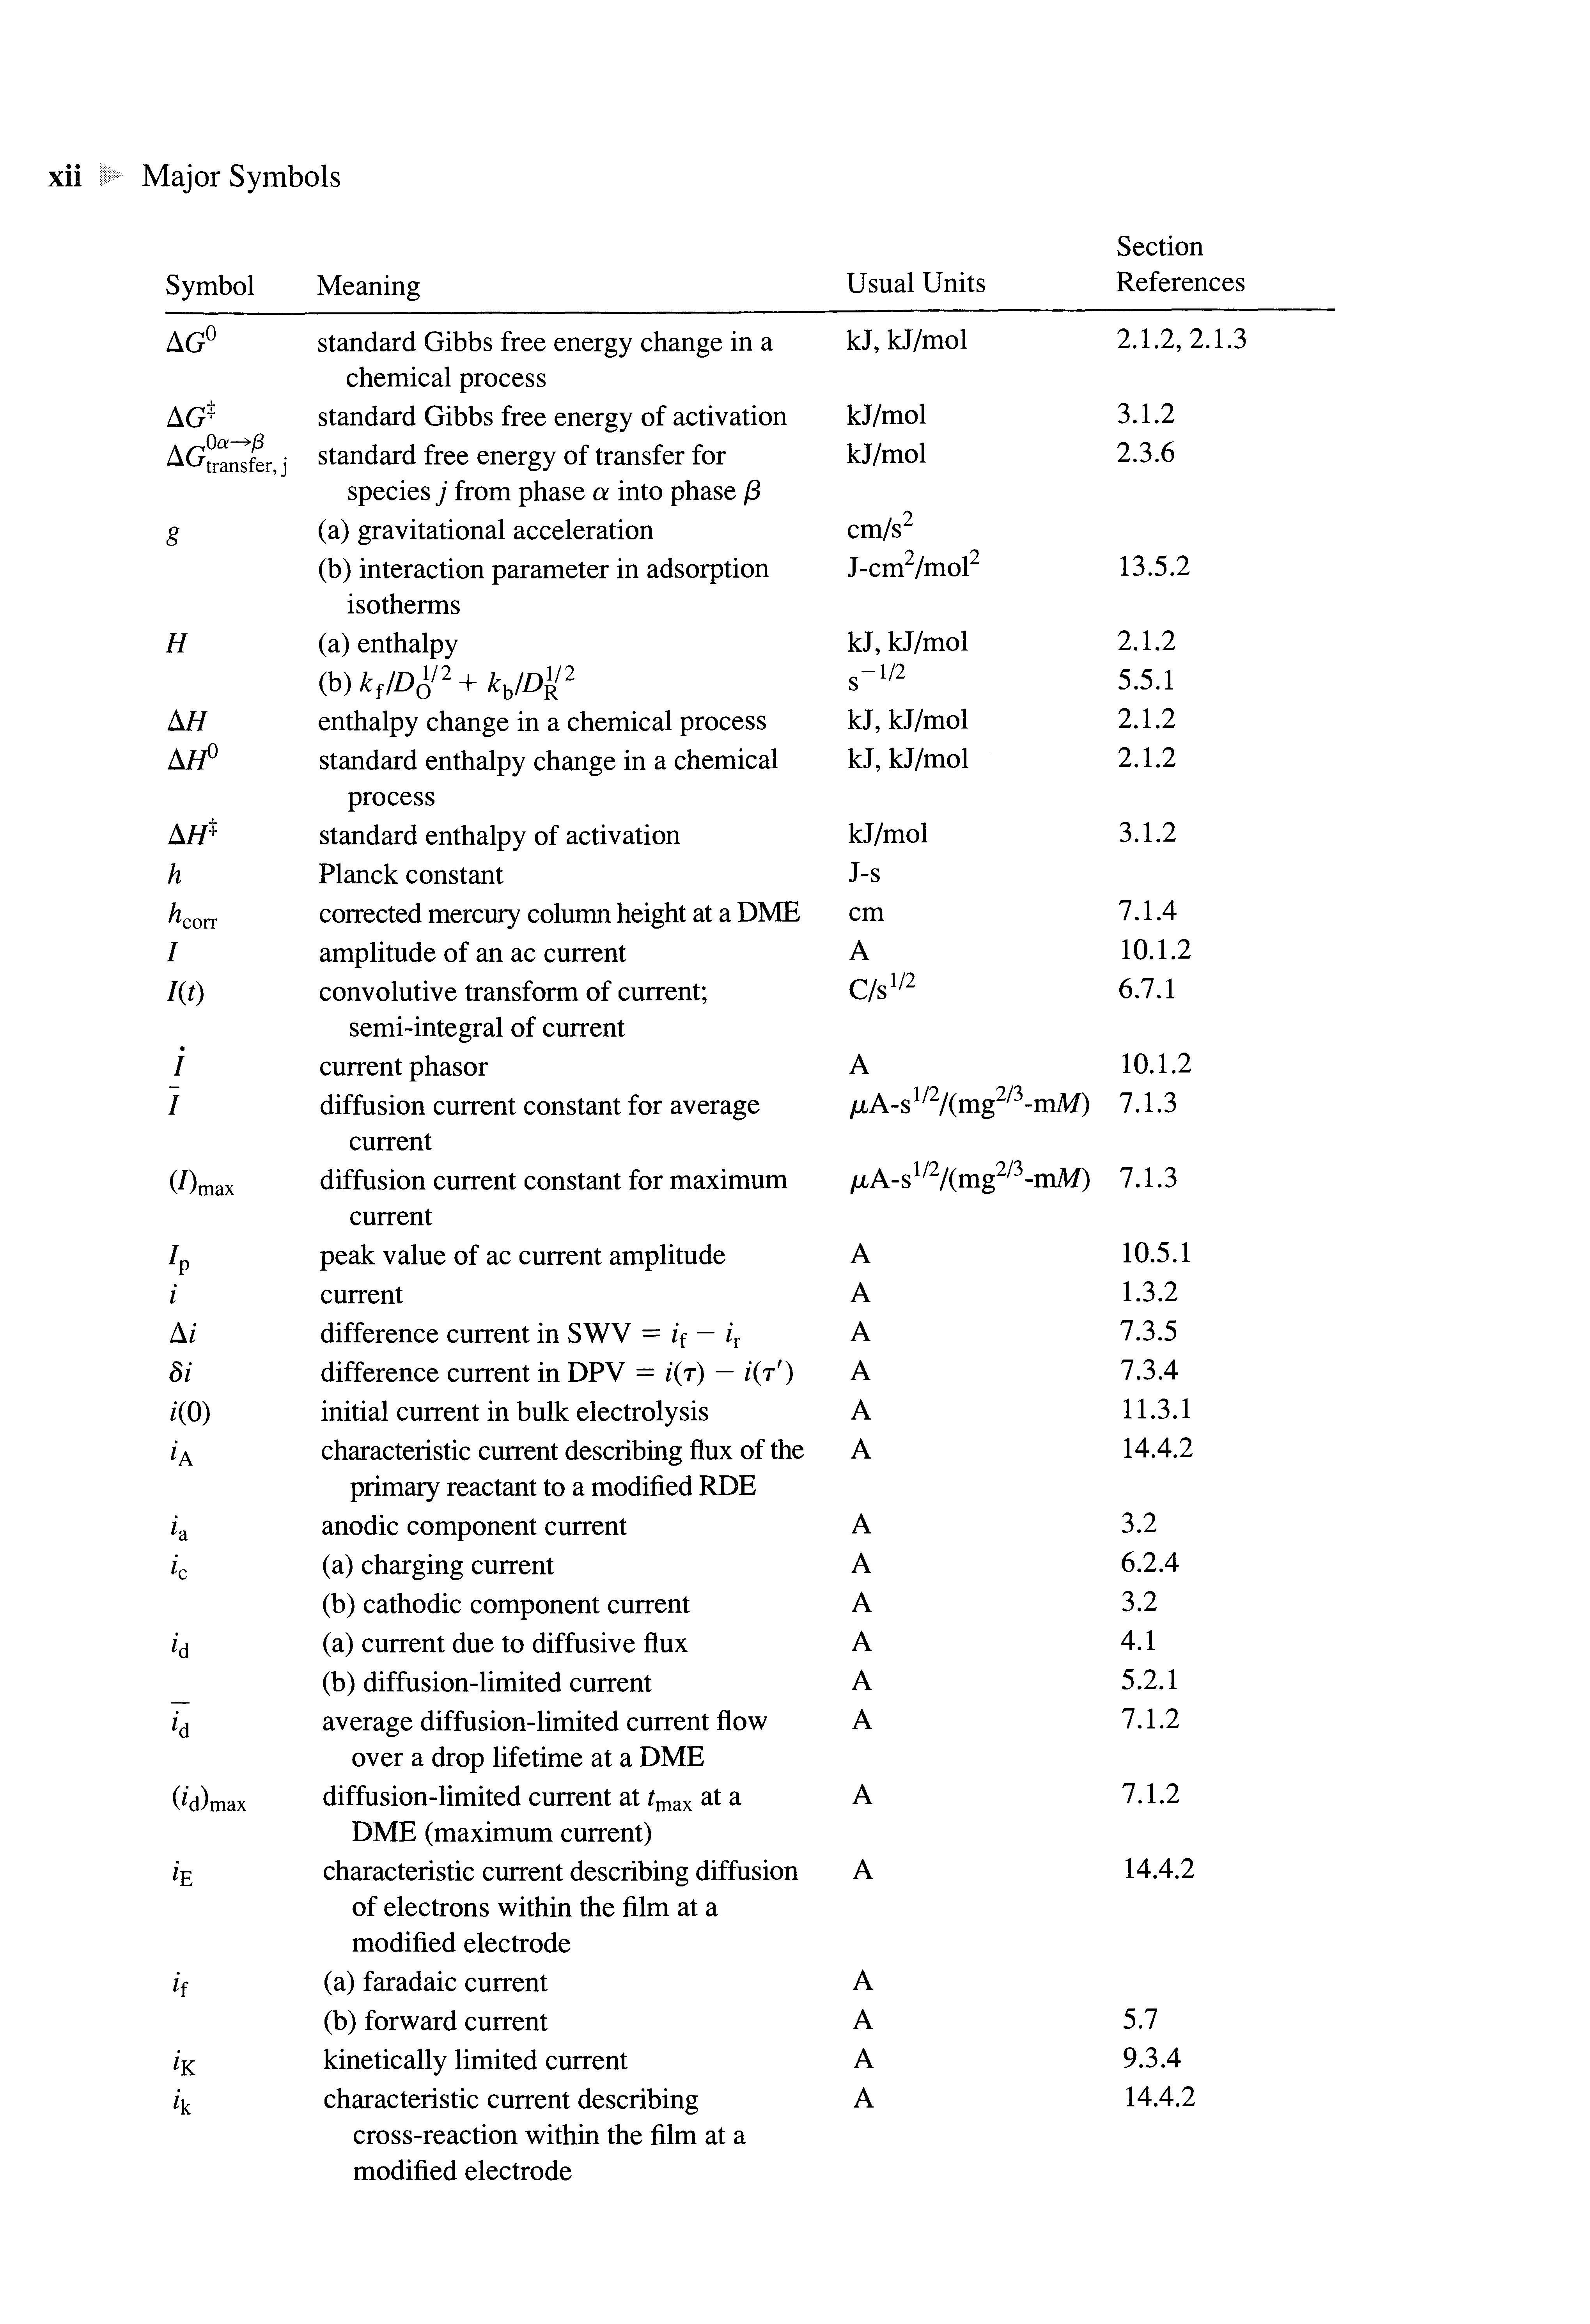
Symbol Meaning
standard Gibbs free energy change in a chemical process
standard Gibbs free energy of activation
standard free energy of transfer for species j from phase a into phase/3
(a) gravitational acceleration (b) interaction parameter in adsorption isotherms
(a) enthalpy
enthalpy change in a chemical process standard enthalpy change in a chemical process
standard enthalpy of activation Planck constant
corrected mercury columnheight at aDME
amplitude of an ac current
convolutive transform of current; semi-integral of current current phasor
diffusion current constant for average current
diffusion current constant for maximum current
peak value of ac current amplitude current
difference current in SWV = if — i r
difference current in DPV = /(r) - Z(r')
initial current in bulk electrolysis
characteristic current describing flux of the primary reactant to a modified RDE anodic component current
(a) charging current
(b) cathodic component current
(a) current due to diffusive flux
(b) diffusion-limited current average diffusion-limited currentflow over a drop lifetime at aDME
diffusion-limited current at t m dX at a DME (maximum current)
characteristic current describing diffusion of electrons within the film at a modified electrode
(a) faradaic current
(b) forward current kinetically limited current
characteristic current describing cross-reaction within the film at a modified electrode
kJ, kJ/mol
kJ/mol
kJ/mol
cm/s2 J-cm2/mol2
kJ, kJ/mol s -l/2
kJ, kJ/mol
kJ, kJ/mol
kJ/mol J-s cm
1/2/(mg2/3-mM)
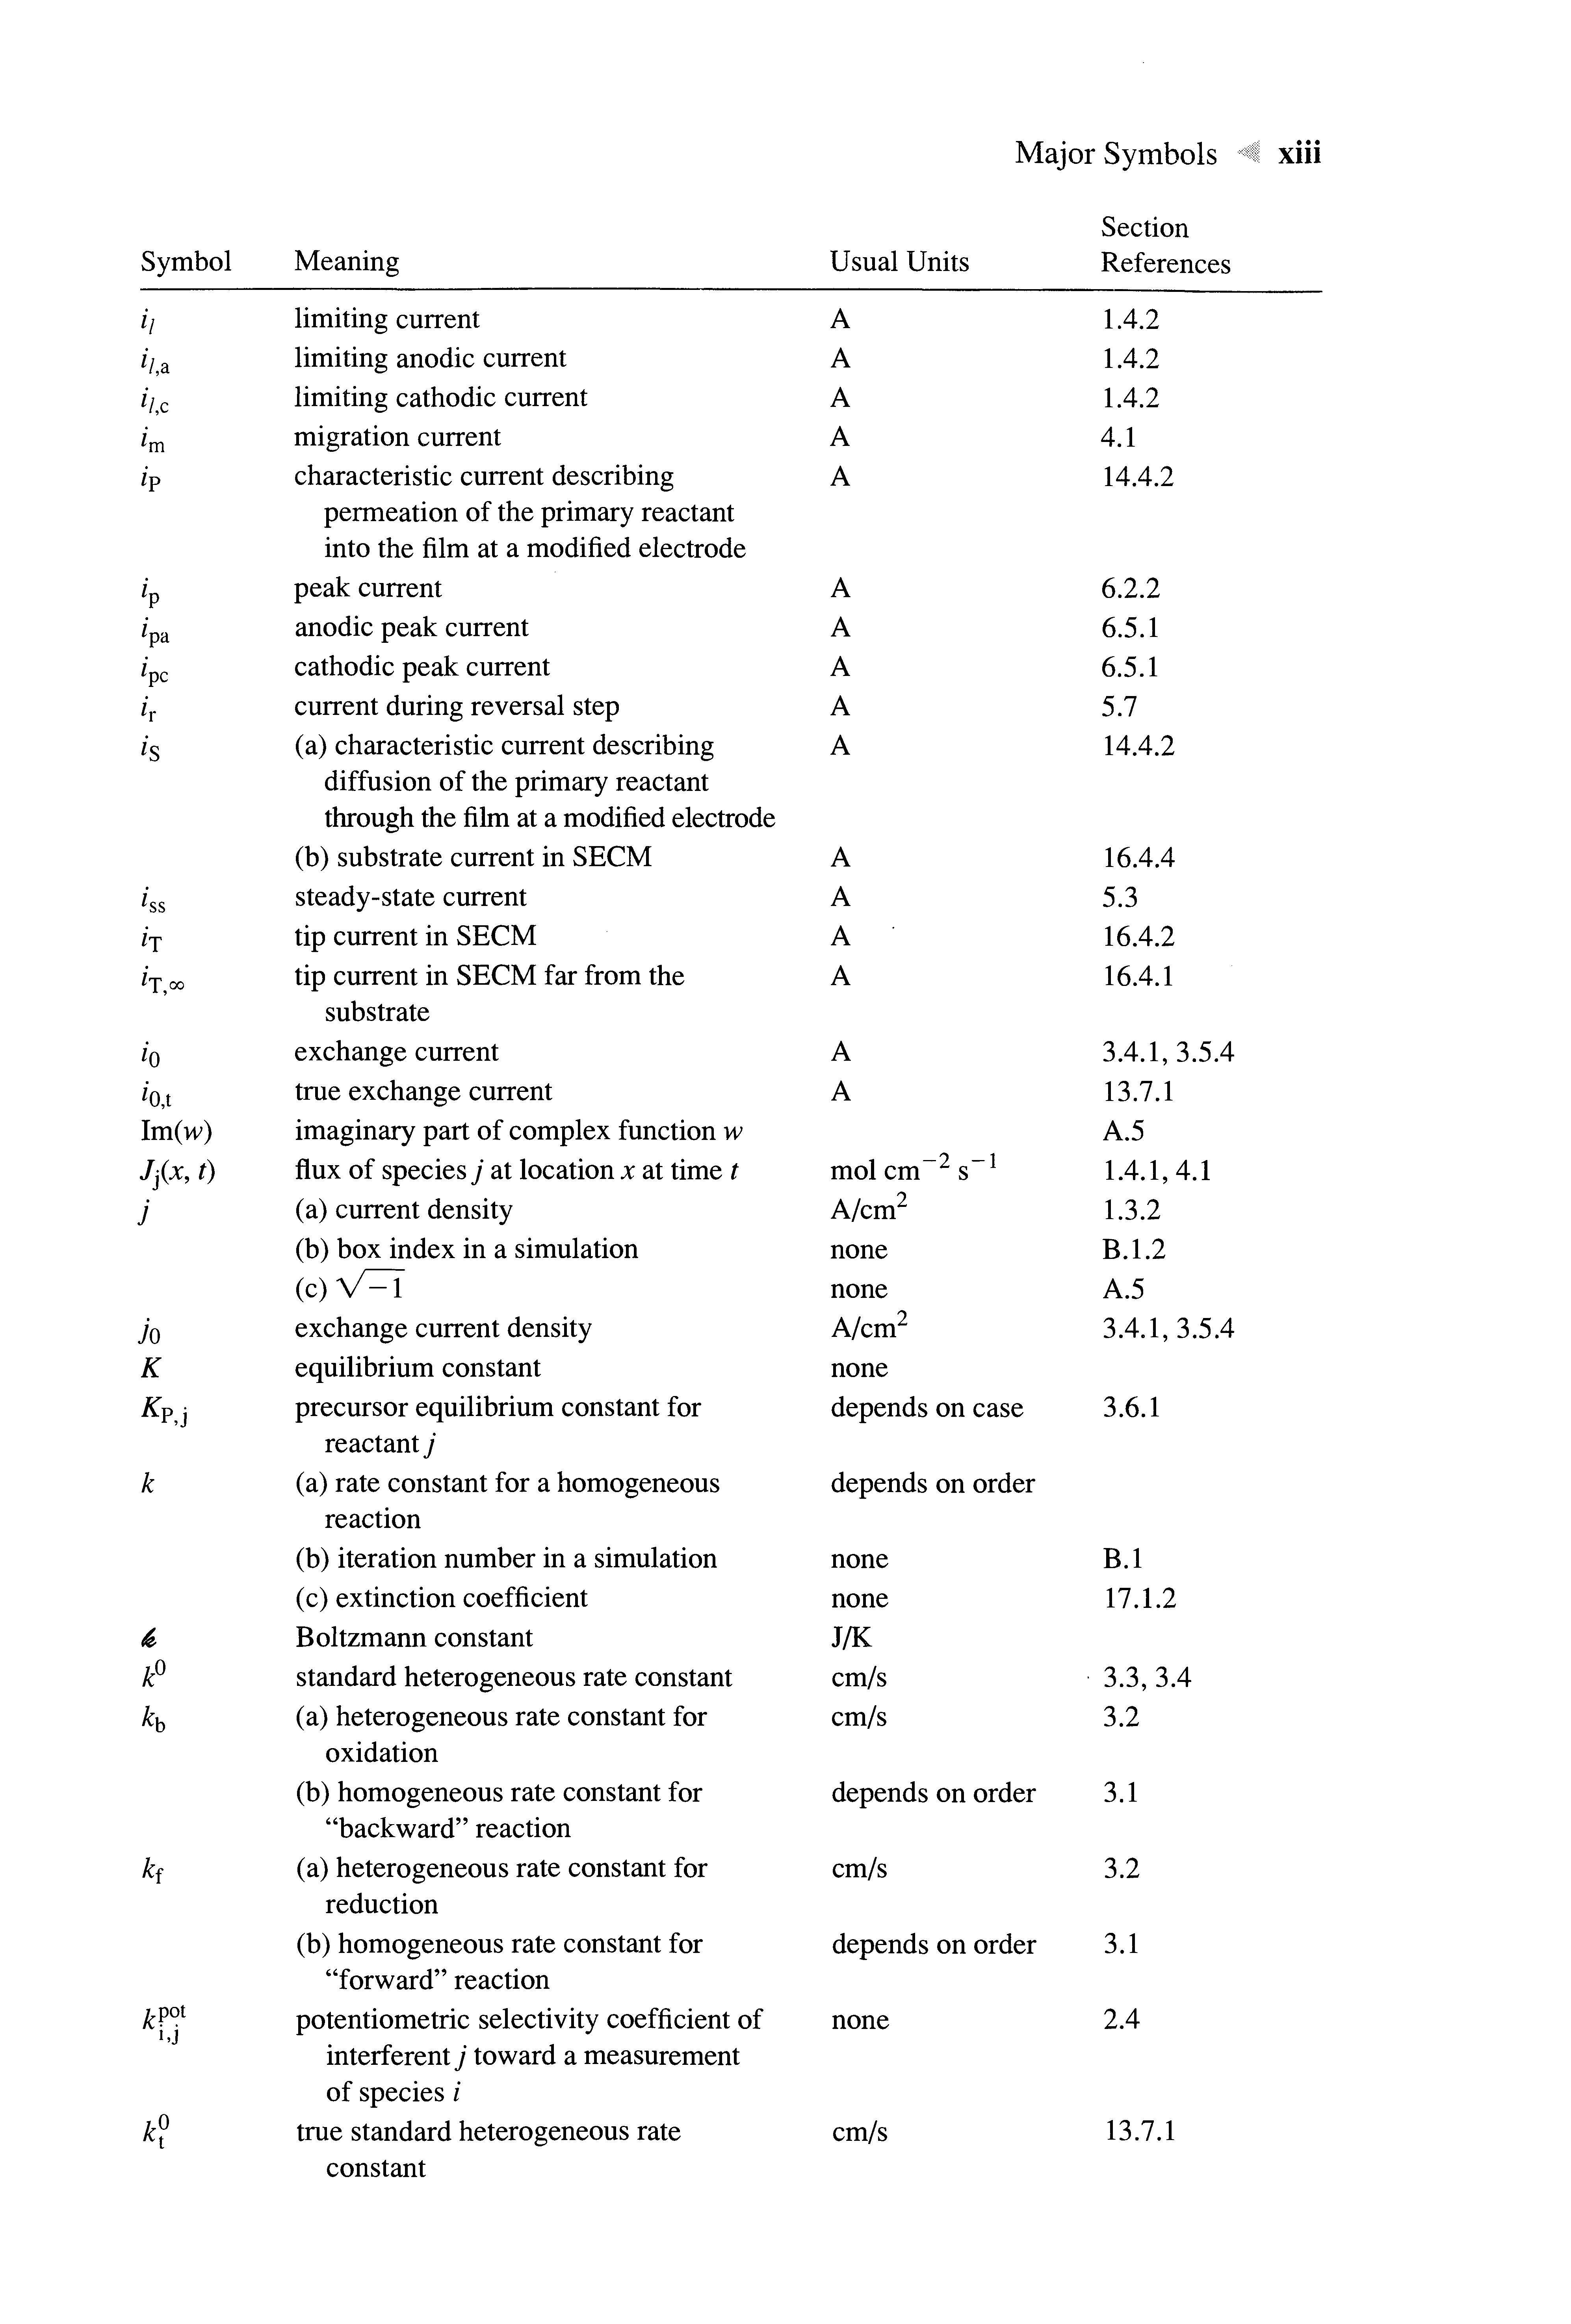
Meaning limiting current limiting anodic current limiting cathodic current
migration current
characteristic current describing permeation of the primary reactant into the film at a modified electrode peak current anodic peak current cathodic peak current current during reversal step
(a) characteristic current describing diffusion of the primary reactant through the film at a modified electrode
(b) substrate current in SECM steady-state current tip current in SECM tip current in SECM far from the substrate
exchange current true exchange current imaginary part of complex function w flux of species j at location x at time t
(a) current density
(b) box index in a simulation
(c)V^I
exchange current density
equilibrium constant
precursor equilibrium constant for reactant j
(a) rate constant for a homogeneous reaction
(b) iteration number in a simulation
(c) extinction coefficient
Boltzmann constant
standard heterogeneous rate constant
(a) heterogeneous rate constant for oxidation
(b) homogeneous rate constant for "backward" reaction
(a) heterogeneous rate constant for reduction
(b) homogeneous rate constant for "forward" reaction
potentiometric selectivity coefficient of interferenty toward a measurement of species/ true
Symbol Meaning
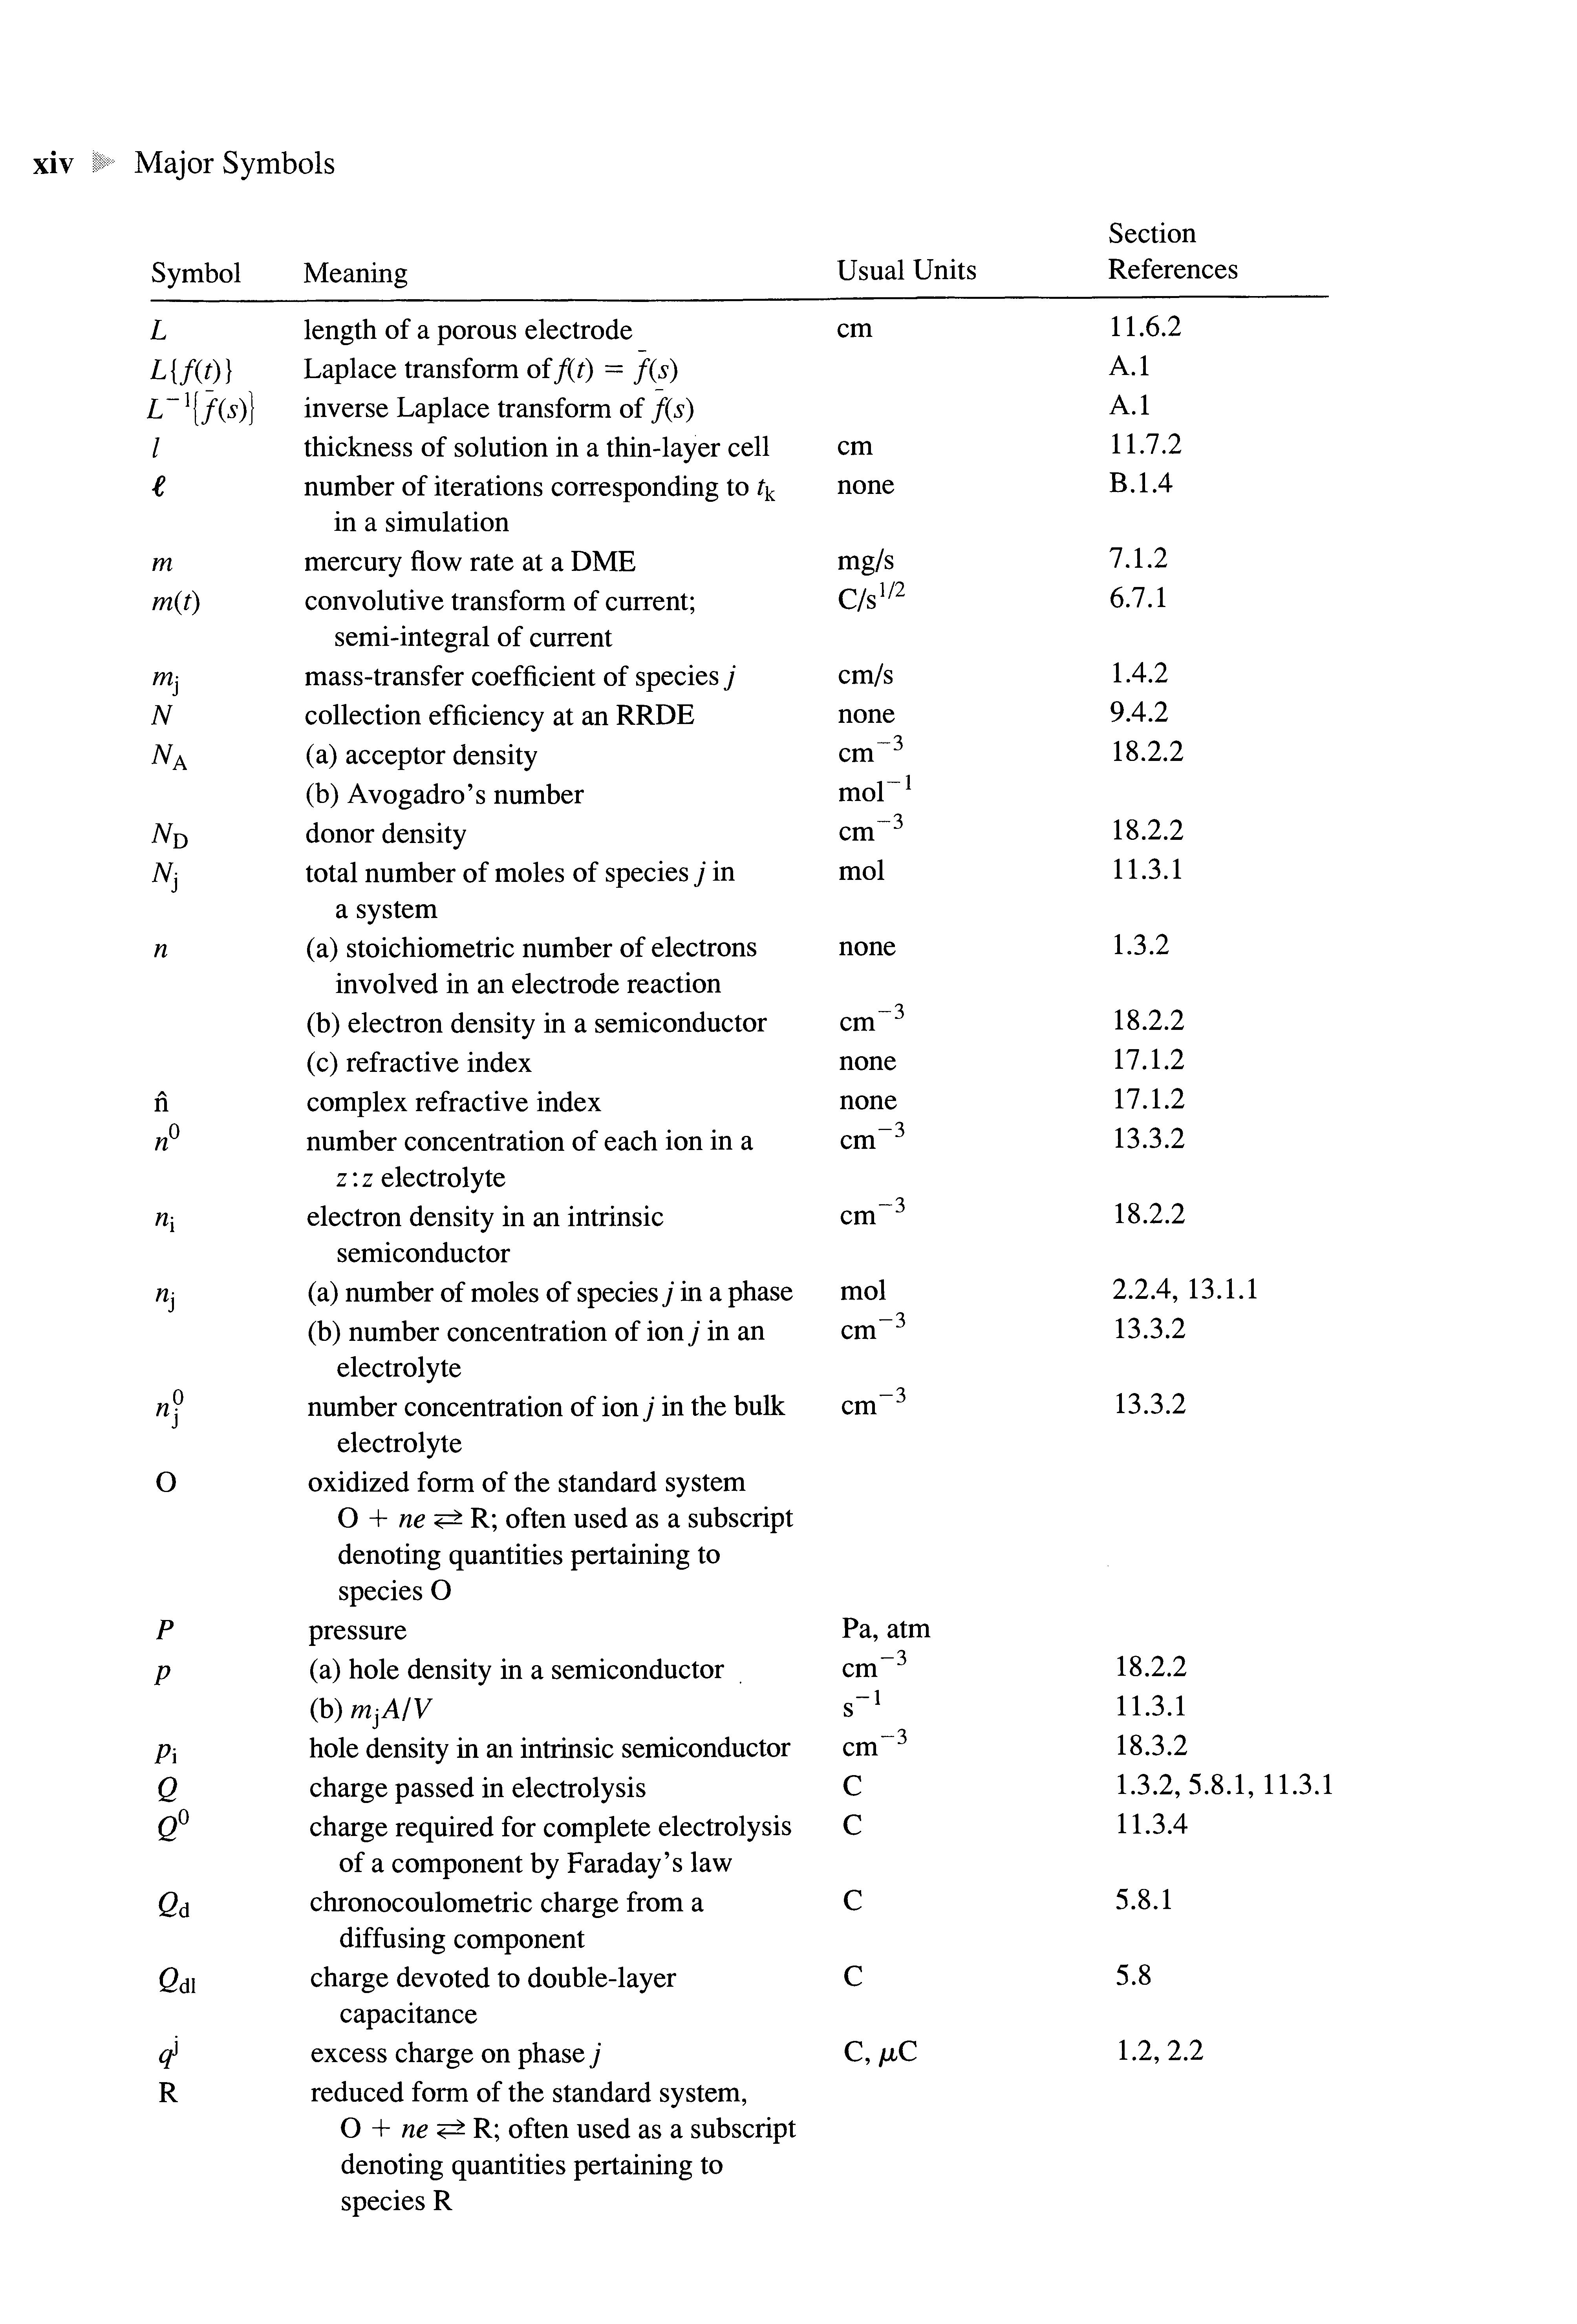
L length of a porous electrode
L{f(t)} Laplace transform of/(0 = f(s)
L~]{f(s)} inverse Laplace transform of f(s)
I thickness of solution in a thin-layer cell
€ number of iterations corresponding to t^ in a simulation
m mercury flow rate at a DME
m(t) convolutive transform of current; semi-integral of current
m-} mass-transfer coefficient of species j
N collection efficiency at an RRDE
NA (a)acceptor density
(b) Avogadro's number
ND donor density
iVj total number of moles of species j in a system
n (a)stoichiometric number of electrons involved in anelectrode reaction
(b) electron density in a semiconductor
(c) refractive index
n complex refractive index
n° number concentration of each ionina z: z electrolyte
щ electrondensity inan intrinsic semiconductor
щ (a)numberofmoles of speciesу inaphase (b) numberconcentration of ionу in an electrolyte
n® numberconcentration ofionу inthe bulk electrolyte
О oxidized form of the standard system
О + ne ^ R;often used as a subscript denoting quantitiespertaining to species О
P pressure
p (a)hole density ina semiconductor (b) mjA/V
P\ hole density inanintrinsicsemiconductor
Q charge passed in electrolysis
<2° charge required forcomplete electrolysis of a componentby Faraday'slaw
gd chronocoulometric charge from a diffusing component
Qdi charge devoted todouble-layer capacitance
cf excess charge onphaseу
R
О + ne i=^ R;often used as a subscript denoting quantities pertainingto species R
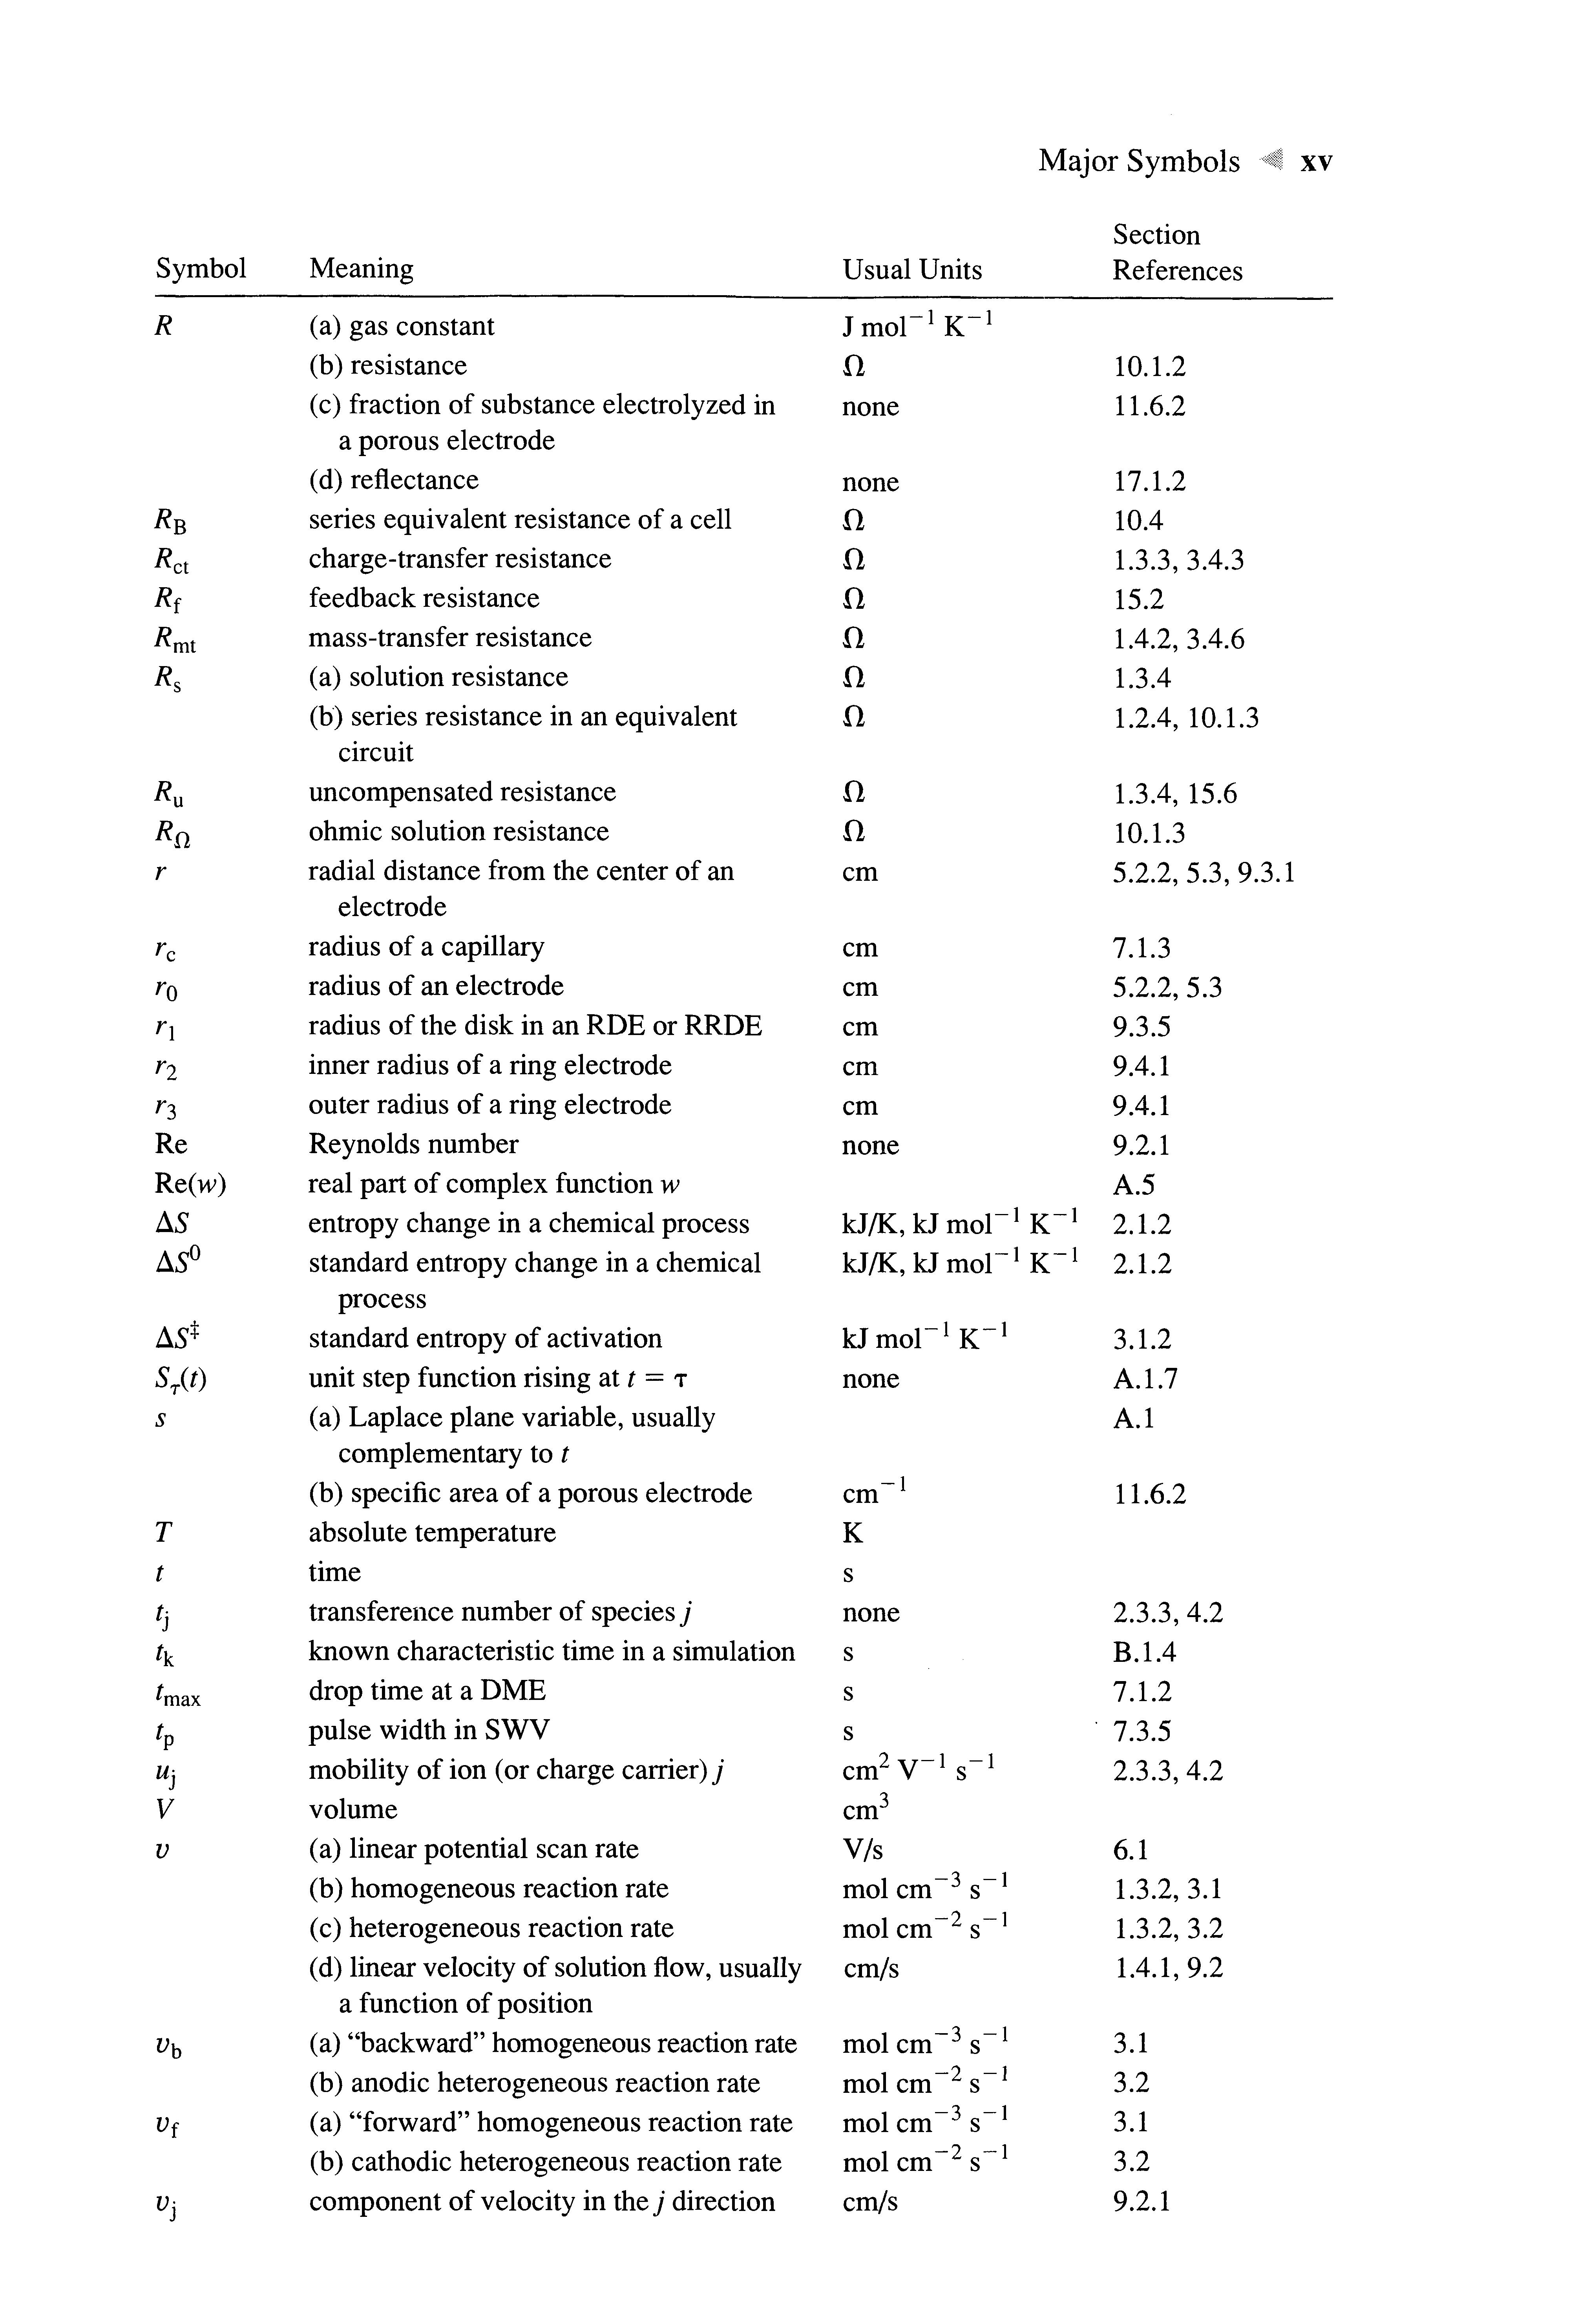
Meaning
(a) gas constant
(b) resistance
(c) fraction of substance electrolyzed in a porous electrode
(d) reflectance
series equivalent resistance of a cell charge-transfer resistance feedback resistance mass-transfer resistance
(a) solution resistance
(b) series resistance in an equivalent circuit
uncompensated resistance
ohmic solution resistance
radial distance from the center of an electrode
radius of a capillary radius of an electrode
radius of the disk in an RDEor RRDE
inner radius of a ring electrode
outer radius of a ring electrode
Reynolds number
real part of complex function w entropy change in a chemical process
standard entropy change in achemical process
standard entropy of activation
unit step function rising at t = т
(a) Laplace plane variable, usually complementary to t
(b) specific area of a porous electrode absolute temperature time
transference number of speciesу
known characteristic time in a simulation drop time at aDME
pulse width in SWV
mobility of ion (or charge carrier) j volume
(a) linear potential scan rate
(b) homogeneous reactionrate
(c) heterogeneous reactionrate
(d) linear velocity of solution flow, usually a function of position
(a) "backward" homogeneous reactionrate
(b) anodic heterogeneous reactionrate
(a) "forward" homogeneous reactionrate
(b) cathodic heterogeneous reactionrate component of velocity in thej direction Usual Units
kJ/K.kJmol^K" 1 kJ/K.kJmol^K" 1
kJmol^K" 1 none cm"1 К
4.2
3.2
rate of mass transfer toa surface probability density function for species j width of aband electrode
work term for reactantj inelectron transfer
capacitive reactance
mole fraction of species j
distance, often from aplanar electrode
distance of the IHPfrom theelectrode surface
distance of the OHPfrom theelectrode surface
admittance
admittance vector distance from anRDEorRRDE
(a) impedance
(b) dimensionless currentparameterin simulation impedance vector faradaic impedance
imaginary part of impedance real part ofimpedance
Warburg impedance
(a) distance normal tothesurface ofa disk electrode oralong a cylindrical electrode
(b) charge magnitude of each ionina z:z electrolyte charge onspecies j in signed unitsof
GREEK SYMBOLS
Symbol Meaning Usual Units
(a) transfer coefficient
(b) absorption coefficient
(a) distance factor for extended charge transfer
(b) geometric parameter for anRRDE
(c) 1 - a
(a) дЕ/дС}(0, t)
(b) equilibrium parameter in anadsorption isotherm for speciesу
surface excess of species j at equilibrium relative surface excess of species у with respect tocomponentr
surface excess of species j atsaturation
(a) surface tension
(b) dimensionless parameterused to define frequency (time)regimes in step experiments at spherical electrodes
activity coefficient for speciesу ellipsometricparameter
r0(s/Do)l/2 , used to define diffusional regimes at a sphericalelectrode
"diffusion" layer thickness for speciesуat an electrode fed by convective transfer
(a) dielectricconstant
(b) optical-frequency dielectricconstant
(c) porosity
complex optical-frequency dielectric constant
molar absorptivity of speciesу
permittivity of free space
zetapotential
overpotential, E — E eq charge-transfer overpotential
viscosity offluidу mass-transfer overpotential
fractional coverage of an interface by speciesу
(a) conductivity of asolution
(b) transmission coefficient of areaction
(c) r0kf/Do, used to define kinetic regimes at a sphericalelectrode
(d) double-layer thicknessparameter
(e) partitioncoefficient for theprimary reactant in a modified electrode system
electronic transmission coefficient
equivalent conductivity of asolution
(a) reorganizationenergy for electron transfer
(b) £fr1/2(l + £0)/£>o2
(c) dimensionless homogeneous kinetic parameter, specific to a method and mechanism
(d) switching time in CV
(e) wavelength of light in vacuo
inner component of the reorganization energy
equivalent ionic conductivity for ionу
equivalent ionic conductivity of ionу extrapolated to infinite dilution
outer component of the reorganization energy
(a) reactionlayerthickness
(b) magnetic permeability
electrochemical potentialof electronsin
phase a
electrochemical potentialof speciesj in phase a
chemical potentialof speciesу inphase a
standard chemicalpotentialof species j in phase a
(a) kinematicviscosity
(b) frequency of light
stoichiometric coefficient for speciesу ina chemical process
nuclear frequency factor
(D0/DR)112
(a) resistivity
(b) roughnessfactor
electronic density of states
(a) nFv/RT
(b) (1MFAV2)[/3O/£>O /2 " J3R/£>R2]
excess charge density on phaseу
parameter describing potential dependence of adsorptionenergy
(a) transitiontimein chronopotentiometry
(b) sampling timein sampled-current voltammetry
(c) forward step duration in adouble-step experiment
(d) generally, a characteristic timedefined by thepropertiesof an experiment
(e) in treatmentsof UMEs, 4D o t/rl
start of potential pulse inpulse voltammetry
longitudinal relaxationtimeof a solvent
work function of aphase
(a) electrostatic potential
(b) phase angle between twosinusoidal signals
(c) phase angle between / ac and £ac
(d) film thickness in a modified electrode
(a) electrostatic potential difference between two points or phases
(b) potential drop in the space charge region of a semiconductor
absolute electrostatic potential of phase j
junction potential at a liquid-liquid interface
(bt)
(at)
standard Galvani potential of ion transfer for species j from phase a to phase/3 total potential drop across the solution side of the double layer potential at the OHPwith respect to bulk solution
(12/7)1/2£fT1/2/Do/2
dimensionless distance of box; in a simulation
normalized current for a totally irreversible system in LSV and CV
normalized current for a reversible system in LSV and CV
rate constant for permeation of the primary reactant into the film at a modified electrode
(a) ellipsometric parameter
(b) dimensionless rate parameter in CV
(a) angular frequency of rotation; 2тг X rotationrate
(b) angular frequency of a sinusoidal oscillation;2rrf
STANDARD ABBREVIATIONS
Meaning
analog-to-digital converter
Auger electron spectrometry
atomic force microscopy
anodic stripping voltammetry
Butler-Volmer
conduction band
homogeneous chemical process preceding heterogeneous electron transfer1 cyclic voltammetry
capillary zone electrophoresis
digital-to-analog converter
(a) dropping mercury electrode
(b) 1,2-dimethoxyethane
TV,TV-dimethylformamide
Dimethylsulfoxide
differential pulse polarography
differential pulse voltammetry
betters may be subscripted i, q, or r to indicate irreversible, quasi-reversible, or reversible reactions
Abbreviation Meaning
heterogeneous electron transfer followed by homogeneous
chemical reaction1
catalytic regeneration of the electroactive species in a following
homogeneous reaction1
and heterogeneous electron transfer, in sequence
Abbreviation Meaning
QRE
RDE RDS RPP
RPV RRDE SAM SCE SECM SERS SHE SHG
SMDE
SNIFTIRS
SPE SPR SSCE STM swv
TBABF4
TBAI
TBAP TEAP
THF
UHV
UME UPD XPS VB
quasi-reference electrode
rotating disk electrode rate-determining step
reverse pulse polarography
reverse pulse voltammetry
rotating ring-disk electrode self-assembled monolayer
saturated calomel electrode
scanning electrochemical microscopy
surface enhanced Raman spectroscopy
standard hydrogen electrode = NHE
second harmonic generation
static mercury drop electrode
subtractively normalized interfacial Fourier transform infrared spectroscopy
solid polymer electrolyte
surface plasmon resonance
sodium saturated calomel electrode, Hg/Hg2Cl2/NaCl (sat'd)
scanning tunneling microscopy
square wave voltammetry
tetra-/2-butylammonium fluoborate
tetra-ft-butylammonium iodide
tetra-w-butylammoniumperchlorate
tetraethylammonium perchlorate
tetrahydrofuran
ultrahigh vacuum
ultramicroelectrode
underpotential deposition
X-ray photoelectron spectrometry
valence band
INTRODUCTION AND OVERVIEW OF ELECTRODE PROCESSES
1.1 INTRODUCTION
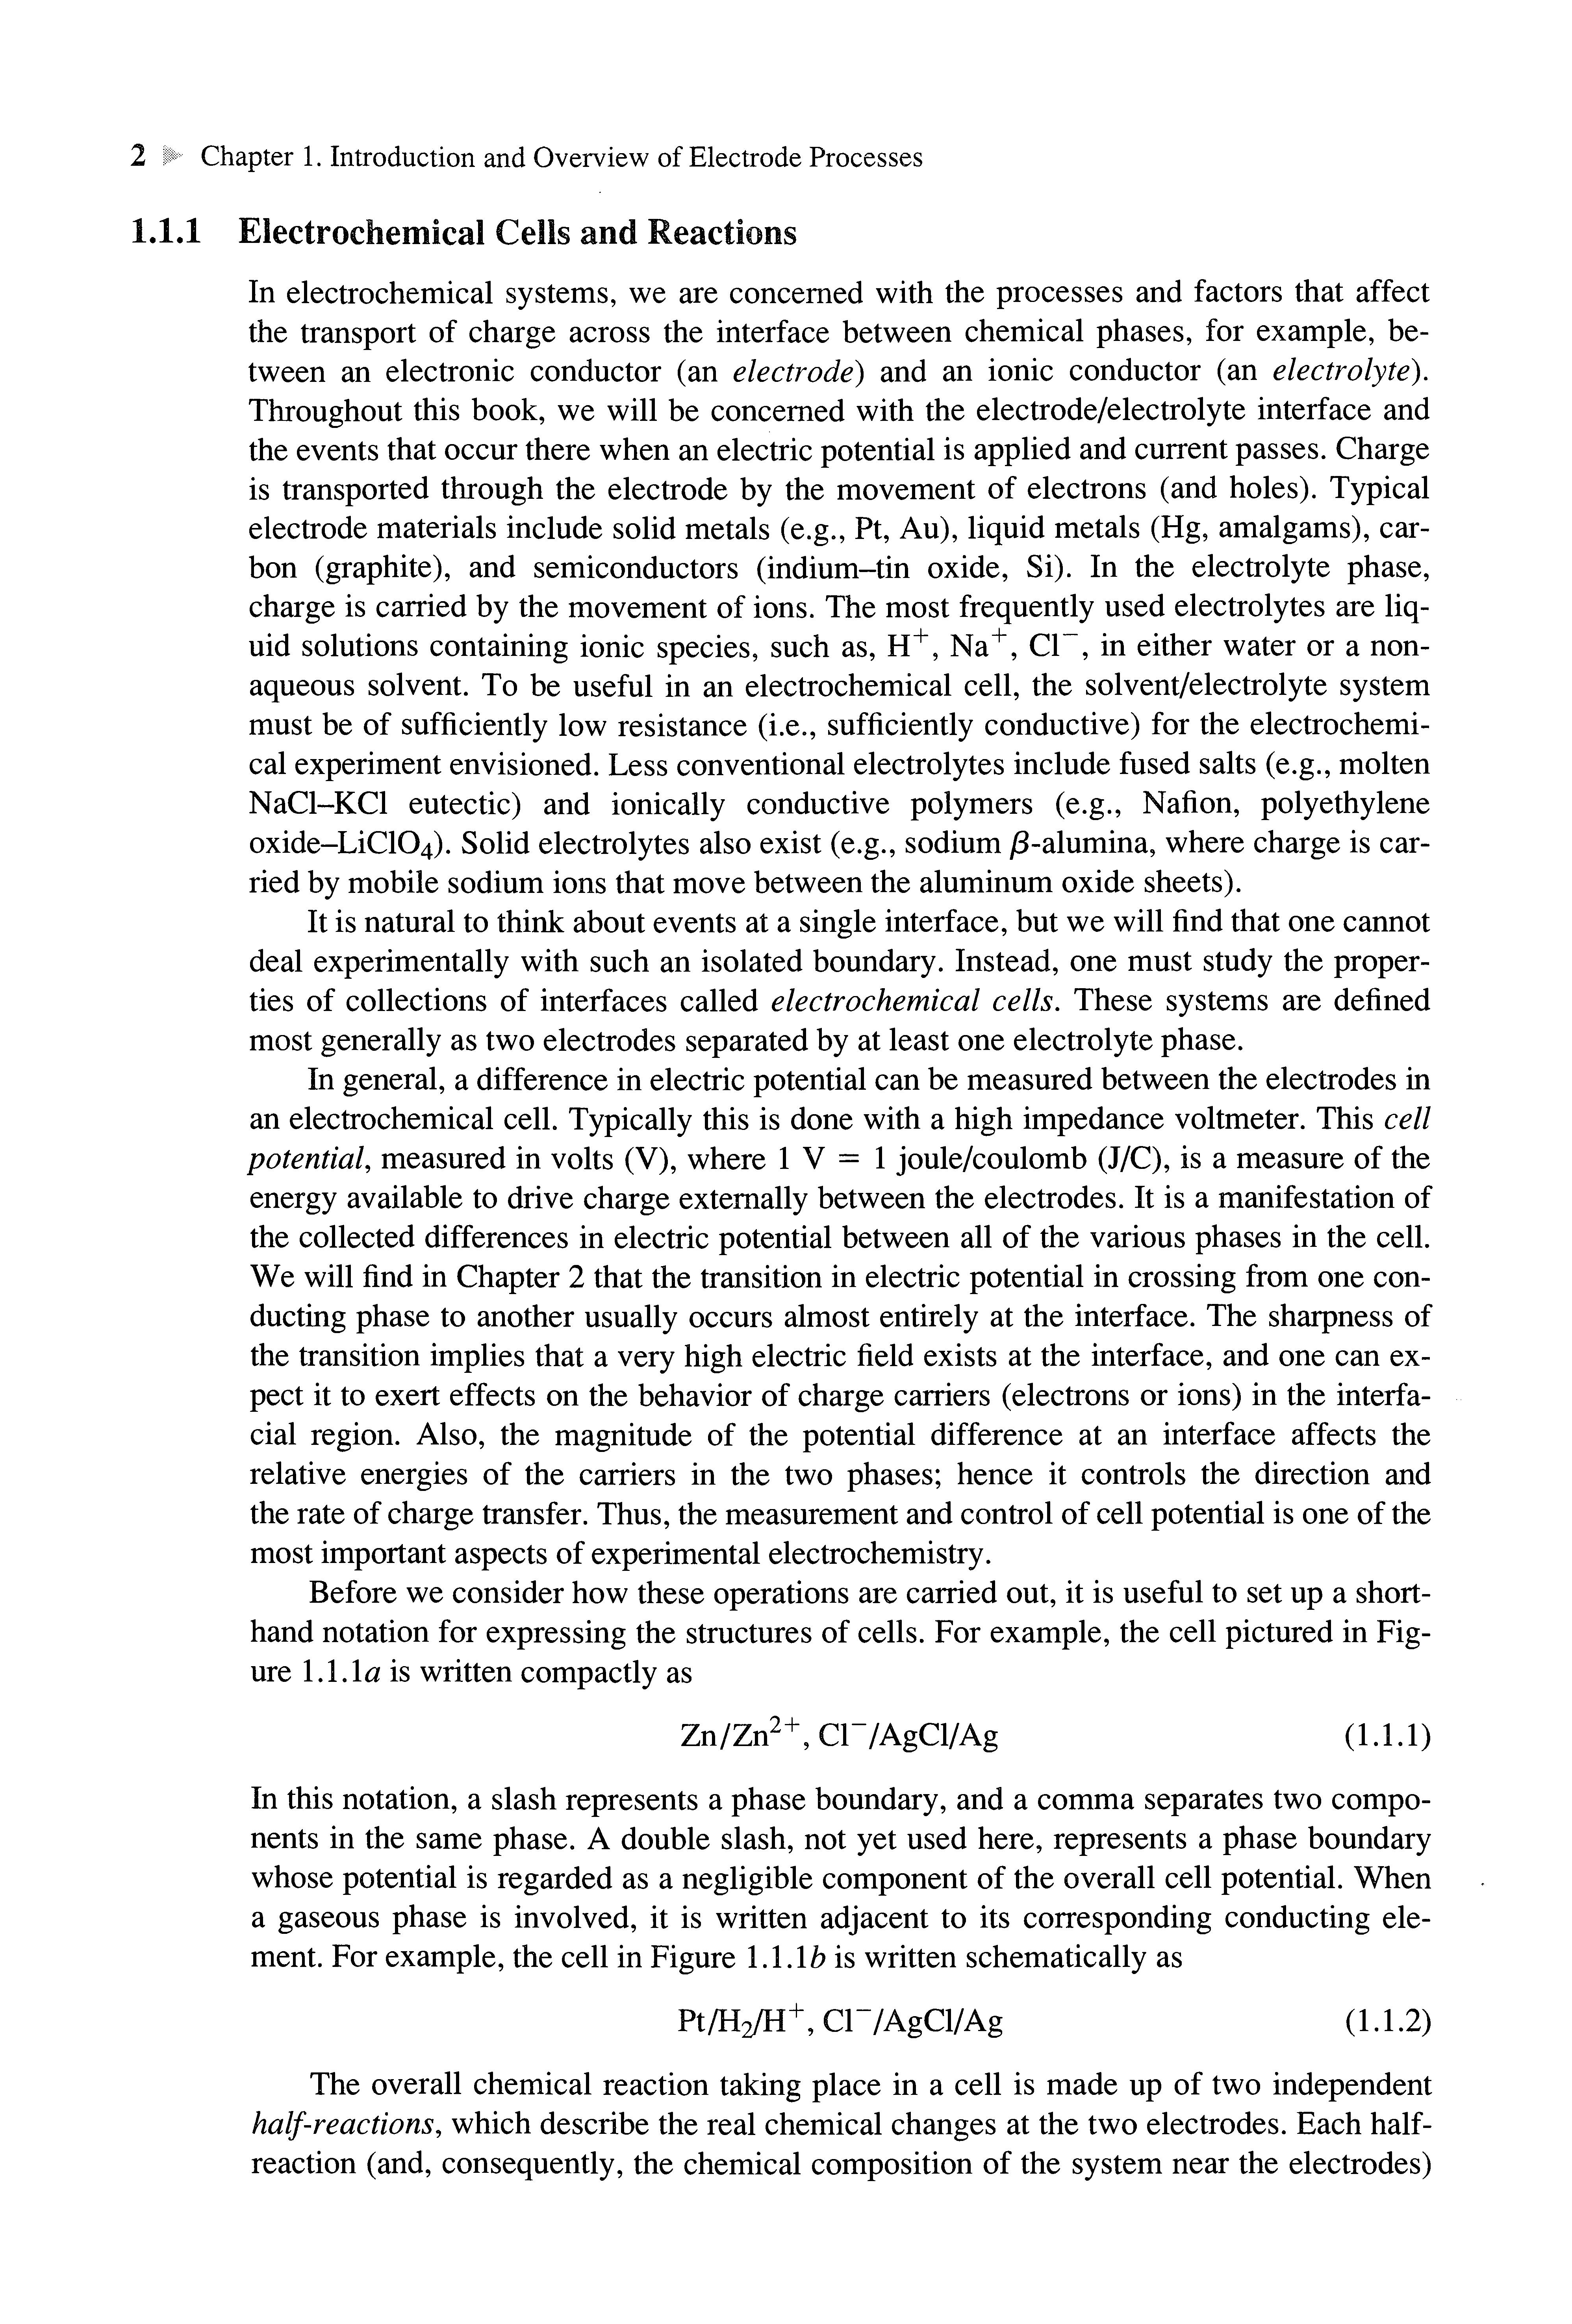
Electrochemistry is the branch of chemistry concerned with the interrelation of electrical and chemical effects A large part of this field deals with the study of chemical changes caused by the passage of an electric current and the production of electrical energy by chemical reactions In fact, the field of electrochemistry encompasses a huge array of different phenomena (e.g., electrophoresis and corrosion), devices (electrochromic displays, electroanalytical sensors, batteries, and fuel cells), and technologies (the electroplating of metals and the large-scale production of aluminum and chlorine) While the basic principles of electrochemistry discussed in this text apply to all of these, the main emphasis here is on the application of electrochemical methods to the study of chemical systems
Scientists make electrochemical measurements on chemical systems for a variety of reasons. They may be interested in obtaining thermodynamic data about a reaction. They may want to generate an unstable intermediate such as a radical ion and study its rate of decay or its spectroscopic properties They may seek to analyze a solution for trace amounts of metal ions or organic species In these examples, electrochemical methods are employed as tools in the study of chemical systems in just the way that spectroscopic methods are frequently applied There are also investigations in which the electrochemical properties of the systems themselves are of primary interest, for example, in the design of a new power source or for the electrosynthesis of some product Many electrochemical methods have been devised Their application requires an understanding of the fundamental principles of electrode reactions and the electrical properties of electrode-solution interfaces
In this chapter, the terms and concepts employed in describing electrode reactions are introduced. In addition, before embarking on a detailed consideration of methods for studying electrode processes and the rigorous solutions of the mathematical equations that govern them, we will consider approximate treatments of several different types of electrode reactions to illustrate their main features. The concepts and treatments described here will be considered in a more complete and rigorous way in later chapters
1.1.1
Electrochemical Cells and Reactions
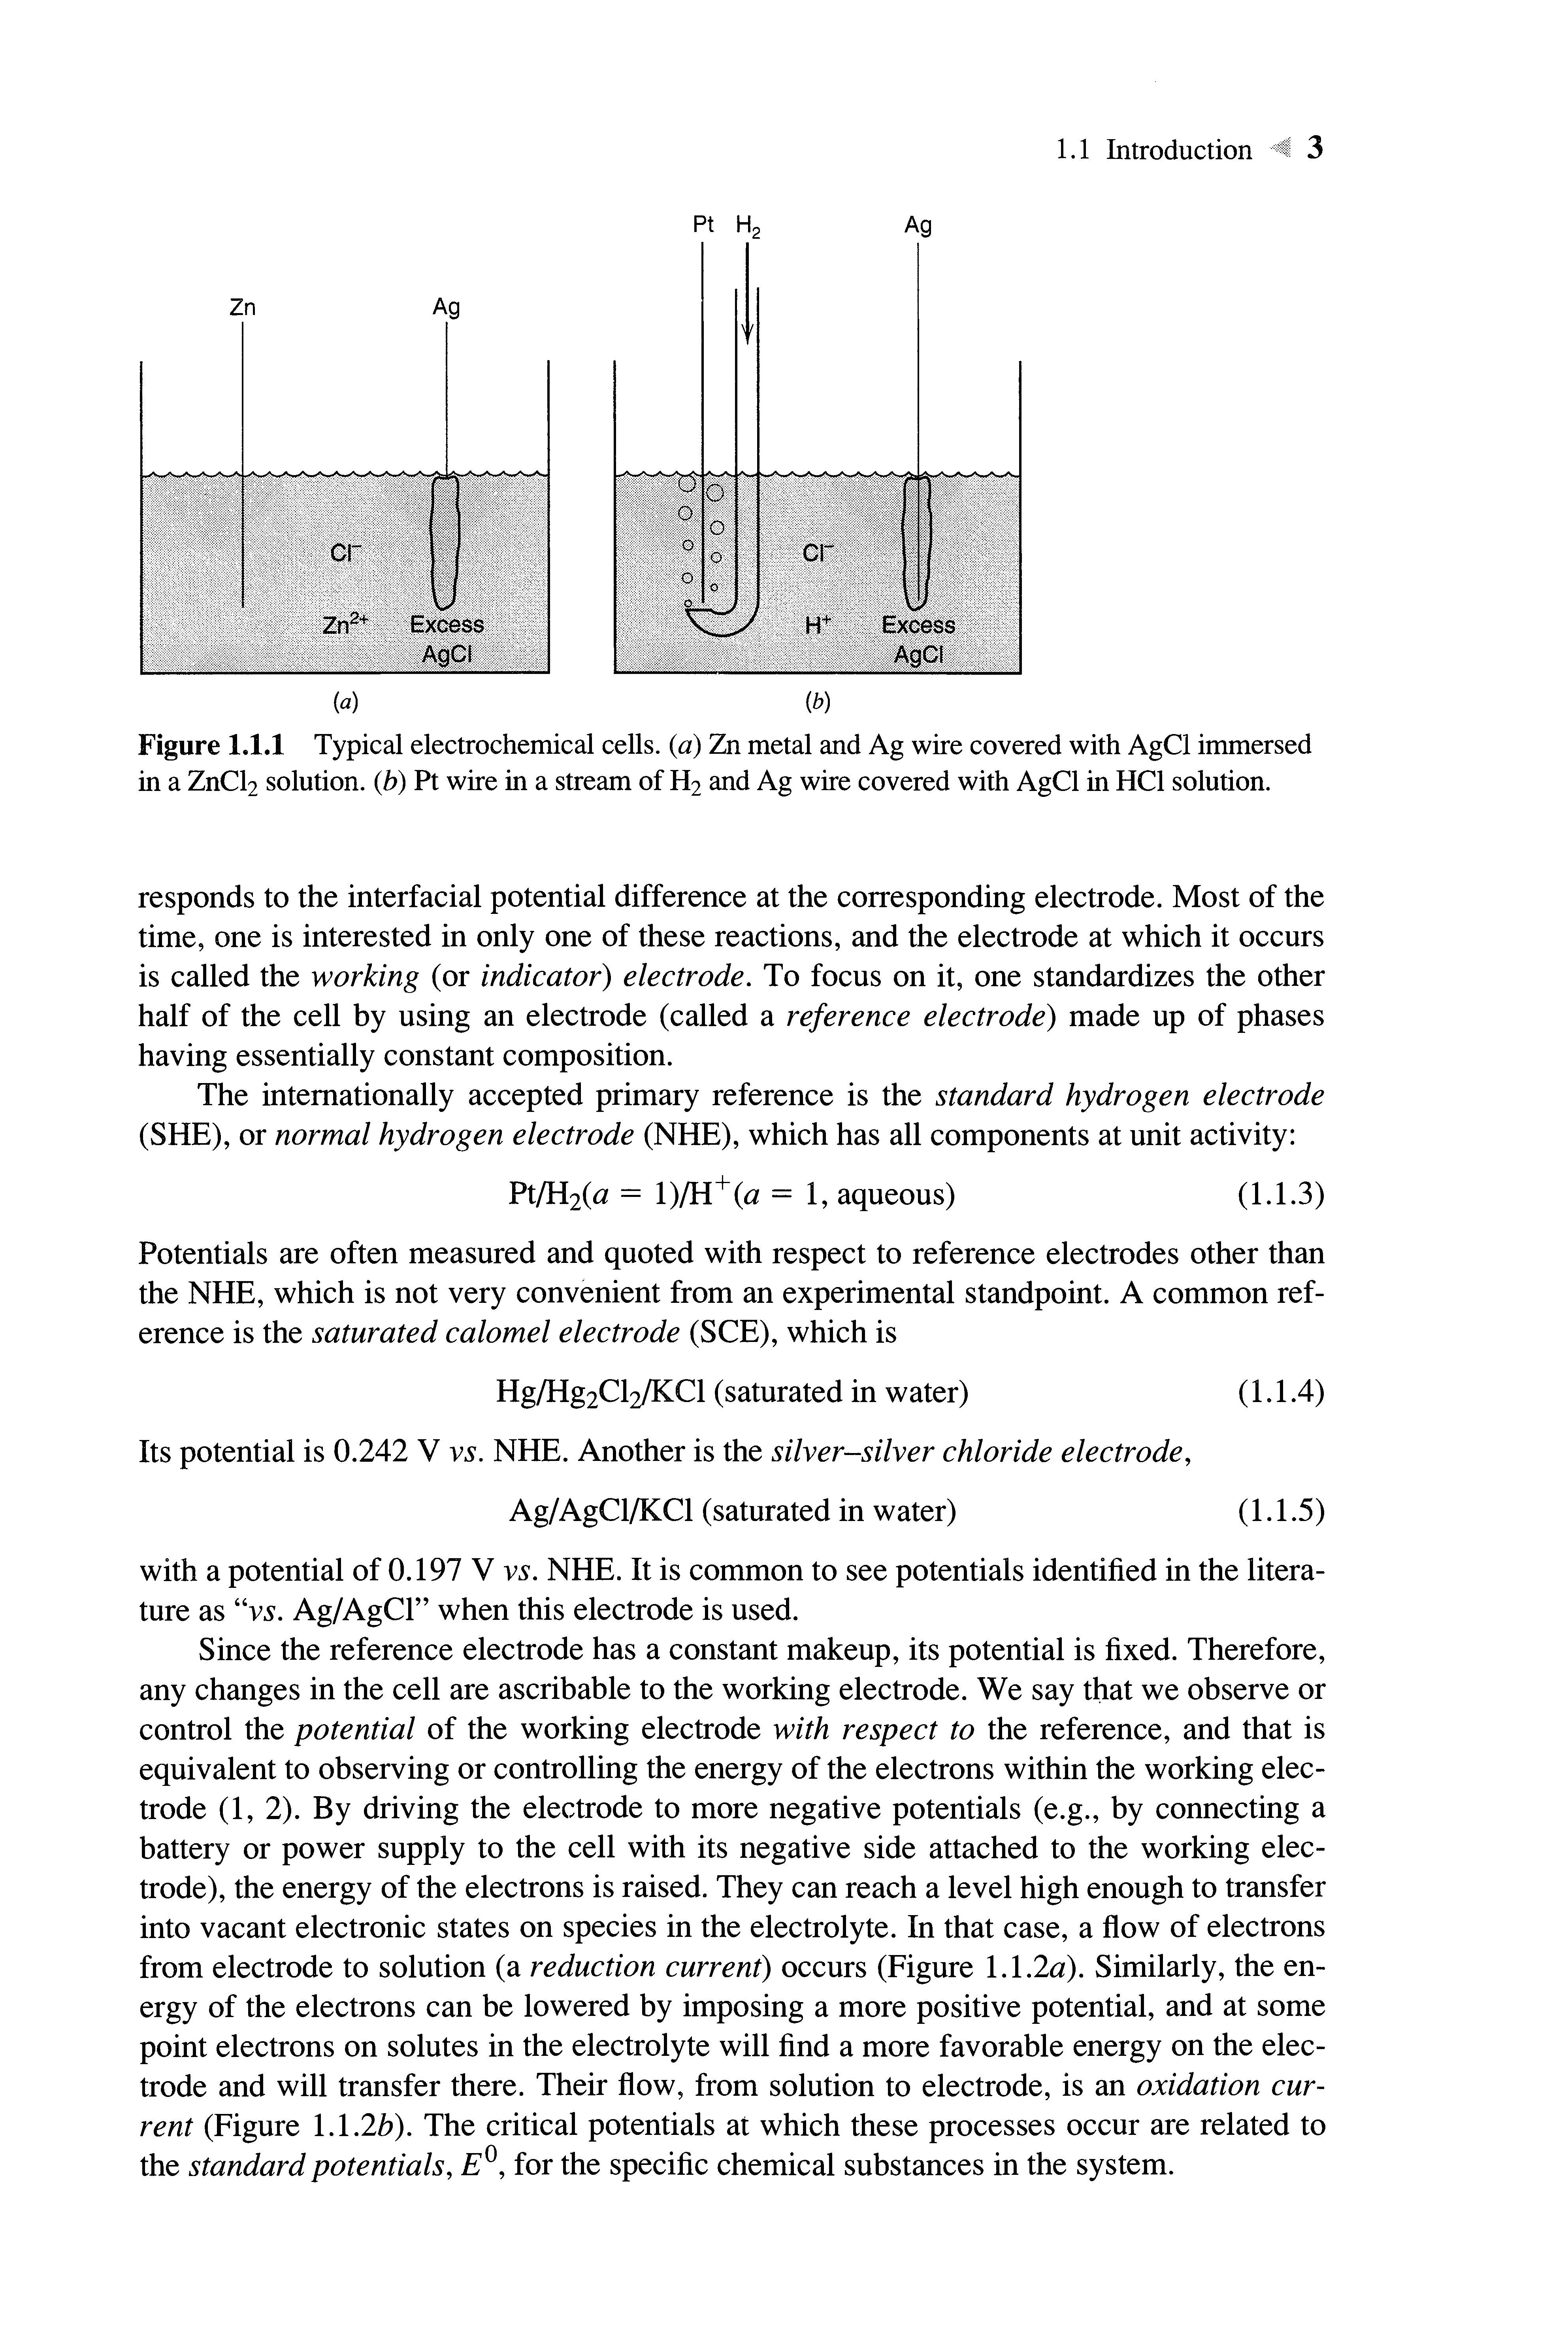
In electrochemical systems, we are concerned with the processes and factors that affect the transport of charge across the interface between chemical phases, for example, between an electronic conductor (an electrode) and an ionic conductor (an electrolyte). Throughout this book, we will be concerned with the electrode/electrolyte interface and the events that occur there when an electric potential is applied and current passes Charge is transported through the electrode by the movement of electrons (and holes) Typical electrode materials include solid metals (e.g., Pt, Au), liquid metals (Hg, amalgams), carbon (graphite), and semiconductors (indium-tin oxide, Si) In the electrolyte phase, charge is carried by the movement of ions The most frequently used electrolytes are liquid solutions containing ionic species, such as, H + , Na+ , Cl~, in either water or a nonaqueous solvent To be useful in an electrochemical cell, the solvent/electrolyte system must be of sufficiently low resistance (i.e., sufficiently conductive) for the electrochemical experiment envisioned. Less conventional electrolytes include fused salts (e.g., molten NaCl-KCl eutectic) and ionically conductive polymers (e.g., Nation, polyethylene oxide-LiClO4). Solid electrolytes also exist (e.g., sodium j8-alumina, where charge is carried by mobile sodium ions that move between the aluminum oxide sheets).
It is natural to think about events at a single interface, but we will find that onecannot deal experimentally with such an isolated boundary. Instead, one must study the properties of collections of interfaces called electrochemical cells. These systems are defined most generally as two electrodes separated by at least one electrolyte phase.
In general, a difference in electric potential can be measured between the electrodes in an electrochemical cell Typically this is done with a high impedance voltmeter This cell potential, measured in volts (V), where 1 V = 1joule/coulomb (J/C), is a measure of the energy available to drive charge externally between the electrodes It is a manifestation of the collected differences in electric potential between all of the various phases in the cell We will find in Chapter 2 that the transition in electric potential in crossing from oneconducting phase to another usually occurs almost entirely at the interface The sharpness of the transition implies that a very high electric field exists at the interface, and one can expect it to exert effects on the behavior of charge carriers (electrons or ions) in the interfacial region Also, the magnitude of the potential difference at an interface affects the relative energies of the carriers in the two phases; hence it controls the direction and the rate of charge transfer Thus,the measurement and control of cell potential is one of the most important aspects of experimental electrochemistry.
Before we consider how these operations are carried out, it is useful to set up a shorthand notationfor expressing the structures of cells For example, the cell pictured in Figure 1.1.1a is written compactly as Zn/Zn2+ , СГ/AgCl/Ag (l.l.l)
In this notation, a slash represents a phase boundary, and a comma separates two components in the same phase A double slash, not yet used here, represents a phase boundary whose potential is regarded as a negligible component of the overall cell potential When a gaseous phase is involved, it is written adjacent to its corresponding conducting element For example, the cell in Figure 1.1.1ft is written schematically as
Pt/H2/H+ , СГ/AgCl/Ag (1.1.2)
The overall chemical reaction taking place in a cell is made up of two independent half-reactions,which describe the real chemical changes at the two electrodes Each halfreaction (and, consequently, the chemical composition of the system near the electrodes)
Figure l.l.l Typical electrochemical cells, (a)Znmetal and Ag wire covered with AgCI immersed in a ZnCl2solution, (b) Ptwire in a stream of H2andAg wire covered with AgCI in HC1solution
responds to the interfacial potential difference at the corresponding electrode Most of the time, one is interested in only one of these reactions, and the electrode at which it occurs is called the working (or indicator) electrode. To focus on it, one standardizes the other half of the cell by using an electrode (called a reference electrode) made up of phases having essentially constant composition
The internationally accepted primary reference is the standard hydrogen electrode (SHE), or normal hydrogen electrode (NHE), which has all components at unit activity: Pt/H2(a - l)/H+(a = 1, aqueous)
Potentials are often measured and quoted with respect to reference electrodes other than the NHE,which is not very convenient from an experimental standpoint A common reference is the saturated calomel electrode (SCE),which is Hg/Hg2Cl2/KCl (saturated in water) (1.1.4)
Its potential is 0.242 V vs. NHE.Another is the silver-silver chloride electrode, Ag/AgCl/KCl (saturated in water) (1.1.5)
with a potential of 0.197 V vs. NHE.It is commonto see potentials identified in the literature as "vs. Ag/AgQ" when this electrode is used.
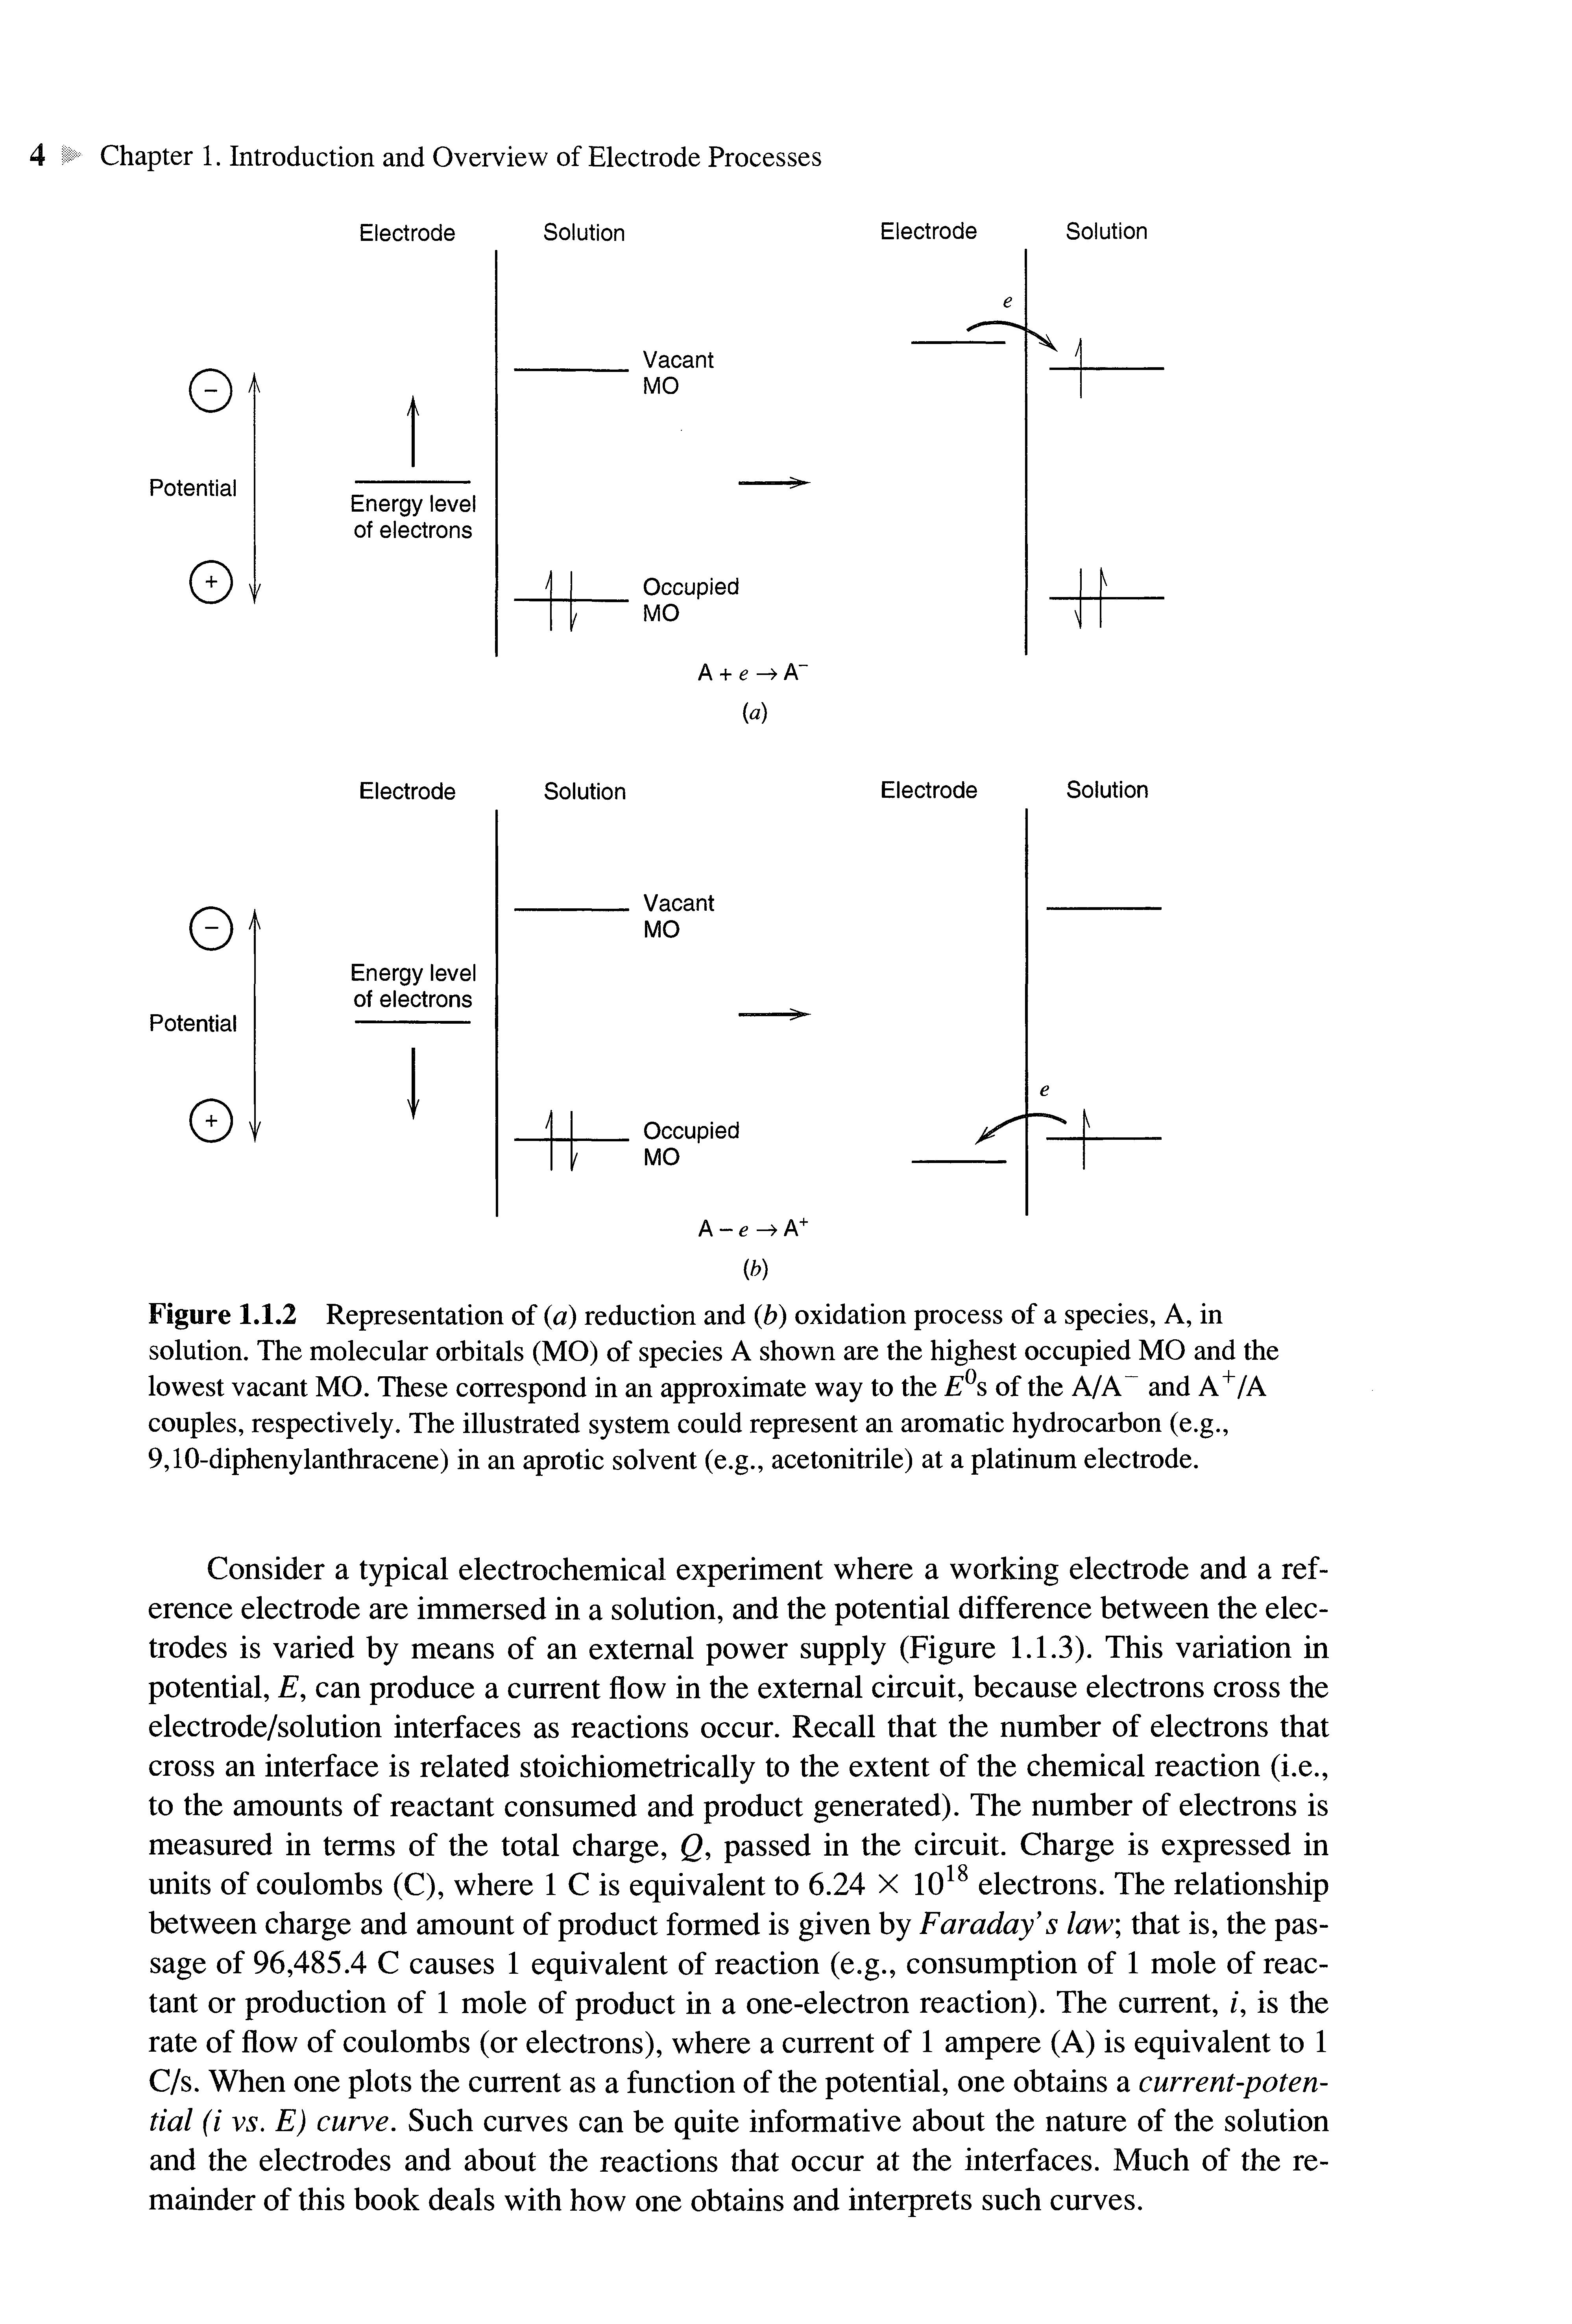
Since the reference electrode has a constant makeup, its potential is fixed. Therefore, any changes in the cell are ascribable to the working electrode We say that we observe or control the potential of the working electrode with respect to the reference, and that is equivalent to observing or controlling the energy of the electrons within the working electrode (1, 2). By driving the electrode to more negative potentials (e.g., by connecting a battery or power supply to the cell with its negative side attached to the working electrode), the energy of the electrons is raised. They can reach a level high enough to transfer into vacant electronic states on species in the electrolyte. In that case, a flow of electrons from electrode to solution (a reduction current) occurs (Figure 1.1.2a). Similarly, the energy of the electrons can be lowered by imposing a more positive potential, and at some point electrons on solutes in the electrolyte will find a more favorable energy on the electrode and will transfer there. Their flow, from solution to electrode, is an oxidation current (Figure 1.1.2b). The critical potentials at which these processes occur are related to the standard potentials, E°, for the specific chemical substances in the system.
Electrode Solution
Electrode Solution 0
Potential 0j
Vacant MO
Energy level ofelectrons
Occupied MO
Vacant MO
Energy level ofelectrons
Potential
Occupied MO
Figure 1.1.2 Representation of (a)reduction and (b)oxidation process of a species, A,in solution. Themolecular orbitals (MO)of species Ashown arethehighest occupied MOand the lowest vacant MO These correspond inanapproximate waytotheE°s oftheA/A~and A+/A couples, respectively Theillustrated system could represent anaromatic hydrocarbon (e.g., 9,10-diphenylanthracene) inanaprotic solvent (e.g., acetonitrile) ataplatinum electrode.
Consider a typical electrochemical experiment where a working electrode and a reference electrode are immersed in a solution, and the potential difference between the electrodes is varied by means of an external power supply (Figure 1.1.3) This variation in potential, £, can produce a current flow in the external circuit, because electrons cross the electrode/solution interfaces as reactions occur Recall that the number of electrons that cross an interface is related stoichiometrically to the extent of the chemical reaction (i.e., to the amounts of reactant consumed and product generated). The number of electrons is measured in terms of the total charge, Q, passed in the circuit. Charge is expressed in units of coulombs (C), where 1 С is equivalent to 6.24 X 10¹⁸ electrons.The relationship between charge andamount of product formed is given by Faraday's law; that is, thepassage of 96,485.4 С causes 1 equivalent of reaction (e.g., consumptionof 1 mole of reactant or production of 1 mole of product in a one-electronreaction). The current, /,is the rate of flow of coulombs (or electrons), where a current of 1 ampere(A) is equivalentto1 C/s.When oneplots thecurrent as a functionof thepotential, oneobtainsa current-potential (i vs. E) curve. Such curves can be quite informative about the nature of thesolution and the electrodes and about the reactions that occur at the interfaces Much of theremainder of this book deals with how oneobtainsandinterpretssuchcurves
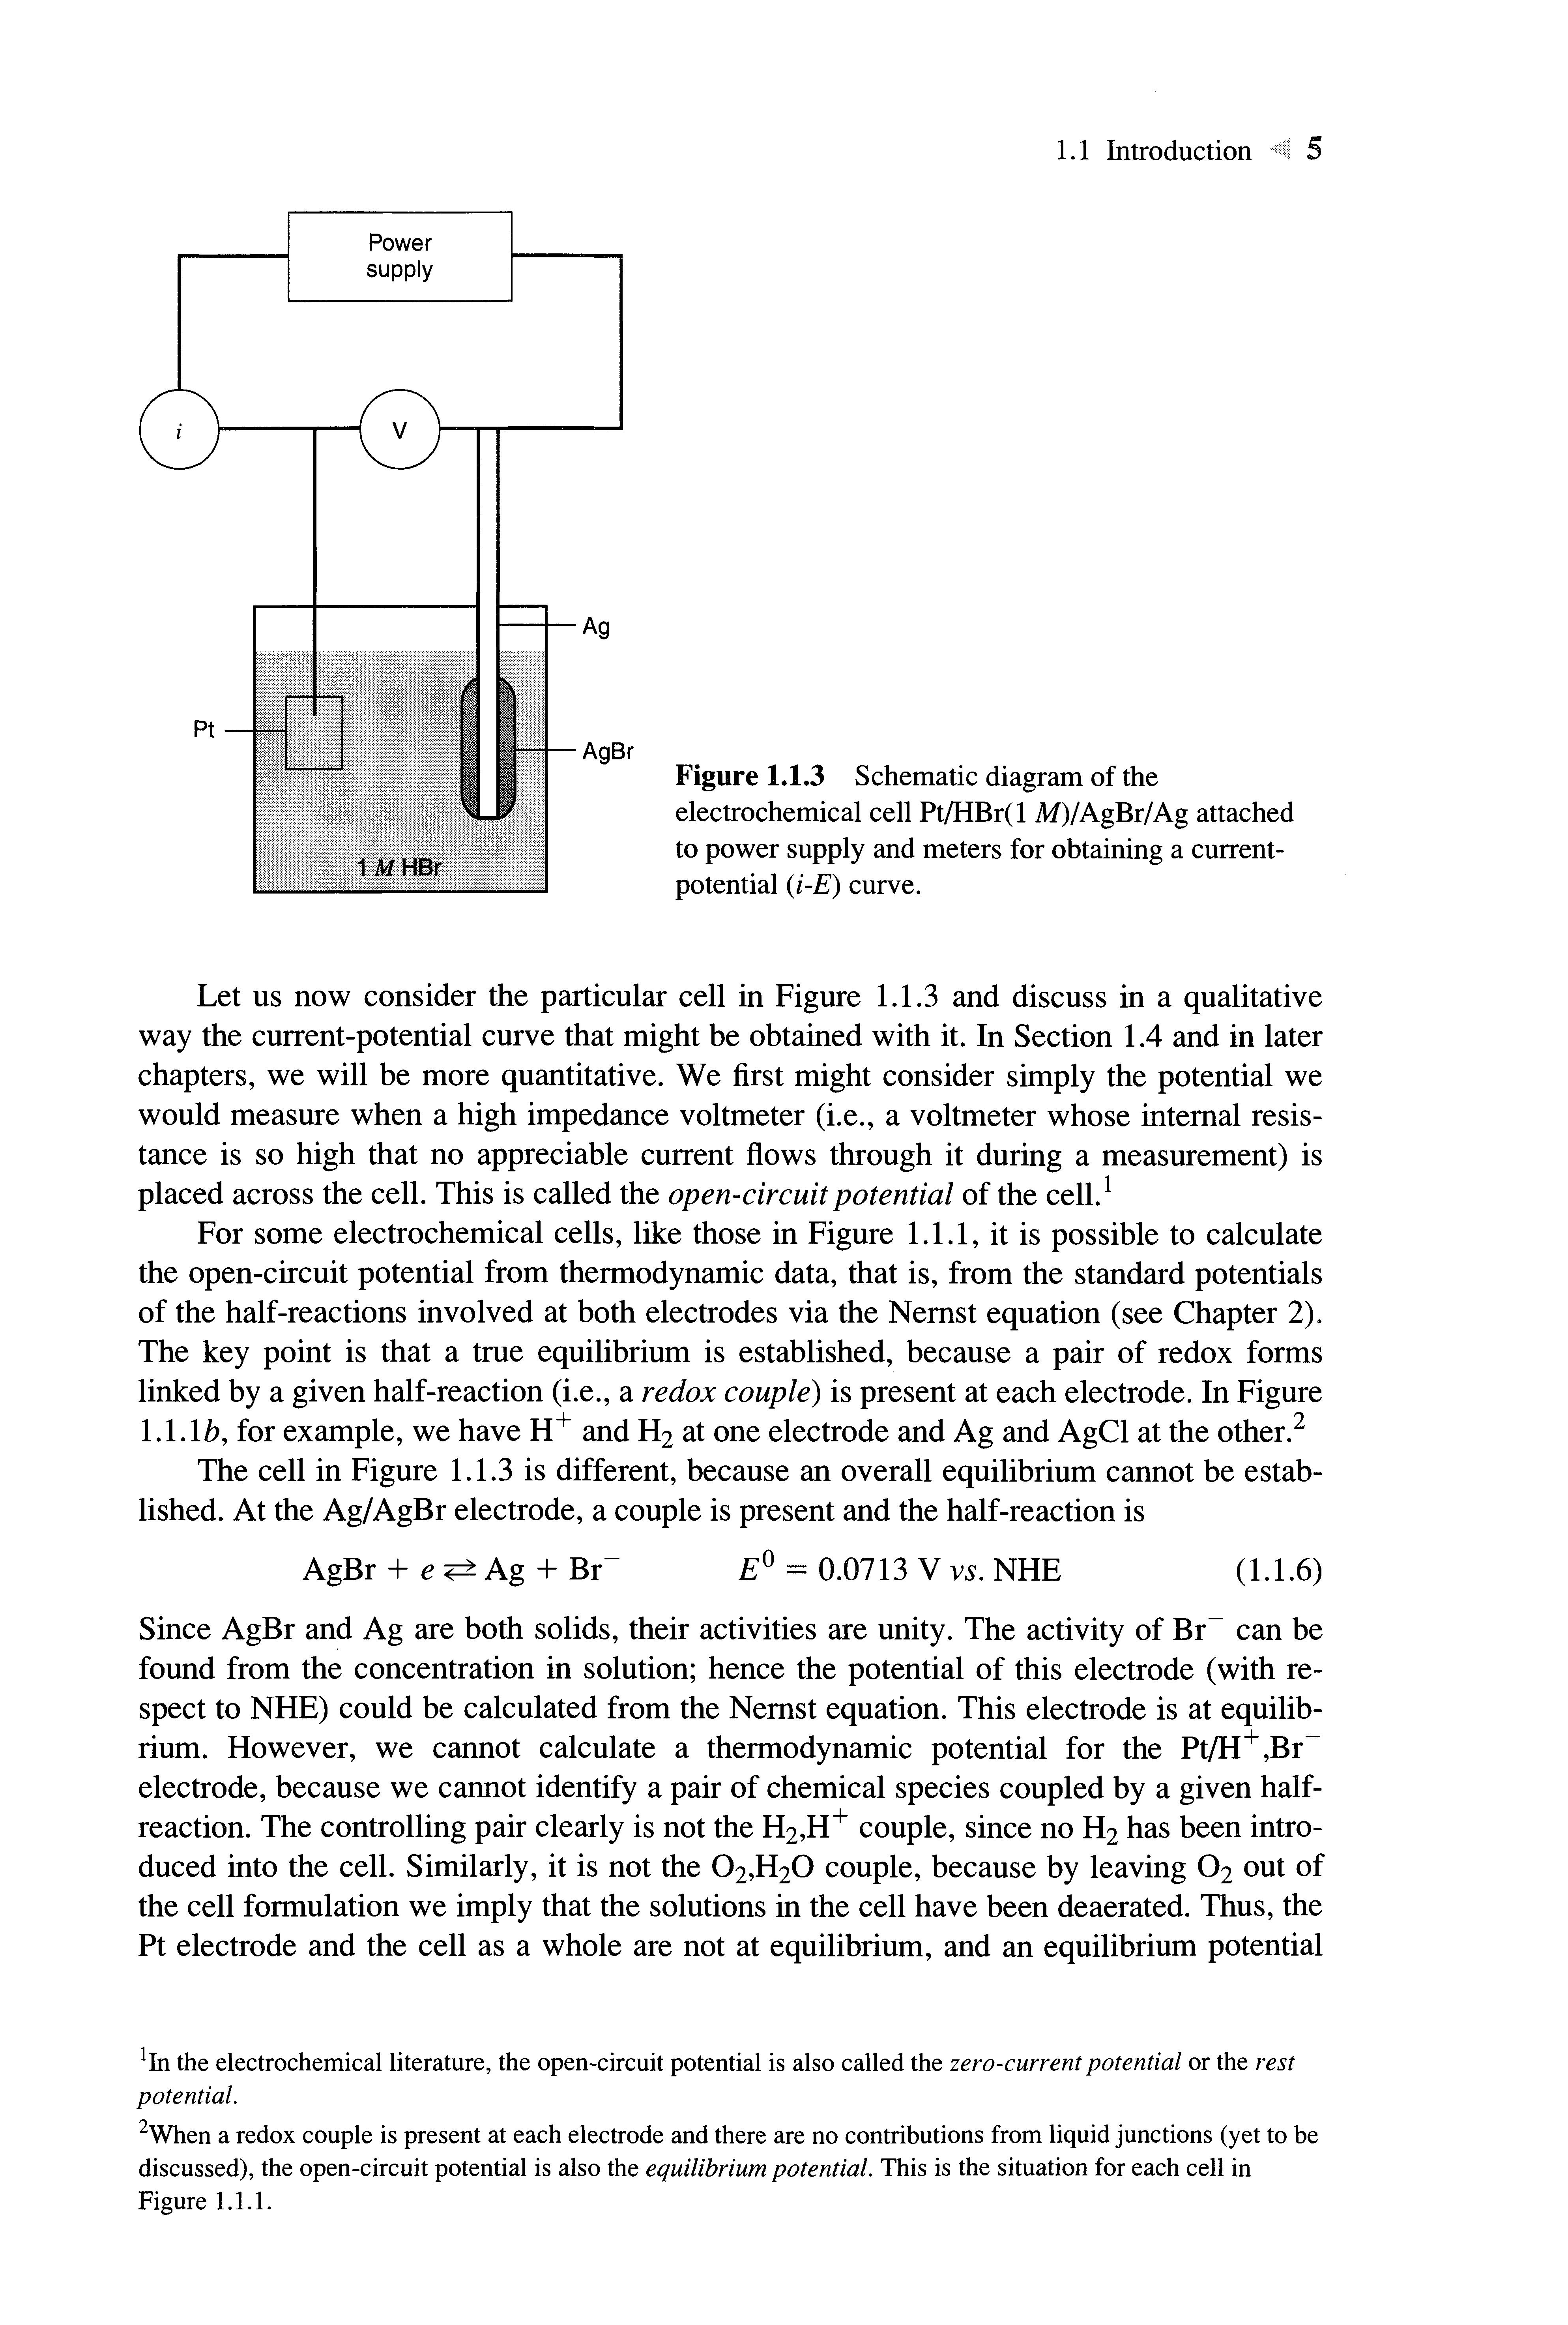
Figure 1.1.3 Schematicdiagram ofthe electrochemical cell Pt/HBr(lM)/AgBr/Agattached topower supply andmeters for obtaining acurrentpotential (i-E) curve.
Let us now consider the particular cell in Figure 1.1.3 and discuss in a qualitative way the current-potential curve that might be obtained with it In Section 1.4 and in later chapters, we will be more quantitative We first might consider simply the potential we would measure when a high impedance voltmeter (i.e., a voltmeter whose internal resistance is so high that no appreciable current flows through it during a measurement) is placed across the cell This is called the open-circuit potential of the cell.1
For some electrochemical cells, like those in Figure 1.1.1, it is possible to calculate the open-circuit potential from thermodynamic data, that is, from the standard potentials of the half-reactions involved at both electrodes via the Nernst equation (see Chapter 2) The key point is that a true equilibrium is established, because a pair of redox forms linked by a given half-reaction (i.e., a redox couple) is present at each electrode In Figure 1.1.1/?,for example, we have H + and H2 at one electrode and Ag and AgCl at the other.2
The cell in Figure 1.1.3 is different, because an overall equilibrium cannot be established At the Ag/AgBr electrode, a couple is present and the half-reaction is AgBr + e ±±Ag + Br = 0.0713 Vvs NHE (1.1.6)
Since AgBr and Ag are both solids, their activities are unity. The activity of Br can be found from the concentration in solution; hence the potential of this electrode (with respect to NHE)could be calculated from the Nernst equation. This electrode is at equilibrium. However, we cannot calculate a thermodynamic potential for the Pt/H+,Br~ electrode, because we cannot identify a pair of chemical species coupled by a given halfreaction. The controlling pair clearly is not the H2,H+ couple, since no H2 has been introduced into the cell. Similarly, it is not the O2,H2O couple, because by leaving O2 out of the cell formulation we imply that the solutions in the cell have been deaerated. Thus,the Pt electrode and the cell as a whole are not at equilibrium, and an equilibrium potential
*In the electrochemical literature, the open-circuit potential is also called the zero-currentpotential or the rest potential.
2When a redox couple is present at each electrode and there are no contributions from liquid junctions (yet to be discussed), the open-circuit potential is also the equilibriumpotential. This is the situation for each cell in Figure 1.1.1
does not exist Even though the open-circuit potential of the cell is not available from thermodynamic data, we can place it within a potential range, as shown below
Let us now consider what occurs when a power supply (e.g., a battery) and a microammeter are connected across the cell, and the potential of the Pt electrode is made more negative with respect to the Ag/AgBr reference electrode. The first electrode reaction that occurs at the Pt is the reduction of protons, 2H+ + 2e-*H 2
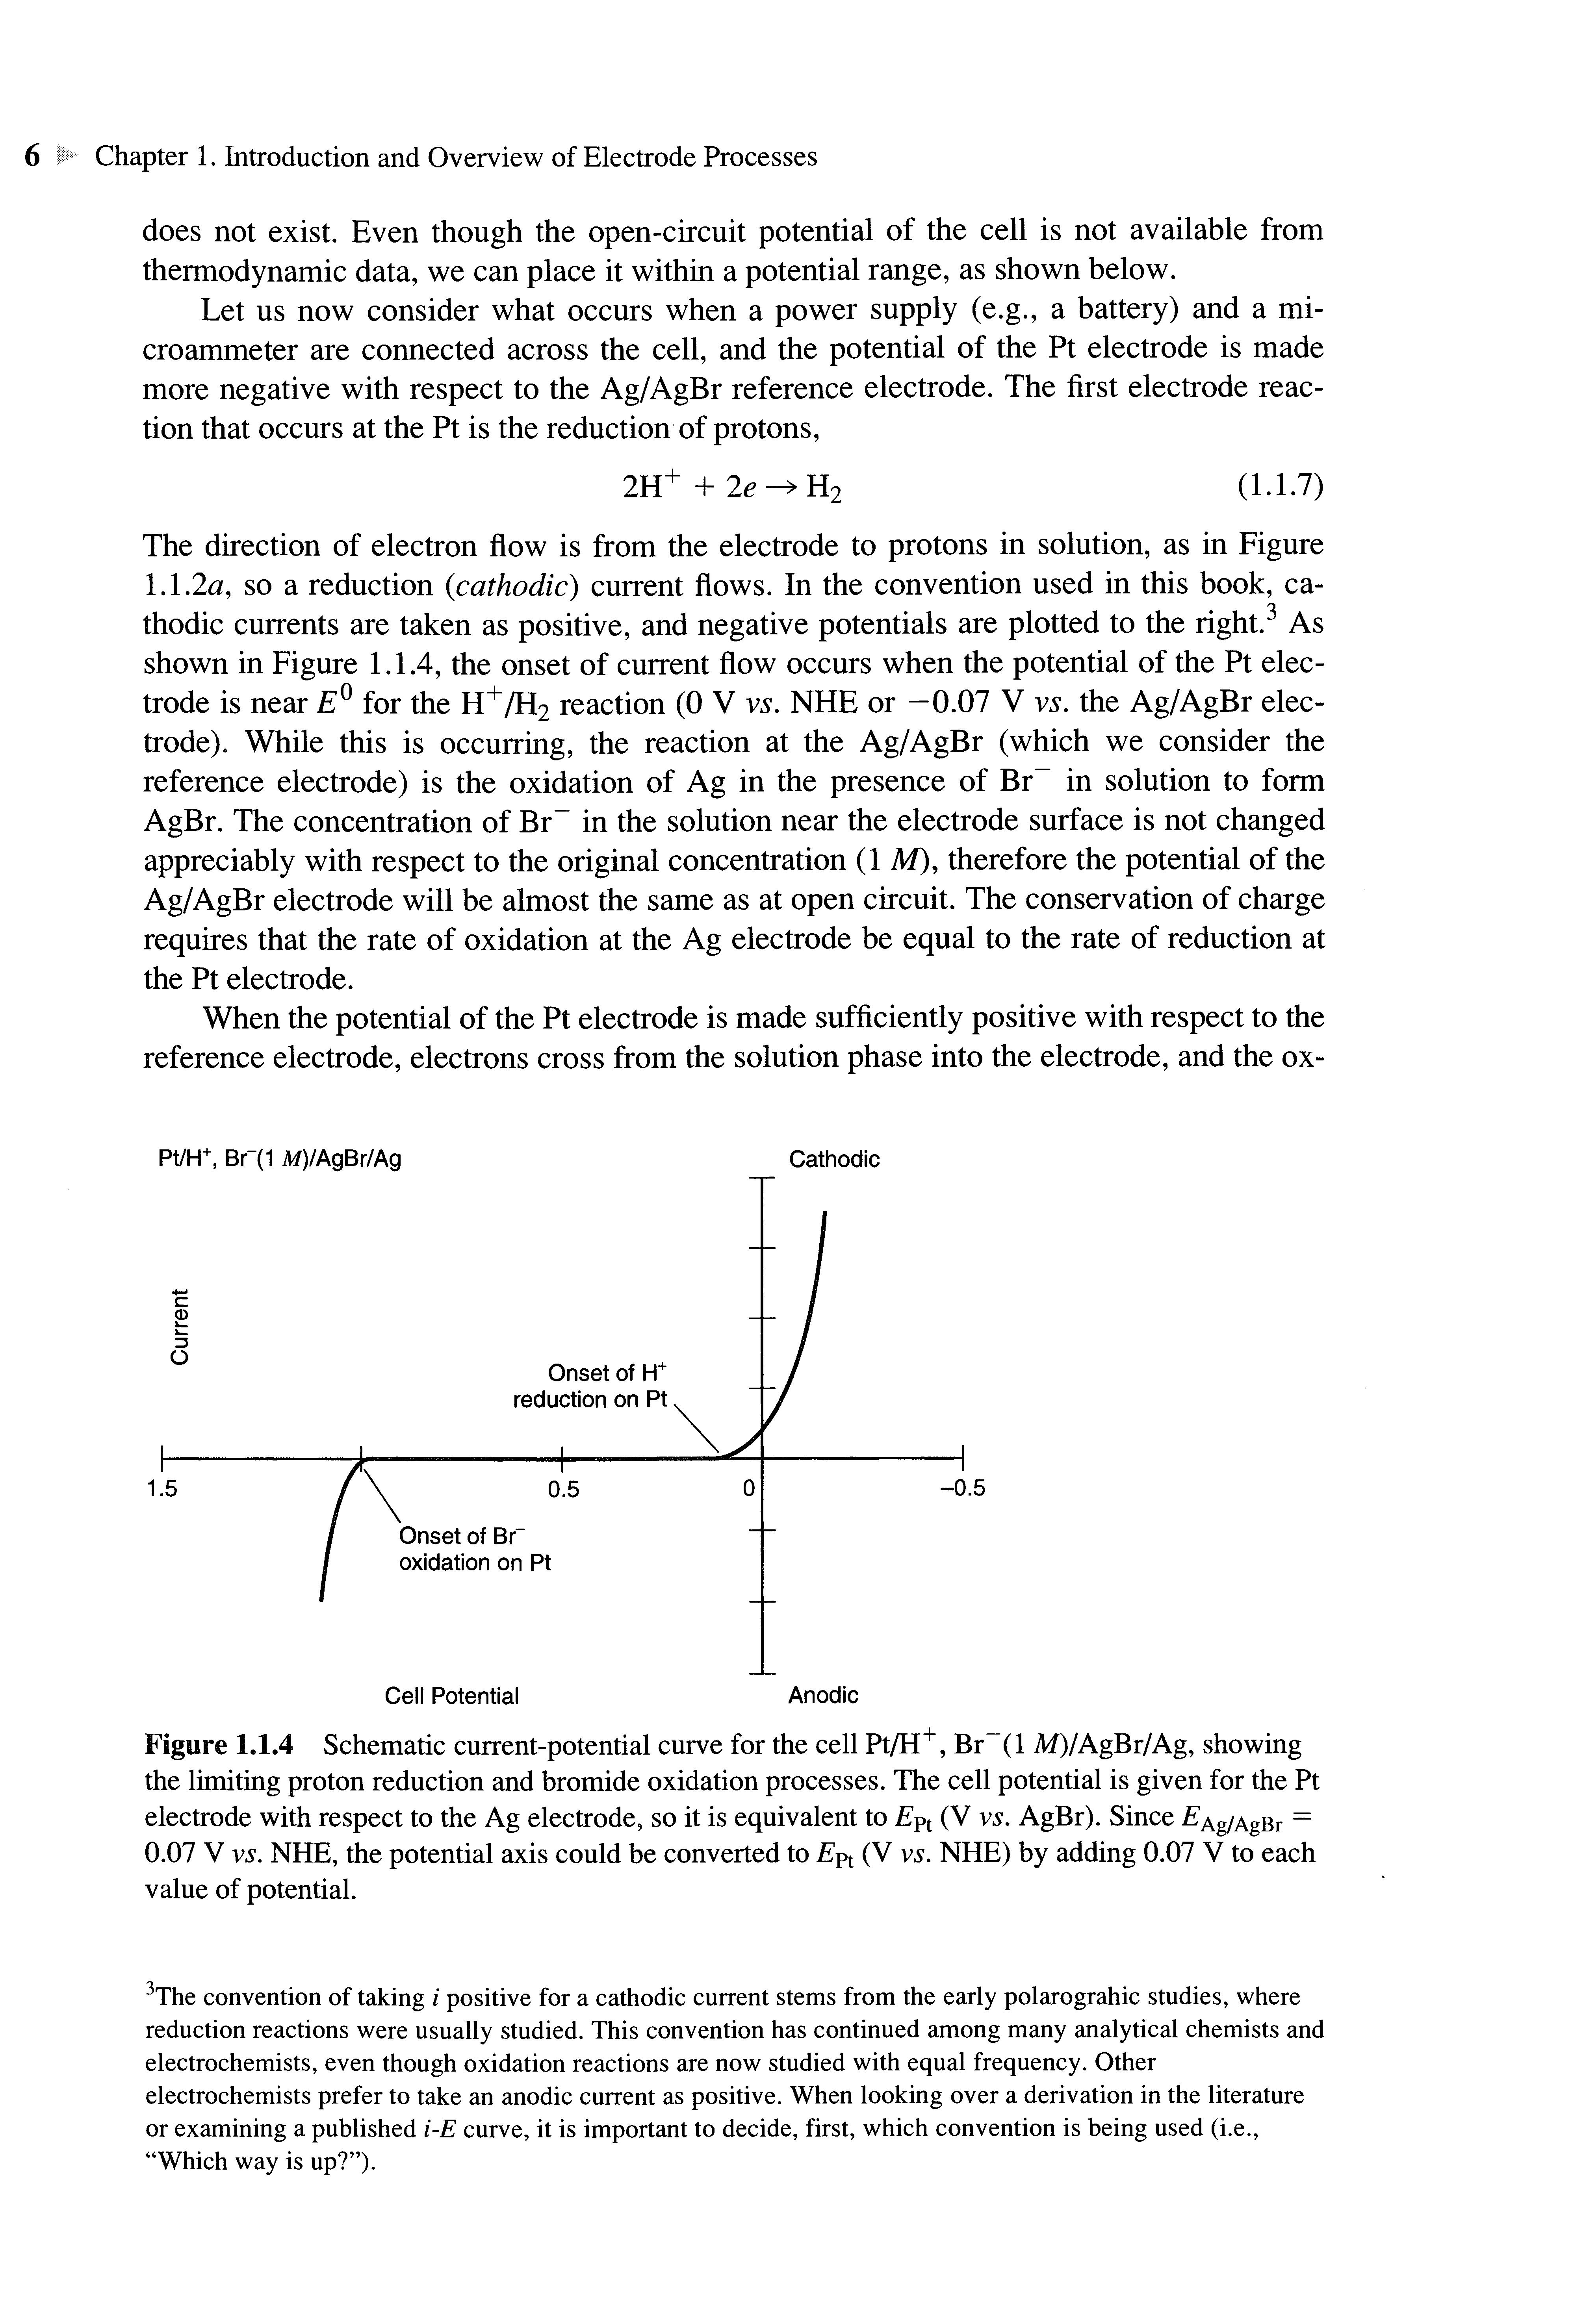
The direction of electron flow is from the electrode to protons in solution, as in Figure 1.12a, so a reduction (cathodic) current flows. In the convention used in this book, cathodic currents are taken as positive, and negative potentials are plotted to the right.3 As shown in Figure 1.1.4, the onset of current flow occurs when the potential of the Pt electrode is near E° for the H+/H2 reaction (0 V vs. NHEor -0.07 V vs. the Ag/AgBr electrode) While this is occurring, the reaction at the Ag/AgBr (which we consider the reference electrode) is the oxidation of Ag in the presence of Br in solution to form AgBr The concentration of Br in the solution near the electrode surface is not changed appreciably with respect to the original concentration (1 M),therefore the potential of the Ag/AgBr electrode will be almost the same as at open circuit The conservation of charge requires that the rate of oxidation at the Ag electrode be equal to the rate of reduction at the Ptelectrode
When the potential of the Pt electrode is made sufficiently positive with respect to the reference electrode, electrons cross from the solution phase into the electrode, and the ox-
Pt/H+ ,
M)/AgBr/Ag
Onset ofH+ reduction onPt
Onset of Br"
Cell Potential
Anodic
Figure 1.1.4 Schematic current-potential curve for the cell Pt/H+ , Br~(l M)/AgBr/Ag, showing the limiting proton reduction and bromide oxidation processes The cell potential is given for the Pt electrode with respect to the Ag electrode, so it is equivalent to £Pt (V vs. AgBr) Since ^Ag/AgBr = 0.07 V vs. NHE,thepotentialaxiscouldbe convertedto EPt (V vs. NHE)by adding0.07 Vtoeach value of potential
3The convention of taking/ positivefor a cathodiccurrentstemsfrom the earlypolarograhic studies,where reduction reactionswereusuallystudied.This convention has continuedamongmanyanalyticalchemists and electrochemists, eventhoughoxidationreactionsare now studiedwithequalfrequency Other electrochemists prefer to takean anodiccurrentas positive Whenlookingovera derivationin the literature or examining a publishedi-E curve, it is importantto decide, first, whichconventionis beingused (i.e., "Which wayis up?").
idation of Br~ to Br2 (and Br^~) occurs An oxidation current, or anodic current, flows at potentials near the E° of the half-reaction,
Br2 + 2e^2Br~
which is +1.09 V vs. NHE or +1.02 V vs. Ag/AgBr. While this reaction occurs (rightto-left) at the Pt electrode, AgBr in the reference electrode is reduced to Ag and Br~ is liberated into solution Again, because the composition of the Ag/AgBr/Br~ interface (i.e., the activities of AgBr, Ag, and Br~) is almost unchanged with the passage of modest currents, the potential of the reference electrode is essentially constant Indeed, the essential characteristic of a reference electrode is that its potential remains practically constant with the passage of small currents When a potential is applied between Pt and Ag/AgBr, nearly all of the potential change occurs at the Pt/solution interface
The background limits are the potentials where the cathodic and anodic currents start to flow at a working electrode when it is immersed in a solution containing only an electrolyte added to decrease the solution resistance (a supporting electrolyte). Moving the potential to more extreme values than the background limits (i.e., more negative than the limit for H2 evolution or more positive than that for Br2 generation in the example above) simply causes the current to increase sharply with no additional electrode reactions, because the reactants are present at high concentrations This discussion implies that one can often estimate the background limits of a given electrode-solution interface by considering the thermodynamics of the system (i.e., the standard potentials of the appropriate halfreactions) This is frequently, but not always, true, as we shall see in the next example
From Figure 1.1.4, one can see that the open-circuit potential is not well defined in the system under discussion. One can say only that the open-circuit potential lies somewhere between the background limits. The value found experimentally will depend upon trace impurities in the solution (e.g., oxygen) and the previous history of the Pt electrode.
Let us now consider the same cell, but with the Pt replaced with a mercury electrode: Hg/H+,Br-(l M)/AgBr/Ag (1.1.9)
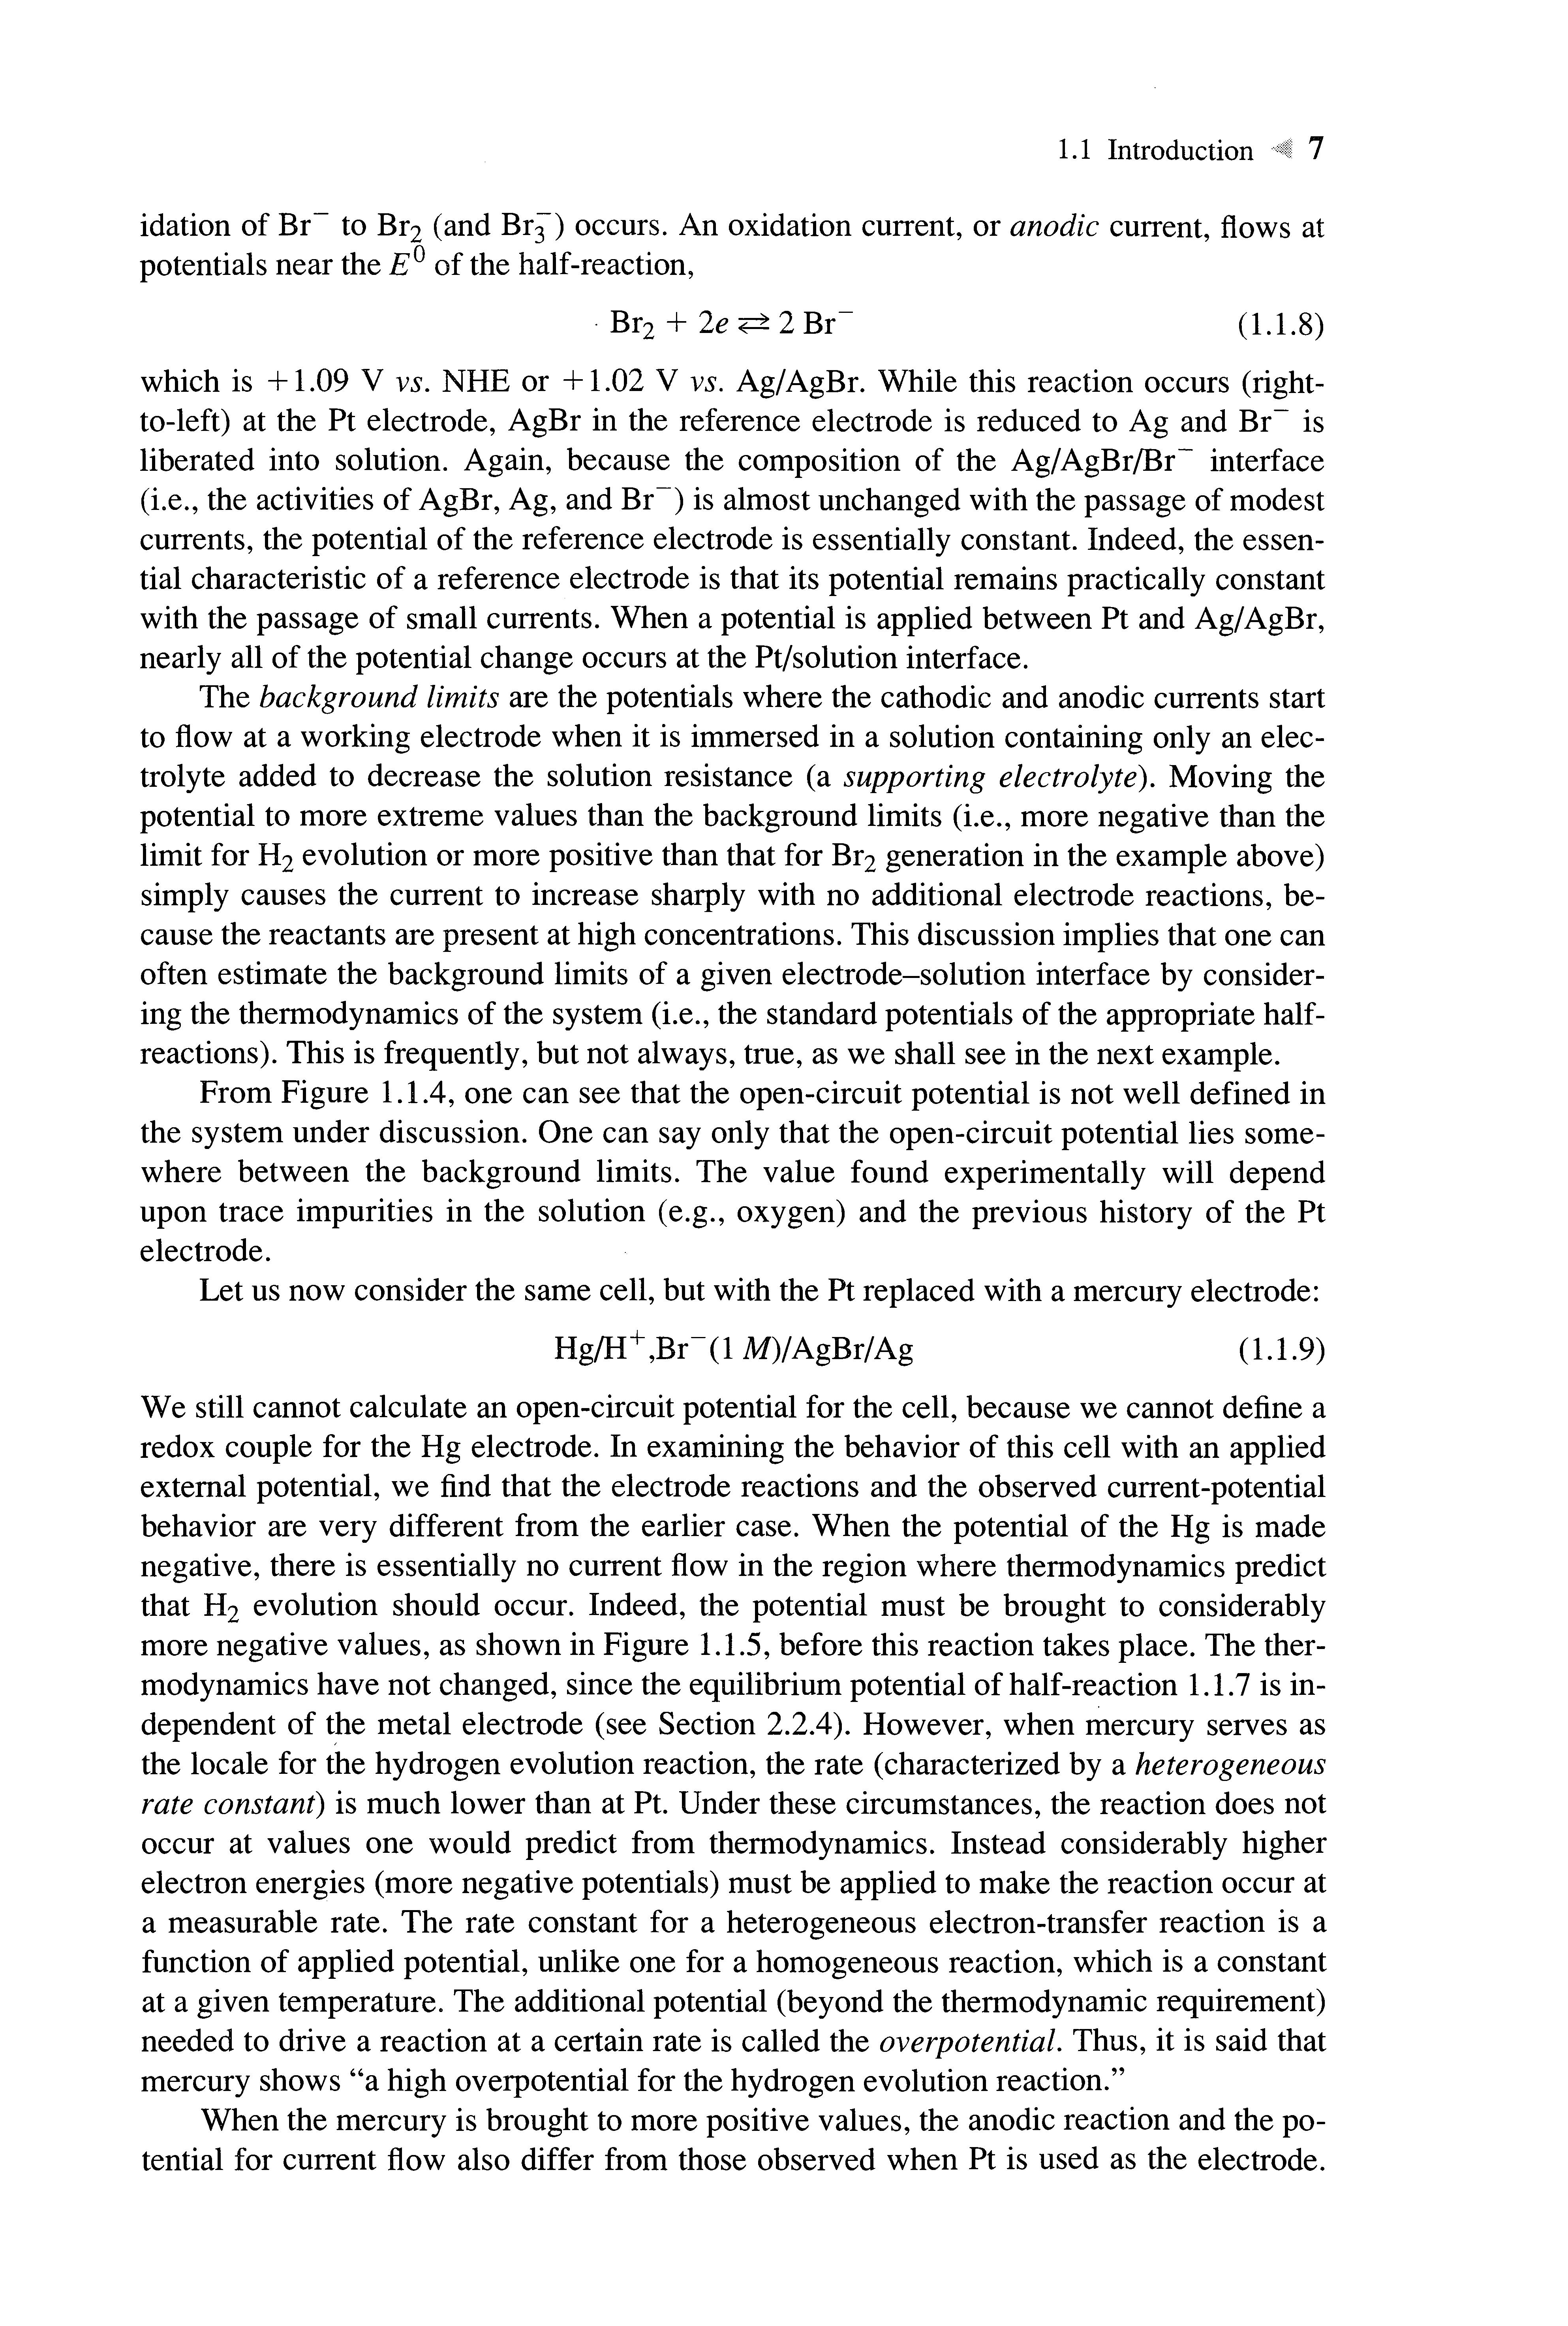
We still cannot calculate an open-circuit potential for the cell, because we cannot define a redox couple for the Hg electrode. In examining the behavior of this cell with an applied external potential, we find that the electrode reactions and the observed current-potential behavior are very different from the earlier case. When the potential of the Hg is made negative, there is essentially no current flow in the region where thermodynamics predict that H2 evolution should occur. Indeed, the potential must be brought to considerably more negative values, as shown in Figure 1.1.5, before this reaction takes place. The thermodynamics have not changed, since the equilibrium potential of half-reaction 1.1.7 is independent of the metal electrode (see Section 2.2.4). However, when mercury serves as the locale for the hydrogen evolution reaction, the rate (characterized by a heterogeneous rate constant) is much lower than at Pt. Under these circumstances, the reaction does not occur at values one would predict from thermodynamics. Instead considerably higher electron energies (more negative potentials) must be applied to make the reaction occur at a measurable rate. The rate constant for a heterogeneous electron-transfer reaction is a function of applied potential, unlike one for a homogeneous reaction, which is a constant at a given temperature. The additional potential (beyond the thermodynamic requirement) needed to drive a reaction at a certain rate is called the overpotential. Thus, it is said that mercury shows "a high overpotential for the hydrogen evolution reaction."
When the mercury is brought to more positive values, the anodic reaction and the potential for current flow also differ from those observed when Pt is used as the electrode.
Hg/I-Г, ВГ(1M)/AgBr/Ag
Onset of H+ reduction ,
Onset ofHg oxidation
Potential (V vs.NHE)
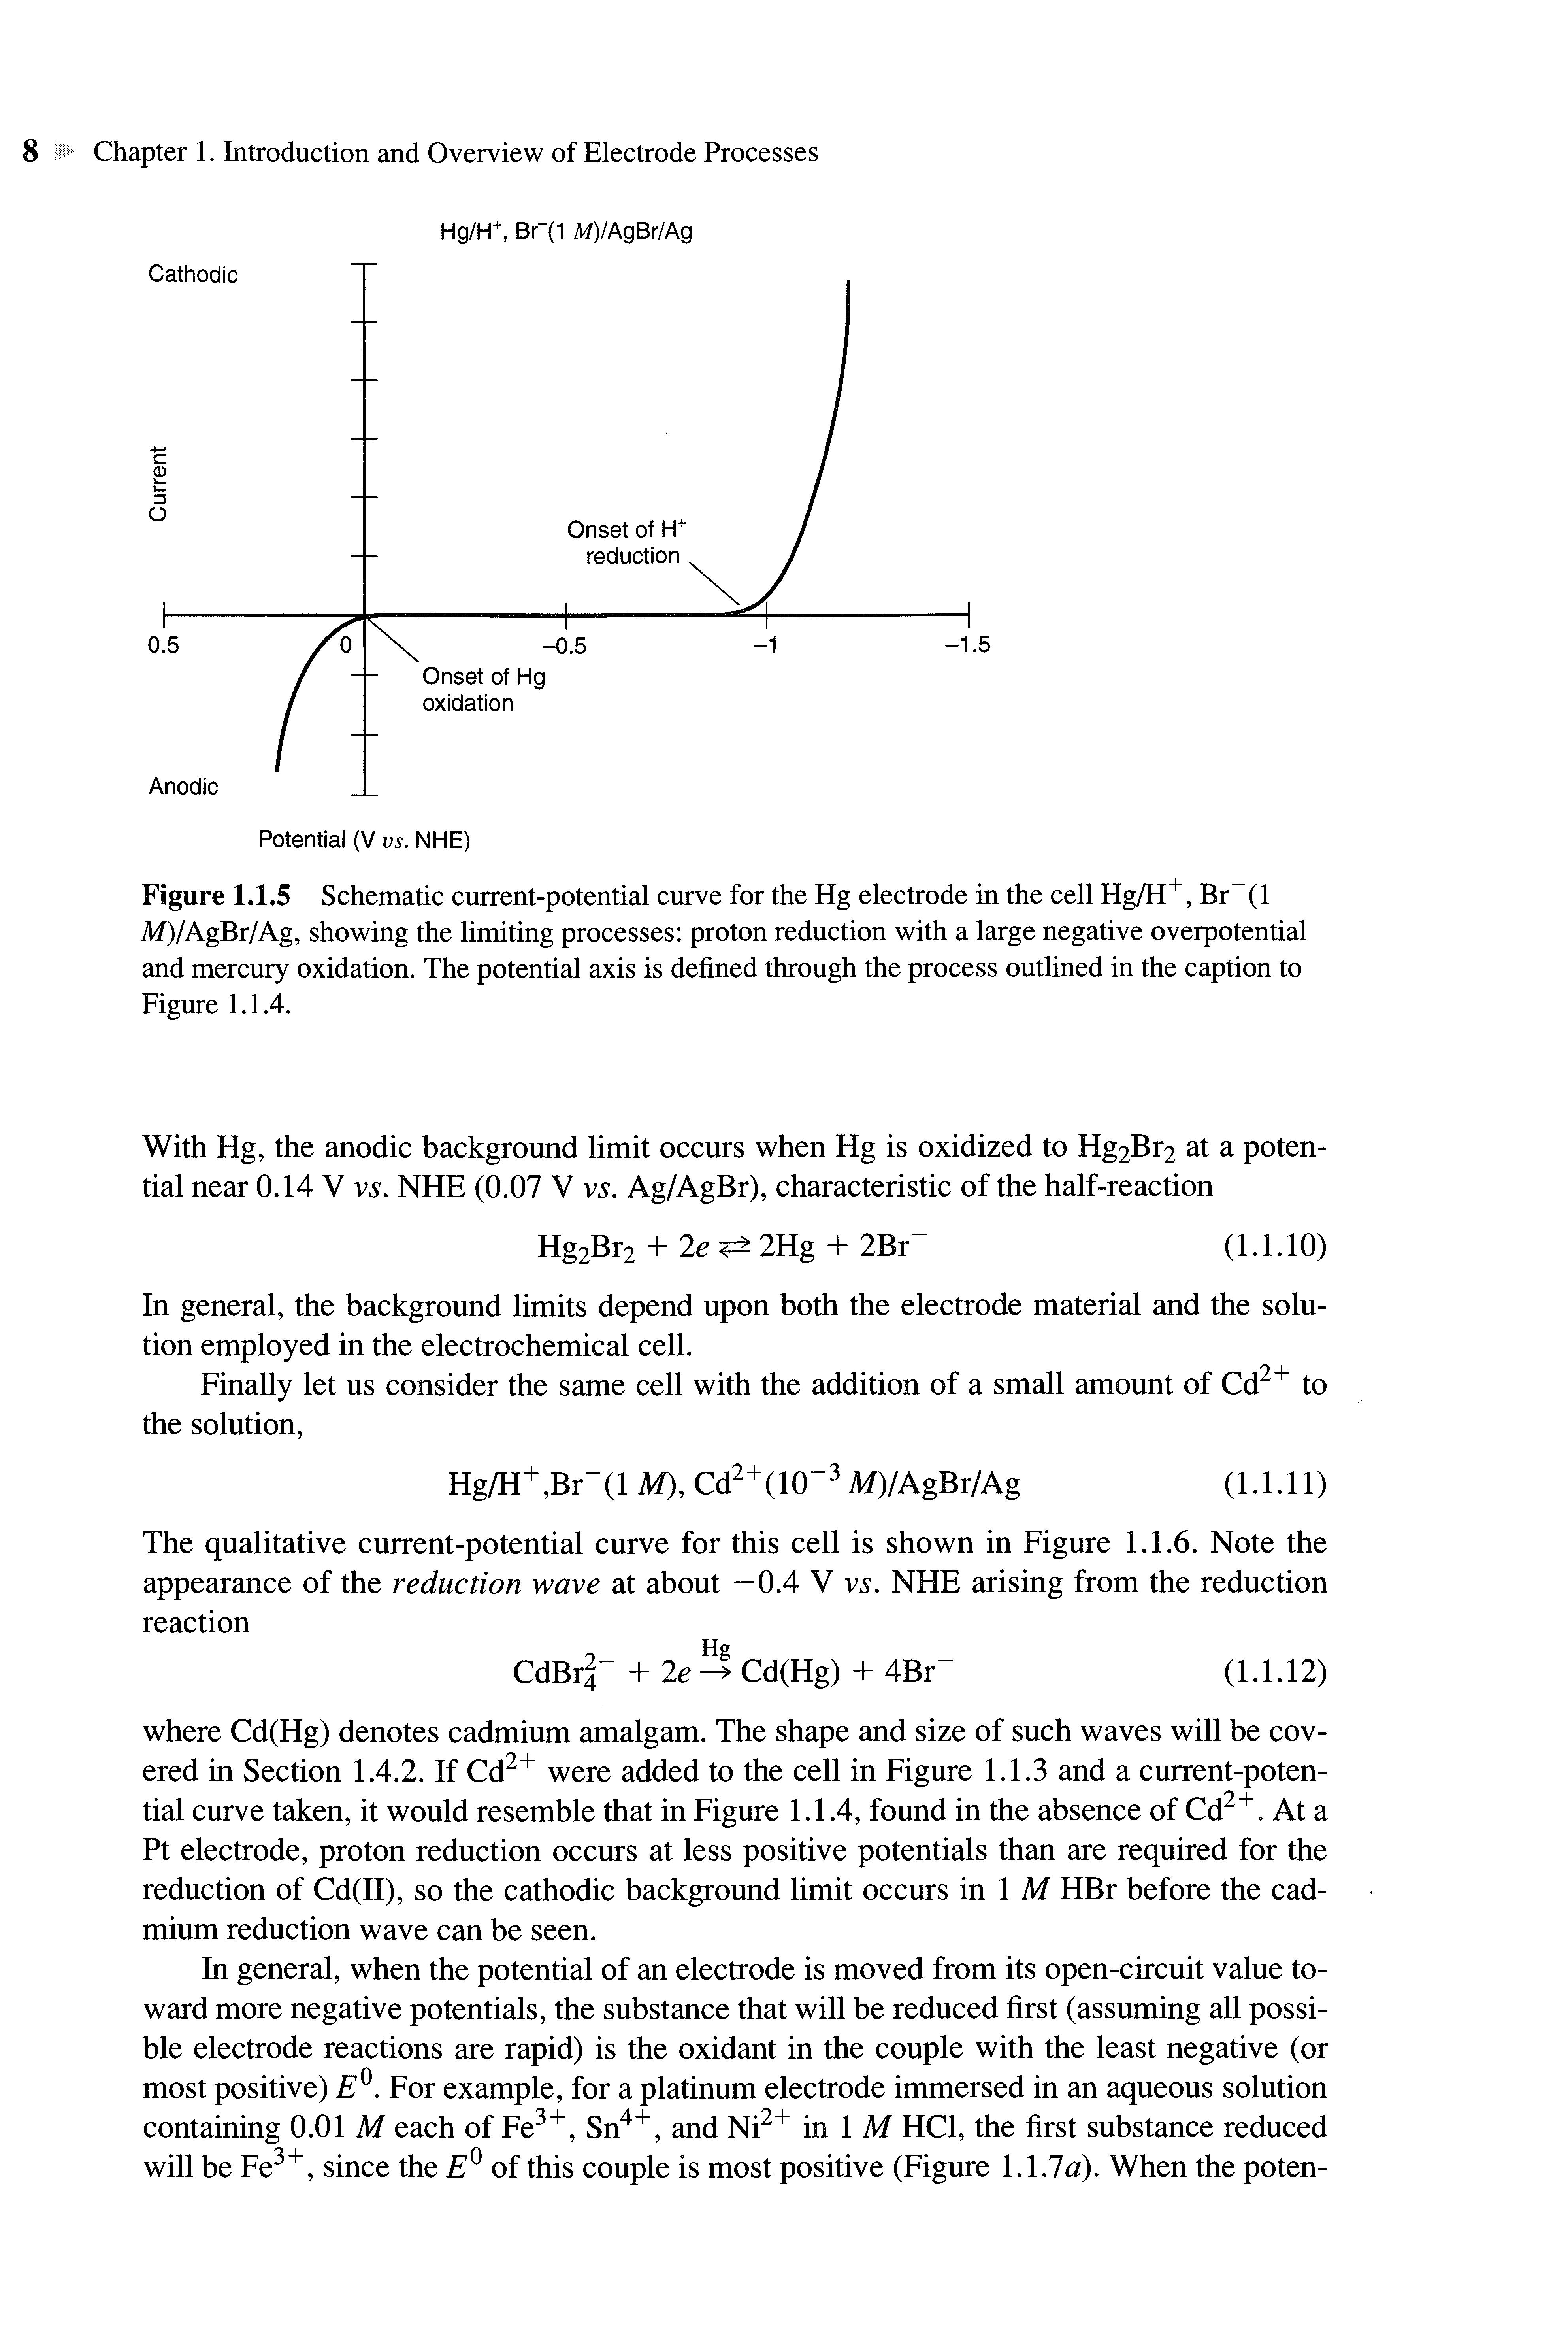
Figure 1.1.5 Schematic current-potential curve for theHgelectrode inthecell Hg/H+ , Br (1 M)/AgBr/Ag, showing thelimiting processes: proton reduction with alarge negative overpotential and mercury oxidation Thepotential axis is defined through theprocess outlined inthecaptionto Figure 1.1.4
With Hg, the anodic background limit occurs when Hg is oxidized to Hg2Br2 at a potential near 0.14 V vs. NHE(0.07 V vs. Ag/AgBr), characteristic of the half-reaction 2Br" (1.1.10)
Hg2Br2 + 2e«±2Hg
In general, the background limits depend upon both the electrode material and the solution employed in the electrochemical cell.
Finally let us consider the same cell with the addition of a small amount of Cd2+ to the solution,
Hg/H+,Br"(l M),Cd2+(10"3M)/AgBr/Ag (1.1.11)
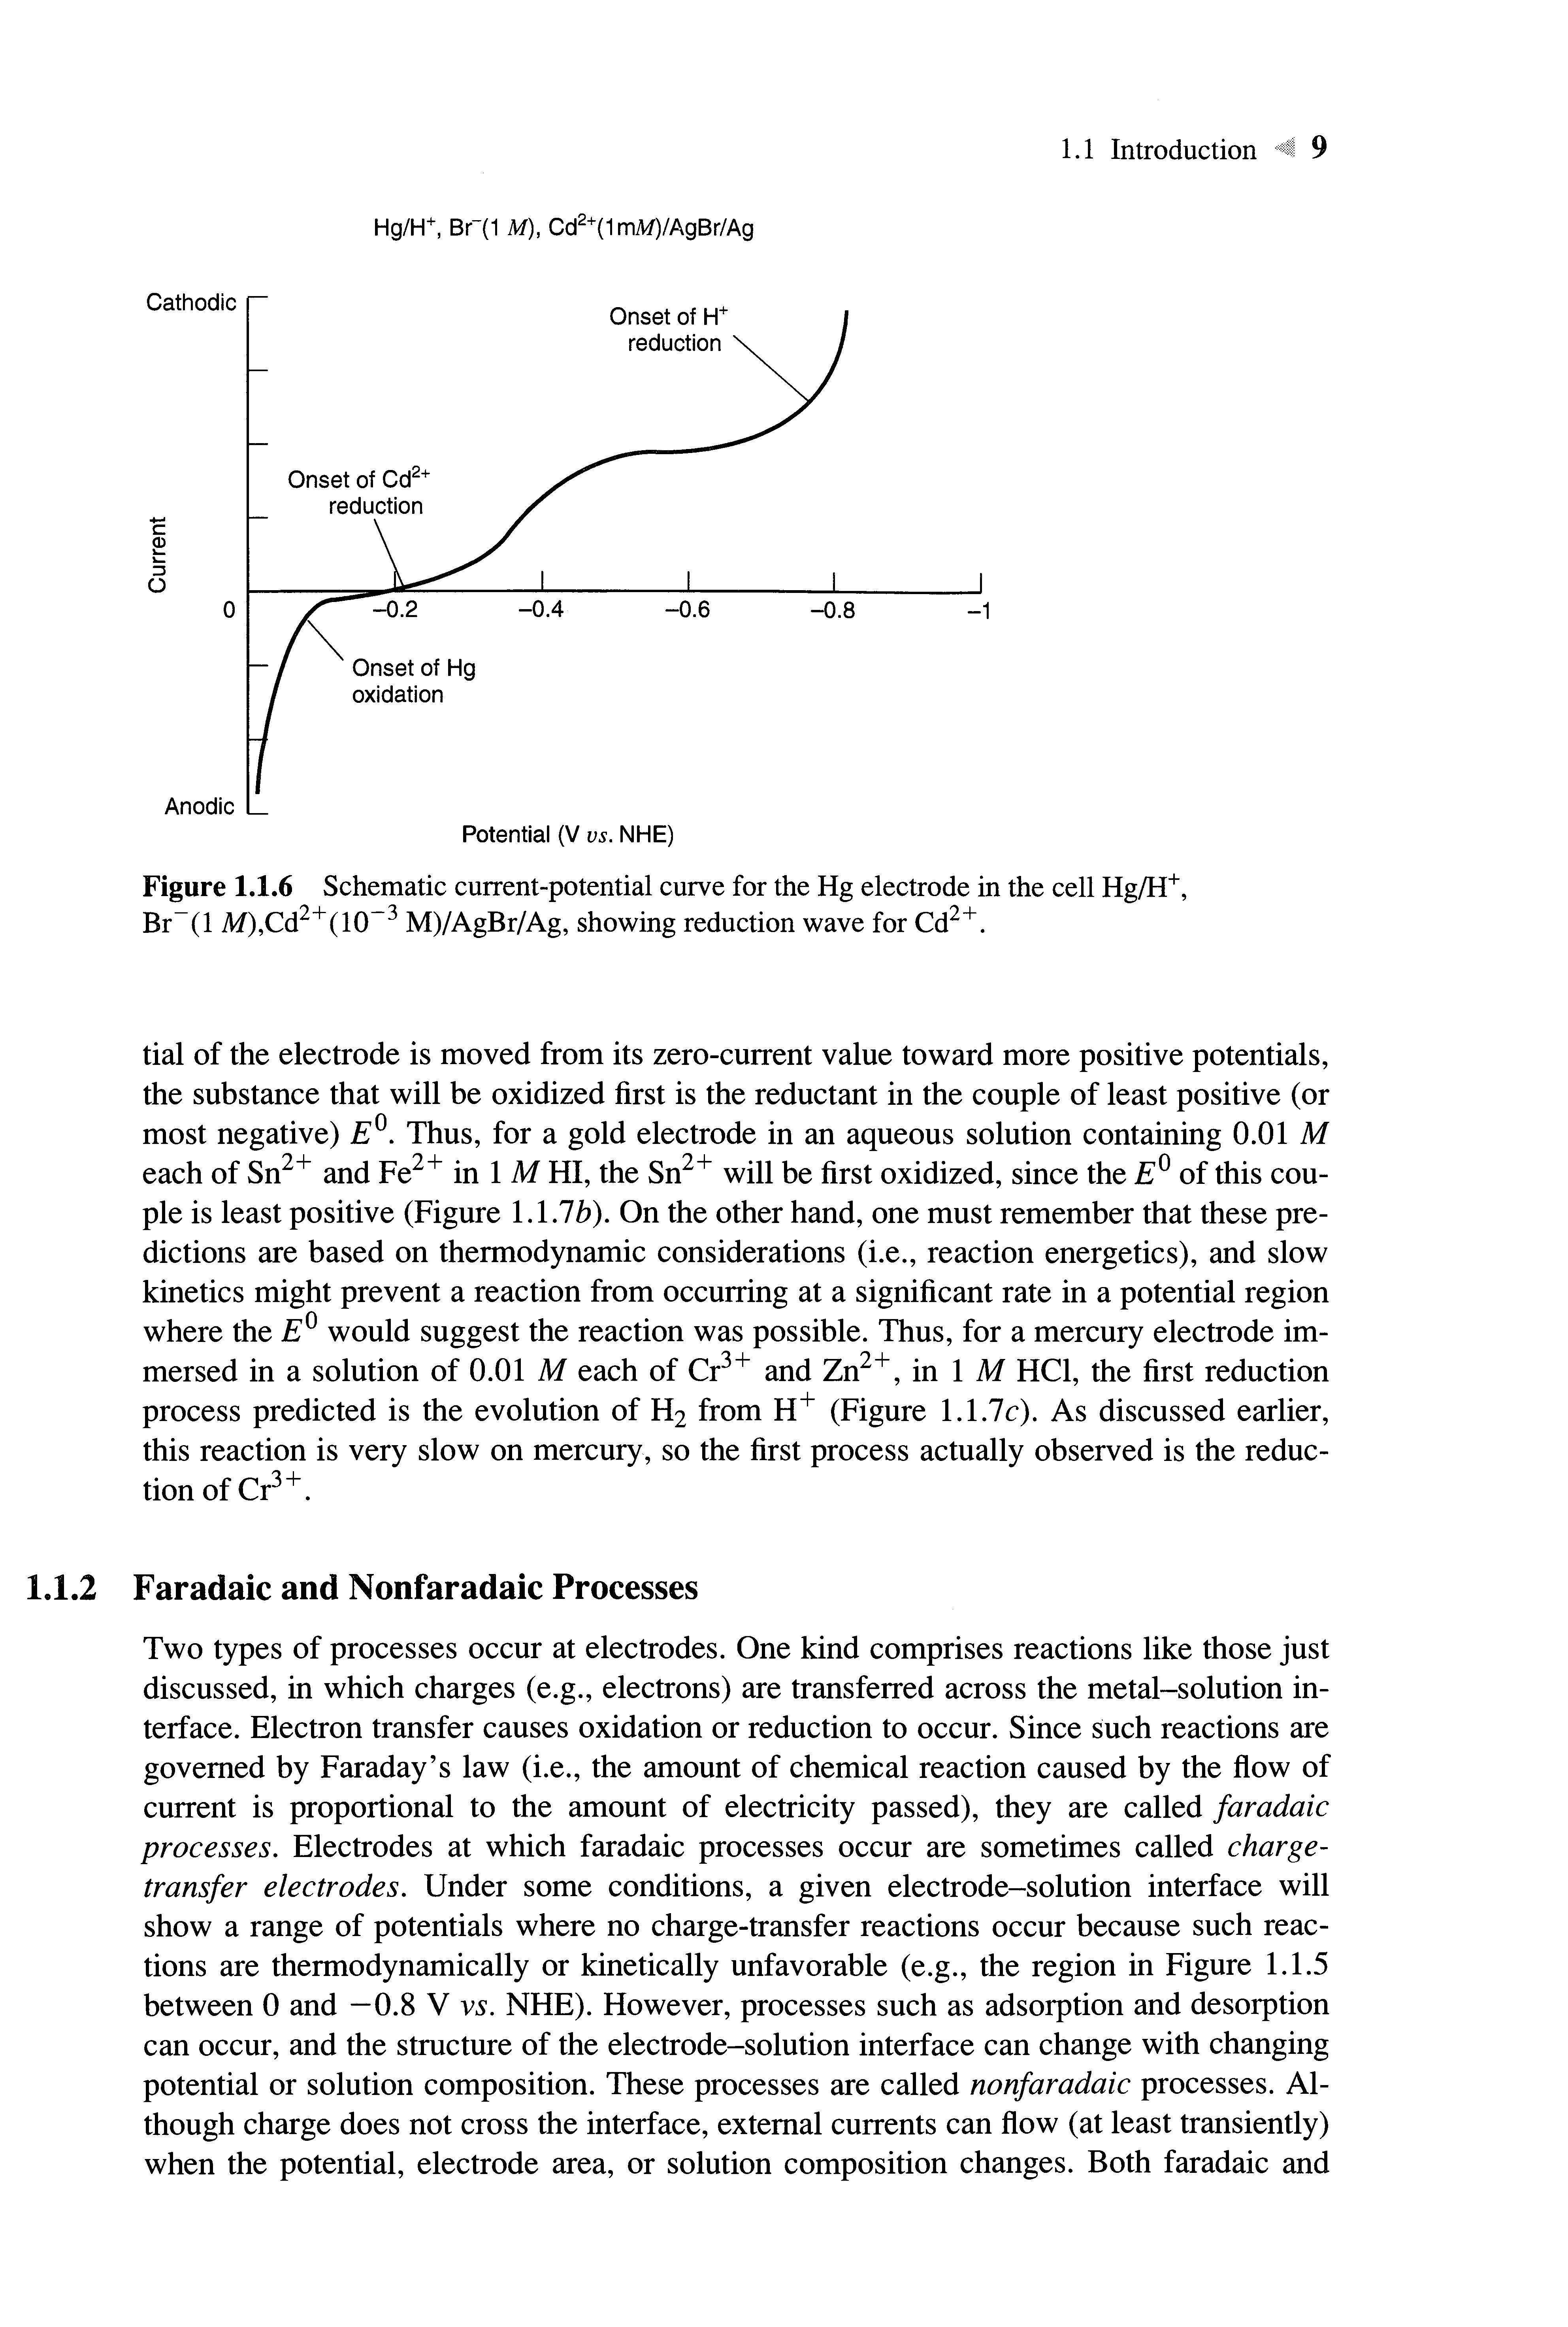
The qualitative current-potential curve for this cell is shown in Figure 1.1.6 Note the appearance of the reduction wave at about -0.4 V vs. NHE arising from the reduction reaction
CdBr|~ + 2e S Cd(Hg) + 4Br~ (1.1.12)
where Cd(Hg) denotes cadmium amalgam The shape and size of such waves will be covered in Section 1.4.2 If Cd2+ were added to the cell in Figure 1.1.3 and acurrent-potential curve taken, it would resemble that in Figure 1.1.4,found in the absence of Cd2+ At a Pt electrode, proton reduction occurs at less positive potentials than are required for the reduction of Cd(II), so the cathodic background limit occurs in 1 M HBr before the cadmium reduction wave can be seen
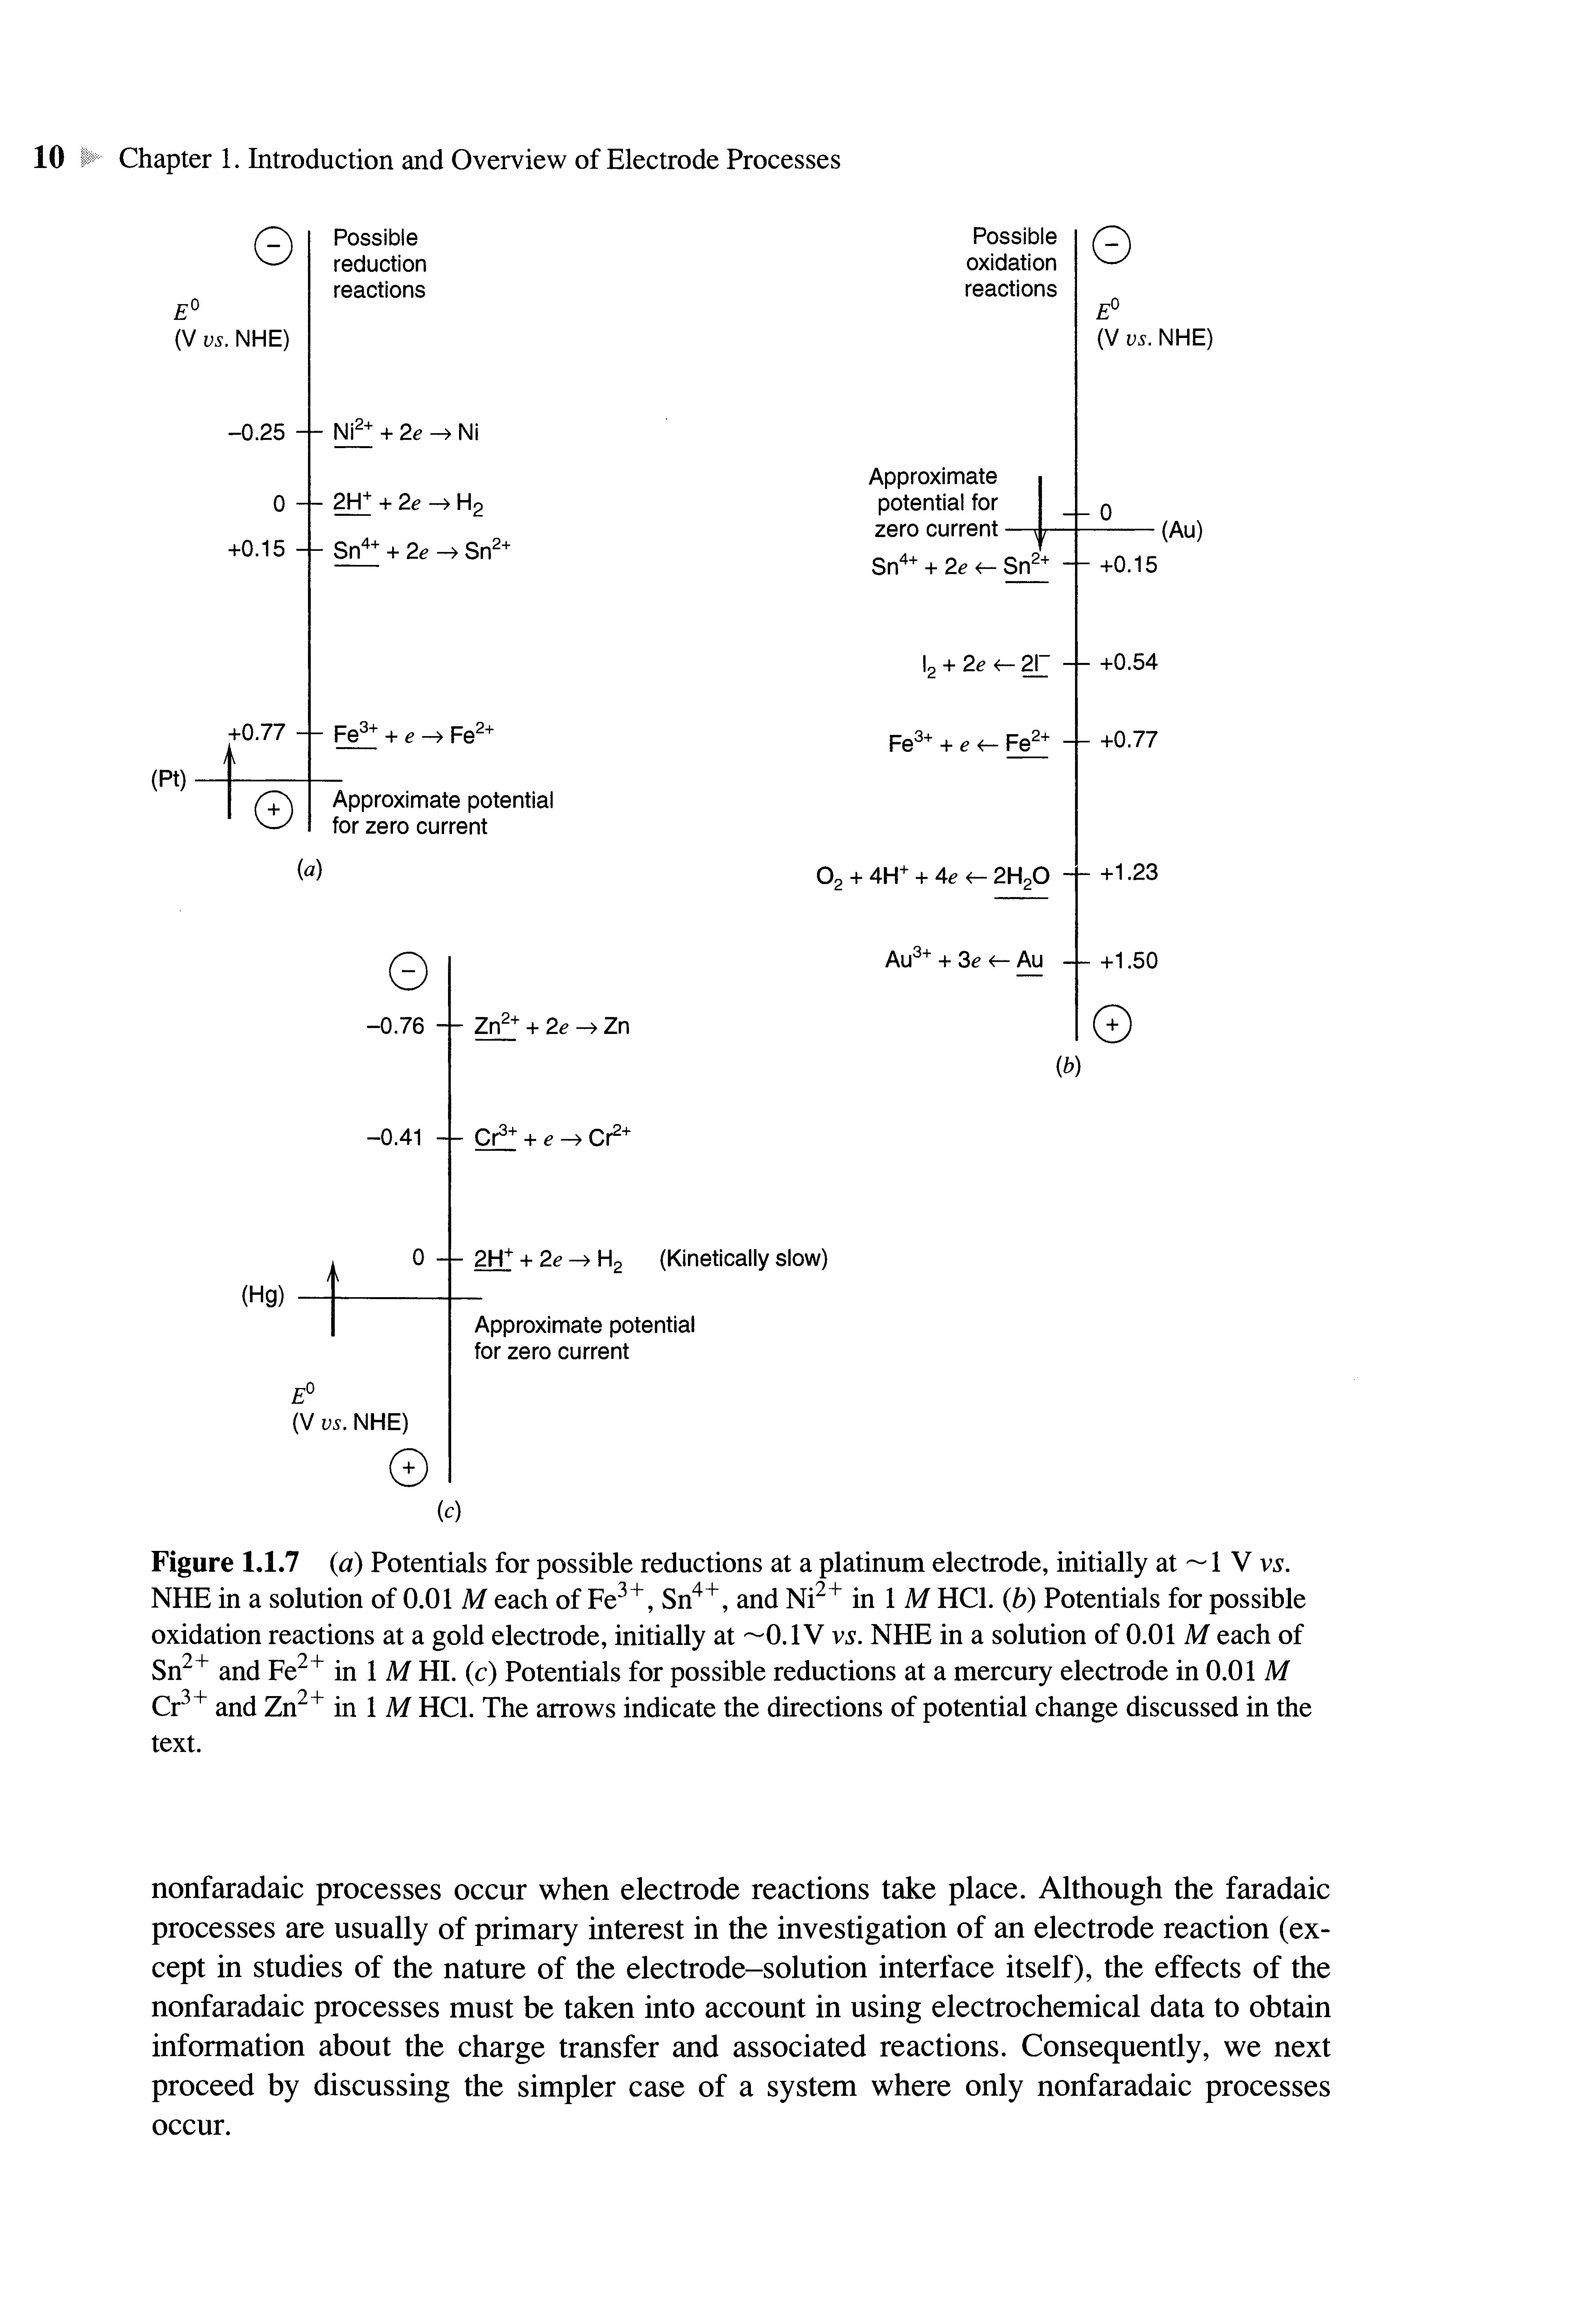
In general, when the potential of an electrode is moved from its open-circuit value toward more negative potentials, the substance that will be reduced first (assuming all possible electrode reactions are rapid) is the oxidant in the couple with the least negative (or most positive) E®. For example, for a platinum electrode immersed in an aqueous solution containing 0.01 M each of Fe 3+ , Sn4+ , and Ni 2 + in 1 M HC1, the first substance reduced will be Fe 3+ , since the E° of this couple is most positive (Figure 1.1.7a) When thepoten-
Cathodic
Hg/I-Г, ВГ(1 М), Cd2+(1mM)/AgBr/Ag
Anodic l Onset ofCd2' reduction
Potential (V vs.NHE)
Figure 1.1.6 Schematic current-potentialcurve for the Hg electrode in the cellHg/H+ , Br"(l M),Cd2+(l(T3 M)/AgBr/Ag, showing reduction wave for Cd2+
tial of the electrode is moved from its zero-current value toward more positive potentials, the substance that will be oxidized first is the reductant in the couple of least positive (or most negative) E°. Thus, for a gold electrode in an aqueous solution containing 0.01 M each of Sn2+ and Fe 2 + in 1 M HI,the Sn2+ will be first oxidized, since the E° of this couple is least positive (Figure 1.1.7b). On the other hand, one must remember that these predictions are based on thermodynamic considerations (i.e., reaction energetics), and slow kinetics might prevent a reaction from occurring at a significant rate in a potential region where the E° would suggest the reaction was possible. Thus, for a mercury electrode immersed in a solution of 0.01 M each of Cr3+ and Zn2+ , in 1 M HC1,the first reduction process predicted is the evolution of H2 from H + (Figure 1.1.7c). As discussed earlier, this reaction is very slow on mercury, so the first process actually observed is the reduction of Cr3+ .
1.1.2 Faradaic and Nonfaradaic Processes
Two types of processes occur at electrodes One kind comprises reactions like those just discussed, in which charges (e.g., electrons) are transferred across the metal-solution interface Electron transfer causes oxidation or reduction to occur Since such reactions are governed by Faraday's law (i.e., the amount of chemical reaction caused by the flow of current is proportional to the amount of electricity passed), they are called faradaic processes. Electrodes at which faradaic processes occur are sometimes called chargetransfer electrodes. Under some conditions, a given electrode-solution interface will show a range of potentials where no charge-transfer reactions occur because such reactions are thermodynamically or kinetically unfavorable (e.g., the region in Figure 1.1.5 between 0 and —0.8 V vs. NHE) However, processes such as adsorption and desorption can occur, and the structure of the electrode-solution interface can change with changing potential or solution composition These processes are called nonfaradaic processes Although charge does not cross the interface, external currents can flow (at least transiently) when the potential, electrode area, or solution composition changes Both faradaic and
Possible reduction reactions
(V vs. NHE)
0
Ni2+ + 2e -> Ni
2H + + 2e -» H 9
Sn4+ + 2e -> Sn2+
Approximate potential for zero current (a)
Possible oxidation reactions
Approximate potential for zero current - - 0
2 + 2e<-2£
(Kineticallyslow)
Approximate potential for zero current
vs. NHE)
(c)
Figure 1.1.7 (a) Potentials for possible reductions at a platinum electrode, initially at ~ 1V vs. NHE in a solution of 0.01 M each of Fe3+ , Sn4+ , and Ni2+ in 1 M HCL (b) Potentials for possible oxidation reactions at a gold electrode, initially at ~0.1V vs. NHE in a solution of 0.01 M each of Sn2+ and Fe2+ in 1M HI (c) Potentials for possible reductions at a mercury electrode in 0.01 M Cr3+ and Zn2+ in 1 M HCL The arrows indicate the directions of potential change discussed in the text
nonfaradaic processes occur when electrode reactions take place. Although the faradaic processes are usually of primary interest in the investigation of an electrode reaction (except in studies of the nature of the electrode-solution interface itself), the effects of the nonfaradaic processes must be taken into account in using electrochemical data to obtain information about the charge transfer and associated reactions Consequently, we next proceed by discussing the simpler case of a system where only nonfaradaic processes occur
1.2 NONFARADAICPROCESSES AND THENATUREOFTHE ELECTRODE-SOLUTIONINTERFACE
1.2.1
The Ideal Polarized Electrode
An electrode atwhich no charge transfer can occur across the metal-solution interface, regardless ofthe potential imposed by anoutside source ofvoltage, is called anidealpolarized (orideal polarizable) electrode (IPE). While noreal electrode can behave as an IPE over thewhole potential range available in a solution, some electrode-solution systems can approach ideal polarizability over limited potential ranges, For example, a mercury electrode incontact with adeaerated potassium chloride solution approaches the behavior of anIPE over a potential range about 2 V wide At sufficiently positive potentials, the mercury can oxidize inacharge-transfer reaction:
+ СГ -> |Hg2Cl2 +
(at~ +0.25 V vs.
(1.2.1) and atvery negative potentials K + can bereduced:
In thepotential range between these processes, charge-transfer reactions arenotsignificant. The reduction of water:
is thermodynamically possible, butoccurs ata very lowrate ata mercury surface unless quite negative potentials arereached Thus, the only faradaic current that flows inthis region is due tocharge-transfer reactions of trace impurities (e.g., metal ions, oxygen, and organic species), andthis current is quite small inclean systems. Another electrode that behaves as an IPE is a gold surface hosting an adsorbed self-assembled monolayer of alkane thiol (see Section 14.5.2).
1.2.2 Capacitance and Charge of an Electrode
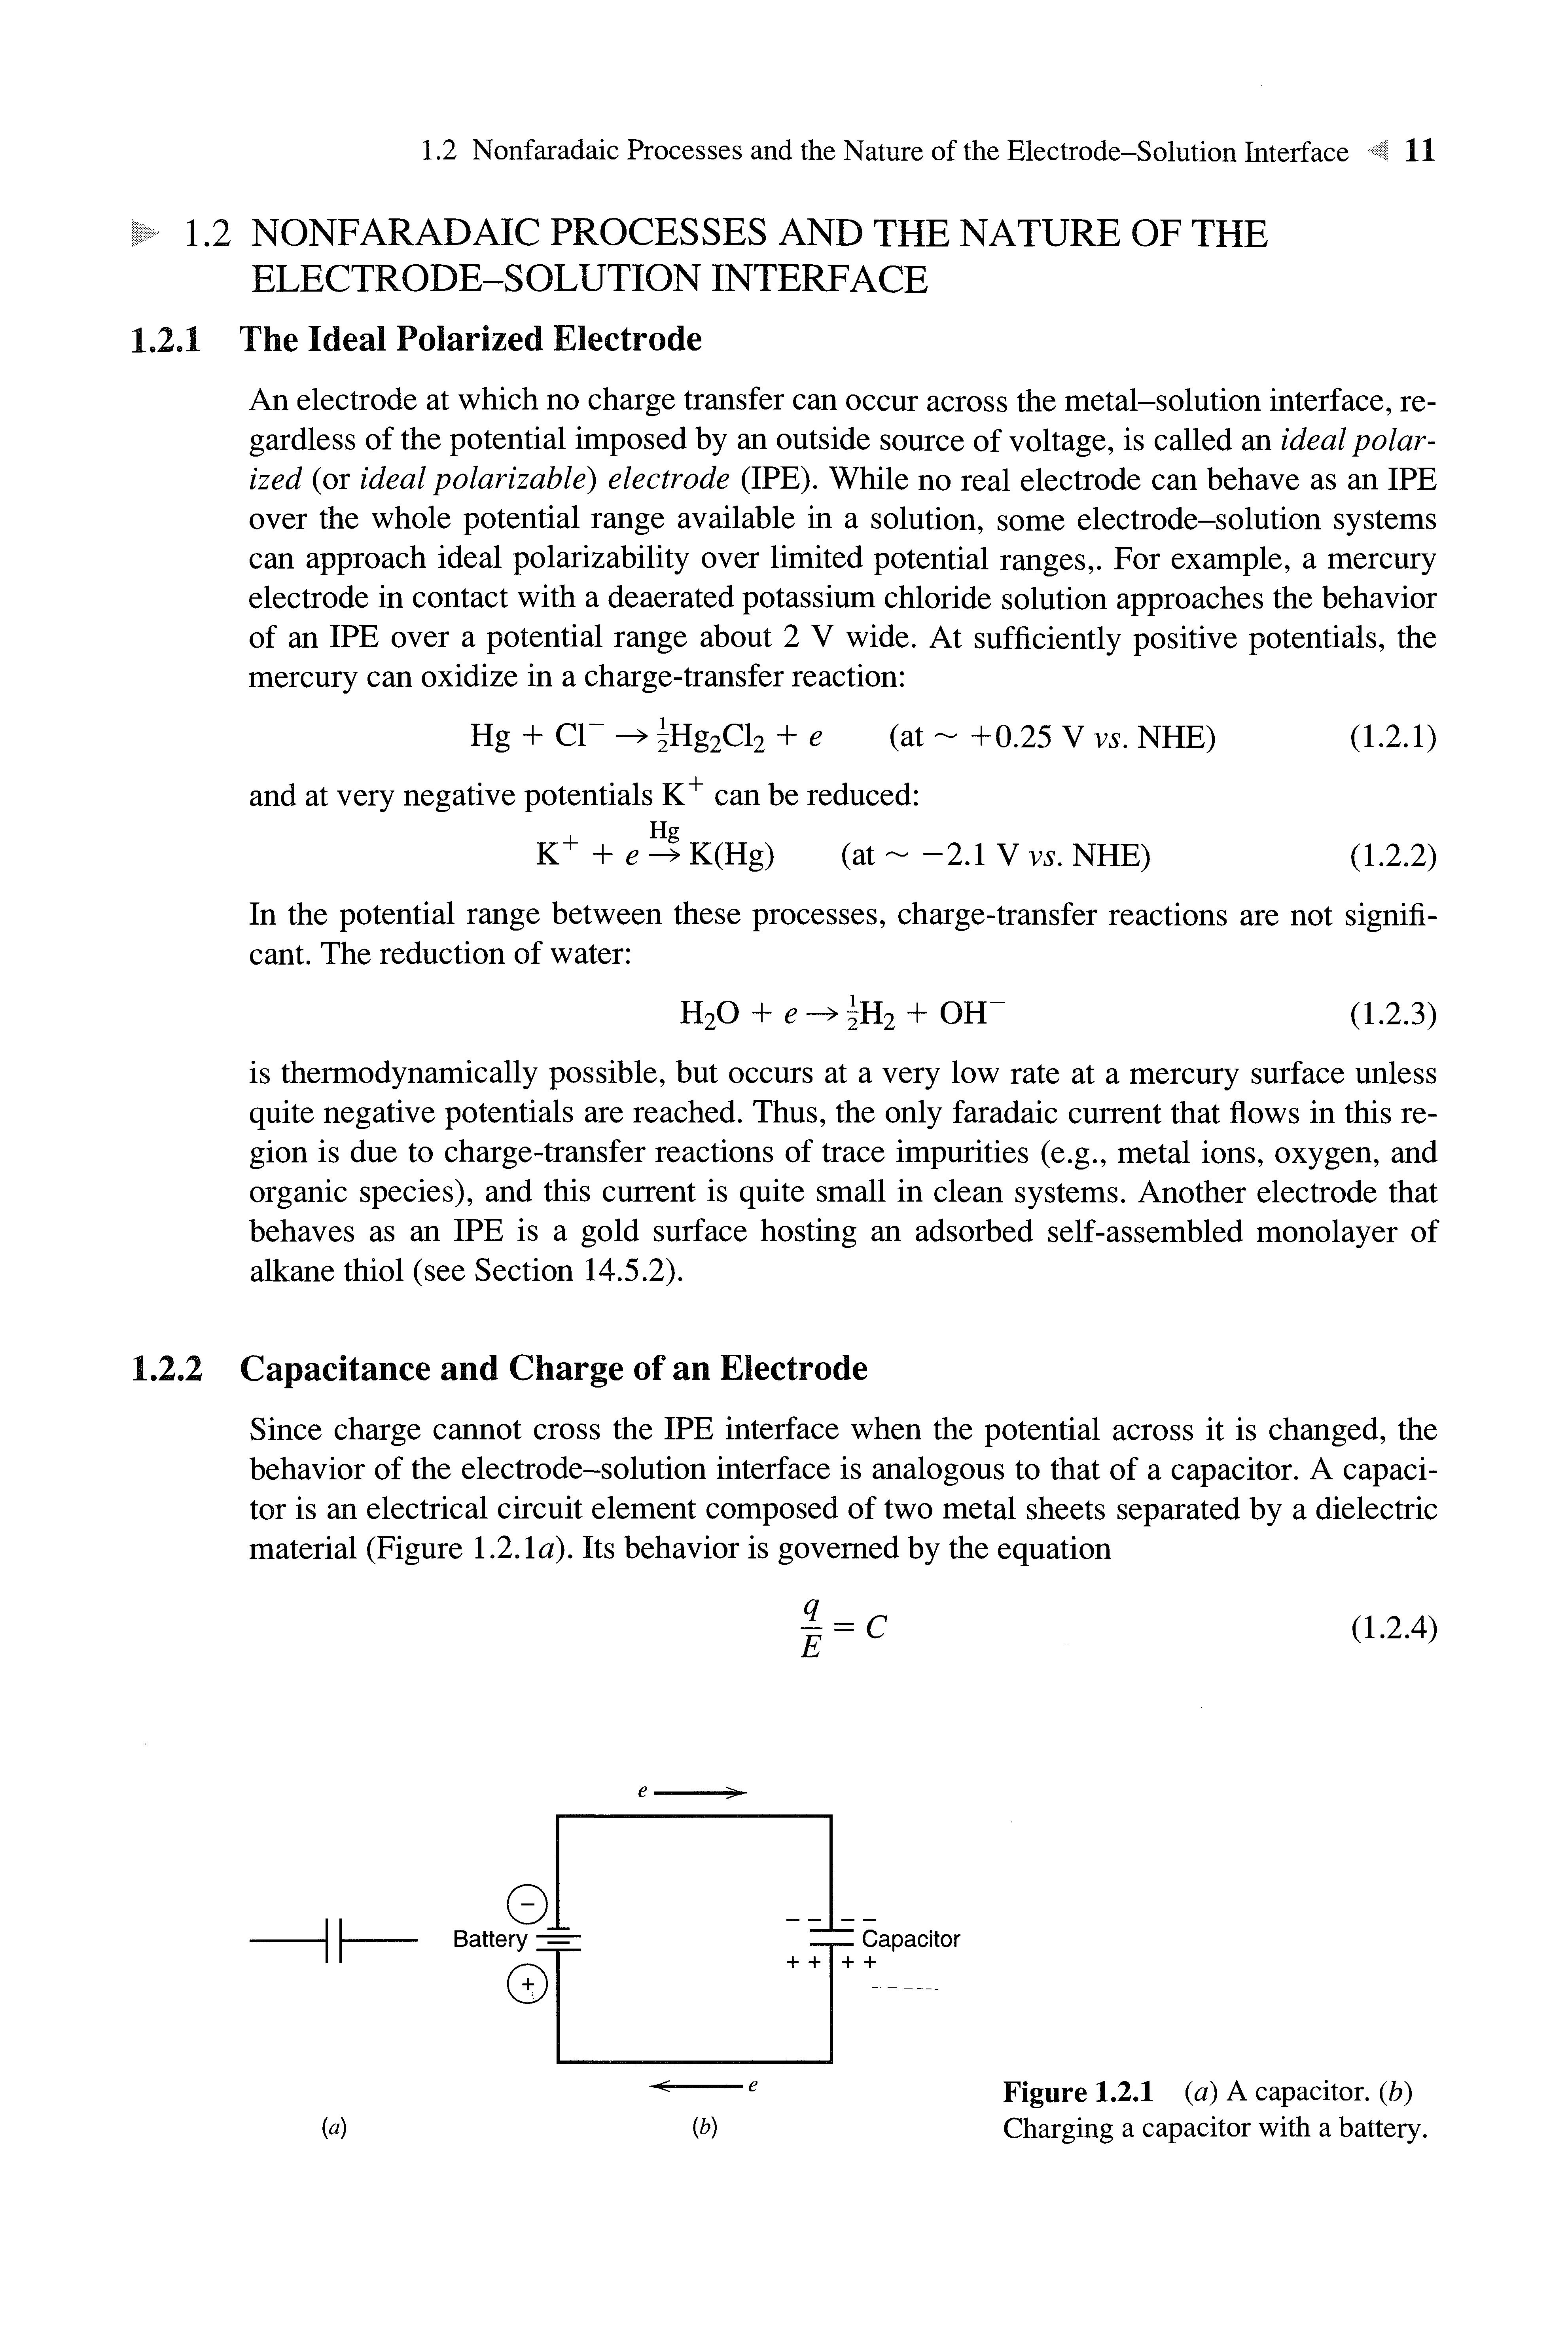
Since charge cannot cross theIPE interface when thepotential across it is changed,the behavior of the electrode-solution interface is analogous tothat of a capacitor A capacitor is anelectrical circuit element composed of two metal sheets separated by a dielectric material (Figure 1.2.1a) Itsbehavior is governed bytheequation
(1.2.4)
Figure 1.2.1 (a) A capacitor, (b)
Charging a capacitor with a battery.
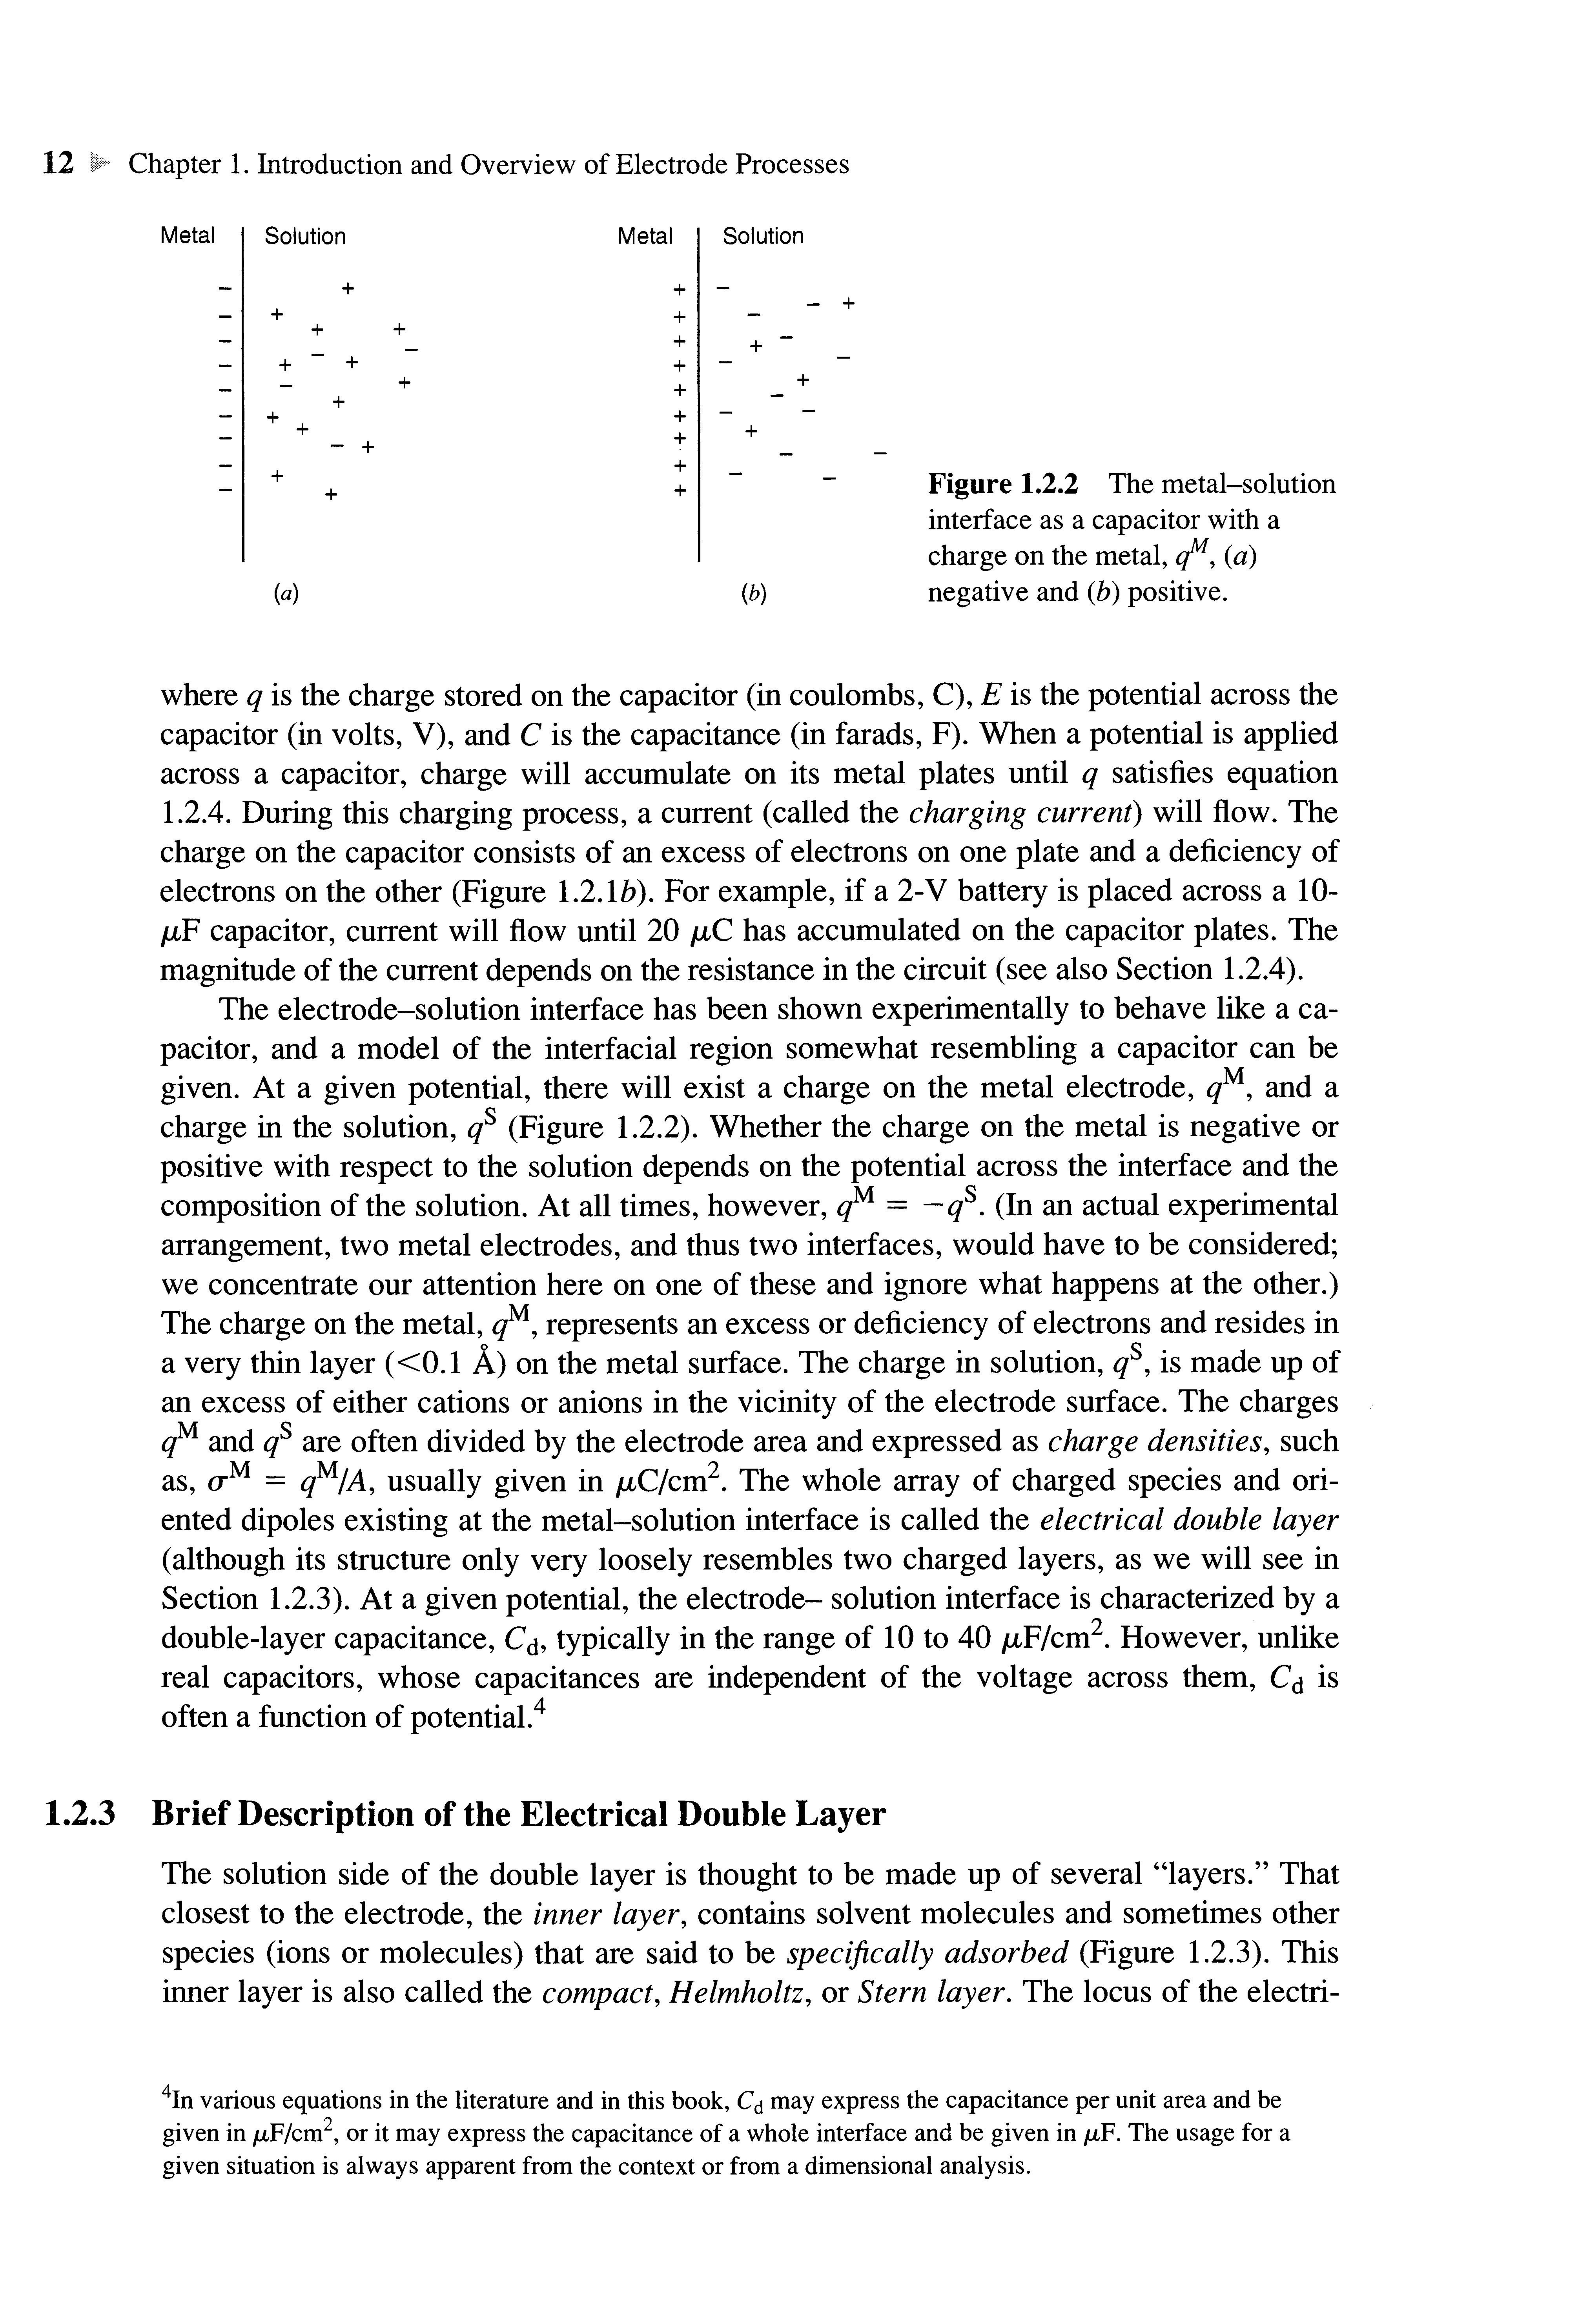
Figure 1.2.2 The metal-solution interface as a capacitor with a charge on the metal, q M , (a) negative and (b) positive
where q is the charge stored on the capacitor (in coulombs, С),Е is the potential across the capacitor (in volts, V), and С is the capacitance (in farads, F) When a potential is applied across a capacitor, charge will accumulate on its metal plates until q satisfies equation 1.2.4 During this charging process, a current (called the charging current) will flow The charge on the capacitor consists of an excess of electrons on one plate and a deficiency of electrons on the other (Figure 1.2.1b) For example, if a 2-V battery is placed across a 10/л¥ capacitor, current will flow until 20 /лС has accumulated on the capacitor plates. The magnitude of the currentdepends on theresistance in the circuit (see also Section 1.2.4).
The electrode-solution interface has been shown experimentally to behave like a capacitor, and a model of the interfacial region somewhat resembling a capacitor can be given. At a given potential, there will exist a charge on the metal electrode, q M , and a charge in the solution, q s (Figure 1.2.2) Whether the charge on the metal is negative or positive with respect to the solution depends on the potential across the interface and the composition of the solution At all times, however, q M — -qs (In an actual experimental arrangement, two metal electrodes, and thus two interfaces, would have to be considered; we concentrate our attention here on one of these and ignore what happens at the other.) The charge on the metal, q M , represents an excess or deficiency of electrons and resides in a very thin layer (<0.1 A) on the metal surface. The charge in solution, q s , is made up of an excess of either cations or anions in the vicinity of the electrode surface. The charges q M and q s are often divided by the electrode area and expressed as charge densities, such as, (j M = q M/A, usually given in /лС/ст2 The whole array of charged species and oriented dipoles existing at the metal-solution interface is called the electrical double layer (although its structure only very loosely resembles two charged layers, as we will see in Section 1.2.3) At a given potential,the electrode- solution interface is characterized by a double-layer capacitance, C<j,typically in the range of 10 to 40 /^F/cm2 However, unlike real capacitors, whose capacitances are independent of the voltage across them, Q is often a function of potential.4
1.2.3 Brief Description of the Electrical Double Layer
The solution side of the double layer is thought to be made up of several "layers." That closest to the electrode, the inner layer, contains solvent molecules and sometimes other species (ions or molecules) that are said to be specifically adsorbed (Figure 1.2.3) This inner layer is also called the compact, Helmholtz, or Stern layer. The locus of the electri-
4In various equations in the literature and in this book, Cj may express the capacitance per unit area and be given in fxF/cm2 , or it may express the capacitance of a whole interface and be given in JJLF. The usage for a given situation is always apparent from the context or from a dimensional analysis
IHP OHP
ф1 ф2
Diffuse layer
Solvated cation
Metal
Specifically adsorbed anion
= Solvent molecule
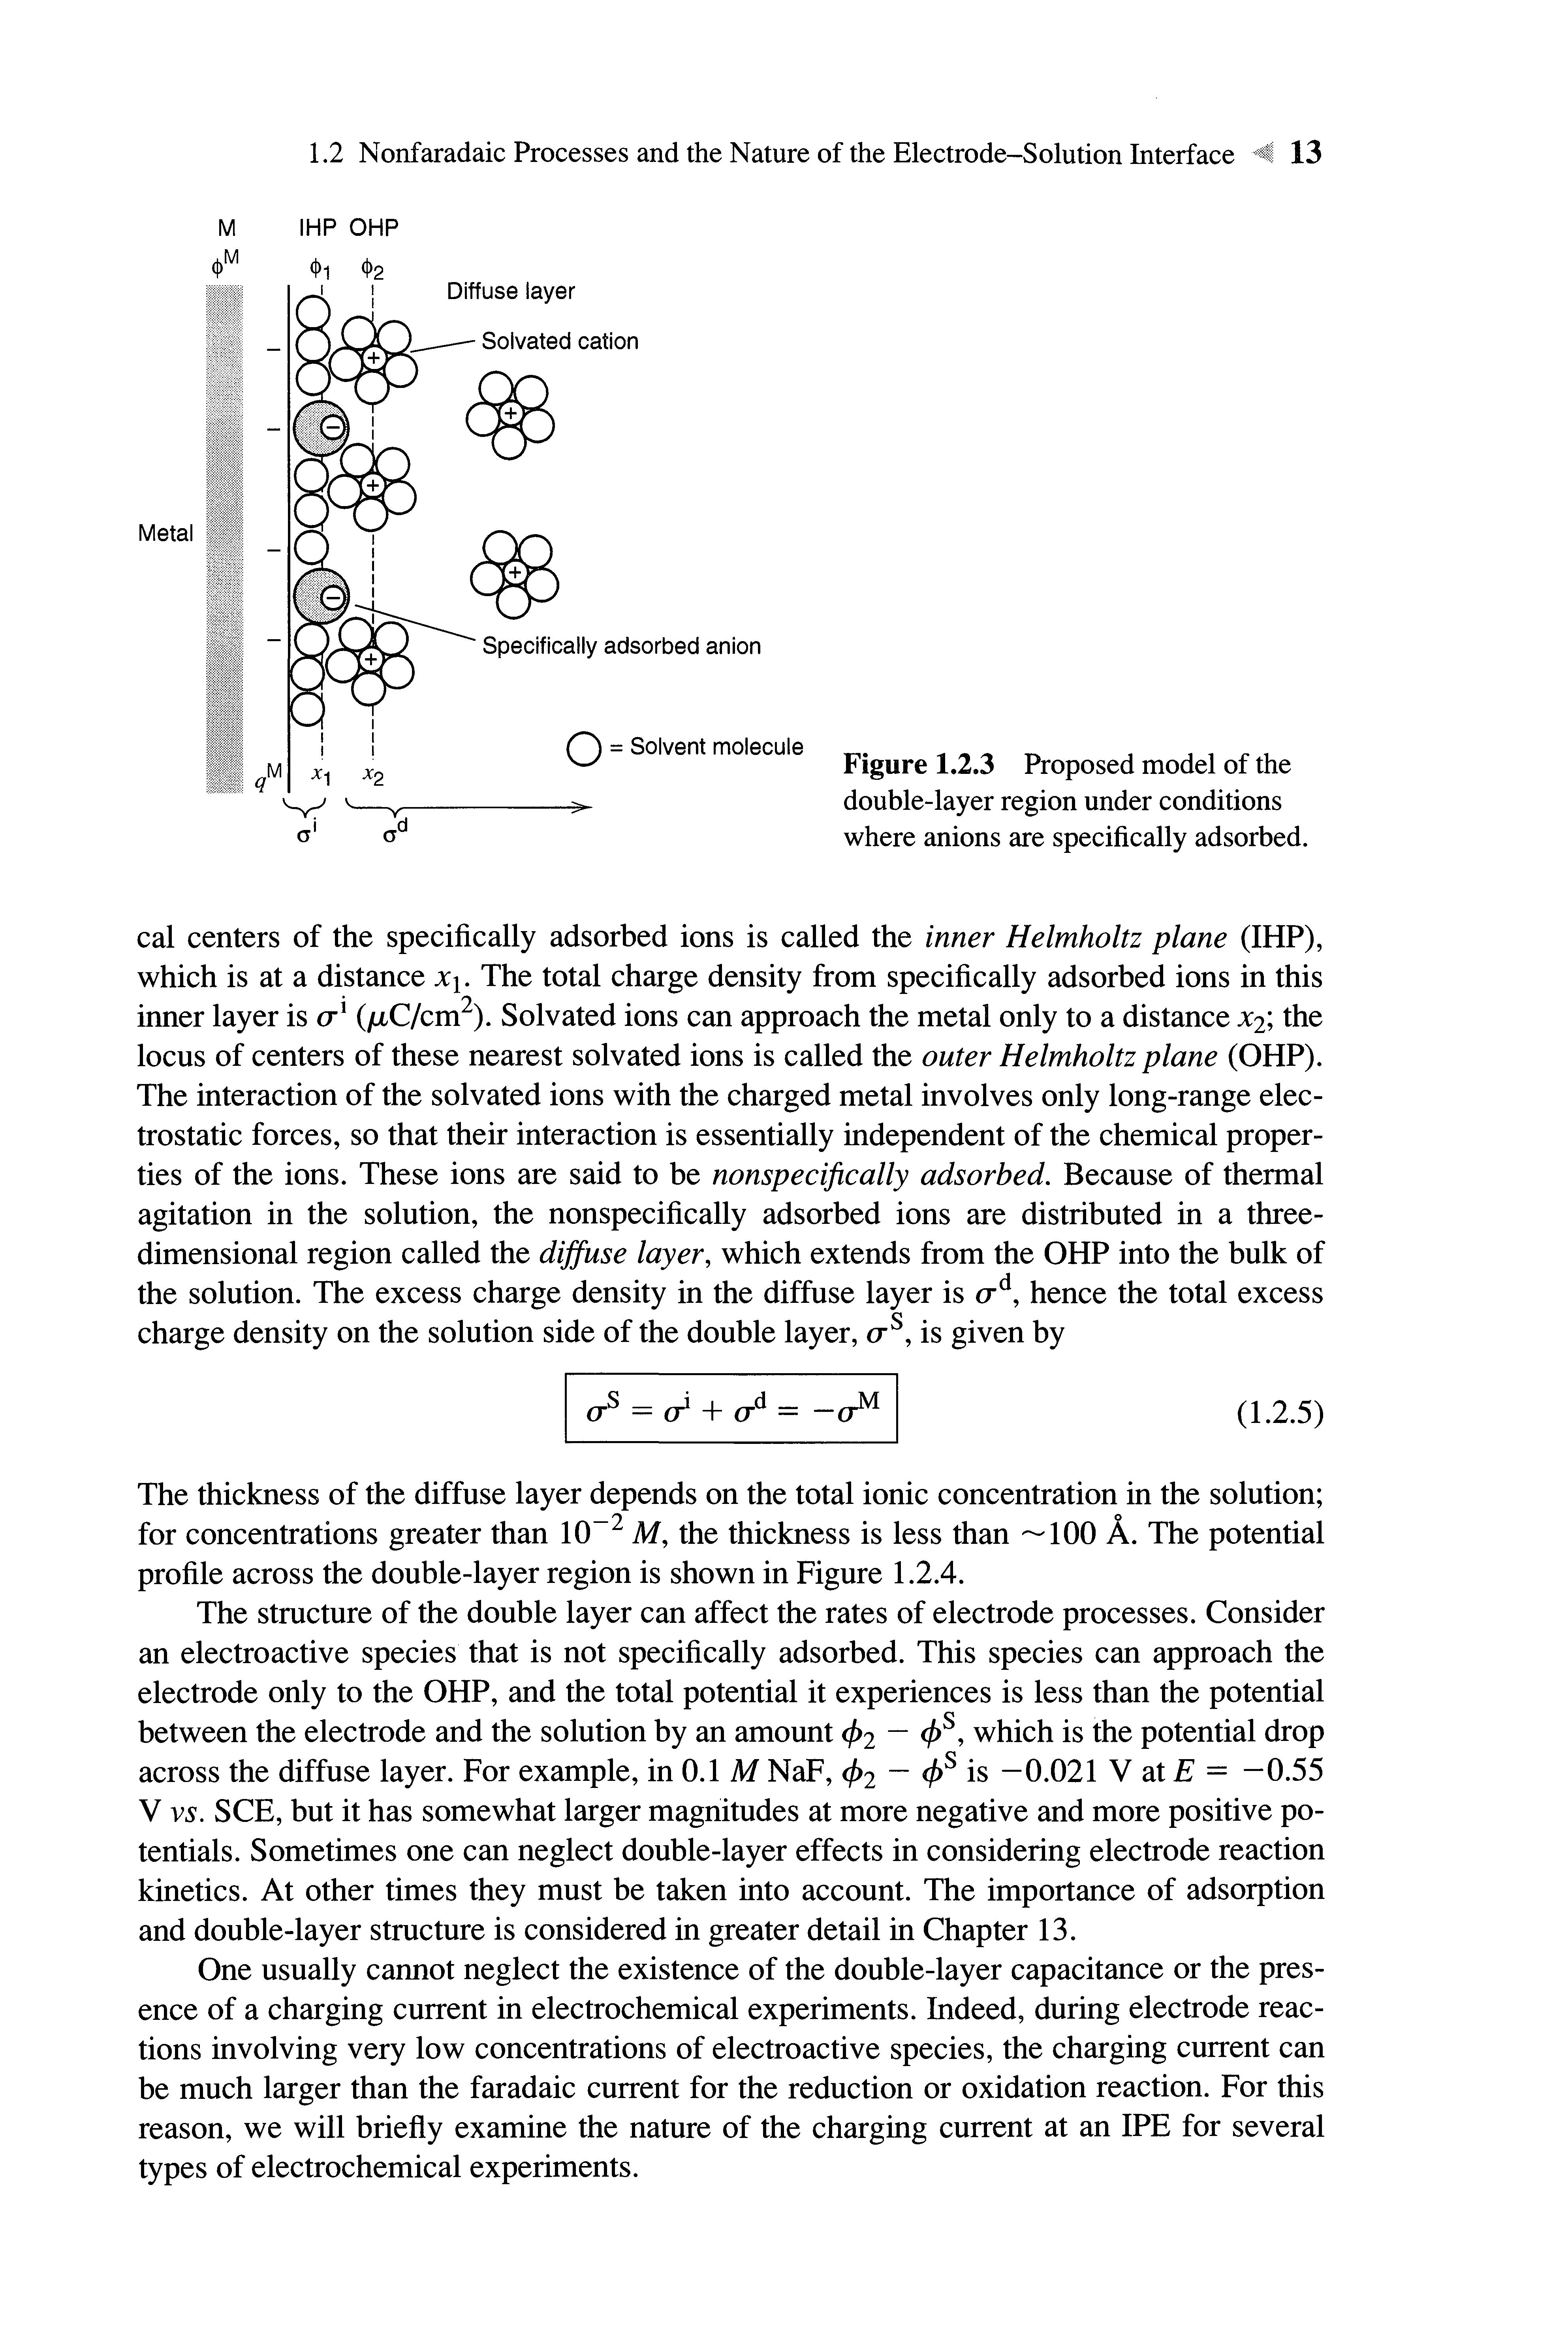
Figure 1.2.3 Proposed modelofthe double-layerregionunderconditions whereanionsarespecifically adsorbed.
cal centers of the specifically adsorbed ions is called the inner Helmholtz plane (IHP), which is at a distance x\. The total charge density from specifically adsorbed ions inthis inner layer is а 1 (/лС/ст2).Solvated ions canapproachthemetalonly to a distancex2; the locus of centersof these nearest solvated ions is called the outer Helmholtz plane (OHP) The interaction of the solvated ions with thechargedmetalinvolves only long-rangeelectrostatic forces, so that their interaction is essentially independent of the chemical properties of the ions These ions are said to be nonspecifically adsorbed. Because of thermal agitation in the solution, the nonspecifically adsorbed ions are distributed in a threedimensional region called the dijfuse layer, which extends from the OHPinto the bulk of the solution The excess charge density in the diffuse layer is <7d,hence the total excess charge density onthe solutionside of thedoublelayer, cr s , is given by
The thickness of thediffuse layer dependsonthetotal ionic concentration in thesolution; for concentrations greater than 10~2 M, the thickness is less than ~100 A The potential profile across thedouble-layerregion is shown in Figure 1.2.4
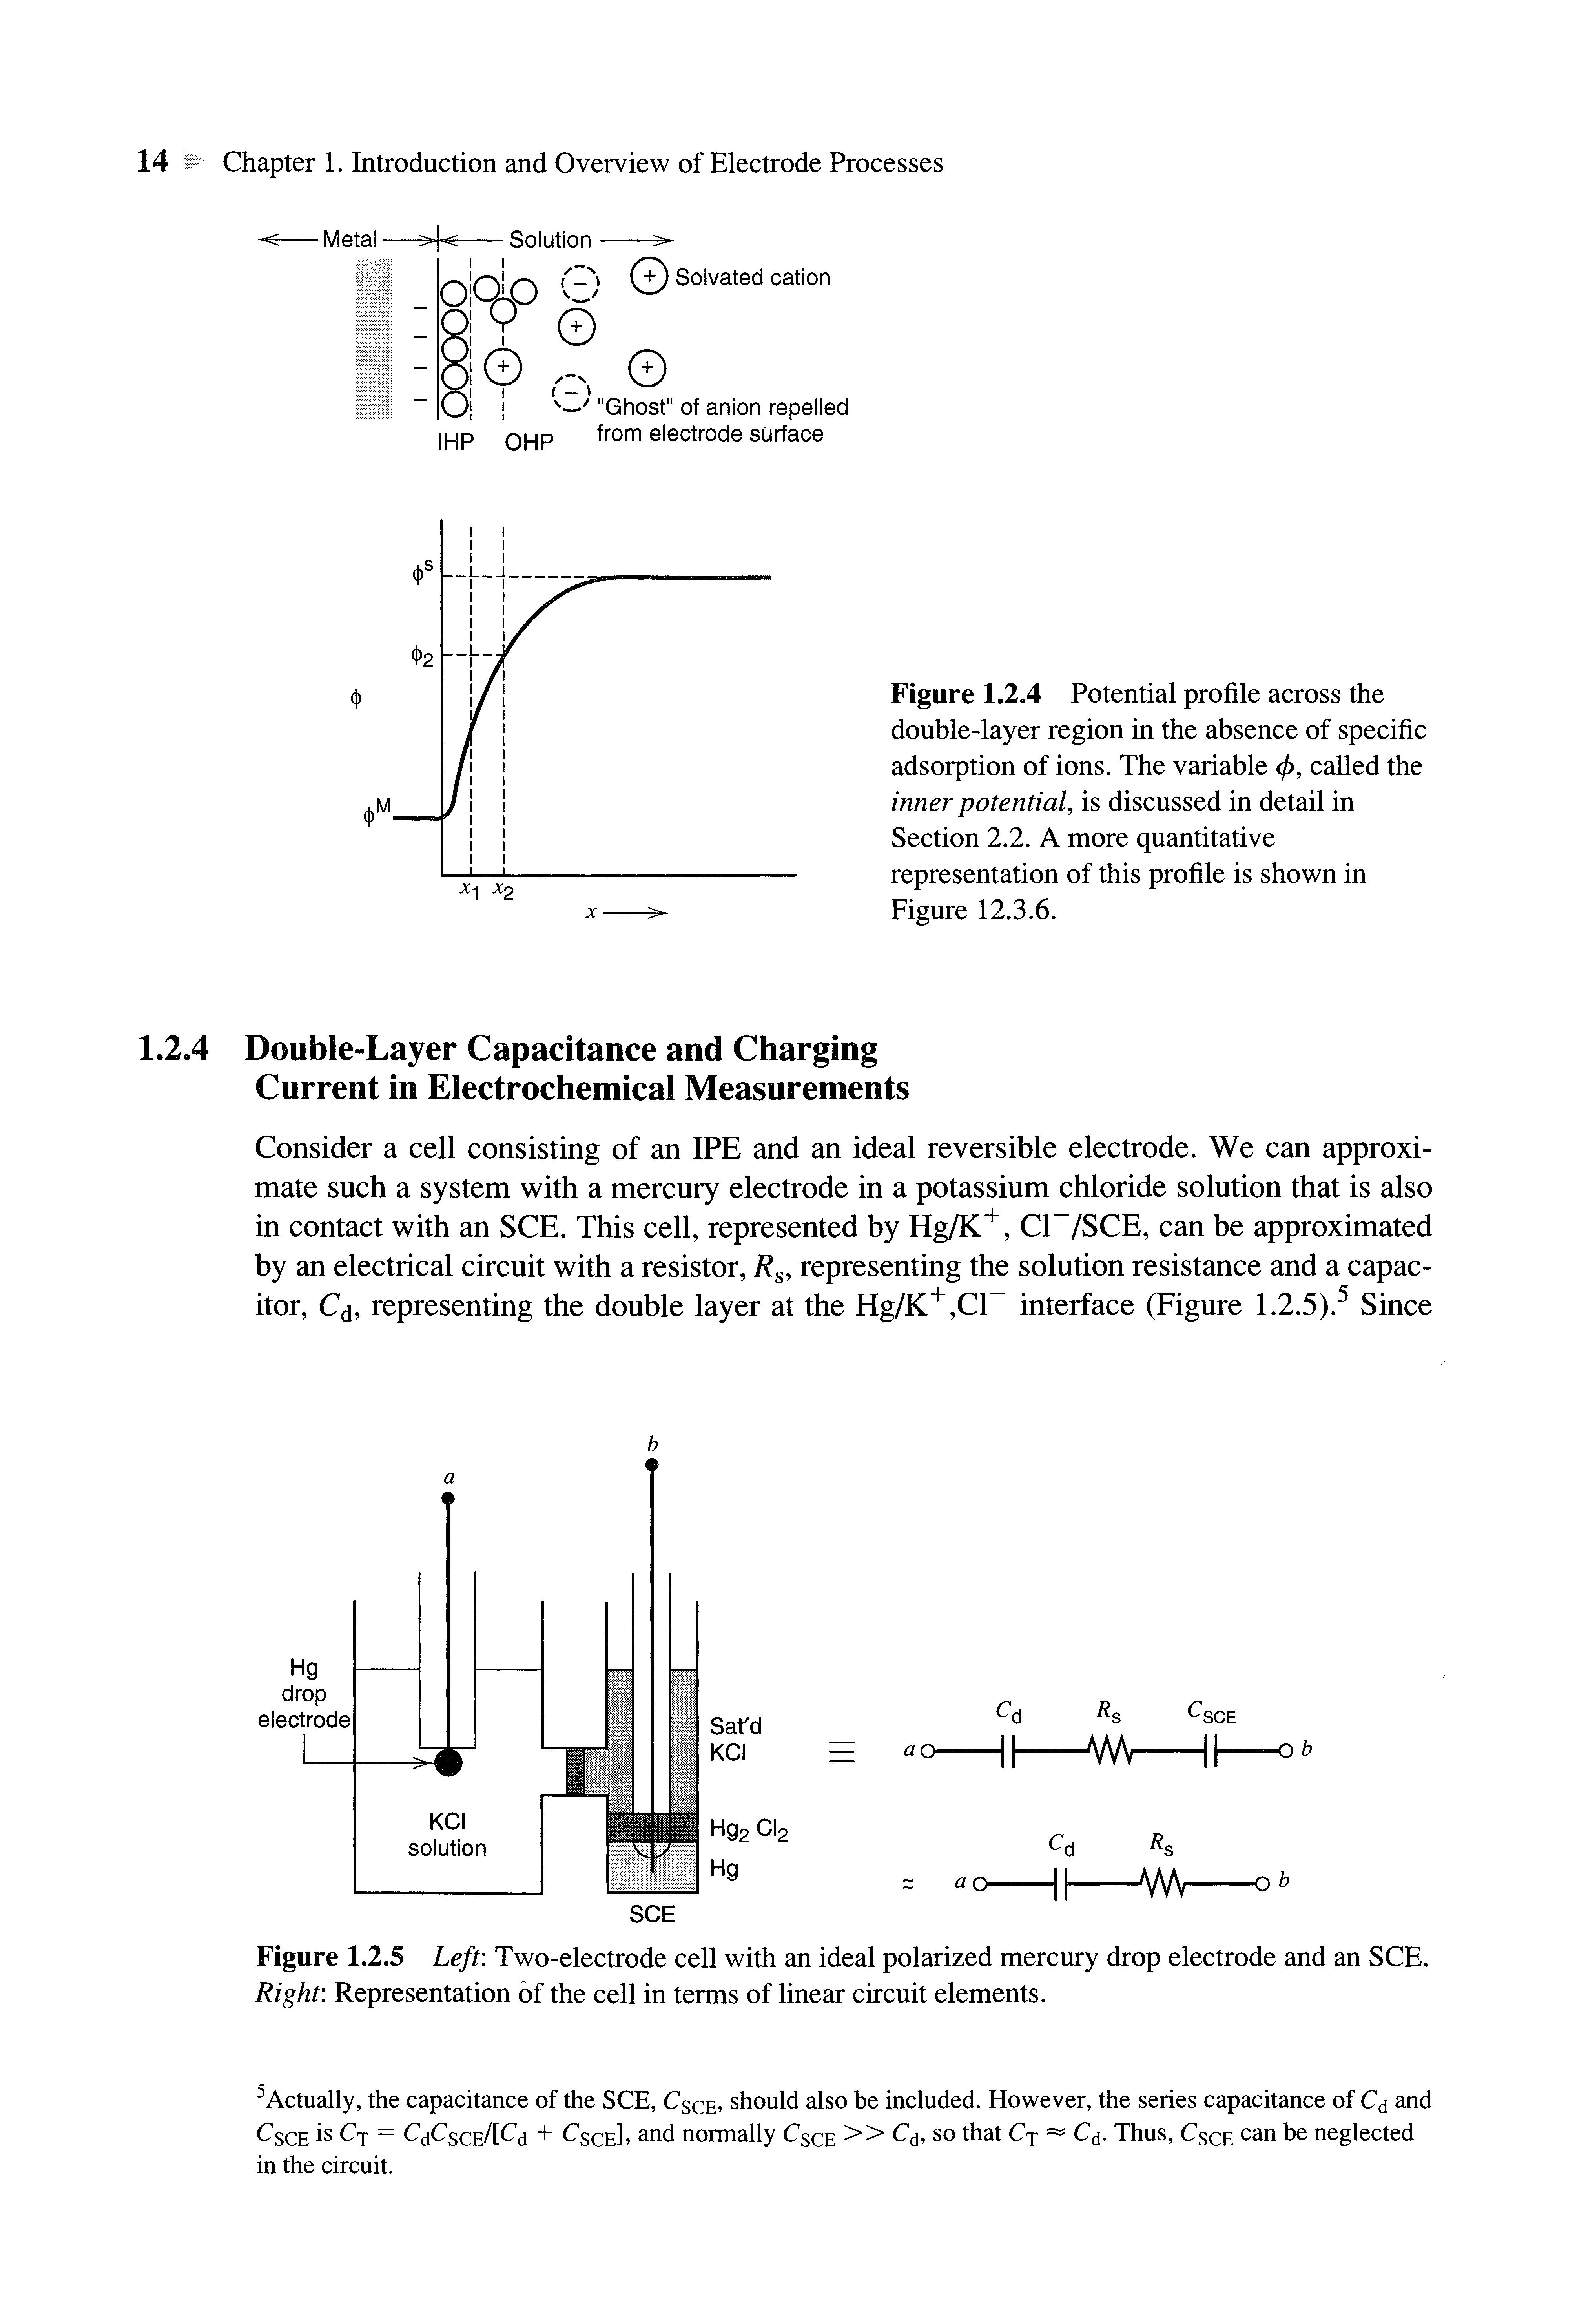
The structureof the doublelayer can affect therates of electrodeprocesses Consider an electroactive species that is not specifically adsorbed This species can approachthe electrode only to the OHP,and the total potential it experiences is less than the potential between theelectrodeandthe solutionby an amount ф2 —</>s,which is thepotentialdrop across the diffuse layer Forexample,in 0.1 M NaF, ф2 — <£s is —0.021 V at E = -0.55 V vs. SCE, but it has somewhat larger magnitudes at more negative and more positive potentials Sometimes one can neglect double-layer effects in considering electrode reaction kinetics At other times they must be taken into account The importance of adsorption and double-layer structure is considered in greater detail in Chapter 13
One usually cannot neglect the existence of the double-layer capacitance or the presence of a charging current in electrochemical experiments. Indeed, during electrode reactions involving very low concentrations of electroactive species, the charging current can be much larger than the faradaic current for the reduction or oxidation reaction. For this reason, we will briefly examine the nature of the charging current at an IPE for several types of electrochemical experiments.
Processes -Metal—> Ц Solution >'INi (+)Solvated cation
)\ j ч ' "Ghost" ofanion repelled from electrode surface
Figure 1.2.4 Potential profile across the double-layer region intheabsence of specific adsorption of ions. Thevariable ф, calledthe inner potential, is discussed indetailin Section 2.2 A more quantitative representation of this profile is shown in Figure 12.3.6
1.2.4
Double-LayerCapacitanceand Charging Current inElectrochemical Measurements
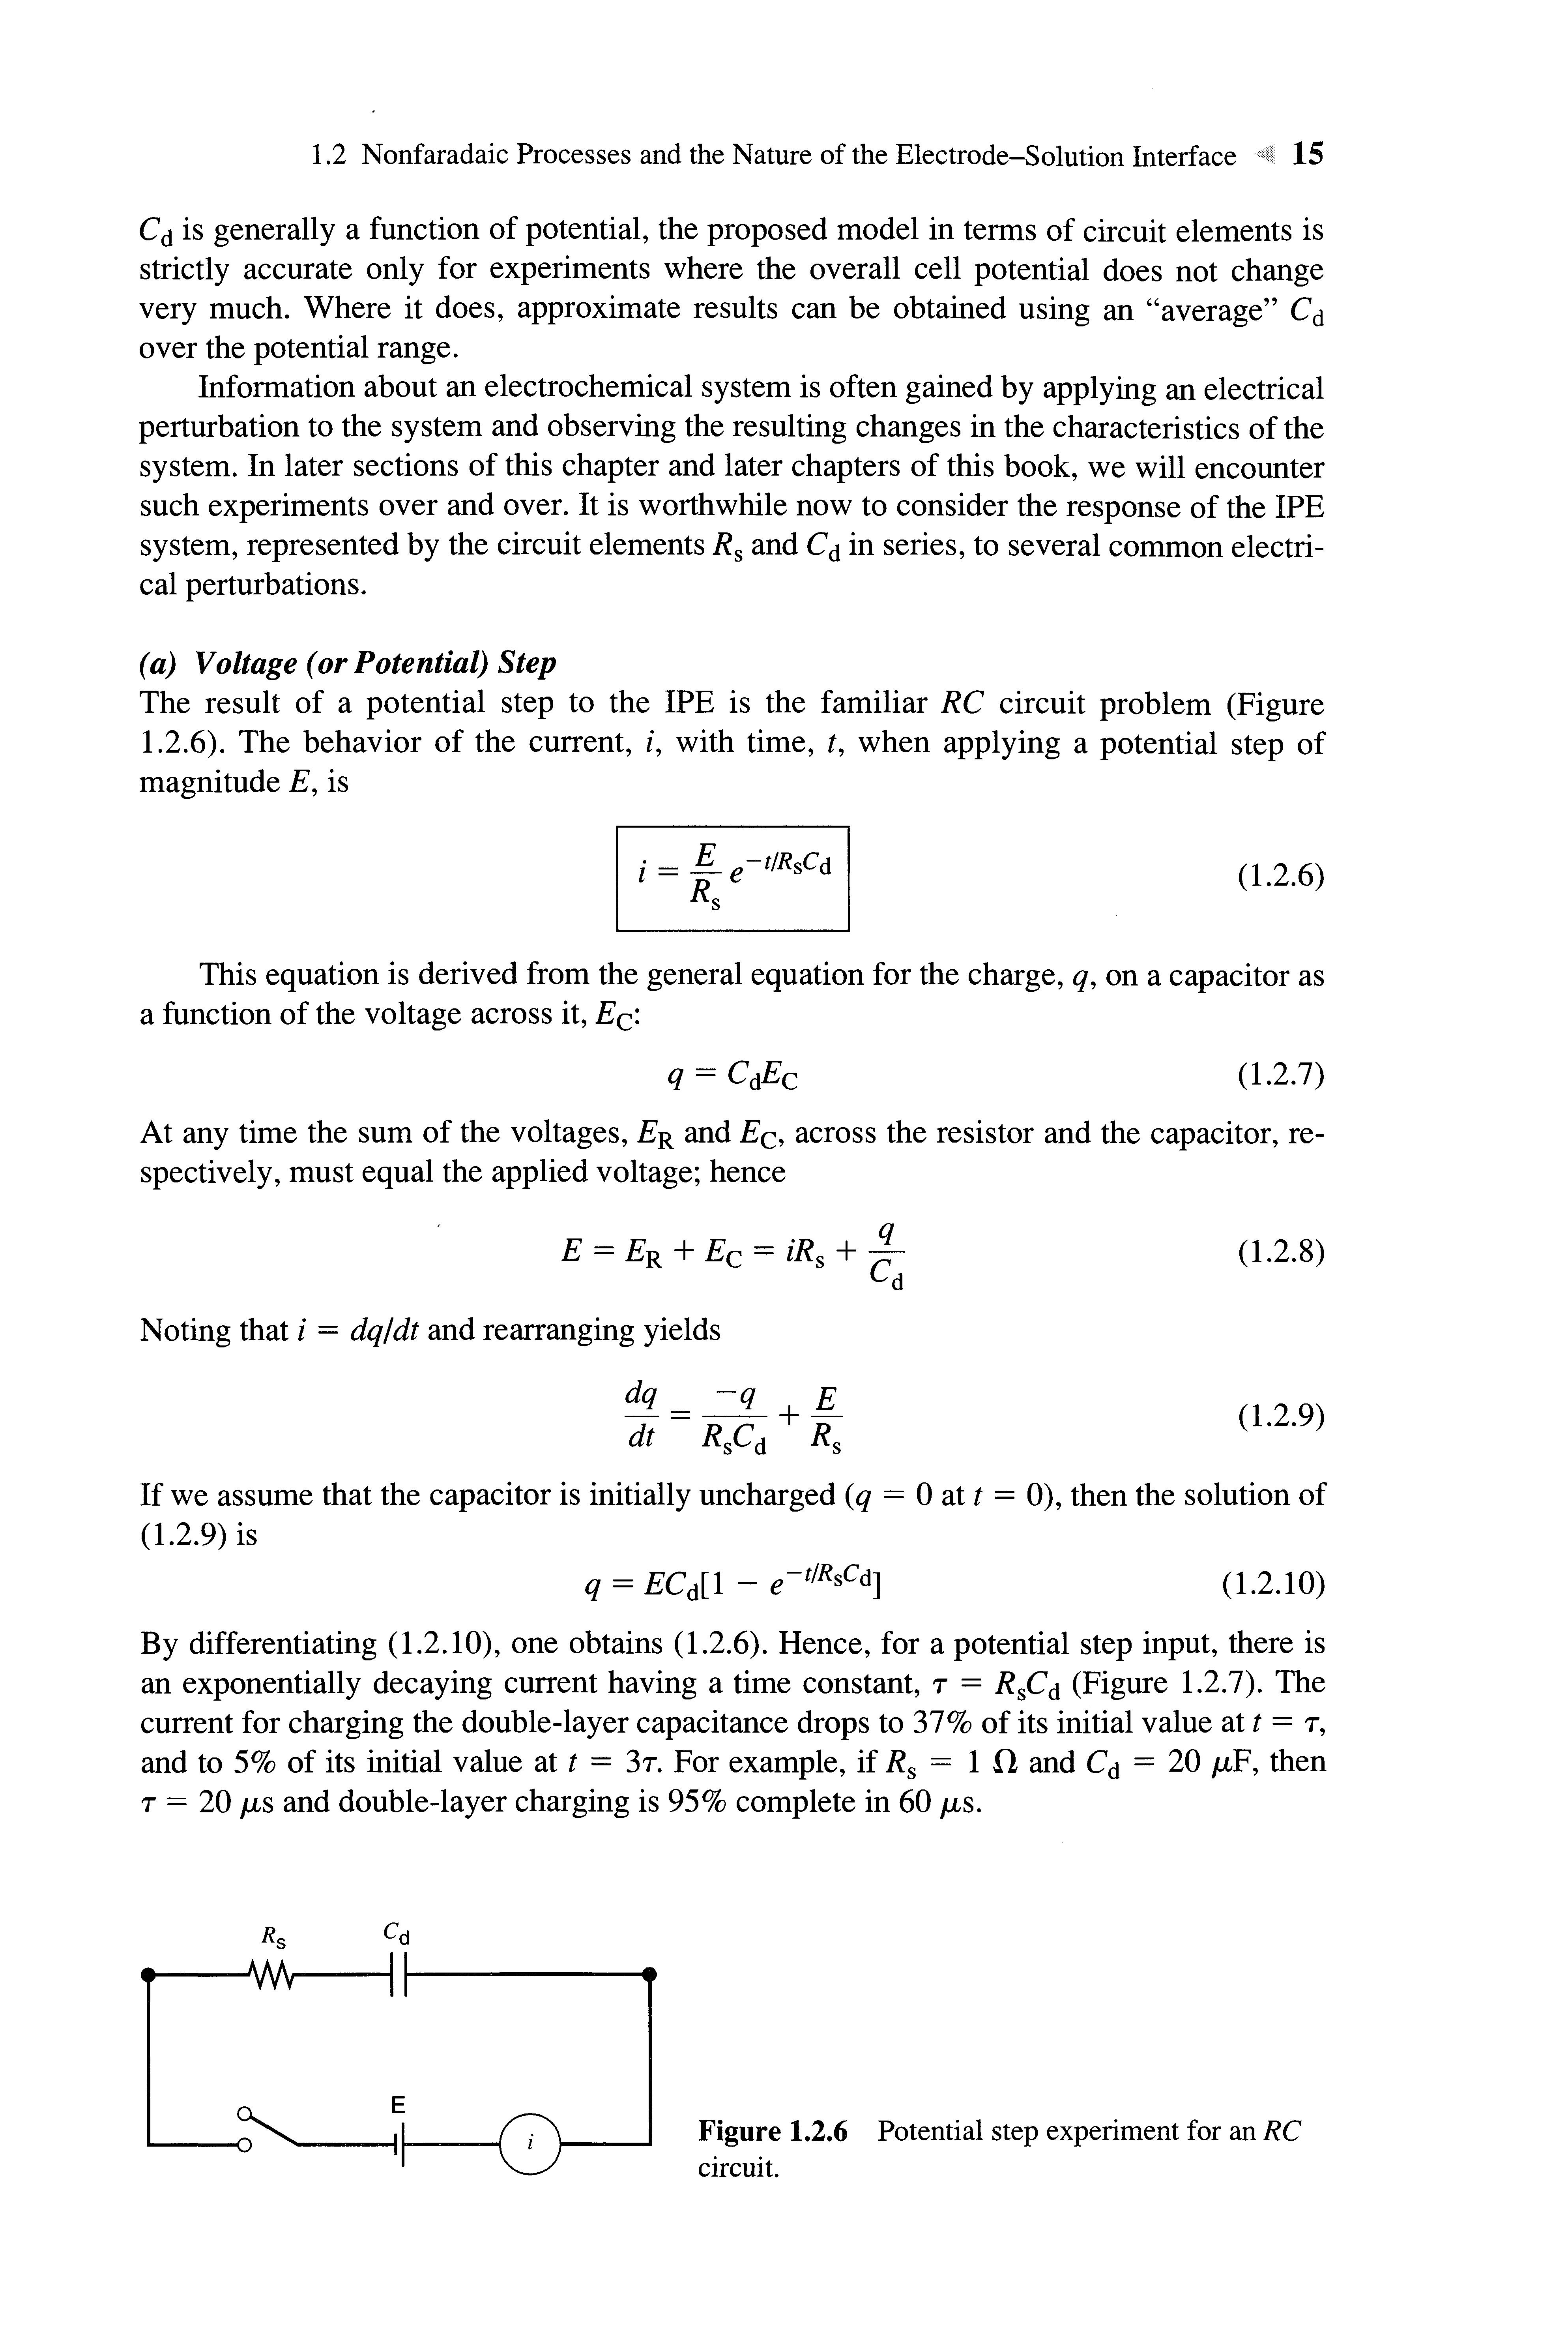
Consider a cell consisting of an IPE and an ideal reversible electrode. We can approximate such a system with a mercury electrode in a potassium chloride solution that is also in contact with an SCE This cell, represented by Hg/K+ , CF/SCE, can be approximated by an electrical circuit with a resistor, R s, representing the solution resistance and a capacitor, C(j, representing the double layer at the Hg/K+,C1~ interface (Figure 1.2.5).5 Since
drop electrode
Figure 1.2.5 Left: Two-electrode cell with anideal polarized mercury drop electrode andanSCE Right: Representation of the cell interms of linear circuit elements
Actually, thecapacitance ofthe SCE, С$СЕ, should also be included However, theseries capacitance ofCd and CSCE isCT = CdCSCEJ[Cd +CSCEL andnormally C SC E » Q>sothat C T « Cd Thus, C SC E canbe neglected in thecircuit
Cd is generally a function of potential, the proposed model in terms of circuit elements is strictly accurate only for experiments where the overall cell potential does not change very much Where it does, approximate results can be obtained using an "average" Cd over the potential range
Information about an electrochemical system is often gained by applying an electrical perturbation to the system and observing the resulting changes in the characteristics of the system In later sections of this chapter and later chapters of this book, we will encounter such experiments over and over It is worthwhile now to consider the response of the IPE system, represented by the circuit elements Rs and Q in series, to several common electrical perturbations.
(a)
Voltage (or Potential) Step
The result of a potential step to the IPE is the familiar RC circuit problem (Figure 1.2.6). The behavior of the current, /, with time, t, when applying a potential step of magnitude E, is
This equation is derived from the general equation for the charge, q, on a capacitor as a function of the voltage across it, EQ\
At any time the sum of the voltages, £Rand EQ, across the resistor and the capacitor, respectively, must equal the applied voltage; hence
E = Er = iR* + 4-
Noting that / = dq/dt and rearranging yields
dq -q (1.2.8) (1.2.9)
dt RsCd Rs
If we assume that the capacitor is initially uncharged (q = 0 at t = 0), then the solution of (1.2.9) is (1.2.10) q = ECd[l - e~ t/R s Cd]
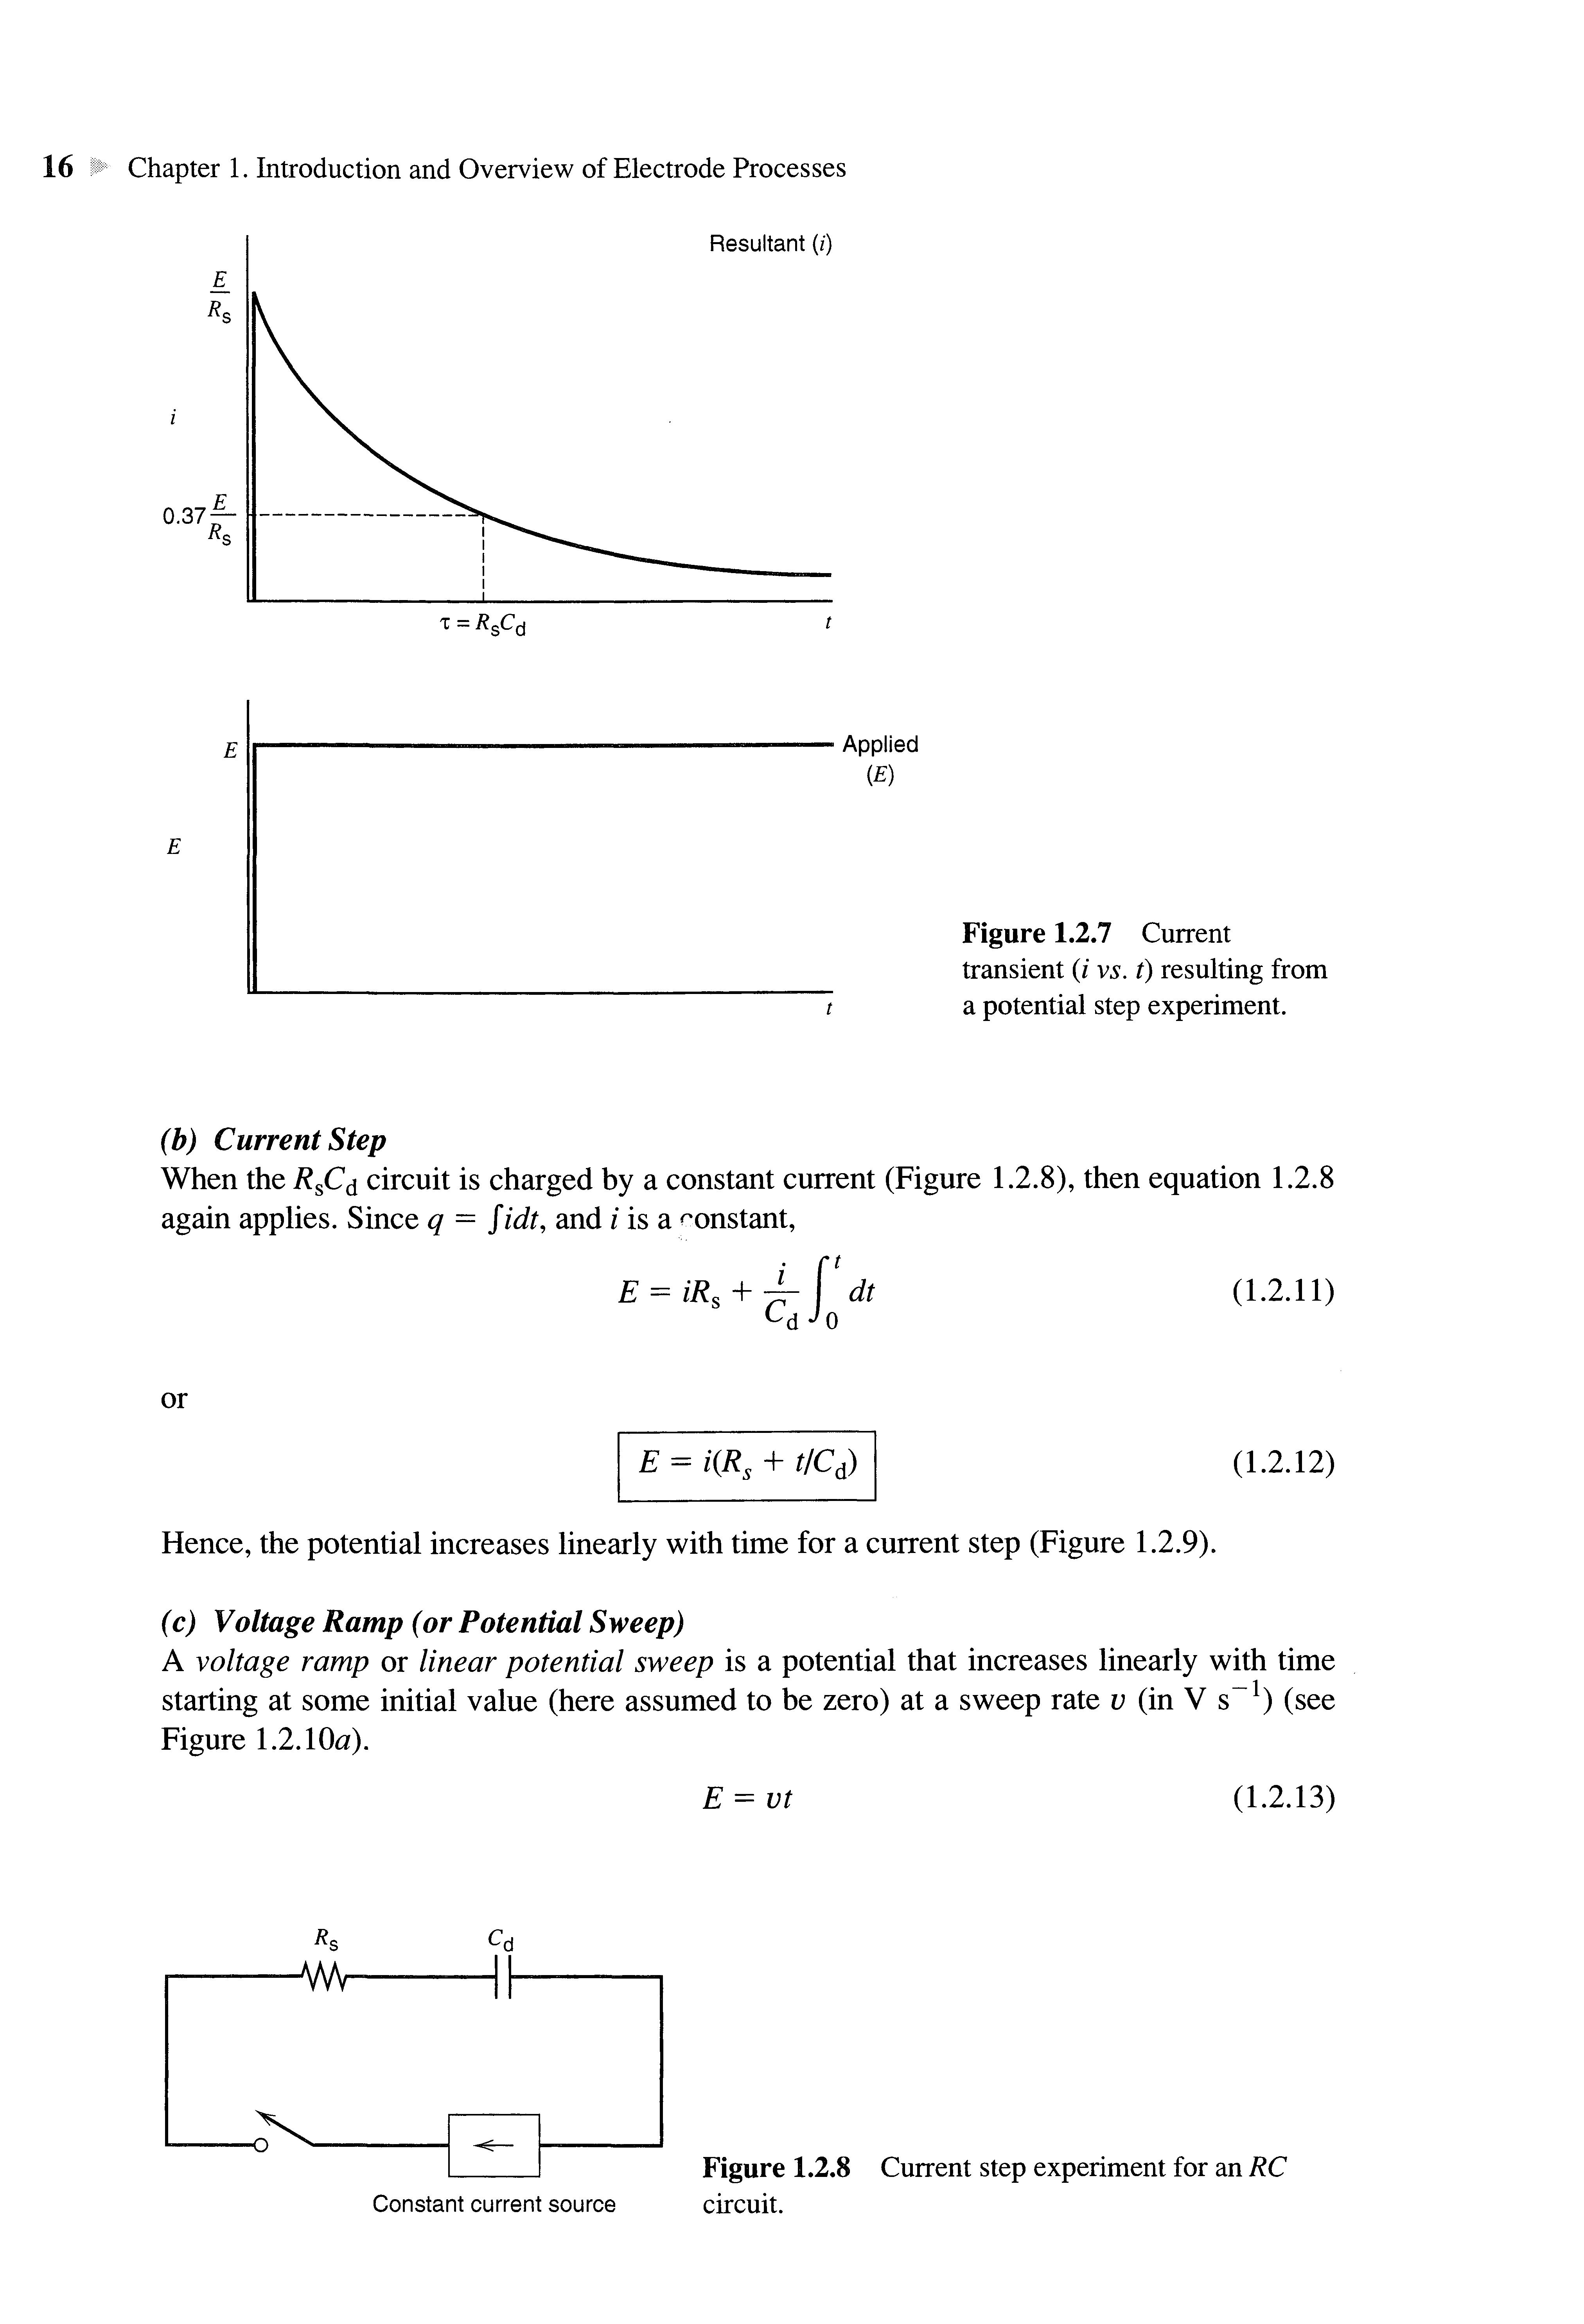
By differentiating (1.2.10), one obtains (1.2.6). Hence, for a potential step input, there is an exponentially decaying current having a time constant, т = R s Cd (Figure 1.2.7). The current for charging thedouble-layercapacitance drops to 37% of its initial value at t = т, and to 5% of its initial value at t = 3r. Forexample, if R s = 1 ft and Cd = 20 fxF, then т = 20 /JLS anddouble-layercharging is 95%complete in 60/xs.
Figure 1.2.6 circuit
Potential step experiment for an RC
Resultant (/)
• Applied (E)
Figure 1.2.7 Current transient (/vs. t) resulting from a potential step experiment
(b) Current Step
When the R s Cd circuit is charged by a constant current (Figure 1.2.8), then equation 1.2.8 again applies. Since q = Jidt, and /is aconstant,
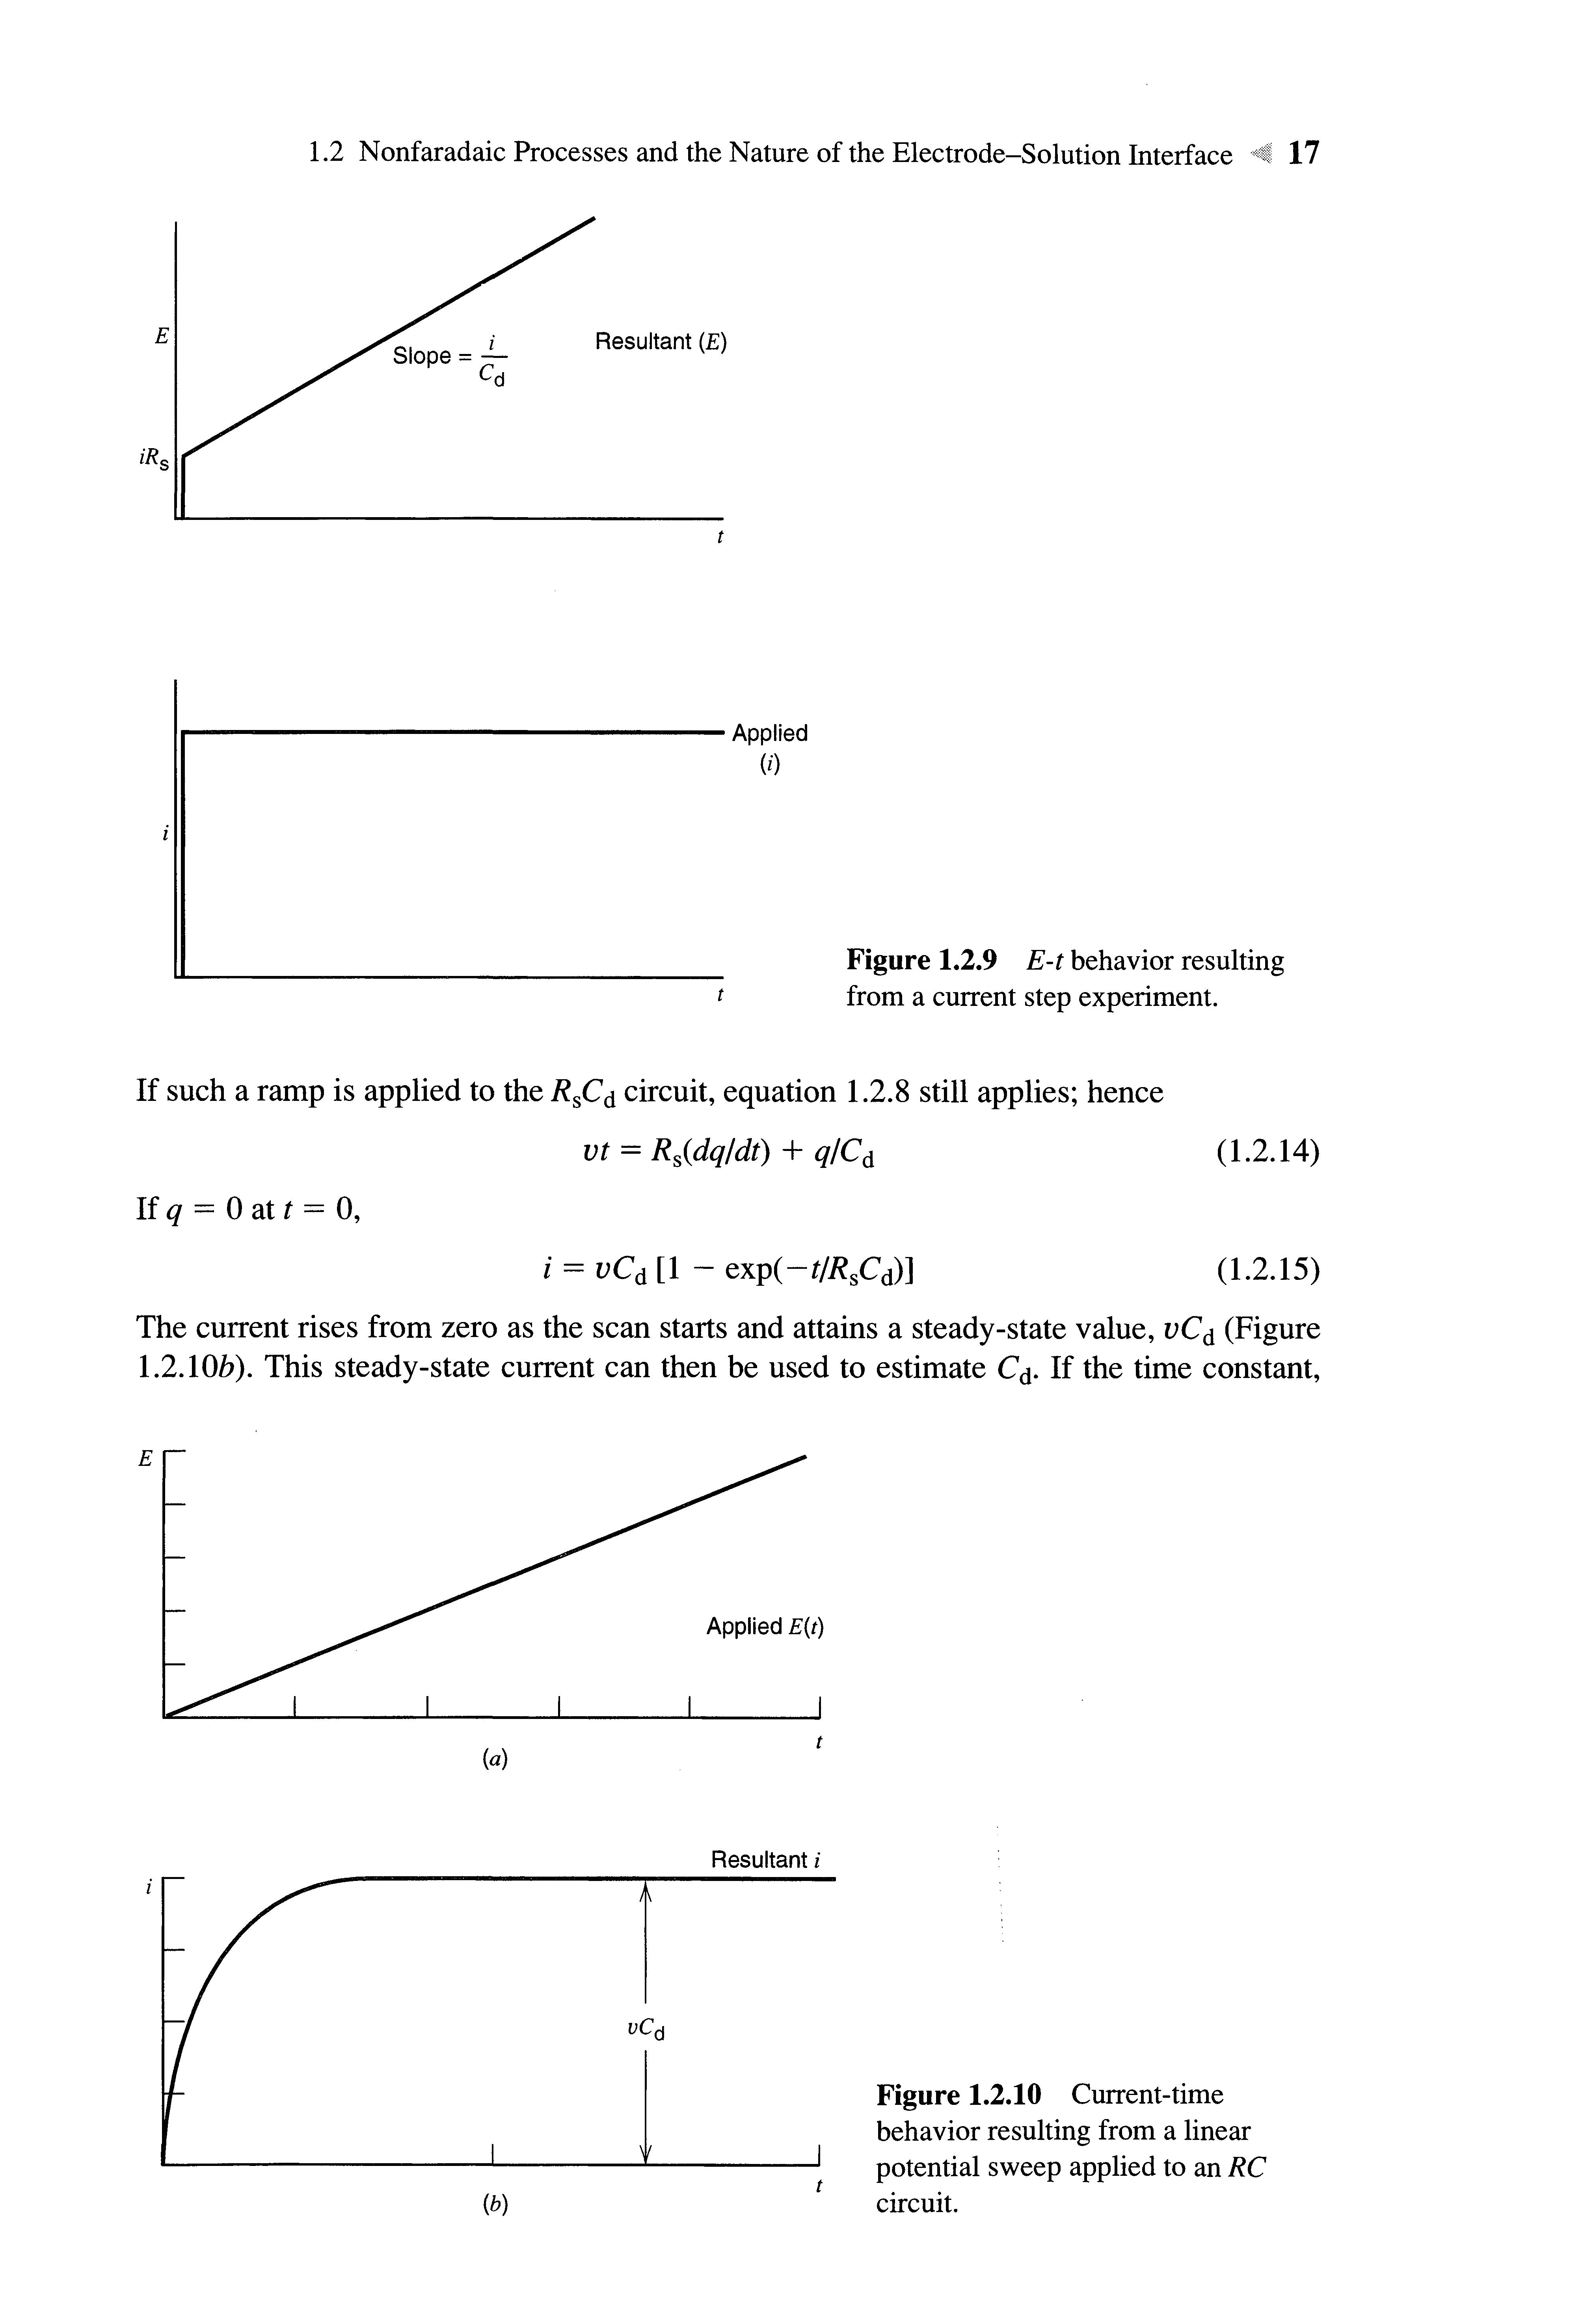
Hence, the potential increases linearly with time for a current step (Figure 1.2.9).
(c) Voltage Ramp (or Potential Sweep)
A voltage ramp or linear potential sweep is a potential that increases linearly with time starting at some initial value (here assumed to be zero) at a sweep rate и (in V s"1) (see Figure 1.2.10a)
Figure
-Slope= i- Resultants
• Applied (0
Figure 1.2.9 E-t behavior resulting t from a current step experiment
If such a ramp is applied to the RSC^ circuit, equation 1.2.8 still applies; hence vt = Rs(dq/dt) + q/Cd (1.2.14)
lfq = OaU = 0, (1.2.15)
The current rises from zero as the scan starts and attains a steady-state value, vCd (Figure 1.2.10b) This steady-state current can then be used to estimate Cd If the time constant,
Figure 1.2.10 Current-time behavior resulting from a linear potential sweep applied to an RC circuit