No part of this publication may be reproduced, stored in a retrieval system or transmitted in any form or by any means, electronic, mechanical, photocopying, recording, scanning or otherwise, except as permitted under Sections 107 or 108 of the 1976 United States Copyright Act, without the prior written permission of the Publisher. Requests to the Publisher for permission should be addressed to the Permissions Department, John Wiley & Sons, Inc., 111 River Street, Hoboken, NJ 07030, (201) 748-6011, fax (201) 748-6008, or online at http://www.wiley.com/go/permissions
Trademarks: Wiley, For Dummies, the Dummies Man logo, Dummies.com, Making Everything Easier, and related trade dress are trademarks or registered trademarks of John Wiley & Sons, Inc. and may not be used without written permission. Microsoft and Power BI are trademarks or registered trademarks of Microsoft Corporation. All other trademarks are the property of their respective owners. John Wiley & Sons, Inc. is not associated with any product or vendor mentioned in this book.
LIMIT OF LIABILITY/DISCLAIMER OF WARRANTY: WHILE THE PUBLISHER AND AUTHORS HAVE USED THEIR BEST EFFORTS IN PREPARING THIS WORK, THEY MAKE NO REPRESENTATIONS OR WARRANTIES WITH RESPECT TO THE ACCURACY OR COMPLETENESS OF THE CONTENTS OF THIS WORK AND SPECIFICALLY DISCLAIM ALL WARRANTIES, INCLUDING WITHOUT LIMITATION ANY IMPLIED WARRANTIES OF MERCHANTABILITY OR FITNESS FOR A PARTICULAR PURPOSE. NO WARRANTY MAY BE CREATED OR EXTENDED BY SALES REPRESENTATIVES, WRITTEN SALES MATERIALS OR PROMOTIONAL STATEMENTS FOR THIS WORK. THE FACT THAT AN ORGANIZATION, WEBSITE, OR PRODUCT IS REFERRED TO IN THIS WORK AS A CITATION AND/OR POTENTIAL SOURCE OF FURTHER INFORMATION DOES NOT MEAN THAT THE PUBLISHER AND AUTHORS ENDORSE THE INFORMATION OR SERVICES THE ORGANIZATION, WEBSITE, OR PRODUCT MAY PROVIDE OR RECOMMENDATIONS IT MAY MAKE. THIS WORK IS SOLD WITH THE UNDERSTANDING THAT THE PUBLISHER IS NOT ENGAGED IN RENDERING PROFESSIONAL SERVICES. THE ADVICE AND STRATEGIES CONTAINED HEREIN MAY NOT BE SUITABLE FOR YOUR SITUATION. YOU SHOULD CONSULT WITH A SPECIALIST WHERE APPROPRIATE. FURTHER, READERS SHOULD BE AWARE THAT WEBSITES LISTED IN THIS WORK MAY HAVE CHANGED OR DISAPPEARED BETWEEN WHEN THIS WORK WAS WRITTEN AND WHEN IT IS READ. NEITHER THE PUBLISHER NOR AUTHORS SHALL BE LIABLE FOR ANY LOSS OF PROFIT OR ANY OTHER COMMERCIAL DAMAGES, INCLUDING BUT NOT LIMITED TO SPECIAL, INCIDENTAL, CONSEQUENTIAL, OR OTHER DAMAGES.
For general information on our other products and services, please contact our Customer Care Department within the U.S. at 877-762-2974, outside the U.S. at 317-572-3993, or fax 317-572-4002. For technical support, please visit https://hub.wiley.com/community/support/dummies.
Wiley publishes in a variety of print and electronic formats and by print-on-demand. Some material included with standard print versions of this book may not be included in e-books or in print-on-demand. If this book refers to media such as a CD or DVD that is not included in the version you purchased, you may download this material at http://booksupport.wiley.com. For more information about Wiley products, visit www.wiley.com
Data is everywhere — no matter where you go, and no matter what you do, someone is gathering data around you. The tools and techniques utilized to evaluate data have undoubtedly matured over the past decade or two. Less than a decade ago, for example, the lowly spreadsheet was considered an adequate tool to collect, measure, and calculate results — even for somewhat complex datasets. Not anymore! The modern organization accumulates data at such a rapid pace that more sophisticated approaches beyond spreadsheets have become the new normal. Some might even call the spreadsheet a dinosaur.
Welcome to the generation of business intelligence. And what does business intelligence require, you ask? Consider querying data sources, reporting, caching data, and visualizing data as being just the tip of the iceberg. Ask yourself this question: If you had to address your organization’s needs, what would they be? Would taking structured, unstructured, and semistructured data and making sense of it be part of your organizational requirements? Perhaps developing robust business analytics outputs for executive consumption? Or, is the mandate from the leadership the delivery of complex reports, visualizations, dashboards, and key performance indicators? If you’re shaking your head right now and whispering all the above, you are not alone.
This is what enterprises today, large and small, expect. And with Microsoft Power BI, part of the Power Platform, you can deliver a highly sophisticated level of business intelligence to your organization, accomplishing each of these business objectives with little effort.
Power BI was initially conceived as part of the SQL Server Reporting Team back in 2010. Then, Power BI made its way into the Office 365 suite in September 2013 as an advanced analytics product. Power BI was built around Microsoft Excel core add-ins: Power Query, Power Pivot, and Power View. Along the way, Microsoft added a few artificial intelligence features, such as the Q&A Engine, enterpriselevel data connectors, and security options via the Power BI Gateway. The product became so popular with the enterprise business community that, in July of 2015, Power BI was separated from the Office family, becoming its own product line. Finally, in late 2019, Power BI merged with other Microsoft products to form the Power Platform family, which consists of Power Apps (mobile), Power Automate (workflow), and Power BI (business intelligence).
Whether you’re using Power BI as a stand-alone application to turn your data sources into interactive insights or integrating Power BI with applications such as Power Apps, SharePoint, or Dynamics 365, Power BI allows users to visualize and discover what is truly essential in their vast data resources. Users can share data at scale with ease. Depending on your role, you can create, view, or share data using the Power BI Desktop, the cloud-based Service, or the mobile app. The Power BI platform is designed to let users create, share, and consume business insights that effectively serve you and your team.
About This Book
This book is intended for anyone interested in business analytics, focusing as it does on the general platform capabilities across the Power BI platform. It doesn’t matter whether you’re a novice or a power user — you’ll definitely benefit from reading this book. I’m thinking especially of the following business roles:
» Business analyst: As a business analyst, you’re tasked with many responsibilities. Maybe you’re the requirements-gathering expert, the configuration guru, the designer, or even the quasi-developer. This book can be used as a resource for many of the critical tasks you may encounter in the field.
» Data professional: Data is complex — make no mistake about it. This book doesn’t help you tackle the formulas behind the scenes or tell you how to construct and programmatically code many sophisticated reports, dashboards, visuals, and KPIs. It does, however, help you understand the foundational activities across the Power BI platform if this is your first foray into using Microsoft’s business intelligence (BI) platform. You’ll be able to quickly ingest data, conduct data analysis, and build relatively sophisticated reports after reading this book.
» Developer: This book isn’t specifically for you, but you can find plenty of tips, tricks, and techniques you can learn throughout the book. Power BI is a collection of products that require users to understand several fundamental programming languages, including DAX and SQL. In this book, you can see that the surface is scratched ever so slightly in covering these topics. Take a look at the chapters on DAX in Part 4 if you want an introduction or a refresher.
» IT professional: Whether you’re a cloud expert, systems engineer, or database professional or you fill another IT role, this book doesn’t provide you with all the technical answers you’re looking for. Instead, this is a starting point if you want to take a leap into the world of Microsoft enterprise business intelligence.
» Manager or executive: Often, the deliverables created in Power BI are built for managers and executives. Power BI has over 70 data connectors available for data extractions, report development, visualization support, and dashboard creation. Under your guidance, these deliverables are created by analysts, developers, and data professionals. Therefore, reading Microsoft Power BI For Dummies may help you better understand the art of the possible.
Foolish Assumptions
Power BI is a pretty big application, as you can probably already tell. Microsoft assumes that its interfaces are relatively simple for users to create reports and dashboards. Here’s the truth: Some users find that it can be overwhelming, depending on which product you’re using. Admittedly, lots of bells and whistles appear across each platform. As the author, I’ve written the book for users wanting to learn about those critical features across the three Power BI platforms: Desktop, Services, and Mobile. This book isn’t intended to be a crash course for certification or a deep dive into administration or coding for Power BI. You can find specific books on the market for these purposes.
Throughout this book, though, I point you directly to the Microsoft Power BI website, when appropriate, where you can find resources to dig a bit deeper from time to time, on technical capabilities you may need to know about.
Because Power BI is made up of many components, I’ve made some assumptions about your configuration for this book as you follow along on the journey:
» You have downloaded a copy of the Power BI Desktop. Some things in life are free, and this is one of them. Microsoft actually provides the Desktop client to its users for free! The Desktop client is intended to build the enduser data models, reports, and dashboards for personal consumption. That’s where it ends, though. You do need an online account to share and collaborate. About half the steps lists in this book can be completed using the Desktop client.
» You have at least signed up for a Power BI Free Services account, but preferably have a Power BI Pro account. If you want to share and collaborate with others, you need a Pro account. Otherwise, the Free online account will do for now. The purpose of the online companion is to distribute your outputs in read-only format, if you want. Suppose that you want others to edit and manipulate the data. In that case, there’s no getting around paying for the Pro or Premium per User version. Also, the larger your dataset, the more likely you will want the upgrade.
» You have access to the Internet: This may sound a bit obvious. Even with the Desktop client, an Internet connection is required in order to access datasets from the Internet.
» You have a meaningful dataset: What does meaningful mean? I’ve created a sample dataset that can be downloaded for you from www.dummies.com to follow throughout the book. However, suppose that you want to use your own data. In that case, a meaningful dataset includes at least 300 to 400 records containing a minimum of five or six columns’ worth of data.
Icons Used in This Book
Throughout Microsoft Power BI For Dummies, you see some icons along the way. Here’s what they mean:
Tips point out shortcuts or essential suggestions on doing things quicker, faster, and more efficiently in Power BI.
If you see the Remember icon, pay particular attention because these gotchas can make Power BI a bit difficult to understand. Don’t worry, though — I’ll help you find a workaround.
Technical Stuff is a way for you to consider exploring the inner workings of Power BI and perhaps how it integrates with other applications a bit more. That means there may be a configuration to a data source that has a nuance or an advanced reporting feature that may help shape your data a smidgen. These items are here to help you on a case-by-case basis.
This icon points to useful content available to you out there on the World Wide Web.
Do not take warnings as a sign of panic. They appear once in a while, though, to make you aware of a common issue or product challenge many users face. Again, do not fret!
Beyond the Book
In addition to the content you’re reading in this book, you have access to a free Power BI Cheat Sheet that can give you a hand when it comes to creating compelling dashboards, valuable reports, and structured DAX code. You also have access to a complete dataset that can be imported into your instance of Power BI Desktop or Services. The dataset is helpful because it can be used across all exercises throughout the book. To find the Cheat Sheet, go to www.dummies.com and enter Power BI For Dummies in the Search box. For the dataset I’ve prepared for you, go to www.dummies.com/go/mspowerbifd
1 Put Your BI Thinking Caps On
IN THIS PART . . .
Get introduced to the types of data used in enterprise BI solutions.
Identify the roles, responsibilities, and products produced by BI professionals.
Discover the licensing options and core features available with Power BI.
IN THIS CHAPTER
» Figuring out the different types of data Power BI can handle
» Understanding your options for business intelligence tooling
» Familiarizing yourself with Power BI terminology
A Crash Course in Data Analytics Terms: Power BI Style
Data is everywhere — literally. From the moment you awaken until the time you sleep, some system somewhere collects data on your behalf. Even as you sleep, data is being generated that correlates to some aspect of your life. What is done with this data is often the proverbial 64-million-dollar question. Does the data make sense? Does it have any sort of structure? Is the dataset so voluminous that finding what you’re looking for is like finding a needle in a haystack? Or is it more like you can’t even find what you need unless you have a special tool to help you navigate?
I’d answer that last question with an emphatic yes, and that’s where data analytics and business intelligence join the party. And let’s be honest: The party can be overwhelming if data is consistently generating something on your behalf.
Dealing with data isn’t always a chore — data can be fun to explore as well. Sometimes it’s easy to figure out precisely what is needed to solve a problem, but at other times you need to put on your Sherlock Holmes deerstalker cap. Why? Because the data you’re working with may lack structure and meaning. Of course, you’re bound to take up tools to help you play the role of detective, evaluator, designer, and curator.
In this chapter, I discuss the different types of data you may encounter along your journey. I review the key terminology that you should become familiar with upfront. Don’t worry: It’s not like you need to memorize a dictionary. You learn a few key concepts to give you a head start in Power BI and business intelligence. Are you ready to go?
What Is Data, Really?
Ask a hundred people in a room what the definition of data is and you may receive one hundred different answers. Why is that? Because, in the world of business, data means a lot of different things to a lot of different people. So, let’s try to get a streamlined response. Data contains facts. Sometimes, the facts make sense; sometimes, they’re meaningless unless you add a bit of context.
The facts can sometimes be quantities, characters, symbols, or a combination of sorts that come together when collecting information. The information allows people — and more importantly, businesses — to make sense of the facts that, unless brought together, make absolutely no sense whatsoever.
When you have an information system full of business data, you also must have a set of unique data identifiers you can use so that, when searched, it’s easy to make sense of the data in the form of a transaction. Examples of transactions might include the number of jobs completed, inquiries processed, income received, and expenses incurred.
The list can go on and on. To gain insight into business interactions and conduct analyses, your information system must have relevant and timely data that is of the highest quality.
Data isn’t the same as information. Data is the raw facts. That means you should think of data in terms of the individual fields or columns of data you may find in a relational database or perhaps the loose document (tagged with some descriptors called metadata) stored in a document repository. On their own, these items are unlikely to make much sense to you or to a business. And that’s perfectly okay — sometimes. Information is the collective body of all those data parts, that results in the factoids making logical sense.
Working with structured data
Have you ever opened a database or spreadsheet and noticed that data is bound to specific columns or rows? For example, would you ever find a United States zip
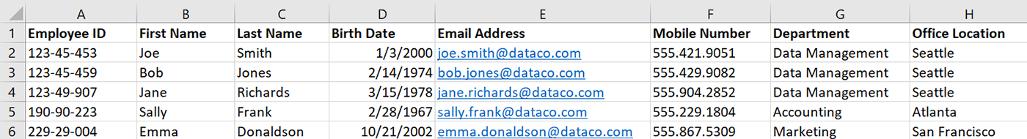
FIGURE 1-1:
An example of structured data.
code containing letters of the alphabet? Or, perhaps when you think of a first name, middle initial, and last name, you notice that you always find letters in those specific fields. Another example is when you’re limited to the number of characters you can input into a field. Think of Y as Yes; N is for No. Anything else is irrelevant.
What I’m describing here is called structured data. When you evaluate structured data, you notice that it conforms to a tabular format, meaning that each column and row must maintain an interrelationship. Because each column has a representative name that adheres to a predefined data model, your ability to analyze the data should be straightforward.
If you’re using Power BI, you notice that structured data conform to a formal specification of tables with rows and columns, commonly referred to as a data schema. In Figure 1-1, you find an example of structured data as it appears in a Microsoft Excel spreadsheet.
Whether you’re using Power BI for personal analysis, educational purposes, or business support, the most accessible data sources for BI tools are structured. Platforms that offer robust structured data options would include Microsoft SQL Server, Microsoft Azure SQL Server, Microsoft Access, Azure Table Storage, Oracle, IBM DB2, MySQL, PostgreSQL, Microsoft Excel, and Google Sheets.
Looking at unstructured data
Unstructured data is ambiguous, having no rhyme, reason, or consistency whatsoever. Pretend that you’re looking at a batch of photos or videos. Are there explicit data points that one can associate with a video or photo? Perhaps, because the file itself may consist of a structure and be made of some metadata. However, the byproduct itself — the represented depiction — is unique. The data isn’t replicable; therefore, it’s unstructured. That’s why any video, audio, photo, or text file is considered unstructured data.
Adding semistructured data to the mix
Semistructured data does have some formality, but it isn’t stored in a relational system and it has no set format. Fields containing the data are by no means neatly
organized into strategically placed tables, rows, or columns. Instead, semistructured data contains tags that make the data easier to organize in some form of hierarchy. Nonrelational data systems or NoSQL databases are best associated with semistructured data, where the programmatic code, often serialized, is driven by the technical requirements. There is no hard-and-fast coding practice.
For the business intelligence developer utilizing semistructured languages, serialized programming practices can assist in writing sophisticated code. Whether the goal is to write data to a file, send a data snippet to another system, or parse the data to be translatable for structured consumption, semistructured data does have the potential for business intelligence systems. If the serialized language can communicate and speak the same language, a semistructured dataset has great potential.
Looking Under the Power BI Hood
Power BI is a product that brings together many smaller, cloud-based apps and services with a specific objective: to organize, collect, manage, and analyze big datasets. Big data is a concept where the business and data analyst will evaluate extremely large datasets, which may reveal patterns and trends relating to human behaviors and interactions not easily identifiable without the use of specific tools. A typical big data collection is often expressed in millions of records. Unlike a tool such as Microsoft Excel, Power BI can evaluate many data sources and millions of records simultaneously. The sources don’t need to be structured using a spreadsheet, either. They can include unstructured and semistructured data.
After pulling these many data sources together and processing them, Power BI can help you come up with visually compelling outputs in the form of charts, graphics, reports, dashboards, and KPI’s.
As you’ve already read, Power BI isn’t just a single source application. It has desktop, online, and mobile components.
Across the Power BI platforms, you are certain at some point to encounter one (or more) of the following products:
» Power Query: A data connection tool you can use to transform, combine, and enhance data across several data sources