Koji Koyamada
Kyoto University, Japan
Published by
World Scientific Publishing Co. Pte. Ltd.
5 Toh Tuck Link, Singapore 596224
USA office: 27 Warren Street, Suite 401-402, Hackensack, NJ 07601
UK office: 57 Shelton Street, Covent Garden, London WC2H 9HE
Library of Congress Cataloging-in-Publication Data
Names: Koyamada, Kōji, author.
Title: Analysis and visualization of discrete data using neural networks / Koji Koyamada.
Description: New Jersey : World Scientific, [2024] | Includes bibliographical references.
Identifiers: LCCN 2023038211 | ISBN 9789811283611 (hardcover) | ISBN 9789811283628 (ebook for institutions) | ISBN 9789811283635 (ebook for individuals)
Subjects: LCSH: Data mining. | Information visualization--Data processing. | Neural networks (Computer science)
Classification: LCC QA76.9.D343 K685 2024 | DDC 006.3/12--dc23/eng/20231222
LC record available at https://lccn.loc.gov/2023038211
British Library Cataloguing-in-Publication Data
A catalogue record for this book is available from the British Library.
Copyright © 2024 by World Scientific Publishing Co. Pte. Ltd.
All rights reserved. This book, or parts thereof, may not be reproduced in any form or by any means, electronic or mechanical, including photocopying, recording or any information storage and retrieval system now known or to be invented, without written permission from the publisher.
For photocopying of material in this volume, please pay a copying fee through the Copyright Clearance Center, Inc., 222 Rosewood Drive, Danvers, MA 01923, USA. In this case permission to photocopy is not required from the publisher.
For any available supplementary material, please visit https://www.worldscientific.com/worldscibooks/10.1142/13603#t=suppl
Desk Editor: Quek ZhiQin, Vanessa
Typeset by Stallion Press
Email: enquiries@stallionpress.com
Printed in Singapore
Contents
1.Introduction1
1.1BasicoperationsofExcel....................2
1.1.1Tablecomponents....................3
1.1.2Nameboxandformulabar...............4
1.1.3Ribbon..........................5
1.1.4FiletabandBackstageview..............5
1.1.5Autofill..........................6
1.1.6Relativereference....................7
1.1.7Absolutereference....................8
1.1.8IntroductionofvisualizationwithExcel........10
1.1.9IntroductionofPDEderivationwithExcel......12
1.2BasicoperationsofGoogleColab(Colab)...........15
1.2.1Codecell.........................17
1.2.2Textcell.........................17
1.2.3IntroductiontovisualizationwithColab........18
1.2.4IntroductionofdeeplearningwithColab.......19
1.3Organizationofthisdocument.................24
2.Basic25
2.1Background...........................25
2.1.1DataanalysisusingNNs................25
2.1.2Formatofphysicaldata.................30
2.1.3Physicaldatavisualization...............30
2.2StatisticalAnalysisinExcel..................36
2.2.1Correlationanalysis...................37
2.2.2F-test...........................38
2.2.3t-Test...........................39
2.2.4Z-test...........................41
2.3Regressionanalysis.......................41
2.3.1Modelcharacteristics..................42
2.3.2Regressionanalysisassumptions............43
2.3.3Regressionanalysisusingthedataanalysistools inExcel..........................49
2.3.4Excelmacro.......................55
2.3.5Implementationofthevariablereductionmethod usingExcelVBA.....................59 2.4What-ifanalysis.........................63 2.5Solver...............................66
2.5.1Optimization.......................68
2.5.2Implementationofregressionanalysis.........69 2.6Colab...............................73
2.6.1Correlationanalysis...................74
2.6.2F-test...........................74
2.6.3t-Test...........................75
2.6.4Z-test...........................77
2.6.5Regressionanalysis...................77
2.6.6Optimizationproblem..................80
2.7NNs................................81
2.7.1Universalapproximationtheorem...........83
2.7.2RegressionanalysisusingNNs.............85
2.7.3NNimplementationusingExcelVBA.........87
2.7.4FunctionapproximationusingNNs...........95
2.7.5PointclouddataanalysisusingNNs:Application example..........................98
2.7.6LinegroupdataanalysisusingNNapplication examples.........................101
3.PracticalPart109
3.1AboutPINNs..........................109
3.2AutomaticdifferentiationinNN................113
3.3Usingautomaticdifferentiationinregressionequation....116
3.4AutomaticdifferentiationusingColab.............118
3.5Increasingtheaccuracyofvisualizationofmagneticline groupdatausingautomaticdifferentiation..........119
3.6GenerationofaCADmodelfrompointclouddatausing pointclouddataprocessingsoftware.............121
4.AdvancedApplicationSection129
4.1DerivationofPDEsdescribingphysicaldata.........129
4.1.1Relatedresearch.....................132
4.1.2PDEderivationusingregularizedregression analysis..........................134
4.1.3Definitionoferror....................136
4.1.4ExampleofPDEderivation...............137
4.2Useofvisualanalysistechniques................171
4.3MethodsforsolvingagivenPDE...............173
4.3.1HowtosolvePDEsusingtheFouriertransform...175
4.3.2PDEapproximatesolution...............177
4.3.3HowtofindsolutionstoPDEsusingPINNs.....183
4.3.4ExampleoffindingsolutionstoPDEsusing PINNs..........................185
4.3.5ImplementationofthePDEsolutionmethod.....195
5.PhysicallyBasedSurrogateModel203
5.1AbouttheCAEsurrogatemodel................203
5.1.1ExampleofSMconstruction..............203
5.1.2Expectationsforphysics-basedlearning........209
5.2Applicationtocarbonneutrality(CN)............209
6.ClosingRemarks213
This page intentionally left blank
Chapter1 Introduction
Inthischapter,youwilllearnpracticalmethodsforanalyzingphysicaldata spatiotemporallydefinedbydiscretepoints.Physicaldatarefertodata usedtodescribephysicalorother phenomena.Thephysicalphenomena refertovariousphenomenathatexistinnature.Theyinclude,forexample, weather,temperature,earthquakes,andfloods.Thephysicaldataareoften definedasspatiotemporaldiscretedata.Thespatiotemporaldiscretedata refertodatathatarenotspatiotemporallycontinuous.Whenwehandle spatiotemporaldiscretedata,weusuallydividethespatiotemporalaxisinto discretesegmentssothatwecanhandledataineachsegment.
Spatiotemporaldiscretedatacanbeusedinavarietyoffields.For example,inthesocialandnaturalsciences,spatiotemporaldiscretedata aresometimesusedtoanalyzevariousphenomenaandtheircontinuous changes.Inbiologyandgeology,spatiotemporaldiscretedataaresometimesusedtoanalyzephenomenathatoccurintime.
Physicaldatacanbemeasuredinavarietyofwaysasfollows:
• Usingmeasuringinstruments :Physicaldatacanbemeasureddirectly usingmeasuringinstruments.Forexample,athermometerorahygrometercanbeusedtomeasuretemperatureandaseismometercanbeused tomeasurethevibrationsofanearthquake.
• Observation :Physicaldatacanbeobtainedbyobservingphenomena. Forexample,aweatherforecastsiteorappcanbeusedtoobservethe weather.Toacquireweatherdata,youcanobservetemperature,humidity,windspeed,etc.,atmeteorologicalobservatories.
• Usingsimulations :Physicaldatacanbeobtainedbyrunningsimulationsonacomputer.Forexample,youcanunderstandfluidandheat conductionphenomenabysimulatingfluidbehaviorandheatconduction phenomena.
Today,discoveringaspatiotemporalmodelthatexplainsphysicaldata definedbyspatiotemporaldiscretepoints(hereaftersimplyreferredtoas “physicaldata”)isaninterestingtopicforresearchersandpractitioners. Akeytopicinthediscoveryofaspatiotemporalmodelisthediscrete-tocontinuoustransformationtoeffectivelyevaluatepartialdifferentialterms. Morespecifically,itisaboutfindingapartialdifferentiablefunctionthat adequatelyapproximatesphysicaldatadefineddiscretelyinthetimespace. Apartiallydifferentiablefunctionischaracterizedbyapartialderivative atagivenpoint.Partialdifferentiationreferstocalculatingaderivative withrespecttoaparticularvariableinamultivariablefunctionatthat point.Thepartialdifferentiablefunction,whichhasapartialderivativeata givenpoint,isusedtoanalyzeamultivariablefunction.Successfullyfinding suchpartialdifferentiablefunctionenableseffectivevisualizationandalso enablesapartialdifferentialequation(PDE)thatexplainsaphenomenon tobederivedusingtheresultsofanalysis.
ThisdocumentusesExceltounderstandthebasicsofhowtoanalyze physicaldata.Exceliswidelyusedasapieceofspreadsheetsoftwareto organizedataissuitedfordataanalysis.UsingExcelhasthefollowing benefits:
• Easytouse :Exceliscommonlypre-installedonmostcomputersand doesnotrequireadditionalinstallation.Moreover,Excelcanbeused withouttheneedforspecializedskills.
• Hasavarietyoffunctions :Excelhasavarietyoffunctionsthatallow youtoaggregatedataefficiently.
• Cancreategraphsorcharts :Excelcanbeusedtovisuallydisplaydata intheformofagraphorchart,whichfacilitatesunderstandingofdata.
• Datacanbeeasilyimported :Excelallowsyoutoimportdatafrom,for example,aCSVortextfile.
• Canworkjointly :Excelallowsmultiplepeopletoworkjointly,making itusefulfordataanalysisprojects.
Excel,whichprovidesanarrayofbenefits,isalsowidelyusedindata analysis.Next,thebasicsofExcelwillbeexplained.
1.1.BasicoperationsofExcel
ExcelisapieceofspreadsheetsoftwaredevelopedbyMicrosoft.The spreadsheetsoftwareisatoolthatallowsyoutoenterandeditdatain atabularformatforaggregation,analysis,andotherpurposes.Excelis
widelyusedbyindividualsandinbusinesses,andcanhandlelargeamounts ofdata,makingitsuitableforaggregationandanalysis.Excelcanbeused tonotonlycreateatablebuttoalsocreateagraphorchart.Additionally, Excelhasavarietyoffunctionstoorganizedata,allowingyoutoanalyze dataandcalculateformulas.Exceliscommonlypre-installedonWindows andMacOSandsoldaspartofMicrosoftOffice.Itisalsoavailableasa cloudservice,soyoucanuseitfromany Internet-connectedenvironment. ThedatatobeanalyzedareoftenprovidedinExcelformat.Thereare quiteafewtoolscapableofreadingandanalyzingExceldata,butExcel itselfalsocontainsfunctionstoperformanalyses.Excelprovidestoolsfor determiningcorrelationbetweendata,testingfordifferencesinthemean andvarianceofdata,andregressionanalysis.Italsoservesasanoptimizationtool.Thesetoolscanbeusedtoimplementdeeplearning.Excelcan beregardedasatoolforpreliminaryanalysispriortoutilizingdedicated analysistools,anditisadvisabletobecomefamiliarwithitsfunctionalities. ThissectiondescribesthebasicterminologyinExcelandexplainshowto performwhat-ifanalysisusingsampledata.
1.1.1. Tablecomponents
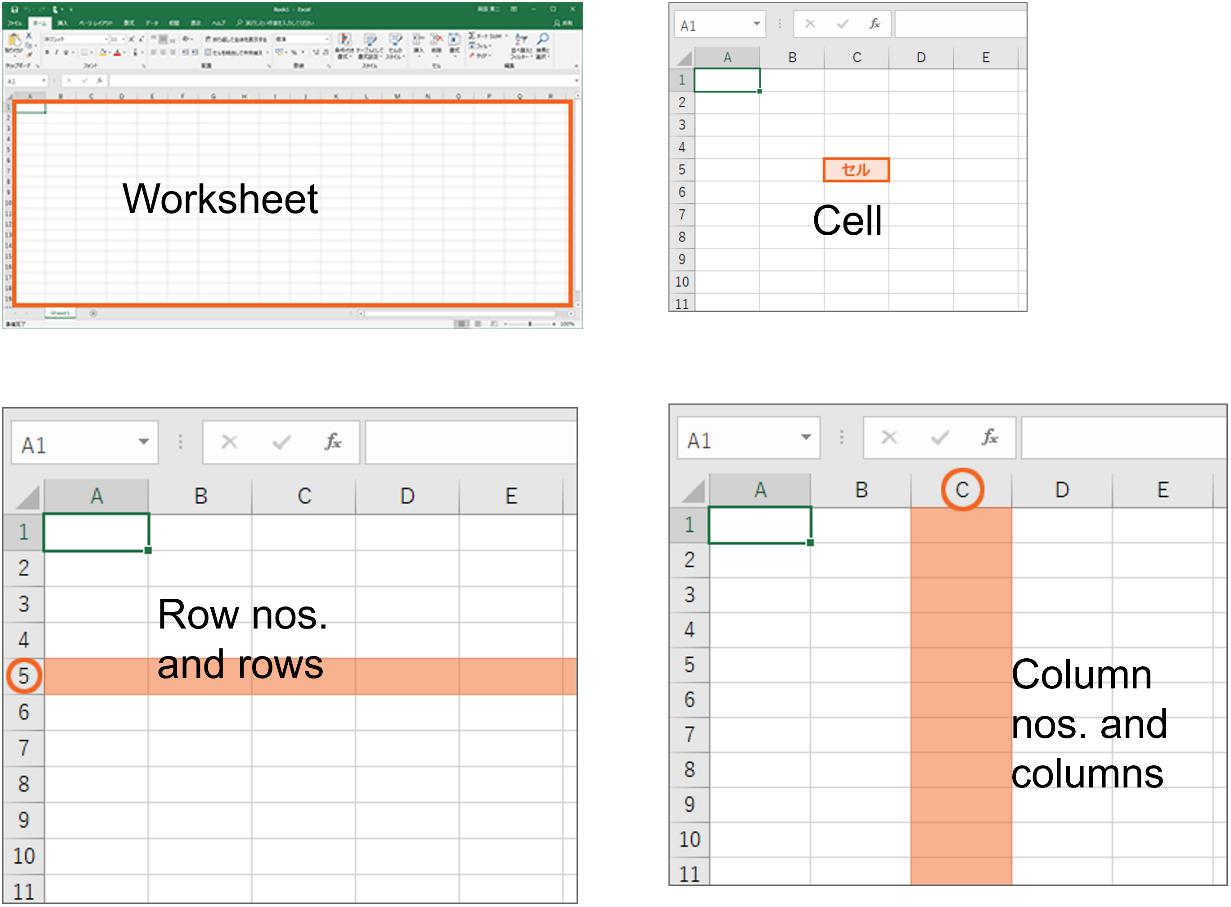
ThemaincomponentsofanExceltableareasfollows(Figure1.1):
• Worksheet :OneofthebasicbuildingblocksofanExceldocument.One documenthasmultipleworksheets.Oneworksheetisusuallycontained inanExcelfile,butmultipleworksheetsmaybeincluded.
• Cell :AbasicelementforenteringdatainExcelatwhicharowanda columnintersect.Youcanentertext,numbers,andothervaluesinacell.
• Row :AbasicelementthatdividesanExcelworksheethorizontally.A rowusuallycontainsasinglecell.InExcel,youcanrefertoarowby specifyingarownumber.
• Column :AbasicelementthatdividesanExcelworksheetvertically.A columnusuallycontainsasinglecell.InExcel,youcanrefertoacolumn byspecifyingthecolumnnumber.
• Rownumber :AnumberthatidentifiesarowinExcelandappearson theleft.Rownumberstypicallystartfrom“1”.
• Columnnumber :AnumberthatidentifiesacolumninExcelandappears atthetop.Columnnumbersusuallystartfrom“A”.
EachcomponentofatableinExcelplaysanimportantroleincreating andmanipulatingatable.Whencreatingatableorenteringdata,itis
Figure1.1.ComponentsofatableinExcel.
importanttounderstandthesecomponentsandmanipulatethemappropriately.
1.1.2. Nameboxandformulabar
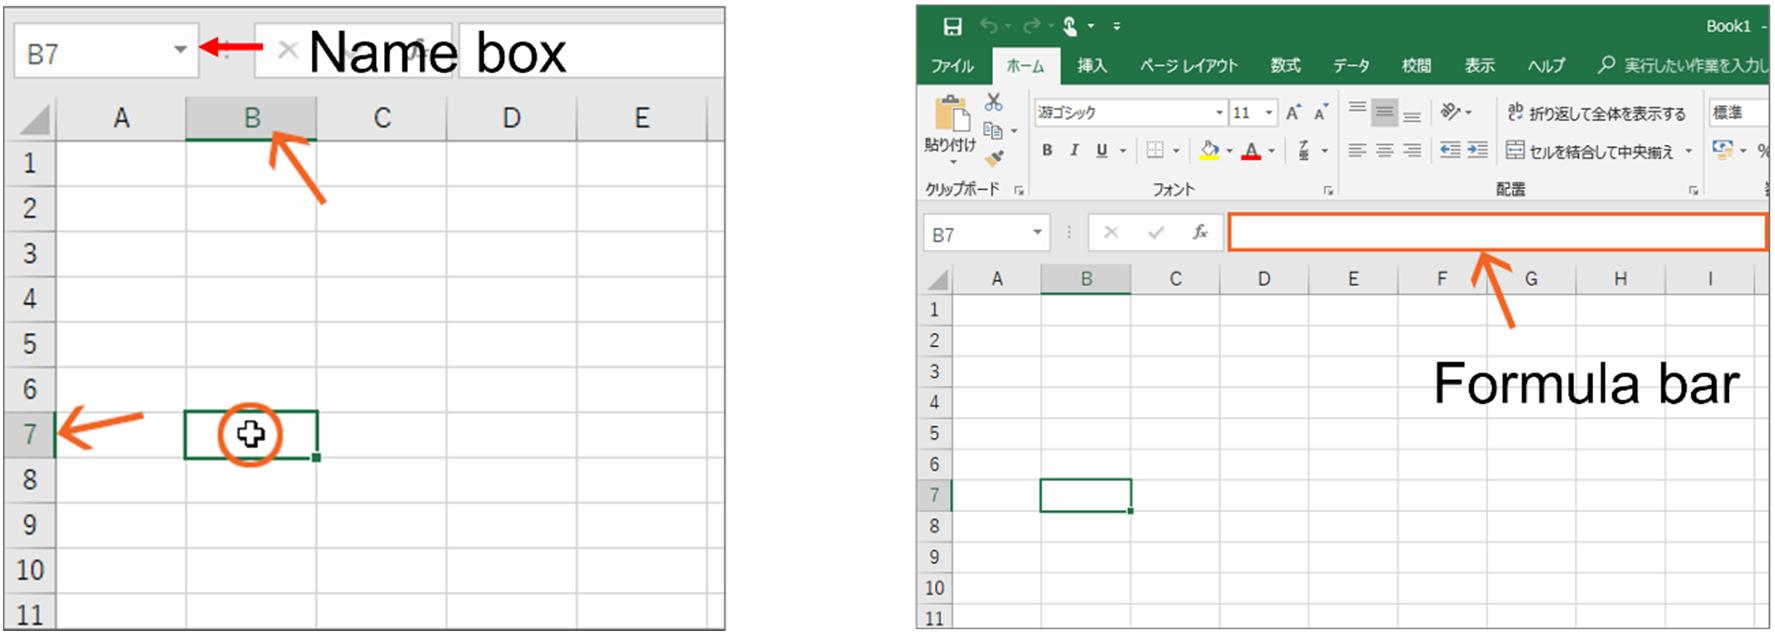
Thenameboxandformulabar(Figure1.2)inExcelhavethefollowing roles:
• Namebox:InExcel,youcannameaspecifiedcellorrange.Thisis callednaming.Namingallowsyoutospecifyacellorarangeofcells.A namedcellorrangeiscalleda“name”inExcel.Youcanmanageyour datamoreefficientlybyspecifyinga namedcellorrange.Excelprovides afunctioncalled“namebox”thatallowsyoutospecifyanamedcellor rangebyenteringitsname.
• Formulabar:InExcel,youcancalculatedatabyenteringaformula. Youcanenteraformulainaplacecalled“formulabar”.Theformula barislocatedintheExcelstatusbarandusedtoenteraformulaintoa cell.Enteringaformulaallowsyoutocalculatedataefficiently.
1.1.3. Ribbon
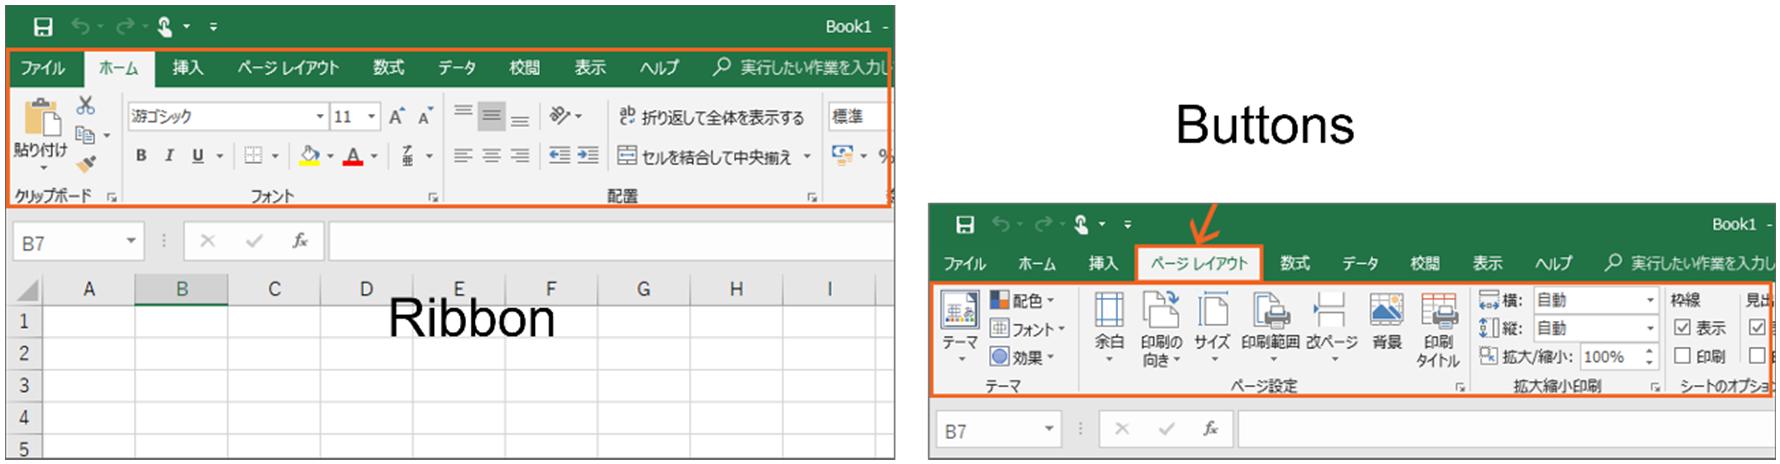
TheExcelribbonreferstothetabbedmenusthatappearinthemainExcel window.Theribbonhasvariousfunctionsandcommandsgroupedtogether intoatabaccordingtothecategory.Therearevarioustabs,suchasHome andData.UserscanusecommandsintheribbontomanipulateExcelto createoreditatable.
Thetabsandtheareacontainingthebuttonswhichcanbeswitched byclickingatabarecollectivelycalledthe“ribbon”(Figure1.3).Youcan switchbetweenbuttonsbyclickingthetabplacedabovethem.
1.1.4. FiletabandBackstageview
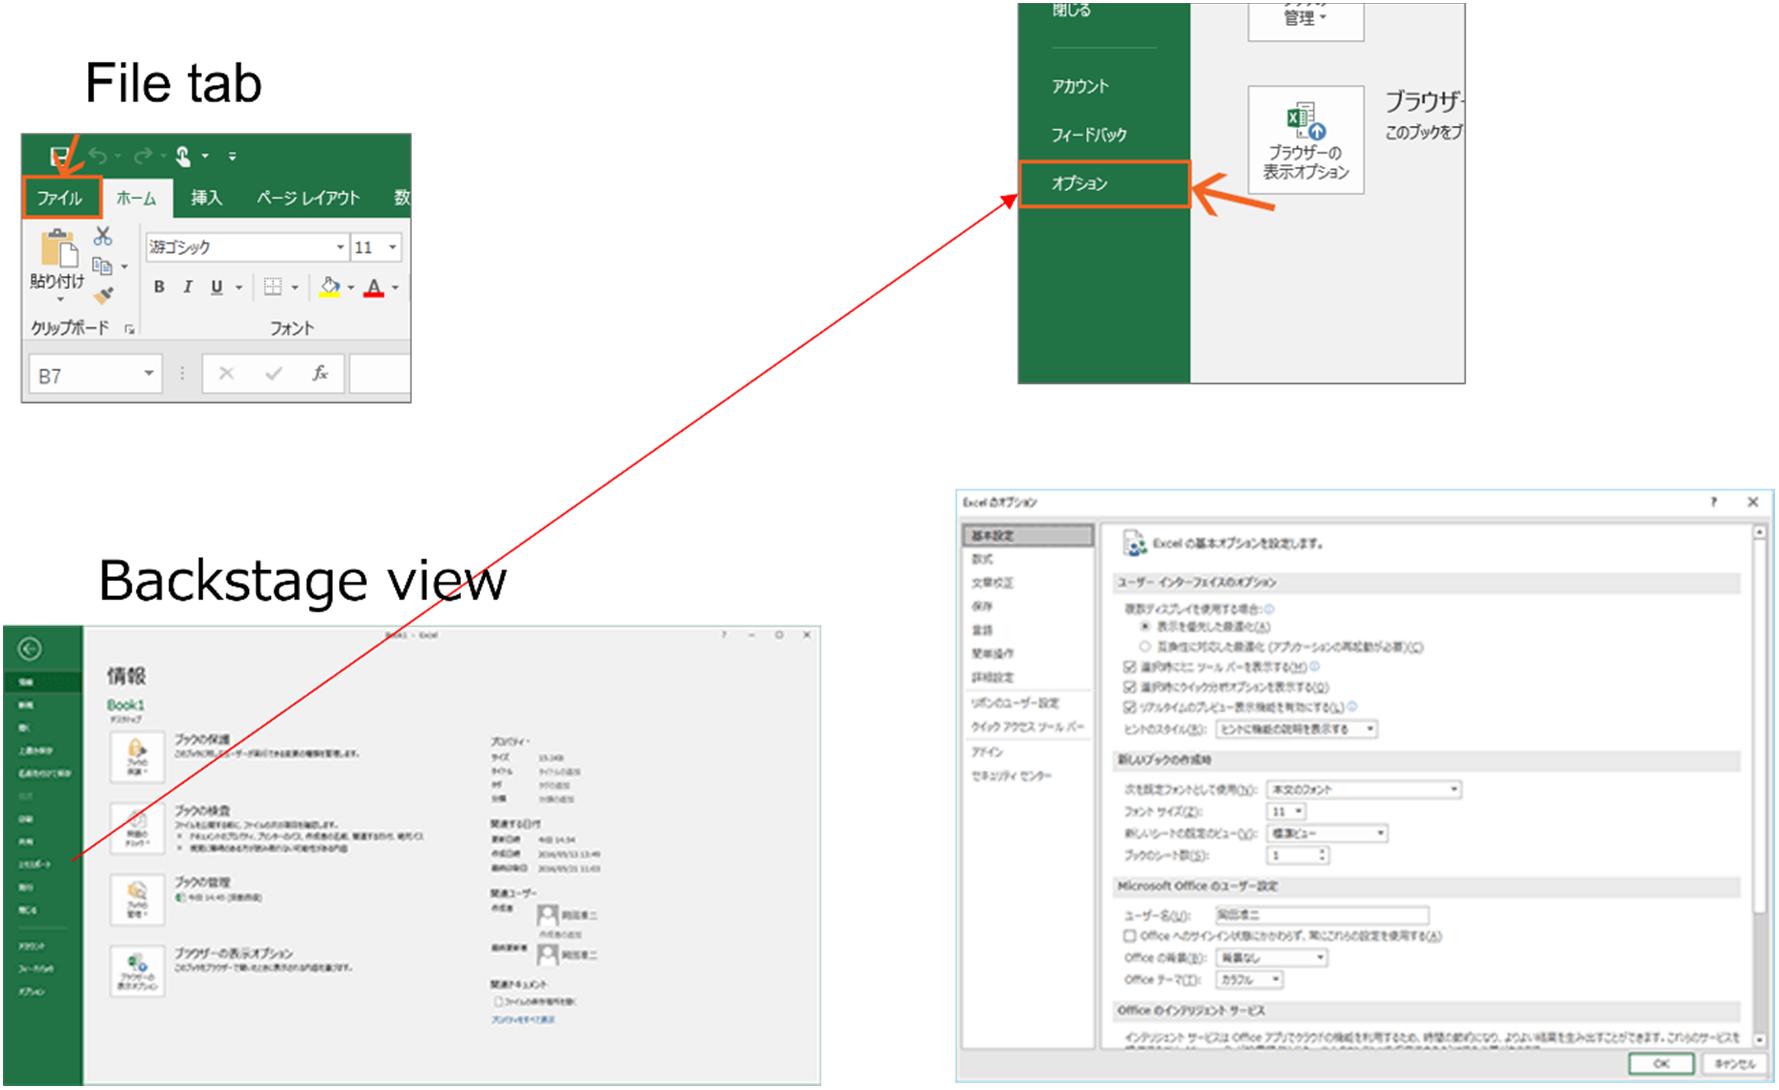
TheExcelfiletabisaspecialtabthatappearsintheupper-leftcornerofthe mainExcelwindow.ClickingontheFiletabwillbringuptheBackstage view(Figure1.4).
TheBackstageviewisaspaceformanagingExcelfilesanddata.The Backstageviewcontainstemplatesfor creatinganewworkbook,aswellas
Figure1.2.Nameboxandformulabar.
Figure1.3.Ribbon.
Figure1.4.FiletabandBackstageview.
commandsforopening,saving,printing,andsharingexistingworkbooks, andforsettingExceloptions.IfyouwantanExceldataanalysistoolor solvertoappearasamenuontheribbon,youmustsetacorresponding optionhere.IntheBackstageview,youcanalsocheckyourExcelaccount orprivacysettings.
ClickingontheFiletabwillbringuptheBackstageview.Clicking Optionswilldisplayadialogbox.
1.1.5.
Autofill
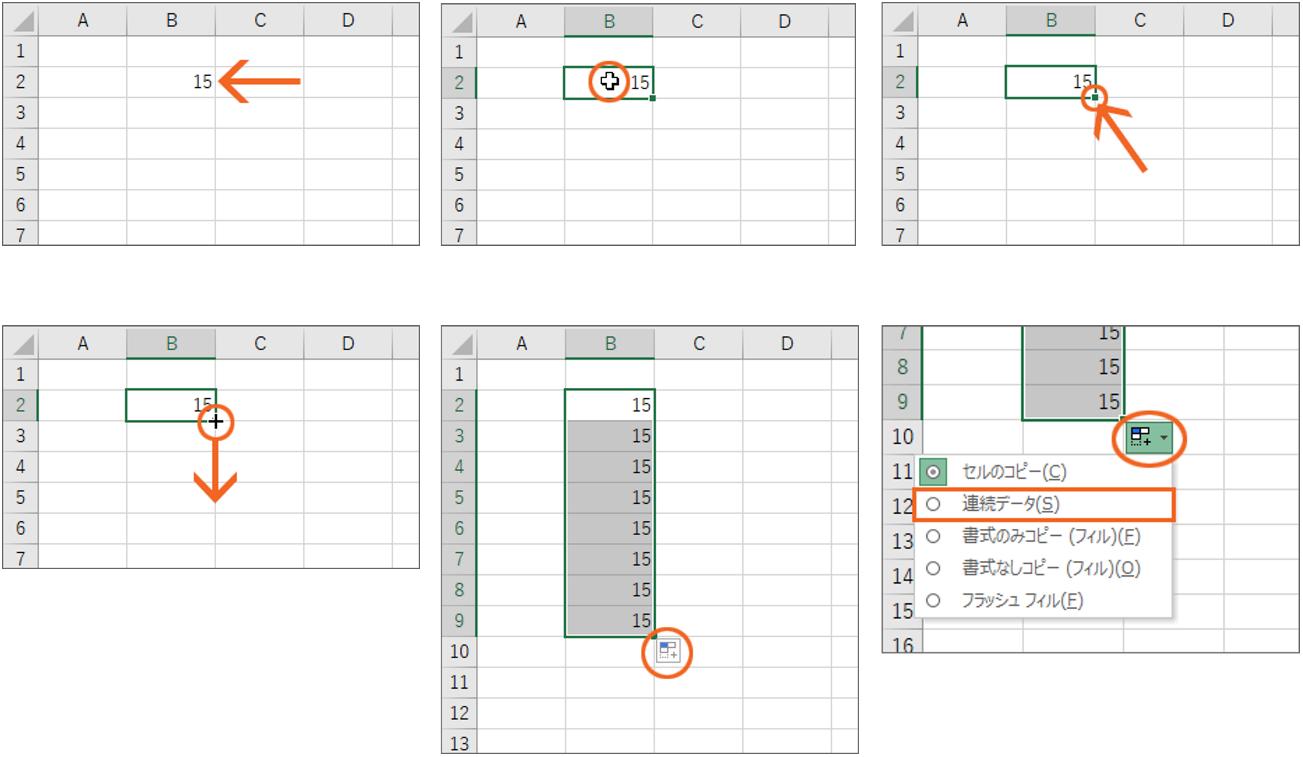
TheAutofillfunctioninExcelhelpsyouenterdataefficiently.Itautomaticallysuggestsdatatobeenterednextbasedonthedatathathavealready beenentered(Figure1.5).
Forexample,supposethatcolumnscontainmonthanddaydata.The data“January”,“February”,and“March”areenteredinthe“Month” column,andthedata“1st”,“2nd”,and“3rd”areenteredinthe“Day” column.Ifyouenter“4”intheAprilcellofthe“Month”column,“4”will alsobeautomaticallyenteredinthe4thcellofthe“Day”column.
TheAutofillfunctionallowsyoutoenterdatamoreefficiently,soyou canperformExcelworkmoreefficiently.TheAutofillfunctionalsoreduces inputerrors,therebyincreasingdatareliability.
Youcaneasilyentercontinuousdatasuchas“January,February, March ”bydraggingthem:
1.Selectacellfilledwithanumber.
2.Movethemousepointertothesmallsquareatthebottomrightofthe thickframe.
3.Whentheshapeofthemousepointerchangesintoacross,dragit.
4.Clickon“AutofillOptions”thathasappearedinthelowerrightarea.
1.1.6. Relativereference
InExcel,therelativereferencefunction allowsthereferencedestinationin areferencedcelltobeautomatically changedwhenthereferencedcellis moved(Figure1.6).
Forexample,foracellcontainingtheformula“=A1”,ifyouwereto movethiscelltotherightbyonecell,theformulawillbeautomatically rewrittento“=B1”.Thefunctioncapableofchangingthereferencedestinationinacellautomaticallywhenthecellismovedisknownas“relative reference”.
The“relativereference”function,whichautomaticallychangesthereferencedestinationinacellwhenthecellismoved,isusefulforwritingformulas.Whendatathatuse“relativereference”areduplicated,areference
Figure1.5.Autofill.
Figure1.6.Relativereference. destinationintheduplicatedcellisalsochanged,allowingyoutomanage dataefficiently.
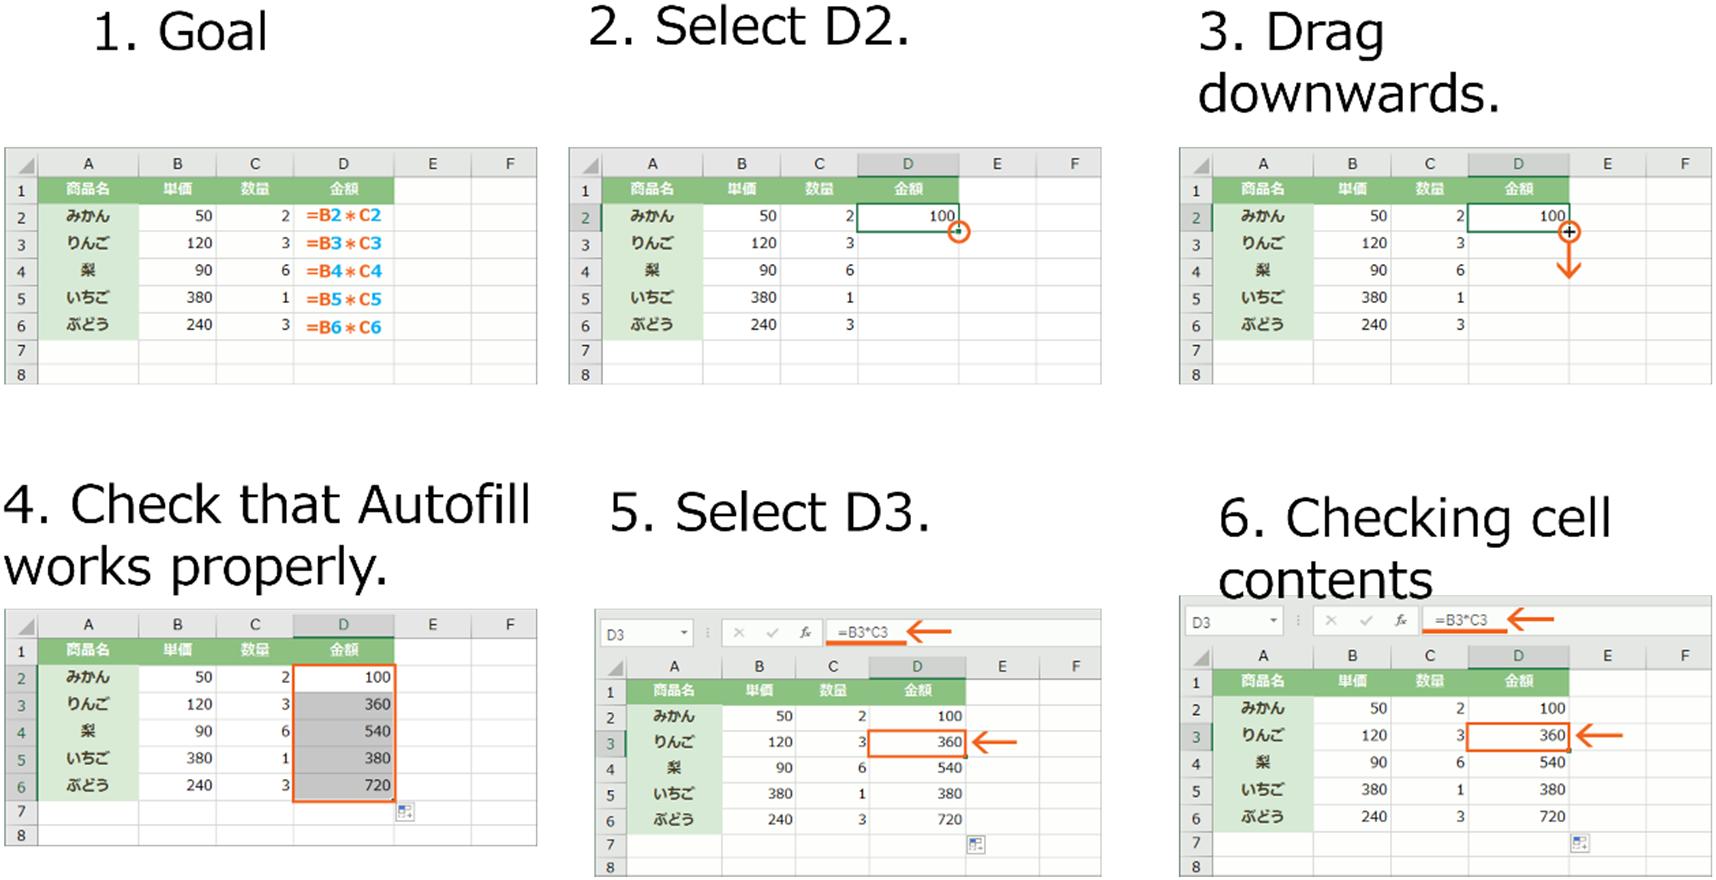
Autofillisusedtocopyaformula.
1.IfyouselecttheD2addressthatcontainsaformula,asmallsquarewill appearatthebottomrightofthatcell.
2.Dragitdownwardtoautomaticallyfillothercells.
3.SelecttheB2address.Thecontentsofthatcellwillbedisplayedinthe formulabar.
1.1.7. Absolutereference
InExcel,whenacellcontaining“absolutereference”isreferenced,the referencedestinationinthecellisfixedevenafterthecellmoves.
Forinstance,consideracellthatcontainstheformula=“ $A$1”.If youshiftthiscelltotherightbyonecell,thereferencedestinationinthe movedcellwillremainunchangedas“= $A$1”.Thefunctioncapableof fixingareferencedestinationinacellevenafterthecellismovedisknown as“absolutereference”.
Theabsolutereferencefunction,whichpreventsthereferencedestinationinacellfrombeingchangedafterthecellhasmoved,isusefulfor writingformulas.Whendatathatuse“absolutereference”areduplicated, thereferencedestinationintheduplicatedcellisnotchanged,allowingyou tomanagedataefficiently(Figure1.7).
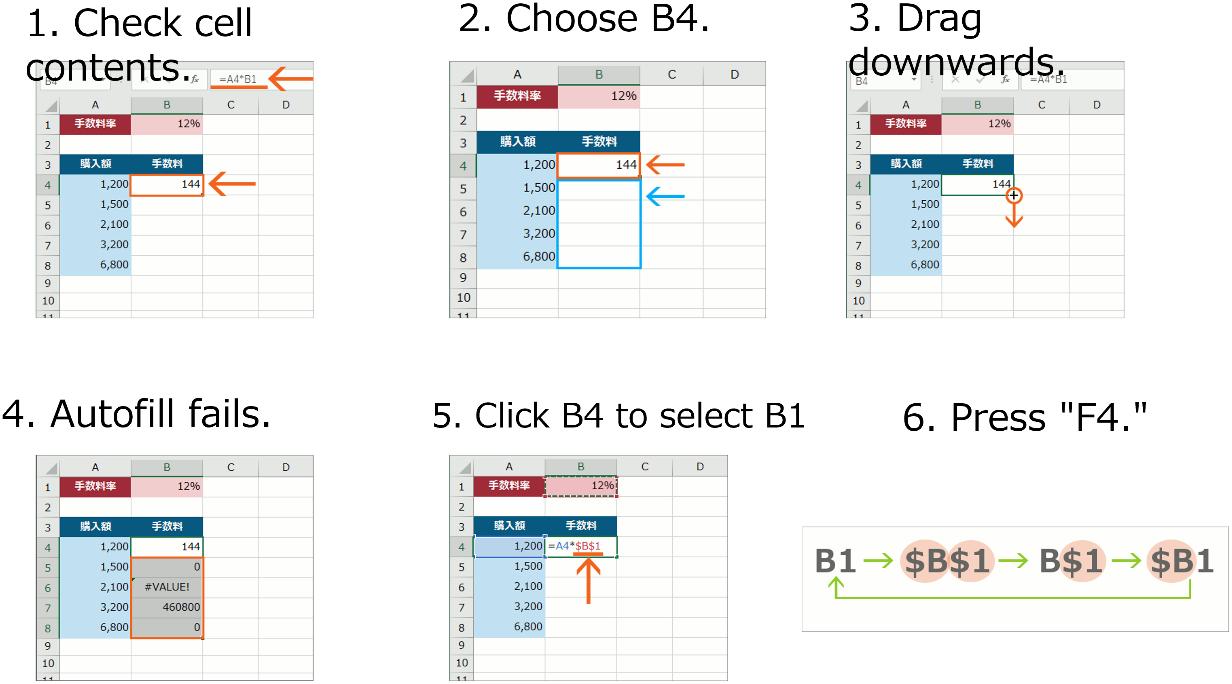
Itisrecommendedtousetheabsolutereferencefunctioninorderto retainthecelladdressinaformulawhentheformulaiscopied.
1.SelecttheB4address.Thiswillcausethecelltobesurroundedbya thickframewithasmallsquareappearingatthebottomright.
2.Draggingthesmallsquaredownwardwillnottriggertheautofilltowork.
3.Instead,clicktoselectB1,which isthe“commissionrate”,andpress F4.
4.Makesurethecolumnandrownumbersareprefixedwith“$”toindicate theyareabsolutereferences.There arethreeprefixingpatterns:absolutereferenceforbothcolumnandrow,forrowonly,andforcolumn only.ThispatterncanbechangedbypressingtheF4button.
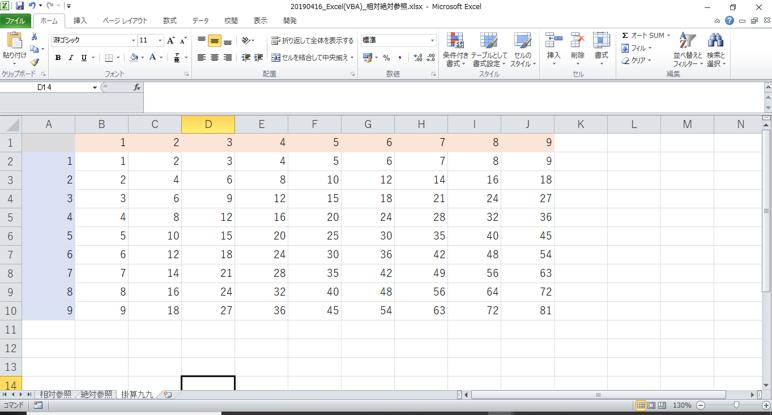
Tolearnhowtouserelativeandabsolutereferences,displaythecalculationresultsofnumbersincolumnA × numbersinrow1.
1.Enter1to9downward,startingfromrow2ofcolumnA.
2.Enter1to9rightward,startingfromrow1ofcolumnB.
3.Calculateproductsforall9 × 9cellsusingrelativeandabsolutereferencesappropriately(Figure1.8).Morespecifically,enteraformula “= $A2*B$1”inrow2ofcolumnB.Copythiscelluptorow10,and thencopyalltherows2to10ofcolumnBtogetherupto10columns.
Figure1.7.Absolutereference.
× 9multiplicationtable.
1.1.8. IntroductionofvisualizationwithExcel
Exceliswidelyusedasapieceofspreadsheetsoftwarebutitisalsosuitable forvisualizingdata.
ThereareseveralwaystovisualizedatainExcel:
1.Visualizationwithcharts:Excelprovidesavarietyofcharttypestohelp youvisualizeyourdatawithbar,line,piecharts,etc.
2.Visualizationusingapivottable:Youcanvisualizedatabyusingan Excelpivottabletoaggregatedataandconvertthemtoachart.
3.Visualizationusingaspreadsheet:YoucanuseanExcelspreadsheetto organizedataandvisualizethemusingcolorcodingorformulas.
4.Visualizationusingmacro:ExcelhasamacrolanguagecalledVBA.You canuseittocreateacustomchartorautomatedvisualizationtool.
BeforevisualizingdatainExcel,youmayhavetoorganizeandprocess them.Excelalsohasavisualizationadd-inthatallowsyoutodomore detailedvisualizations.
DisplayingachartusingExcel:
1.Creatingachart:Excelhasavarietyofcharttypesthatallowyouto enterdataandcreateachart.
• Selectdata,selectChartfromtheInserttab,andselectacharttype.
• Afterachartiscreated,thedataappearinthechartarea.
Figure1.8.Creationofa9
2.Editingachart:Youcaneditachartyouhavecreated.
• SelectachartandselectChartOptionsfromtheDesigntab.
• Youcanchangedetailedchartsettingsbyusingtabs,suchasAxis, DataSeries,andLayout.
3.Chartdesign:Youcanchangetheappearanceofachart.
• Youcanchangetheappearanceofachartbyselectingapreferred chartandchoosingShape,Frame,etc.,fromtheFormattab.
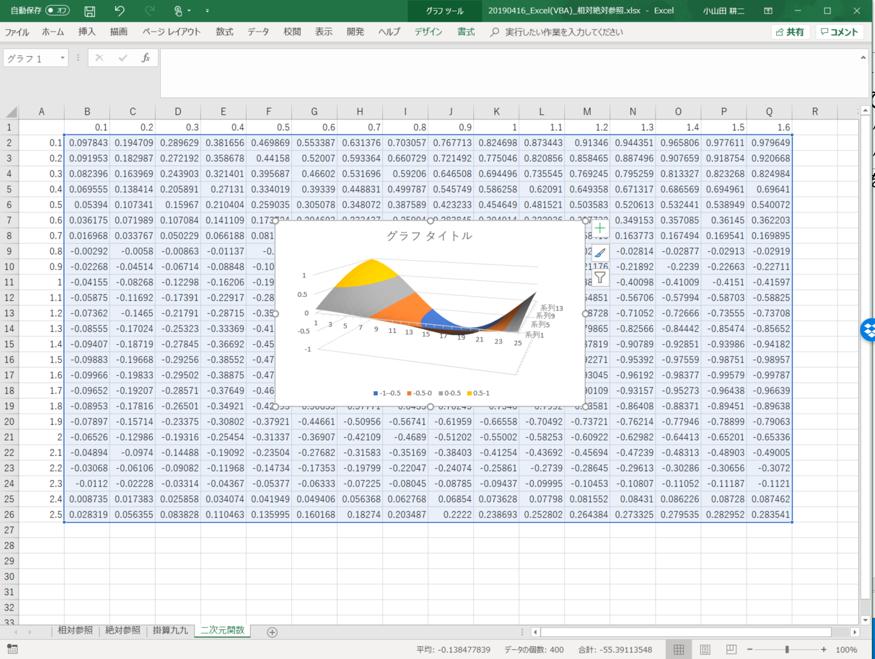
Aconcreteexampleisusedtoexplainthis.Thefollowingisatwodimensionalfunction: f (x,y )=sin(x) · cos(2y ).Calculate f (x,y )usinga variablevalue(y )incolumnAandvariablevalue(x)inrow1(Figure1.9).
• Autofillisusedtofillvariablevaluesdownwardfromthecellofrow2of columnA.
• Autofillisusedtofillvariablevaluesrightwardfromthecellofrow1of columnB.
Figure1.9.Presentationoftwo-dimensionalfunctionasacontourchart.
• Calculatefunctionvaluesusingrelativeandabsolutereferencesasappropriate.
• Setthecharttypeto“Contour”anddisplayachart.
1.1.9. IntroductionofPDEderivationwithExcel
Thissectionintroduceshowtousedataanalysis(regressionanalysis)in ExceltoderiveaPDEfromthegivendata;detailedoperationswillbe describedinsubsequentsections.Regressionanalysisisamethodofanalyzingthedegreeofimpact(weight)oftwoormoreexplanatoryvariables onanobjectivevariable.Asaconcreteexample,consideramodelthat describestheannualsalesofarestaurant.Eachrestaurantcorrespondsto arowinExcel.Ineachrow,enterannualsales(unit:10,000yen),thenumberofseats(number),walkingtimefromtheneareststation(minutes),and presence/absenceofbreakfast(0, 1).Theregressionanalysistoolallowsyou toeasilycreateaformulathatexplainsannualsalesbyaddingaweightto eachofthefollowingexplanatoryvariables,andanintercept:Numberof seats(number),walkingtimefromtheneareststation(minutes),andpresence/absenceofbreakfast(0, 1)(Figure1.10).
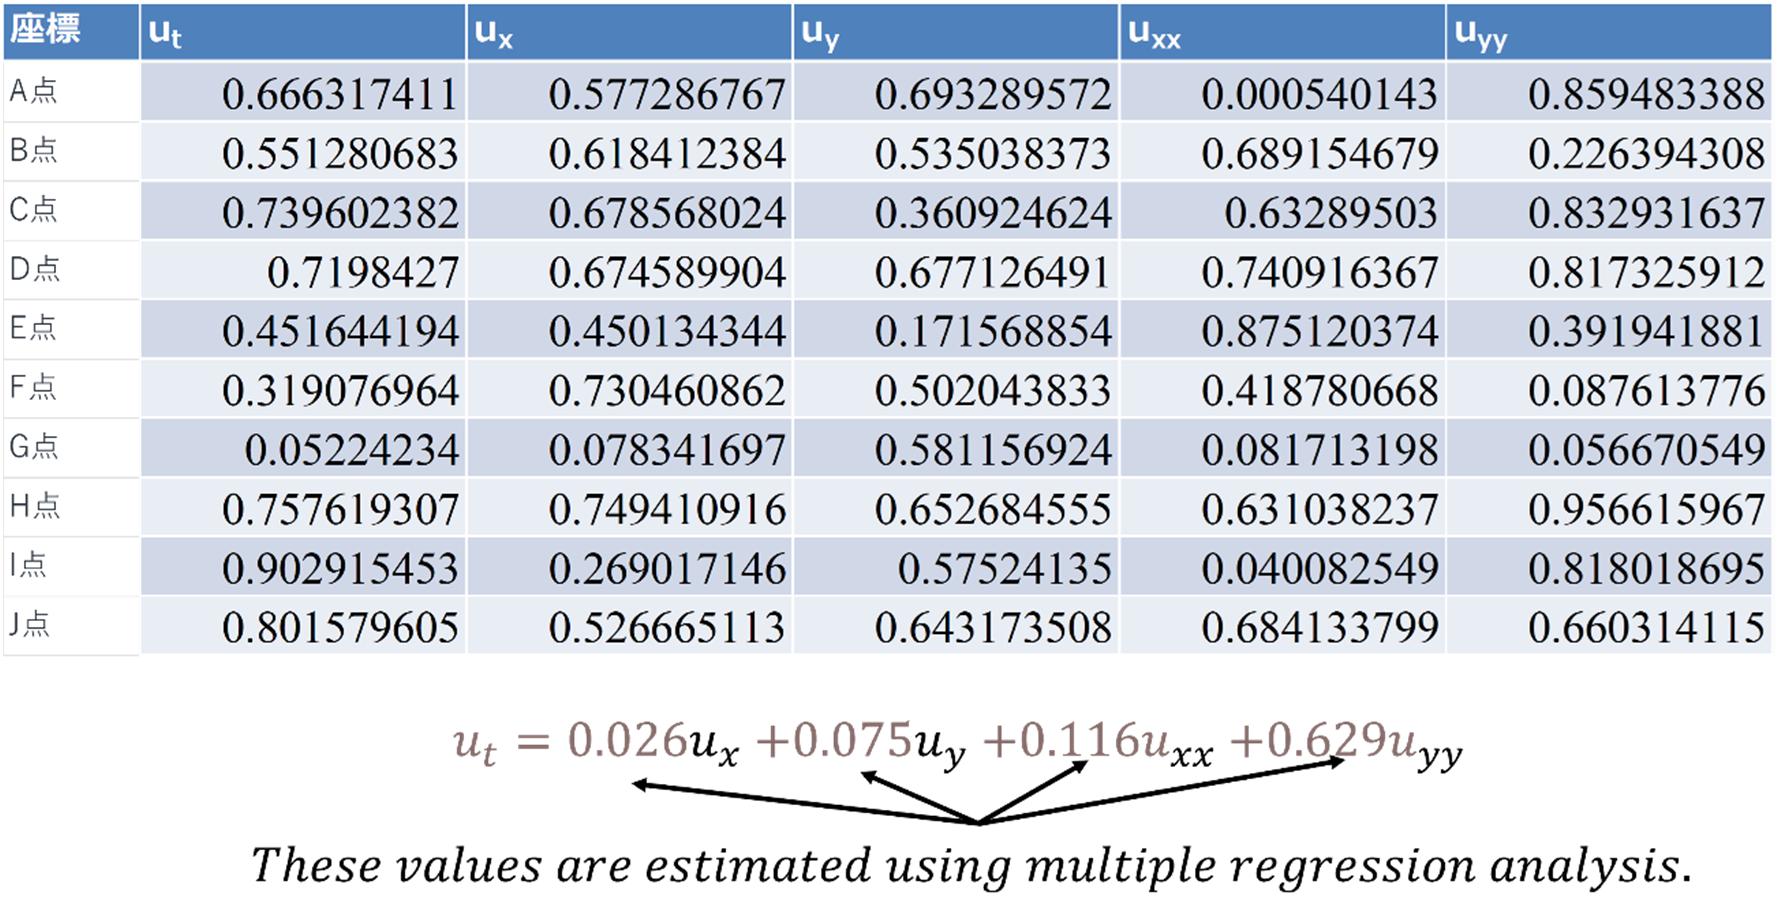
Thisisanintroductoryexerciseforgeneralregressionanalysistechniques,butitprovidesatipfordevelopingadata-drivenmethodforderivingaPDE(Figure1.11).Forexample,enterthepartialderivatives,
Figure1.10.Explanationofsalesusingregressionanalysis.
Figure1.11.DerivationofaPDEusingregressionanalysis.
forthephysicaldata(u)ateachofthemultiplecoordinatepointsineach Excelrow.Theregressionanalysistoolallowsyoutoanalyzethedegreeof impactofeachpartialderivativeon u [1].Asaresult,aPDE
isderivedthatdescribesthephysicaldata.
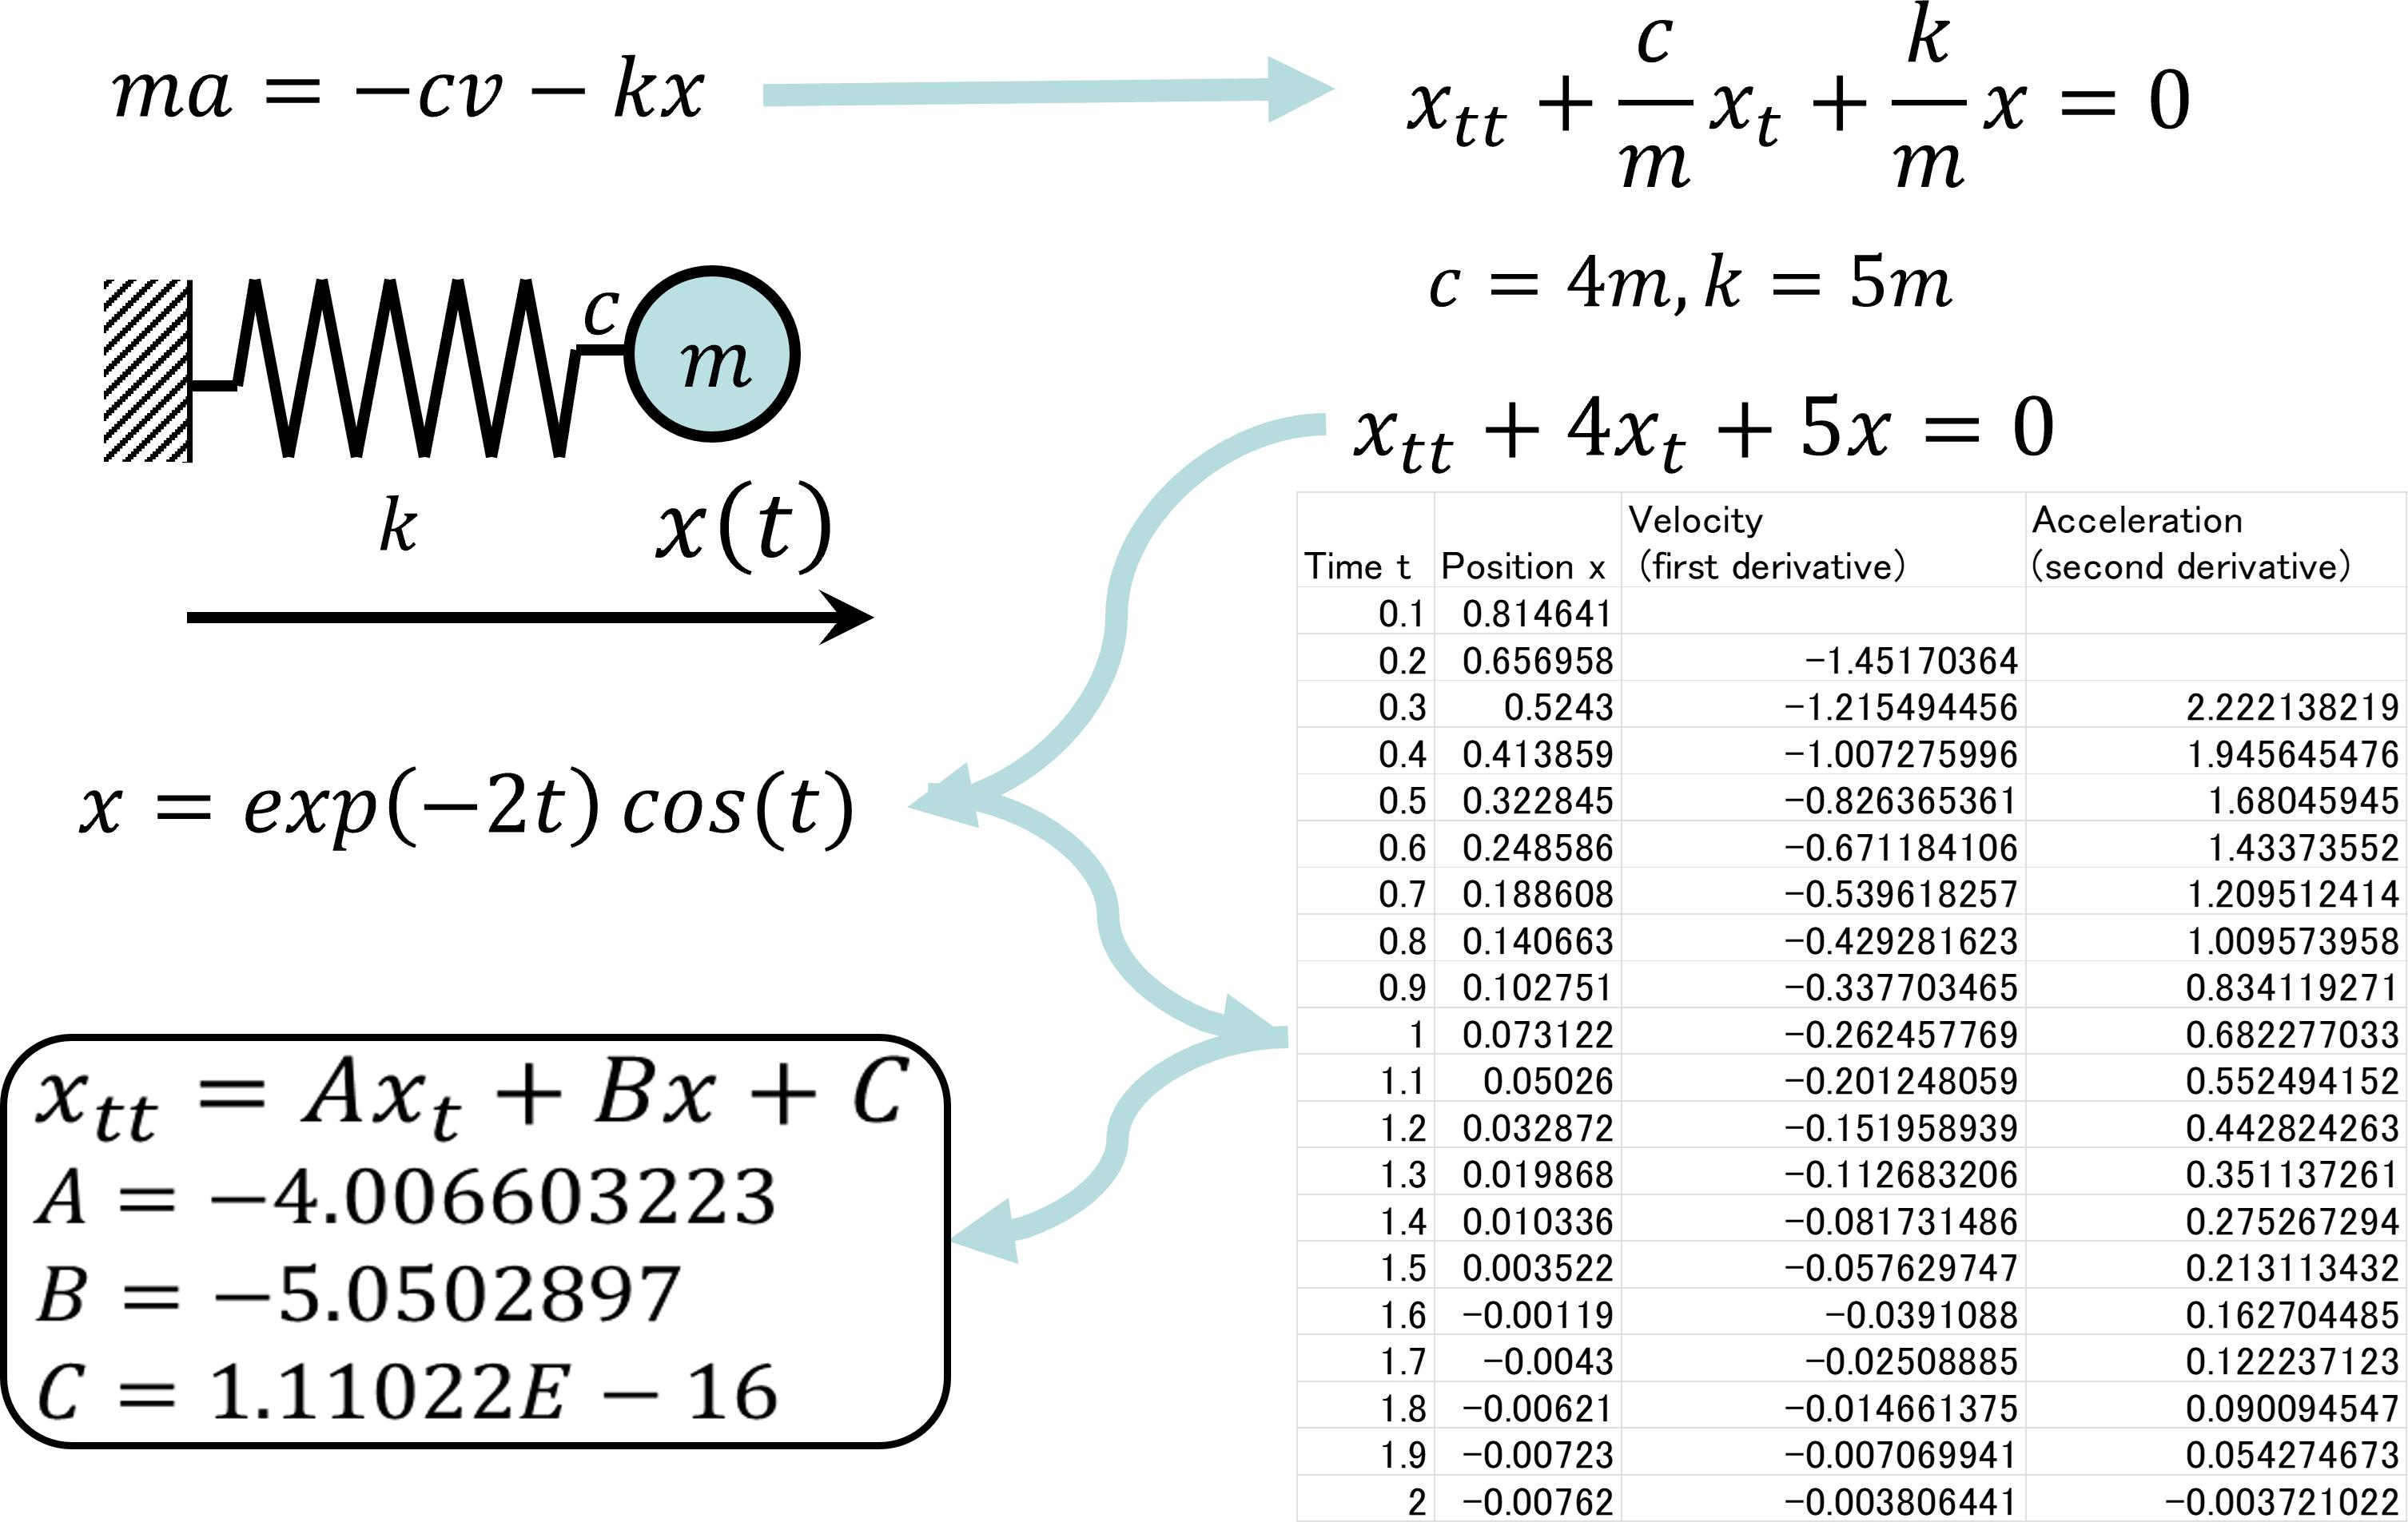
Asaconcreteexample,consideranequationofmotion(Figure1.12). Anequationofmotionisanordinarydifferentialequationrepresenting thelawsofmotionofanobjectinphysics.Aschematicdiagramisshown herewherethemassofanobjectis m kg,aspringconstantis k ,andthe proportionalcoefficientofairresistanceis c.
Thisordinarydifferentialequationissolvedtocalculatetheposition coordinateoftheobjectwhilechangingthetimedata.Thisequation becomesasecond-orderordinarydifferentialequationattheobject’spositioncoordinatex,whichcanbesolvedbygivinganinitialcondition.Enter thecoordinatedata(x)andthedifferentialvalue xt ,xtt ,uy uxx ,uyy ateach ofthemultipletimesineachExcelrow. xtt ,xt ,x regressionanalysistools allowyoutoanalyzethedegreeofimpactofpositionandspeedon xtt .As aresult,aPDE
isderivedthatdescribesthephysicaldata.
TheadvectionequationisaPDEthatdescribesthephenomenainwhich physicalquantities,suchasasubstanceandmomentum,arecarriedalong
Figure1.12.Derivationofequationofmotion.
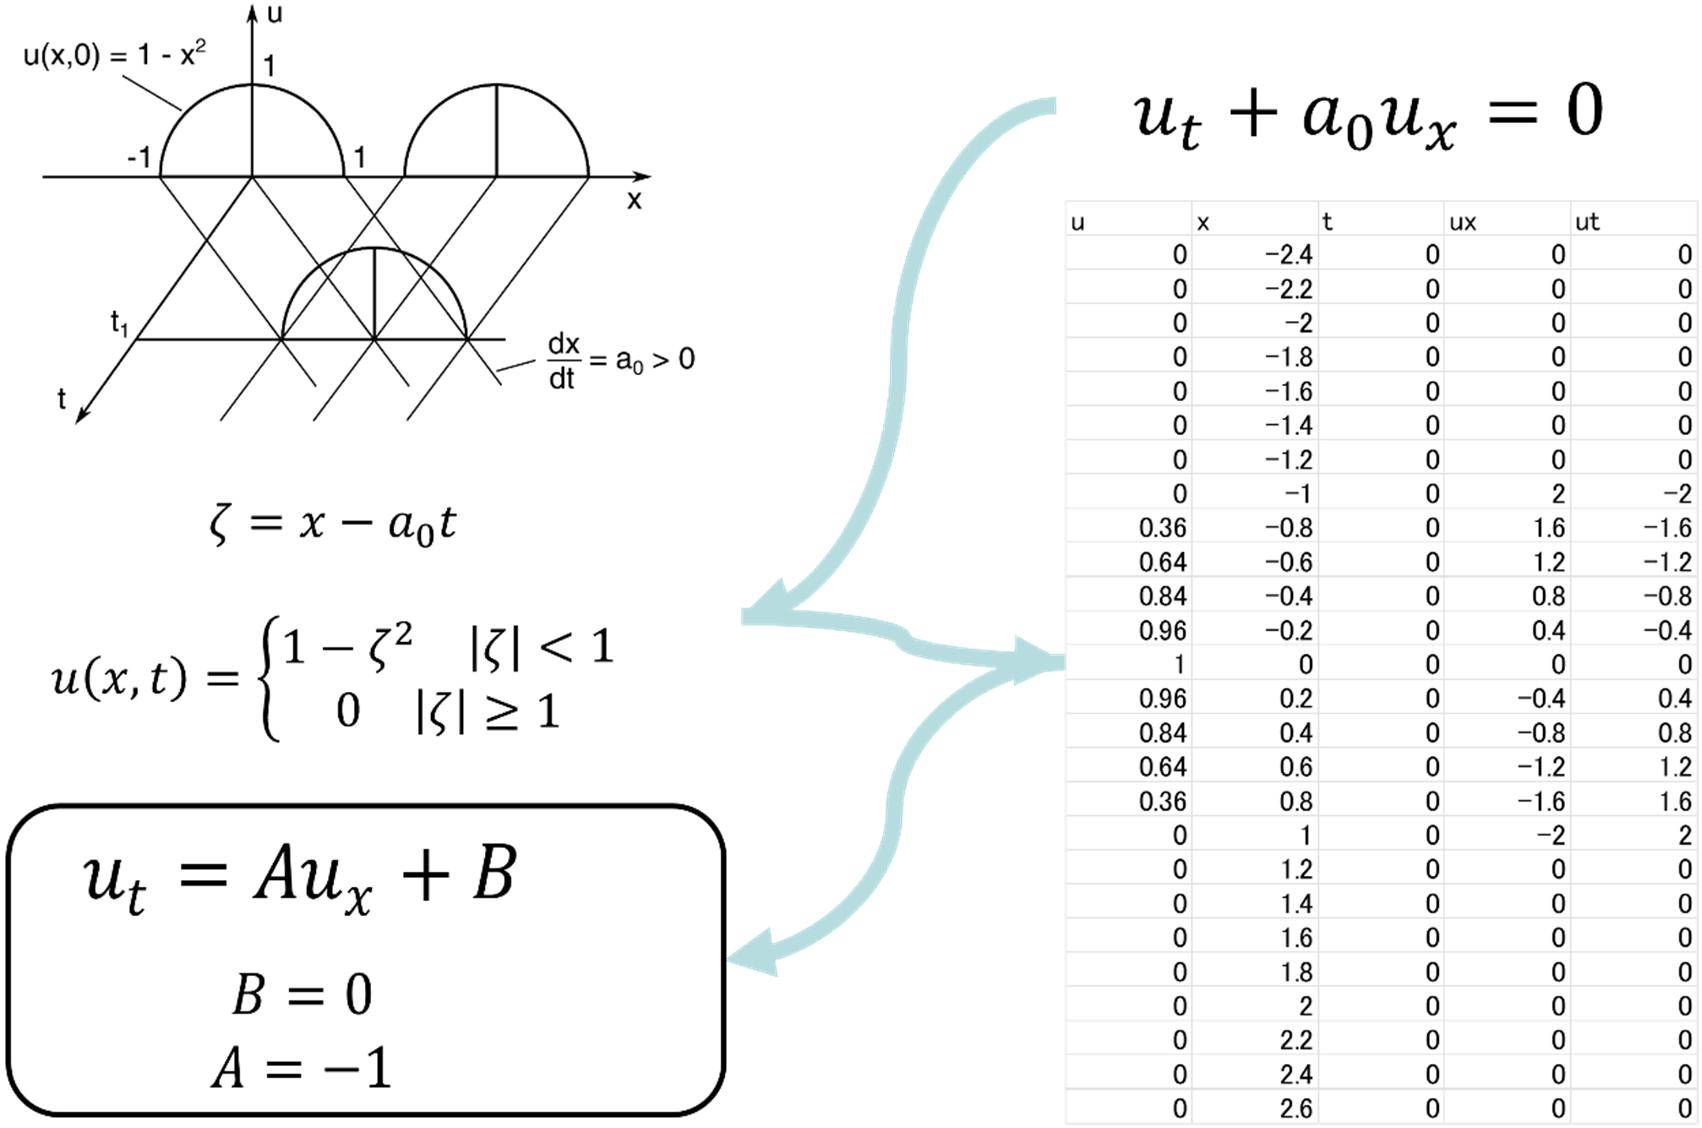
withaflow.Asanotherexample,consideracase(translationalequation) whereasubstanceistransportedinaflowataconstantvelocity a0 andthe concentrationofthesubstanceis C : u(x,t).Figure1.13showsaschematic diagramforaone-dimensionalequation.
Theadvectionequationgivenby ut + a0 ux =0(1.2) hasanexactsolutioninwhichthegeometrygivenbyinitialconditions movesalongthe x axisatavelocityof a0
Theconcentration u canbecalculatedbysettingthetime t andtheposition x andusingthisexactsolution.Furthermore,thisexactsolutionitself canbedifferentiatedtocalculatetimederivativeof uut orspacederivation of uux .Regressionanalysisisthenusedtoobtainaregressionequationthat describestimederivativeasspatialderivative.Thisregressionequationis aderivedPDE(Figure1.13).
Asdescribedearlier,ifthephysicaldataareobtainedandapartial derivativecanbeobtainedforeachpieceofdata,aPDEcanbederived inadata-drivenmannerusinganExcelanalysistool.Theaboveexample dealswithaPDEconsistingoflineartermswhereaconstantcoefficient
Figure1.13.Derivationofadvectionequation. isassumedforpartialdifferentialterms.Evenfornonlineartermswherea coefficientisafunctionofphysicaldata,theycanbereducedtoaregression analysisproblembyintegratingthenonlinearpartswithpartialdifferential terms.
Forthepartialdifferentialterms,ifanexactsolutionisgiven,anexact differentialvaluecanbeobtained.Ifnot,thecalculationofadifferential valuebecomesanissue.Onepossiblestrategyistoobtainanddifferentiateanapproximatefunctionthatdistributesphysicaldatacontinuouslyin somemanner.Onesuchapproximatefunctionthatattractsattentionisan approximatefunctionbasedonneuralnetwork(NN).Thiswillbediscussed inChapter2.
1.2.BasicoperationsofGoogleColab(Colab)
Approximately1000rowsofdatacanbeprocessedwithExcel;however, inordertounderstanddataanalysistechniqueshandlingalargeamount ofdata,GoogleColabisused.GoogleColab(Colab)isGoogle’scloud environmentfordataanalysis[2].Colaballowsyoutostartanalyzingdata
immediatelyonyourbrowserwithoutrequiringhardwareorsoftware.Data analysisinColabhasthefollowingadvantages:
• Eliminatestheneedtosetuphardwareorsoftware:Colaballowsyouto startanalyzingrightawayandpro ceedwithanalysiswithouthavingto worryaboutpreparationonaPCorserverorinstallationofnecessary tools.
• Availableinabrowsersoyoucanaccessitfromanydevice:Colabruns inabrowsersoyoucanaccessitfromanydevice,includingyourPC, smartphone,andtablet.
• Workswithalargeamountofdata:Colab,whichworksinGoogle’scloud infrastructure,canhandlelargeamountsofdata.
• Keepsahistoryofyourworkasyou canproceedwithworkinanotebook format:Colaballowsyoutoproceedwithdataanalysisinanotebook format,soyoucankeepahistoryofyourwork.Thisenhancesrepeatabilityofyourworkandfacilitatescollaboration.
GoogleColaboratory(Colabforshort)isafreecloudserviceprovided byGoogle,whereyoucanusetheJupyternotebookandPythontoanalyze dataandbuildamodelformachinelearning.Thefollowingaresomebasic Colaboperations:
1.Creatinganotebook.
2.Openinganotebook.
3.Savinganotebook.
4.Sharinganotebook.
5.Connectinganotebook.
6.Runninganotebook.
7.Downloadinganotebook.
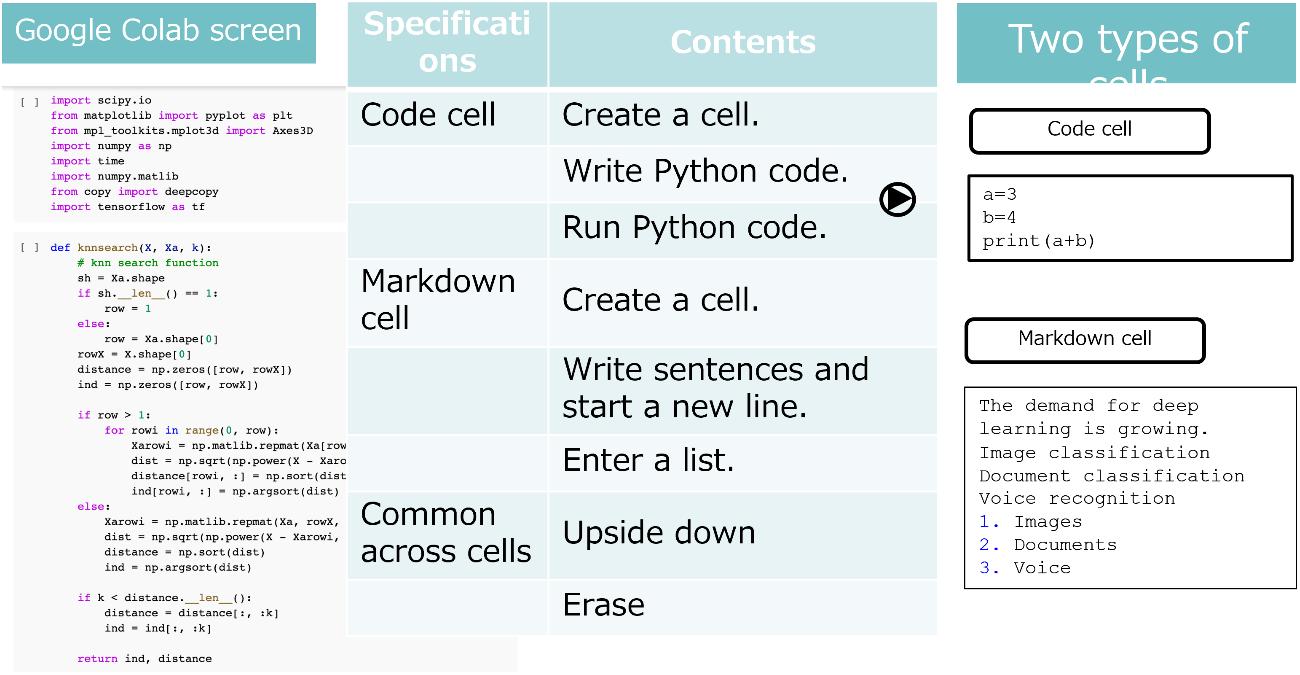
AColabnotebookhasa“cell”inwhichtowritetextandcode.Anotebook iscomposedofmultiplecellsthatcanbeediteddirectlyinawebbrowser. TheColabnotebookhastwotypesofcell:
• Codecell:AcellforwritingPythoncode.
• Textcell:AcellfordescribingtextthatcanuseMarkdownnotationto decorateyourtext(Figure1.14).
Tocreateanewcell,click“+Code”or“+Text”inthemenubar. Alternatively,youcanalsocopyandpasteexistingcells.Toruneachcell, clicktoselectitandthenpress“Shift+Enter”orclickthe“ ”Runbutton inthecell.
1.2.1. Codecell
YoucanenterandexecuteaPythoncodeinacodecell.
• Tocreateacodecell,click“+Cell”atthetopofaColabpage.
• Toenterandruncode,selectacellandclicktheRunbutton.
ColabhasPythonlibrariespre-installed,allowingyoutoprogramwith popularlibrarieslikeTensorFlow[3],Keras[4],andNumpy[5].Colabcan alsoperformhigh-speedcomputationusingGPUandcanperformdeep learningtaskssuchasmachinelearningandimagerecognition.Colabalso hasotherfunctions,suchasimportingexternaldata,savingtheminGoogle Drive,andpublishingthemtoGitHub.
1.2.2. Textcell
Thetextcellallowsyoutowriteprogramdescriptions,formulas,links, images,andmore.
• Tocreateatextcell,click“+Cell”atthetopofaColabpageandselect “Text”.
• Toentertext,selectacellandenterasentenceinit.
YoucanusetheMarkdownnotationtoformatheadings,lists,andmore. Colabtextcellsareveryusefulforwritingdescriptionsanddocuments. Inparticular,theycanbeusedtodescribeprogramsandinterpretresults.
Figure1.14.GoogleColab.