13-3 Wilcoxon Signed-Ranks Test for Matched Pairs 612
13-4 Wilcoxon Rank-Sum Test for Two Independent Samples 619
13-5 Kruskal-Wallis Test for Three or More Samples 626
13-6 Rank Correlation 632
13-7 Runs Test for Randomness 640
STATISTICALPROCESSCONTROL
14-1 Control Charts for Variation and Mean 656
14-2 Control Charts for Attributes 667
(and all Quick Quizzes, all Review Exercises, and all Cumulative Review Exercises)
Credits 752 Index 756
PREFACE
Statistics permeates nearly every aspect of our lives. From opinion polls, to clinical trials in medicine, self-driving cars, drones, and biometric security, statistics influences and shapes the world around us. Elementary Statistics forges the relationship between statistics and our world through extensive use of a wide variety of real applications that bring life to theory and methods.
Goals of This Thirteenth Edition
■ Foster personal growth of students through critical thinking, use of technology, collaborative work, and development of communication skills.
■ Incorporate the latest and best methods used by professional statisticians.
■ Include features that address all of the recommendations included in the Guidelines for Assessment and Instruction in Statistics Education (GAISE) as recommended by the American Statistical Association.
■ Provide an abundance of new and interesting data sets, examples, and exercises, such as those involving biometric security, cybersecurity, drones, and smartphone data speeds.
■ Enhance teaching and learning with the most extensive and best set of supplements and digital resources.
Audience , Prerequisites
Elementary Statistics is written for students majoring in any subject. Algebra is used minimally. It is recommended that students have completed at least an elementary algebra course or that students should learn the relevant algebra components through an integrated or co-requisite course available through MyStatLab. In many cases, underlying theory is included, but this book does not require the mathematical rigor more appropriate for mathematics majors.
Hallmark Features
Great care has been taken to ensure that each chapter of Elementary Statistics will help students understand the concepts presented. The following features are designed to help meet that objective of conceptual understanding.
Real Data
Hundreds of hours have been devoted to finding data that are real, meaningful, and interesting to students. 94% of the examples are based on real data, and 92% of the exercises are based on real data. Some exercises refer to the 32 data sets listed in Appendix B, and 12 of those data sets are new to this edition. Exercises requiring use of the Appendix B data sets are located toward the end of each exercise set and are marked with a special data set icon Real data sets are included throughout the book to provide relevant and interesting real-world statistical applications including biometric security, self-driving cars, smartphone data speeds and use of drones for delivery. Appendix B includes descriptions of the 32 data sets that can be downloaded from the companion website www. pearsonhighered.com/triola or www.TriolaStats.com.
The companion website and TriolaStats.com include downloadable data sets in formats for technologies including Excel, Minitab, JMP, SPSS, and TI-83 > 84 Plus calculators. The data sets are also included in the free Statdisk software, which is also available on the website.
Readability
Great care, enthusiasm, and passion have been devoted to creating a book that is readable, understandable, interesting, and relevant. Students pursuing any major are sure to find applications related to their future work.
Website
This textbook is supported by www.pearsonhighered.com/triola and the author’s website www.TriolaStats.com which are continually updated to provide the latest digital resources for the Triola Statistics Series, including:
■ Statdisk: A free robust statistical software package designed for this book.
■ Downloadable Appendix B data sets in a variety of technology formats.
■ Downloadable textbook supplements including Section 4-5 Probabilities Through Simulations, Glossary of Statistical Terms and Formulas and Tables
■ Online instructional videos created specifically for the 13th Edition that provide step-by-step technology instructions.
■ Triola Blog which highlights current applications of statistics, statistics in the news and online resources.
■ Contact link providing one-click access for instructors and students to contact the author, Marty Triola, with questions and comments.
Chapter Features
Chapter Opening Features
■ Chapters begin with a Chapter Problem that uses real data and motivates the chapter material.
■ Chapter Objectives provide a summary of key learning goals for each section in the chapter.
Exercises Many exercises require the interpretation of results. Great care has been taken to ensure their usefulness, relevance, and accuracy. Exercises are arranged in order of increasing difficulty and exercises are also divided into two groups: (1) Basic Skills and Concepts and (2) Beyond the Basics. Beyond the Basics exercises address more difficult concepts or require a stronger mathematical background. In a few cases, these exercises introduce a new concept.
■ Technology Project provides an activity that can be used with a variety of technologies.
■ From Data to Decision is a capstone problem that requires critical thinking and writing.
■ Cooperative Group Activities encourage active learning in groups.
Other Features
Margin Essays There are 106 margin essays designed to highlight real-world topics and foster student interest. There are also many Go Figure items that briefly describe interesting numbers or statistics.
Flowcharts The text includes flowcharts that simplify and clarify more complex concepts and procedures. Animated versions of the text’s flowcharts are available within MyStatLab and MathXL.
Detachable Formula and Table Card This insert, organized by chapter, gives students a quick reference for studying, or for use when taking tests (if allowed by the instructor). It also includes the most commonly used tables. This is also available for download at www.TriolaStats.com.
Technology Integration
As in the preceding edition, there are many displays of screens from technology throughout the book, and some exercises are based on displayed results from technology. Where appropriate, sections end with a new Tech Center subsection that includes new technology specific videos and detailed instructions for Statdisk, Minitab®, Excel® , StatCrunch, or a TI-83 > 84 Plus® calculator. (Throughout this text, “TI-83 > 84 Plus” is used to identify a TI-83 Plus or TI-84 Plus calculator). The end-of-chapter features include a Technology Project.
The Statdisk statistical software package is designed specifically for this textbook and contains all Appendix B data sets. Statdisk is free to users of this book and it can be downloaded at www.Statdisk.org.
Changes in This Edition
New Features
Chapter Objectives provide a summary of key learning goals for each section in the chapter.
Your Turn: Many examples include a new “your turn” feature that directs students to a relevant exercise so that they can immediately apply what they just learned from the example.
Tech Center: Improved technology instructions, supported by custom author created instructional videos and downloadable content available at www.TriolaStats.com.
Technology Videos. New, author-driven technology videos provide step-by-step details for key statistical procedures using Excel, TI-83 > 84 calculators, and Statdisk.
Larger Data Sets: Some of the data sets in Appendix B are much larger than in previous editions. It is no longer practical to print all of the Appendix B data sets in this book, so the data sets are described in Appendix B, and they can be downloaded at www.TriolaStats.com.
New Content: New examples, exercises and Chapter Problems provide relevant and interesting real-world statistical applications including biometric security, self-driving cars, smartphone data speeds, and use of drones for delivery.
Organization Changes
New Chapter Objectives: All chapters now begin with a list of key learning goals for that chapter. Chapter Objectives replaces the former Review and Preview numbered section. The first numbered section of each chapter now covers a major topic.
New Subsection 1-3, Part 2: Big Data and Missing Data: Too Much and Not Enough
New Section 2-4: Scatterplots, Correlation, and Regression
The previous edition included scatterplots in Chapter 2, but this new section includes scatterplots in Part 1, the linear correlation coefficient r in Part 2, and linear regression in Part 3. These additions are intended to greatly facilitate coverage for those professors who prefer some early coverage of correlation and regression concepts. Chapter 10 continues to include these topics discussed with much greater detail.
New Subsection 4-3, Part 3: Bayes’Theorem
New Section 7-4: Bootstrapping: Using Technology for Estimates
Combines 12th edition Section 5-3 (Binomial Probability Distributions) and Section 5-4 (Parameters for Binomial Distributions)
Removed Sections:
Section 15-2 (Projects) has been changed to an insert in the Instructor’s Edition and has been moved to accompany the first set of Cooperative Group Activities in Chapter 1. Section 15-3 (Procedures) and Section 15-4 (Perspectives) have been removed.
Changed Terminology
Significant: References in the previous edition to “unusual” outcomes are now described in terms of “significantly low” or “significantly high,” so that the link to hypothesis testing is further reinforced.
Multiplication Counting Rule: References in Section 4-4 (Counting) to the “fundamental counting rule” now use “multiplication counting rule” so that the name of the rule better suggests how it is applied.
Flexible Syllabus
This book’s organization reflects the preferences of most statistics instructors, but there are two common variations:
■ Early Coverage of Correlation and Regression: Some instructors prefer to cover the basics of correlation and regression early in the course. Section 2-4 now includes basic concepts of scatterplots, correlation, and regression without the use of formulas and greater depth found in Sections 10-1 (Correlation) and 10-2 (Regression).
■ Minimum Probability: Some instructors prefer extensive coverage of probability, while others prefer to include only basic concepts. Instructors preferring minimum coverage can include Section 4-1 while skipping the remaining sections of Chapter 4, as they are not essential for the chapters that follow. Many instructors prefer to cover the fundamentals of probability along with the basics of the addition rule and multiplication rule (Section 4-2).
GAISE This book reflects recommendations from the American Statistical Association and its Guidelines for Assessment and Instruction in Statistics Education (GAISE). Those guidelines suggest the following objectives and strategies.
1. Emphasize statistical literacy and develop statistical thinking: Each section exercise set begins with Statistical Literacy and Critical Thinking exercises. Many of the book’s exercises are designed to encourage statistical thinking rather than the blind use of mechanical procedures.
2. Use real data: 94% of the examples and 92% of the exercises use real data.
3. Stress conceptual understanding rather than mere knowledge of procedures: Instead of seeking simple numerical answers, most exercises and examples involve conceptual understanding through questions that encourage practical interpretations of results. Also, each chapter includes a From Data to Decision project.
4. Foster active learning in the classroom: Each chapter ends with several Cooperative Group Activities
5. Use technology for developing conceptual understanding and analyzing data: Computer software displays are included throughout the book. Special Tech Center subsections include instruction for using the software. Each chapter includes a Technology Project. When there are discrepancies between answers based on tables and answers based on technology, Appendix D provides both answers. The website www.TriolaStats.com includes free text-specific software (Statdisk), data sets formatted for several different technologies, and instructional videos for technologies.
6. Use assessments to improve and evaluate student learning: Assessment tools include an abundance of section exercises, Chapter Quick Quizzes, Chapter Review Exercises, Cumulative Review Exercises, Technology Projects, From Data to Decision projects, and Cooperative Group Activities.
Acknowledgments
I would like to thank the thousands of statistics professors and students who have contributed to the success of this book. I thank the reviewers for their suggestions for this thirteenth edition: Eric Gorenstein, Bunker Hill Community College; Rhonda Hatcher, Texas Christian University; Ladorian Latin, Franklin University; Joseph Pick, Palm Beach State College; and Lisa Whitaker, Keiser University. Special thanks to Laura Iossi of Broward College for her comprehensive work in reviewing and contributing to this 13th edition.
Other recent reviewers have included Raid W. Amin, University of West Florida; Robert Black, United States Air Force Academy; James Bryan, Merced College; Donald Burd, Monroe College; Keith Carroll, Benedictine University; Monte Cheney, Central Oregon Community College; Christopher Donnelly, Macomb Community College; Billy Edwards, University of Tennessee—Chattanooga; Marcos Enriquez, Moorpark College; Angela Everett, Chattanooga State Technical Community College; Joe Franko, Mount San Antonio College; Rob Fusco, Broward College; Sanford Geraci, Broward College; Laura Heath, Palm Beach State College; Richard Herbst, Montgomery County Community College; Richard Hertz; Diane Hollister, Reading Area Community College; Michael Huber, George Jahn, Palm Beach State College; Gary King, Ozarks Technical Community College; Kate Kozak, Coconino Community College; Dan Kumpf, Ventura College; Mickey Levendusky, Pima County Community College; Mitch Levy, Broward College; Tristan Londre, Blue River Community College; Alma
Lopez, South Plains College; Kim McHale, Heartland Community College; Carla Monticelli, Camden County Community College; Ken Mulzet, Florida State College at Jacksonville; Julia Norton, California State University Hayward; Michael Oriolo, Herkimer Community College; Jeanne Osborne, Middlesex Community College; Ali Saadat, University of California—Riverside; Radha Sankaran, Passaic County Community College; Steve Schwager, Cornell University; Pradipta Seal, Boston University; Kelly Smitch, Brevard College; Sandra Spain, Thomas Nelson Community College; Ellen G. Stutes, Louisiana State University, Eunice; Sharon Testone, Onondaga Community College; Chris Vertullo, Marist College; Dave Wallach, University of Findlay; Cheng Wang, Nova Southeastern University; Barbara Ward, Belmont University; Richard Weil, Brown College; Gail Wiltse, St. John River Community College; Claire Wladis, Borough of Manhattan Community College; Rick Woodmansee, Sacramento City College; Yong Zeng, University of Missouri at Kansas City; Jim Zimmer, Chattanooga State Technical Community College; Cathleen Zucco-Teveloff, Rowan University; Mark Z. Zuiker, Minnesota State University, Mankato.
This thirteenth edition of Elementary Statistics is truly a team effort, and I consider myself fortunate to work with the dedication and commitment of the Pearson team. I thank Suzy Bainbridge, Justin Billing, Deirdre Lynch, Peggy McMahon, Vicki Dreyfus, Christine O’Brien, Joe Vetere, and Rose Kernan of Cenveo Publisher Services.
I extend special thanks to Marc Triola, M.D., New York University School of Medicine, for his outstanding work on creating the new 13th edition of the Statdisk software. I thank Scott Triola for his very extensive help throughout the entire production process for this 13th edition.
I thank the following for their help in checking the accuracy of text and answers in this thirteenth edition: James Lapp, Paul Lorczak, and Dirk Tempelaar.
M.F.T. Madison, Connecticut September 2016
Resources for Success
MyStatLab® Online Course for Elementary Statistics, 13e by
Mario F. Triola
(access code required)
MyStatLab is available to accompany Pearson’s market leading text offerings. To give students a consistent tone, voice, and teaching method each text’s flavor and approach is tightly integrated throughout the accompanying MyStatLab course, making learning the material as seamless as possible.
Expanded objective-based MathXL coverage - MathXL is newly mapped to improve student learning outcomes. Homework reinforces and supports students’ understanding of key statistics topics.
Real-World Data Examples - Help understand how statistics applies to everyday life through the extensive current, real-world data examples and exercises provided throughout the text.
Enhanced video program to meet Introductory Statistics needs:
• New! Tech-Specific Video Tutorials - These short, topical videos address how to use varying technologies to complete exercises.
• Updated! Chapter Review Exercise Videos - Watch the Chapter Review Exercises come to life with new review videos that help students understand key chapter concepts.
• Updated! Section Lecture Videos - Watch author, Marty Triola, work through examples and elaborate on key objectives of the chapter.
Resources for Success
Supplements
Student Resources
Student’s Solutions Manual, by James Lapp (Colorado Mesa University), provides detailed, worked-out solutions to all odd-numbered text exercises.
Student Workbook for the Triola Statistics Series, by Laura Iossi (Broward College) offers additional examples, concept exercises, and vocabulary exercises for each chapter.
(ISBN- 13: 978-0-13-446423-7; ISBN 10: 0-13-446423-0)
The following technology manuals include instructions, examples from the main text, and interpretations to complement those given in the text.
Excel Student Laboratory Manual and Workbook, (Download Only) by Laurel Chiappetta (University of Pittsburgh).
Graphing Calculator Manual for the TI-83 Plus, TI-84 Plus, TI-84 Plus C and TI-84 Plus CE, (Download Only) by Kathleen McLaughlin (University of Connecticut) & Dorothy Wakefield (University of Connecticut Health Center).
(ISBN-13: 978-0-13-446422-0; ISBN 10: 0-13-446422-2)
Statdisk Student Laboratory Manual and Workbook (Download Only), by Mario F. Triola. These files are available to instructors and students through the Triola Statistics Series Web site, www.pearsonhighered. com/triola, and MyStatLab.
SPSS Student Laboratory Manual and Workbook (Download Only), by James J. Ball (Indiana State University). These files are available to instructors and students through the Triola Statistics Series Web site, www.pearsonhighered.com/triola, and MyStatLab.
Instructor Resources
Annotated Instructor’s Edition, by Mario F. Triola, contains answers to exercises in the margin, plus recommended assignments, and teaching suggestions.
Instructor’s Solutions Manual (Download Only), by James Lapp (Colorado Mesa University), contains solutions to all the exercises. These files are available to qualified instructors through Pearson Education’s online catalog at www.pearsonhighered.com/irc or within MyStatLab.
Insider’s Guide to Teaching with the Triola Statistics Series, (Download Only) by Mario F. Triola, contains sample syllabi and tips for incorporating projects, as well as lesson overviews, extra examples, minimum outcome objectives, and recommended assignments for each chapter.
TestGen® Computerized Test Bank (www.pearsoned. com/testgen), enables instructors to build, edit, print, and administer tests using a computerized bank of questions developed to cover all the objectives of the text. TestGen is algorithmically based, allowing instructors to create multiple but equivalent versions of the same question or test with the click of a button. Instructors can also modify test bank questions or add new questions. The software and testbank are available for download from Pearson Education’s online catalog at www.pearsonhighered.com. Test Forms (Download Only) are also available from the online catalog.
PowerPoint® Lecture Slides: Free to qualified adopters, this classroom lecture presentation software is geared specifically to the sequence and philosophy of Elementary Statistics. Key graphics from the book are included to help bring the statistical concepts alive in the classroom. These files are available to qualified instructors through Pearson Education’s online catalog at www.pearsonhighered.com/irc or within MyStatLab.
Learning Catalytics: Learning Catalytics is a webbased engagement and assessment tool. As a “bringyour-own-device” direct response system, Learning Catalytics offers a diverse library of dynamic question types that allow students to interact with and think critically about statistical concepts. As a real-time resource, instructors can take advantage of critical teaching moments both in the classroom or through assignable and gradeable homework.
Get the Most Out of MyStatLab
MyStatLab is the leading online homework, tutorial, and assessment program for teaching and learning statistics, built around Pearson’s best-selling content. MyStatLab helps students and instructors improve results; it provides engaging experiences and personalized learning for each student so learning can happen in any environment. Plus, it o ers flexible and time-saving course management features to allow instructors to easily manage their classes while remaining in complete control, regardless of course format.
Preparedness
One of the biggest challenges in many mathematics and statistics courses is making sure students are adequately prepared with the prerequisite skills needed to successfully complete their course work. Pearson o ers a variety of content and course options to support students with just-in-time remediation and key-concept review.
• MyStatLabwithIntegratedReview ISBN 13: 978-0-13-449535-4, ISBN 10: 0-13449535-7 can be used for just-in-time prerequisite review or co-requisite courses. These courses provide videos on review topics, along with pre-made, assignable skills-check quizzes and personalized review homework assignments.
• In recent years many new course models have emerged, as institutions “redesign” to help improve retention and results. At Pearson, we’re focused on creating solutions tailored to support your plans and programs. In addition to the new Integrated Review courses, we o er new All-in-One solutions, non-STEM pathways, and STEM-track options.
Used by more than 37 million students worldwide, MyStatLab delivers consistent, measurable gains in student learning outcomes, retention, and subsequent course success.
Technology Resources
The following resources can be found at www.pearson highered.com/triola, the author maintained Triola Statistics Series Web site (http://www.triolastats.com), and MyStatLab
■ Appendix B data sets formatted for Minitab, SPSS, SAS, Excel, JMP, and as text files. Additionally, these data sets are available as an APP for the TI-83 > 84 Plus calculators, and supplemental programs for the TI-83/84 Plus calculator are also available.
■ Statdisk statistical software instructions for download. New features include the ability to directly use lists of data instead of requiring the use of their summary statistics.
■ Extra data sets, Probabilities Through Simulations, Bayes’Theorem, an index of applications, and a symbols table.
Video Resources has been expanded, updated and now supplements most sections in the book, with many topics presented by the author. The videos aim to support both instructors and students through lecture, reinforcing statistical basics through technology, and applying concepts:
■ Section Lecture Videos
■ Chapter Review Exercise Videos walk students through the exercises and help them understand key chapter concepts.
■ New! Technology Video Tutorials - These short, topical videos address how to use Excel, StatDisk, and the TI graphing calculator to complete exercises.
■ StatTalk Videos: 24 Conceptual Videos to Help You Actually Understand Statistics. Fun-loving statistician Andrew Vickers takes to the streets of Brooklyn, NY, to demonstrate important statistical concepts through interesting stories and real-life events. These fun and engaging videos will help students actually understand statistical concepts. Available with an instructors user guide and assessment questions.
Videos also contain optional English and Spanish captioning. All videos are available through the MyStatLab online course.
MyStatLab™ Online Course (access code required)
MyStatLab is a course management system that delivers proven results in helping individual students succeed.
■ MyStatLab can be successfully implemented in any environment—lab-based, hybrid, fully online, traditional—and demonstrates the quantifiable differ-
ence that integrated usage has on student retention, subsequent success, and overall achievement.
■ MyStatLab’s comprehensive online gradebook automatically tracks students’ results on tests, quizzes, homework, and in the study plan. Instructors can use the gradebook to provide positive feedback or intervene if students have trouble. Gradebook data can be easily exported to a variety of spreadsheet programs, such as Microsoft Excel. You can determine which points of data you want to export, and then analyze the results to determine success.
MyStatLab provides engaging experiences that personalize, stimulate, and measure learning for each student. In addition to the resources below, each course includes a full interactive online version of the accompanying textbook.
■ Tutorial Exercises with Multimedia Learning Aids: The homework and practice exercises in MyStatLab align with the exercises in the textbook, and they regenerate algorithmically to give students unlimited opportunity for practice and mastery. Exercises offer immediate helpful feedback, guided solutions, sample problems, animations, videos, and eText clips for extra help at point-of-use.
■ Getting Ready for Statistics: A library of questions now appears within each MyStatLab course to offer the developmental math topics students need for the course. These can be assigned as a prerequisite to other assignments, if desired.
■ Conceptual Question Library: In addition to algorithmically regenerated questions that are aligned with your textbook, there is a library of 1000 Conceptual Questions available in the assessment manager that require students to apply their statistical under-standing.
■ StatCrunch™: MyStatLab integrates the Web-based statistical software, StatCrunch, within the online assessment platform so that students can easily analyze data sets from exercises and the text. In addition, MyStatLab includes access to www.StatCrunch.com, a Web site where users can access more than 15,000 shared data sets, conduct online surveys, perform complex analyses using the powerful statistical software, and generate compelling reports.
■ Statistical Software Support: Knowing that students often use external statistical software, we make it easy to copy our data sets, both from the ebook and the MyStatLab questions, into software such as StatCrunch, Minitab, Excel, and more. Students have access to a variety of support tools—Technology
Tutorial Videos, Technology Study Cards, and Technology Manuals for select titles—to learn how to effectively use statistical software.
MathXL® for Statistics Online Course (access code required)
MathXL® is the homework and assessment engine that runs MyStatLab. (MyStatLab is MathXL plus a learning management system.)
With MathXL for Statistics, instructors can:
■ Create, edit, and assign online homework and tests using algorithmically generated exercises correlated at the objective level to the textbook.
■ Create and assign their own online exercises and import TestGen tests for added flexibility.
■ Maintain records of all student work, tracked in MathXL’s online gradebook.
With MathXL for Statistics, students can:
■ Take chapter tests in MathXL and receive personalized study plans and > or personalized homework assignments based on their test results.
■ Use the study plan and/or the homework to link directly to tutorial exercises for the objectives they need to study.
■ Students can also access supplemental animations and video clips directly from selected exercises.
■ Knowing that students often use external statistical software, we make it easy to copy our data sets, both from the ebook and the MyStatLab questions, into software like StatCrunch™, Minitab, Excel, and more.
MathXL for Statistics is available to qualified adopters. For more information, visit our web site at www. mathxl.com, or contact your Pearson representative.
StatCrunch™
StatCrunch is powerful, web-based statistical software that allows users to perform complex analyses, share data sets, and generate compelling reports. A vibrant online
community offers more than 15,000 data sets for students to analyze.
■ Collect. Users can upload their own data to StatCrunch or search a large library of publicly shared data sets, spanning almost any topic of interest. Also, an online survey tool allows users to quickly collect data via web-based surveys.
■ Crunch. A full range of numerical and graphical methods allow users to analyze and gain insights from any data set. Interactive graphics help users understand statistical concepts and are available for export to enrich reports with visual representations of data.
■ Communicate. Reporting options help users create a wide variety of visually appealing representations of their data.
Full access to StatCrunch is available with a MyStatLab kit, and StatCrunch is available by itself to qualified adopters. StatCrunch Mobile is now available to access from your mobile device. For more information, visit our Web site at www.StatCrunch.com, or contact your Pearson representative.
Minitab® 17 and Minitab Express™ make learning statistics easy and provide students with a skill-set that’s in demand in today’s data driven workforce. Bundling Minitab® software with educational materials ensures students have access to the software they need in the classroom, around campus, and at home. And having 12 months versions of Minitab 17 and Minitab Express available ensures students can use the software for the duration of their course.
ISBN 13: 978-0-13-445640-9
ISBN 10: 0-13-445640-8 (Access Card only; not sold as stand alone.)
JMP Student Edition, Version 12 is an easy-to-use, streamlined version of JMP desktop statistical discovery software from SAS Institute, Inc. and is available for bundling with the text.
ISBN-13: 978-0-13-467979-2
ISBN-10: 0-13-467979-2
13th EDITION
ELEMENTARY STATISTICS
1-1 Statistical and Critical Thinking
1-2 Types of Data
1-3 Collecting Sample Data
INTRODUCTION TO STATISTICS
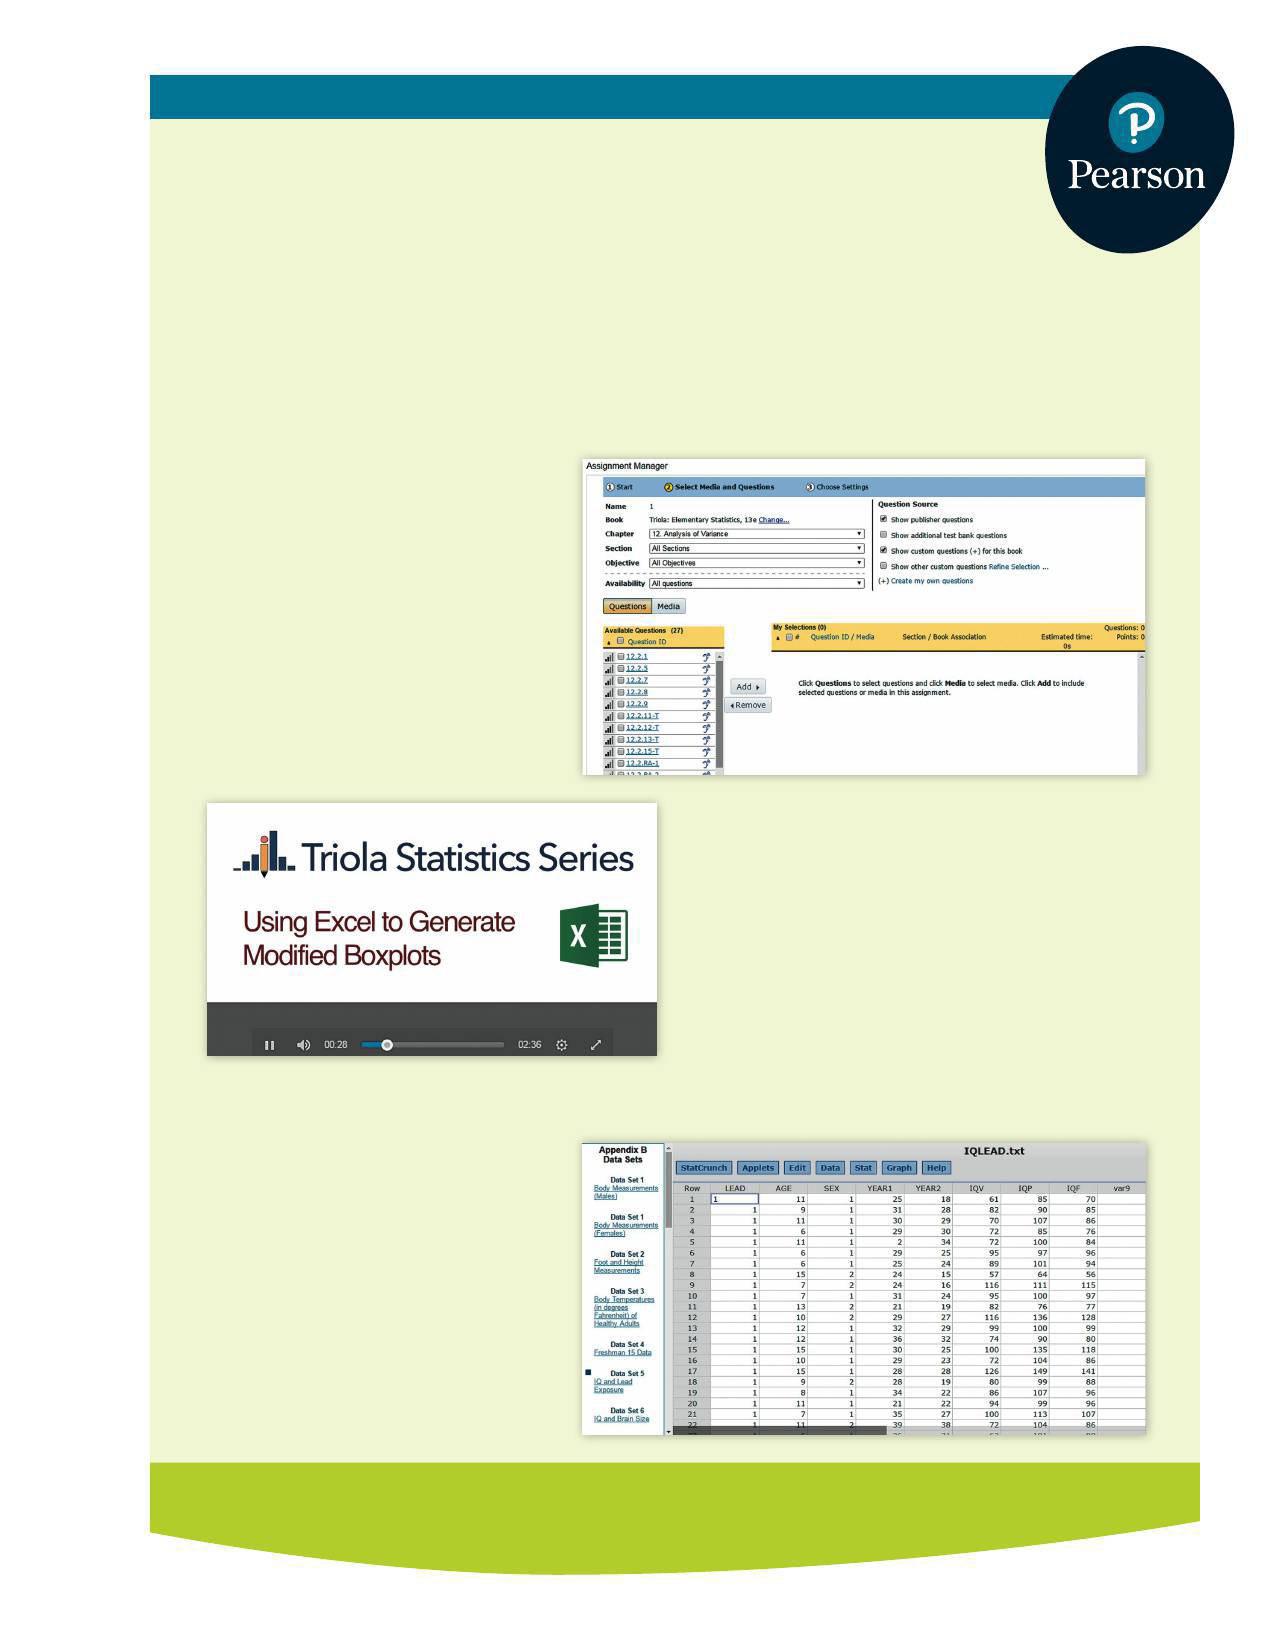
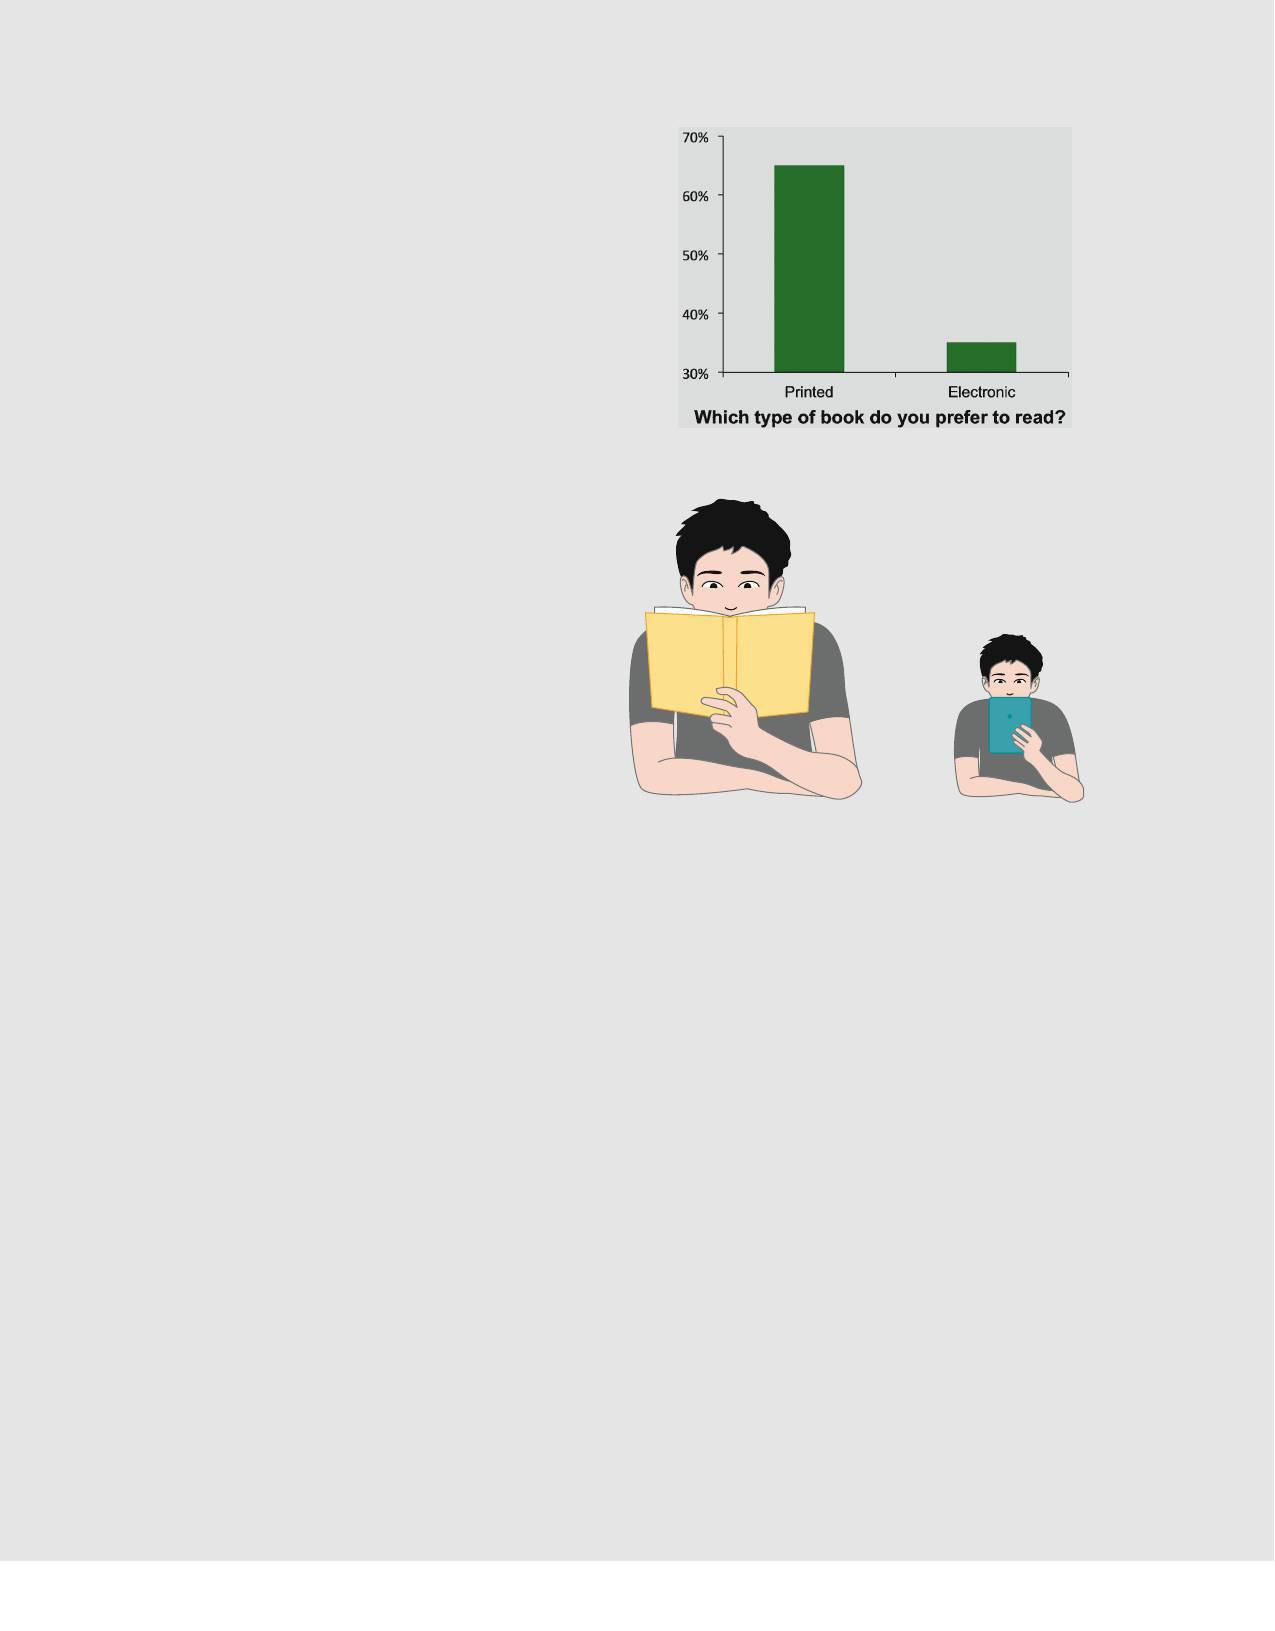
Survey Question: Do you prefer to read a printed book or an electronic book?
Surveys provide data that enable us to improve products or services. Surveys guide political candidates, shape business practices, influence social media, and affect many aspects of our lives. Surveys give us insight into the opinions and views of others. Let’s consider one USA Today survey in which respondents were asked if they prefer to read a printed book or an electronic book. Among 281 respondents, 65% preferred a printed book and 35% preferred an electronic book. Figure 1-1 on the next page includes graphs that depict these results.
The survey results suggest that people overwhelmingly prefer reading printed books to reading ebooks. The graphs in Figure 1-1 visually depict the survey results, and they support a claim that people prefer printed books to ebooks by a wide margin. One of the most important objectives in this book is to encourage the use of critical thinking so that such results are not blindly accepted. We might question whether the survey results are valid. Who conducted the survey? How were respondents selected? Do the graphs in Figure 1-1
depict the results well, or are those graphs somehow misleading?
The survey results presented here have major flaws that are among the most commonly used, so they are especially important to recognize. Here are brief descriptions of each of the major flaws:
Flaw 1: Misleading Graphs
The bar chart in Figure 1-1(a) is very deceptive. By using a vertical scale that does not start at zero, the difference between the two percentages is grossly exaggerated. Figure 1-1(a) makes it appear that about eight times as many people choose a printed book over an ebook, but with response rates of 65% and 35%, that ratio is very roughly 2:1, not 8:1.
The illustration in Figure 1-1(b) is also deceptive. Again, the difference between the actual response rates of 65% for printed books and 35% for ebooks is a difference that is grossly distorted. The picture graph (or “pictograph”) in Figure 1-1(b) makes it appear that people prefer printed books to ebooks by a ratio of roughly 4:1 instead of being the correct ratio of 65:35, or roughly 2:1. (Objects with area or volume can distort perceptions because they can be drawn to be disproportionately larger or smaller than the data indicate.)
Deceptive graphs are discussed in more detail in Section 2-3, but we see here that the illustrations in Figure 1-1 grossly exaggerate the preference for printed books.
Flaw 2: Bad Sampling Method
The aforementioned survey responses are from a USA Today survey of Internet users. The survey question was posted on a website and Internet users decided whether to respond. This is an example of a voluntary response sample—a sample in which respondents themselves decide whether to participate. With a voluntary response sample, it often happens that those with a strong interest in the topic are more likely to participate, so the results are very questionable. In this case, it is reasonable to suspect that Internet users might prefer ebooks at a rate higher than the rate in the general population. When using sample data to learn something about a population, it is extremely important to obtain sample data that are representative of the population from which the data are drawn. As we proceed
through this chapter and discuss types of data and sampling methods, we should focus on these key concepts:
• Sample data must be collected in an appropriate way, such as through a process of random selection.
• If sample data are not collected in an appropriate way, the data may be so completely useless that no amount of statistical torturing can salvage them.
It would be easy to accept the preceding survey results and blindly proceed with calculations and statistical analyses, but we would miss the two critical flaws described above. We could then develop conclusions that are fundamentally wrong and misleading. Instead, we should develop skills in statistical thinking and critical thinking so that we can understand how the survey is so seriously flawed.
78%: The percentage of female veterinarian students who are women, according to The Herald in Glasgow, Scotland.
We begin with some very basic definitions.
DEFINITIONS
Data are collections of observations, such as measurements, genders, or survey responses. (A single data value is called a datum, a term rarely used. The term “data” is plural, so it is correct to say “data are . . .” not “data is . . .”)
Statistics is the science of planning studies and experiments; obtaining data; and organizing, summarizing, presenting, analyzing, and interpreting those data and then drawing conclusions based on them.
A population is the complete collection of all measurements or data that are being considered. Typically, a population is the complete collection of data that we would like to make inferences about.
A census is the collection of data from every member of the population.
A sample is a subcollection of members selected from a population.
Because populations are often very large, a common objective of the use of statistics is to obtain data from a sample and then use those data to form a conclusion about the population.
EXAMPLE 1 Residential Carbon Monoxide Detectors
In the journal article “Residential Carbon Monoxide Detector Failure Rates in the United States” (by Ryan and Arnold, American Journal of Public Health, Vol. 101, No. 10), it was stated that there are 38 million carbon monoxide detectors installed in the United States. When 30 of them were randomly selected and tested, it was found that 12 of them failed to provide an alarm in hazardous carbon monoxide conditions. In this case, the population and sample are as follows:
Population: All 38 million carbon monoxide detectors in the United States Sample: The 30 carbon monoxide detectors that were selected and tested
The objective is to use the sample data as a basis for drawing a conclusion about the population of all carbon monoxide detectors, and methods of statistics are helpful in drawing such conclusions.
YOUR TURN
Do part (a) of Exercise 2 “Reported Versus Measured.”
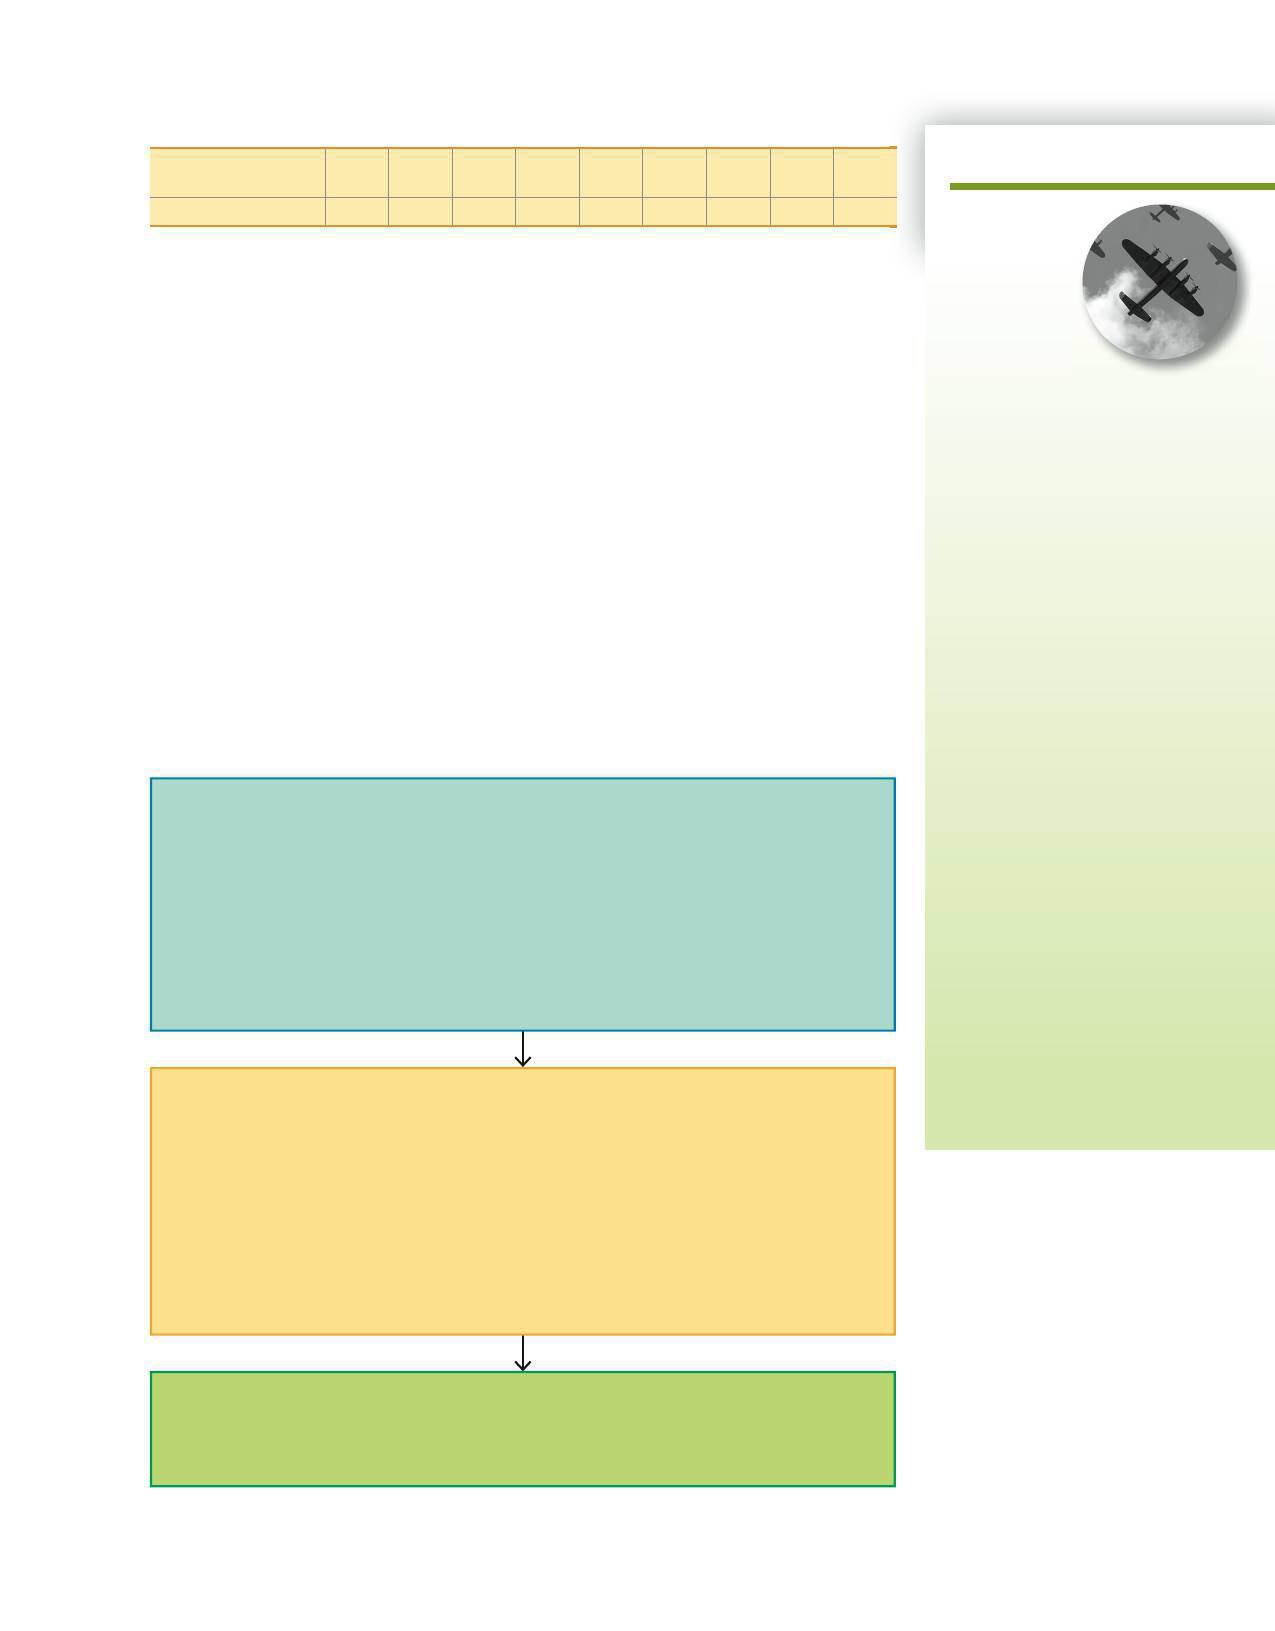
We now proceed to consider the process involved in a statistical study. See Figure 1-2 for a summary of this process and note that the focus is on critical thinking, not mathematical calculations. Thanks to wonderful developments in technology, we have powerful tools that effectively do the number crunching so that we can focus on understanding and interpreting results.
Prepare
Context Figure 1-2 suggests that we begin our preparation by considering the context of the data, so let’s start with context by considering the data in Table 1-1. Table 1-1 includes the numbers of registered pleasure boats in Florida (tens of thousands) and the numbers of manatee fatalities from encounters with boats in Florida for each of several recent years. The format of Table 1-1 suggests the following goal: Determine whether there is a relationship between numbers of boats and numbers of manatee deaths from
TABLE 1-1 Pleasure Boats and Manatee Fatalities from Boat Encounters
Pleasure Boats
(tens of thousands)
Manatee Fatalities
999997959090879090
927390978388817368
boats. This goal suggests a reasonable hypothesis: As the numbers of boats increase, the numbers of manatee deaths increase.
Source of the Data The second step in our preparation is to consider the source (as indicated in Figure 1-2). The data in Table 1-1 are from the Florida Department of Highway Safety and Motor Vehicles and the Florida Marine Research Institute. The sources certainly appear to be reputable.
Sampling Method Figure 1-2 suggests that we conclude our preparation by considering the sampling method. The data in Table 1-1 were obtained from official government records known to be reliable. The sampling method appears to be sound. Sampling methods and the use of randomization will be discussed in Section 1-3, but for now, we stress that a sound sampling method is absolutely essential for good results in a statistical study. It is generally a bad practice to use voluntary response (or self-selected) samples, even though their use is common.
Prepare
1. Context
• What do the data represent?
• What is the goal of study?
2. Source of the Data
• Are the data from a source with a special interest so that there is pressure to obtain results that are favorable to the source?
3. Sampling Method
• Were the data collected in a way that is unbiased, or were the data collected in a way that is biased (such as a procedure in which respondents volunteer to participate)?
Analyze
1. Graph the Data
2. Explore the Data
• Are there any outliers (numbers very far away from almost all of the other data)?
• What important statistics summarize the data (such as the mean and standard deviation described in Chapter 3)?
• How are the data distributed?
• Are there missing data?
• Did many selected subjects refuse to respond?
3. Apply Statistical Methods
• Use technology to obtain results.
1. Significance
Conclude
• Do the results have statistical significance?
• Do the results have practical significance?
FIGURE 1-2
Survivorship Bias
In World War II, statistician Abraham Wald saved many lives with his work on the Applied Mathematics Panel. Military leaders asked the panel how they could improve the chances of aircraft bombers returning after missions. They wanted to add some armor for protection, and they recorded locations on the bombers where damaging holes were found. They reasoned that armor should be placed in locations with the most holes, but Wald said that strategy would be a big mistake. He said that armor should be placed where returning bombers were not damaged. His reasoning was this: The bombers that made it back with damage were survivors, so the damage they suffered could be survived. Locations on the aircraft that were not damaged were the most vulnerable, and aircraft suffering damage in those vulnerable areas were the ones that did not make it back. The military leaders would have made a big mistake with survivorship bias by studying the planes that survived instead of thinking about the planes that did not survive.
Go Figure
17%: The percentage of U.S. men between 20 and 40 years of age and taller than 7 feet who play basketball in the NBA.
Origin of “Statistics”
The word statistics is derived from the Latin word status (meaning “state”). Early uses of statistics involved compilations of data and graphs describing various aspects of a state or country. In 1662, John Graunt published statistical information about births and deaths. Graunt’s work was followed by studies of mortality and disease rates, population sizes, incomes, and unemployment rates. Households, governments, and businesses rely heavily on statistical data for guidance. For example, unemployment rates, inflation rates, consumer indexes, and birth and death rates are carefully compiled on a regular basis, and the resulting data are used by business leaders to make decisions affecting future hiring, production levels, and expansion into new markets.
DEFINITION
A voluntary response sample (or self-selected sample) is one in which the respondents themselves decide whether to be included.
The following types of polls are common examples of voluntary response samples. By their very nature, all are seriously flawed because we should not make conclusions about a population on the basis of samples with a strong possibility of bias:
■ Internet polls, in which people online can decide whether to respond
■ Mail-in polls, in which people can decide whether to reply
■ Telephone call-in polls, in which newspaper, radio, or television announcements ask that you voluntarily call a special number to register your opinion
The Chapter Problem involves a USA Today survey with a voluntary response sample. See also the following Example 2.
EXAMPLE 2 Voluntary Response Sample
The ABC television show Nightline asked viewers to call with their opinion about whether the United Nations headquarters should remain in the United States. Viewers then decided themselves whether to call with their opinions, and 67% of 186,000 respondents said that the United Nations should be moved out of the United States. In a separate and independent survey, 500 respondents were randomly selected and surveyed, and 38% of this group wanted the United Nations to move out of the United States. The two polls produced dramatically different results. Even though the Nightline poll involved 186,000 volunteer respondents, the much smaller poll of 500 randomly selected respondents is more likely to provide better results because of the far superior sampling method.
Analyze
Figure 1-2 indicates that after completing our preparation by considering the context, source, and sampling method, we begin to analyze the data.
Graph and Explore An analysis should begin with appropriate graphs and explorations of the data. Graphs are discussed in Chapter 2, and important statistics are discussed in Chapter 3.
Apply Statistical Methods Later chapters describe important statistical methods, but application of these methods is often made easy with technology (calculators and > or statistical software packages). A good statistical analysis does not require strong computational skills. A good statistical analysis does require using common sense and paying careful attention to sound statistical methods.
Conclude
Figure 1-2 shows that the final step in our statistical process involves conclusions, and we should develop an ability to distinguish between statistical significance and practical significance.
Fraction u Percentage: To convert from a fraction to a percentage, divide the denominator into the numerator to get an equivalent decimal number; then multiply by 100%. This example shows that the fraction 3 > 4 is equivalent to 75%: 3
4 = 0.75 S 0.75 * 100% = 75%
Percentage u Decimal: To convert from a percentage to a decimal number, replace the % symbol with division by 100. This example shows that 85% is equivalent to 0.85:
1-1 Basic Skills and Concepts
Statistical Literacy and Critical Thinking
1. Online Medical Info USA Today posted this question on its website: “How often do you seek medical information online?” Of 1072 Internet users who chose to respond, 38% of them responded with “frequently.” What term is used to describe this type of survey in which the people surveyed consist of those who decided to respond? What is wrong with this type of sampling method?
2. Reported Versus Measured In a survey of 1046 adults conducted by Bradley Corporation, subjects were asked how often they wash their hands when using a public restroom, and 70% of the respondents said “always.”
a. Identify the sample and the population.
b. Why would better results be obtained by observing the hand washing instead of asking about it?
3. Statistical Significance Versus Practical Significance When testing a new treatment, what is the di erence between statistical significance and practical significance? Can a treatment have statistical significance, but not practical significance?
4. Correlation One study showed that for a recent period of 11 years, there was a strong correlation (or association) between the numbers of people who drowned in swimming pools and the amounts of power generated by nuclear power plants (based on data from the Centers for Disease Control and Prevention and the Department of Energy). Does this imply that increasing power from nuclear power plants is the cause of more deaths in swimming pools? Why or why not?
Consider the Source. In Exercises 5–8, determine whether the given source has the potential to create a bias in a statistical study.
5. Physicians Committee for Responsible Medicine The Physicians Committee for Responsible Medicine tends to oppose the use of meat and dairy products in our diets, and that organization has received hundreds of thousands of dollars in funding from the Foundation to Support Animal Protection.
6. Arsenic in Rice Amounts of arsenic in samples of rice grown in Texas were measured by the Food and Drug Administration (FDA).
7. Brain Size A data set in Appendix B includes brain volumes from 10 pairs of monozygotic (identical) twins. The data were collected by researchers at Harvard University, Massachusetts General Hospital, Dartmouth College, and the University of California at Davis.
8. Chocolate An article in Journal of Nutrition (Vol. 130, No. 8) noted that chocolate is rich in flavonoids. The article notes “regular consumption of foods rich in flavonoids may reduce the risk of coronary heart disease.” The study received funding from Mars, Inc., the candy company, and the Chocolate Manufacturers Association.
Sampling Method. In Exercises 9–12, determine whether the sampling method appears to be sound or is flawed.
9. Nuclear Power Plants In a survey of 1368 subjects, the following question was posted on the USA Today website: “In your view, are nuclear plants safe?” The survey subjects were Internet users who chose to respond to the question posted on the electronic edition of USA Today
10. Clinical Trials Researchers at Yale University conduct a wide variety of clinical trials by using subjects who volunteer after reading advertisements soliciting paid volunteers.
11. Credit Card Payments In an AARP, Inc. survey of 1019 randomly selected adults, each was asked how much credit card debt he or she pays o each month.
12. Smartphone Usage In a survey of smartphone ownership, the Pew Research Center randomly selected 1006 adults in the United States.
Statistical Significance and Practical Significance. In Exercises 13–16, determine whether the results appear to have statistical significance, and also determine whether the results appear to have practical significance.
13. Diet and Exercise Program In a study of the Kingman diet and exercise program, 40 subjects lost an average of 22 pounds. There is about a 1% chance of getting such results with a program that has no e ect.
14. MCAT The Medical College Admissions Test (MCAT) is commonly used as part of the decision-making process for determining which students to accept into medical schools. To test the e ectiveness of the Siena MCAT preparation course, 16 students take the MCAT test, then they complete the preparatory course, and then they retake the MCAT test, with the result that the average (mean) score for this group rises from 25 to 30. There is a 0.3% chance of getting those results by chance. Does the course appear to be e ective?
15. Gender Selection In a study of the Gender Aide method of gender selection used to increase the likelihood of a baby being born a girl, 2000 users of the method gave birth to 980 boys and 1020 girls. There is about a 19% chance of getting that many girls if the method had no e ect.
16. IQ Scores Most people have IQ scores between 70 and 130. For $39.99, you can purchase a PC or Mac program from HighIQPro that is claimed to increase your IQ score by 10 to 20 points. The program claims to be “the only proven IQ increasing software in the brain training market,” but the author of your text could find no data supporting that claim, so let’s suppose that these results were obtained: In a study of 12 subjects using the program, the average increase in IQ score is 3 IQ points. There is a 25% chance of getting such results if the program has no e ect.
In Exercises 17–20, refer to the sample of body temperatures (degrees Fahrenheit) in the table below. (The body temperatures are from a data set in Appendix B.)