
Hire our experts for the best online economics exam help To get more info, Please Contact Us : – +1 678 648 4277 or Visit : – www.economicshomeworkhelper.com E-Mail : – info@economicshomeworkhelper.com


Zero fish - In producing the first 5 coconuts, we shift from (0,20) to (5,20). Fish production does not decrease, so the opportunity cost (and slope on the PPF) is 0. economicshomeworkhelper.com
a) What is the opportunity cost of producing the first 5 coconuts?
1. Dale, Geraldine, Monroe, and Grover can split their time between fishing and gathering coconuts. Their production possibilities are reflected by the joint PPF below.
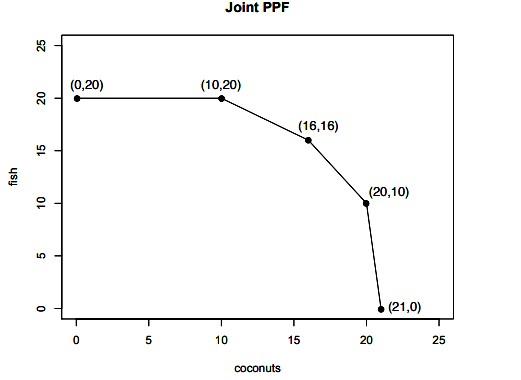
b) What is the opportunity cost of producing the first 2 fish? 2/10 coconuts - In producing the first 2 fish, we shift from (21,0) to (20.8,2). Coconut output falls by 0.2. The slope of the last segment is -10, meaning the opportunity cost of a coconut is 10 fish. This implies the opportunity cost of one fish is 1/10 coconuts. This opportunity cost doesn’t change for the relevant range here, so the opportunity cost of 2 fish is 2/10 coconuts.
d) How many fish can Geraldine catch if she spends all of her time fishing? 6 fish economicshomeworkhelper.com
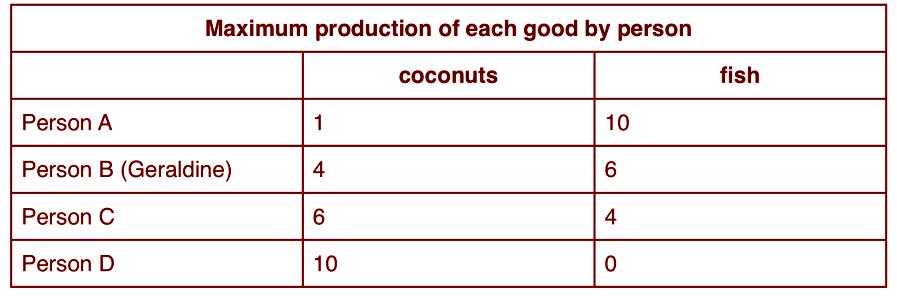
c) If Geraldine has the second lowest opportunity cost of producing fish, what is her opportunity cost for gathering one coconut? 3/2 fish - From the labeled points we can construct the table shown below. Each segment on the joint PPF shows one person’s productive possibilities. If Geraldine has the second lowest opportunity cost of producing fish, she will also have the third lowest opportunity cost of coconuts. Examining the table, Person B must be Geraldine. Alternatively, the person with the third lowest opportunity cost of coconuts will give us the segment between (16,16) and (20,10).
2. Nowhereland is an island economy with population of 4 – Alice, Bob, Catherine and David. Everyday there are two survival activities under the northerly Sea of Ferocity: catching jellyfish and collecting seaweed. Both activities involve open water diving, requiring the use of an oxygen tank. Thus, a special kind of capital called “oxygen tank” is used in the production of these two goods. Each person possesses a different amount of oxygen tanks. The following table shows how many oxygen tanks each person has and how many are needed to produce each unit of the delicacies: economicshomeworkhelper.com
Alice Bob Cathy David Oxygen Tank Possessed (Tanks) 6 10 8 15 Catching (Tank/Jellyfish)Jellyfish 1 2 2 5 Collecting (Tank/Seaweed)Seaweed 3 5 2 3 a) If everyone decides to catch jellyfish only, how many jellyfish can all of them produce? If everyone decides to collect seaweed only, how many seaweed can all of them Ifproduce?alldecides to catch jellyfish – Alice, Bob, Cathy and David will catch 6, 5, 4 and 3 jellyfishes, respectively or a total of 18 jellyfish. Similarly, if all decides to collect seaweed – they will collect 2, 2, 4 and 5 seaweeds, respectively or a total of 15 seaweeds. economicshomeworkhelper.com
b) What are the opportunity costs of catching jellyfish for each person? What are the opportunity costs of collecting seaweed for each person? Put your answers in the following table. Opportunity Cost for a Jellyfish Opportunity Cost for a Seaweed DavidCathyAliceBob The logic is as follows: Alice faces a tradeoff of either “6 jellyfishes and 0 seaweed” or “0 jellyfish and 2 seaweeds.” Hence, for Alice, the opportunity cost of a jellyfish is 2/6 = 0.33 seaweed/jellyfish (gives up 2 seaweeds for 6 jellyfishes) and the opportunity cost of a seaweed is 6/2 = 3 jellyfishes/seaweed (gives up 6 jellyfishes for 2 seaweeds). The similar logic applies to the rest of the population. Here’s the completed table. economicshomeworkhelper.com
Opportunity Cost for a Jellyfish Opportunity Cost for a Seaweed Alice 0.33 Seaweed/Jellyfish 3 Jellyfishes/Seaweed Bob 0.4 Seaweed/Jellyfish 2.5 Jellyfishes/Seaweed Cathy 1 Seaweed/Jellyfish 1 Jellyfish/Seaweed David 1.67 Seaweed/Jellyfish 0.6 Jellyfish/Seaweed c) Who has the absolute advantage in catching jellyfish/collecting seaweed? Who has the comparative advantage in catching jellyfish/collecting seaweed? There is a catch here! (1) Note that the table gives “the number of oxygen tanks required to complete a task, not the amount of task they can do. (2) Notice that each person has unequal amount of oxygen tanks. Hence, we need to normalize the amount of resources each person has, i.e., assuming that each has an equal amount of resources, ask how many they can produce. Let’s choose 60 tanks to equate the number of oxygen tanks each person has, so the following table shows how many jellyfishes and seaweeds can be caught and collected. economicshomeworkhelper.com
Alice Bob Cathy David Oxygen Tanks 6 × 10 = 60 10 × 6 = 60 8 × 7.5 = 60 15 × 4 = 60 JellyfishCaught 6 × 10 = 60 5 × 6 = 30 4 × 7.5 = 30 3 × 4 = 12 CollectedSeaweed 2 × 10 = 20 2 × 6 = 12 4 × 7.5 = 30 5 × 4 = 20 With the same amount of resources, clearly Alice has the absolute advantage in catching jellyfish and Cathy has the absolute advantage in collecting seaweed. Using the table in part b), since Alice has the least opportunity cost of catching a jellyfish by forgoing only 0.33 seaweed, she also has the comparative advantage in catching a jellyfish. Similarly, David has the least opportunity cost of collecting seaweed; thus, he has the comparative advantage in collecting seaweed. d) Determine the acceptable range of trading price for 1 jellyfish in terms of number of seaweed. Determine the acceptable range of trading prices for 1 seaweed in terms of number of jellyfish. economicshomeworkhelper.com
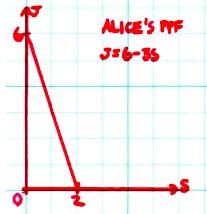
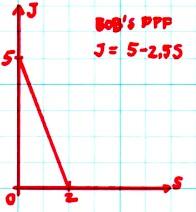
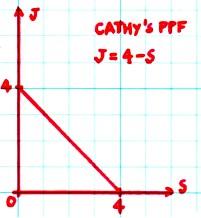
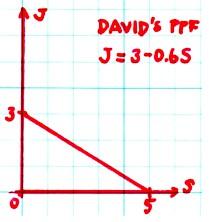
The acceptable range of trading price is the difference of the lowest and highest opportunity costs in doing something. Hence, the acceptable range of trading price for 1 jellyfish is between [0.33 Seaweed, 1.67 Seaweeds] and for 1 seaweed is between [0.6 Jellyfish, 3 Jellyfishes]. e) Label Seaweed (S) and Jellyfish (J) on the x-axis and y-axis, respectively. Give the equations for the PPFs of each person and plot separately. The equations for individual PPF are: Alice J = 6 – 3S Bob J = 5 – 2.5S Cathy J = 4 – S David J = 3 – 0.6S f) Draw the joint PPF for Nowhereland. Clearly mark and give the locations of the kink points. Write down the equation for each segment of the joint PPF. economicshomeworkhelper.com
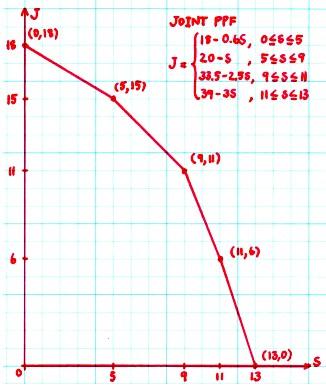
This is not a trick or math question! Just simple economic logic is more than enough. To draw a joint PPF, one needs to know the total seaweeds and jellyfishes everyone can produce if they join together. The maximum amount of seaweeds collected is 2 + 2 + 4 + 5 = 13. The maximum amount of jellyfishes caught is 6 + 5 + 4 + 3 = 18. Now, the intuition - start off at the position of 18 Jellyfishes and 0 Seaweed. If the economy wishes to obtain the first unit of Seaweed, they must ask who has the least opportunity cost of forgoing the jellyfish to collect seaweed. Clearly David has the least opportunity cost of collecting seaweed since he needs to forgo only 0.6 Jellyfish, so he should be the first person to collect seaweed. You have the first portion of joint PPF and he can continue to collect up to 5 seaweeds, at this point, the economy has 5 seaweeds and 15 jellyfishes. However, if the economy wants the 6th seaweed, David cannot collect anymore since he has exhausted all his capacity; thus, the next person in line to collect seaweed must be Cathy since she has the second lowest opportunity cost of collecting seaweed. She can collect at most 4 seaweeds. At this point, combined with David’s seaweeds, the economy has 9 seaweeds and 11 jellyfishes. The analysis for the rest repeats the same intuition until the economy arrives at 13 seaweeds. The joint PPF is shown below: The equation of joint PPF for each portion is simply equations of lines. One may simply derive from y = mx + c where m is the slope of each portion of individual PPF (as aforementioned, representing the opportunity cost) and c is a constant term determined by substituting each production combination. Hence, the equation of joint PPF is: economicshomeworkhelper.com
18 – 0.6S if 0 ≤ S ≤ 5 J = 20 – S if 5 ≤ S ≤ 9 33.5 – 2.5S if 9 ≤ S ≤ 11 39 – 3S if 11 ≤ S ≤ 13 economicshomeworkhelper.com
3. Use the demand and supply framework to qualitatively analyze the market in each of the scenarios given in a) through f). How would the demand and/or supply curves shift? (Leftward/rightward/no shift) What are the effects on equilibrium price and quantity? (Increase/decrease/ambiguous) Summarize the result in the following table format: Market Demand Curve Supply Curve EquilibriumPrice EquilibriumQuantity a) Bubble Tea b) SmoothiesFruit c) MicrowaveMeal d) WisconsinCheese e) jPhone Smartphone6 f) Exotic Cars economicshomeworkhelper.com
e) Banana Inc. introduces the latest incarnation of its smartphone, the jPhone 6. A flood of consumers rush to order this famous smartphone. At the same time; however, the production line of Banana Inc. is plagued by riots, cutting production in half.
f) The economic slump and oil shocks have caused consumers to delay excessive spending, particularly, the purchase of exotic supercars. Automobile firms correctly anticipate the economic crisis and cut down production of exotic models. Answers: economicshomeworkhelper.com
d) Wisconsin produces fine cheese using cow's milk; however, mad cow disease has wiped out half the population of cows in Wisconsin.
a) A recent study claims that the tapioca pearls in bubble tea are linked to increase risk for cancer, creating fear among consumers.
c) Teaching assistants consider microwaveable meals an inferior good. This semester, they are greeted with bad news as the Department of Economics cuts their stipends by 15%.
b) In addition to the study report in a), you are also told that fruit smoothies are good alternatives to bubble tea. At the same time, you know that the extended summer has invigorated fruit harvests.
Market CurveDemand CurveSupply EquilibriumPrice EquilibriumQuantity a) Bubble Tea Leftward No Shift Decrease Decrease b) SmoothiesFruit Rightward Rightward Ambiguous Increase c) MicrowaveMeal Rightward No Shift Increase Increase d) WisconsinCheese No Shift Leftward Increase Decrease e) jPhone Smartphone6 Rightward Leftward Increase Ambiguous f) Exotic Cars Leftward Leftward Ambiguous Decrease 4. Consider the market for gasoline in Dane County, Wisconsin. Units of quantity and price are in Thousands of Gallons and $/gallon, respectively. Suppose the gasoline demand is given by: economicshomeworkhelper.com
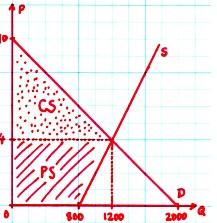
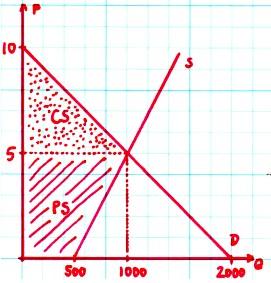
Qd = 2000 – 200P where Qd = Quantity Demanded and P = Price We have the following information about the linear supply function: • Market research shows that for an increase in price by $1/gallon, quantity supplied increases by 100 thousand gallons; • In addition, when the price is $1/gallon, 900 thousand gallons of gasoline are supplied to Dane County. a) Use the information to find the supply function, i.e., determine a and b in Qs = a + bP where Qs is Quantity Supplied and P is Price. (Hint: What is the equation of a line?) We have a slope and a point, determine the line from Qs – 900 = 100(P – 1), so the supply function is Qs = 100P + 800, so a = 800 and b = 100. b) Plot the demand and supply curve with Quantity on x-axis and Price on y-axis. Clearly write the intercepts on both axes, and denote the area of consumer surplus and producer surplus. We have demand and supply function, rewrite the equations to draw the demand and supply curve as: P = 10 – (1/200)Qd and P = – 8 + (1/100)Qs , respectively. Consumer surplus is the area under demand curve above the equilibrium price. economicshomeworkhelper.com
surplus is the area under demand curve above the equilibrium price. Producer surplus is the area above supply curve above zero-axis in both quantity and price (i.e. it is not the usual triangle but a trapezoid!) under the equilibrium price. c) Find the equilibrium price and quantity and the value of consumer and producer surplus. From the demand and supply functions, quantity demanded and quantity supplied must be equal at equilibrium. Equate the two to have Qd = Qs , so 2000 – 200P = 100P + 800, the equilibrium price is P = $4/gallon. The equilibrium quantity follows from Q = 2000 –200(4) = 1200 thousands of gallons. The consumer surplus is calculated from the triangle ½ × (1200) × (10 – 4) = 3600 thousands of dollars. The producer surplus is calculated from the trapezoid ½ × (1200 + 800) × 4 = 4000 thousands of dollars. economicshomeworkhelper.com
Suppose there is a pipeline rupture in the Midwest, causing a gasoline shortage. Engineers have determined that pipeline capacity is reduced by 300 thousand gallons –meaning that, at every price level, there are 300 thousand fewer gallons of gasoline supplied to Dane County. d) Which curve (demand or supply) is shifted? Which direction (leftward or rightward)? Since the quantity supplied at each price decreased, this means that the supply curve is shifted leftward. e) Determine the equation (demand function or supply function) of the shifted curve. Take the supply function from part a), since at every price, quantity supplied is decreased by 300 thousand gallons. So Qs = 100P + (800 – 300) = 100P + 500. The shifted supply curve is given by: P = – 5 + (1/100)Qs . f) Draw the demand and supply curve after the pipeline rupture, clearly compare the shifts. economicshomeworkhelper.com
g) Determine the equilibrium price and quantity and calculate the value of consumer and producer surplus after the pipeline rupture. From the demand function and the shifted supply function, quantity demanded and quantity supplied must be equal at equilibrium. Equate the two to receive that Qd = Qs ; hence, 2000 – 200P = 100P + 500, the equilibrium price is P = $5/gallon. The equilibrium quantity follows from Q = 2000 – 200(5) = 1000 thousands of gallons. Consumer surplus is calculated from the triangle ½ × (1000) × (10 – 5) = 2500 thousands of dollars. Producer surplus is calculated from the trapezoid ½ × (1000 + 500) × 5 = 3750 thousands of dollars. economicshomeworkhelper.com