Contactinformation
LucAlaerts managerPolicyResearchCenter
luc.alaerts@kuleuven.be +3216324969
Impactsofcirculareconomyon climatetargets:M-levelin constructionandrenovation
MaartenChristis AnVercalsteren DamienTrigaux
JorenMijnendonckx VITO
Boeretang200,2400Mol,Belgium November2024
CECenterpublicationN°27
GwennyThomassen managerPolicyResearchCenter gwenny.thomassen@ugent.be
KarelVanAcker promoterPolicyResearchCenter karel.vanacker@kuleuven.bei +3216321271
Samenvatting IndezepotentieelstudiewerdheteffectvandeintroductievaneenM-peilopdemilieu-impact vannieuwbouwenrenovatievanresidentiëlegebouweninVlaanderenonderzocht.HetMpeilisdemaximaletotalemilieuimpactvaneengebouwenisgebaseerdopdegebruikte bouwmaterialen:hetkandusdienenalsstimulansombouwmaterialenmetlagereimpactte gebruiken.Nieuwbouwenrenovatievergenveelbouwmaterialen,zekerinhetlichtvanhet behalenvandeklimaatdoelstellingen.Dezebouwmaterialenhebbenevenwelookeenimpact dieinrekeninggebrachtmoetworden.DestudiemodelleertdeintroductievaneenM-peilvia hetgebruikvanbouwmaterialenmetlagereimpactenillustreertdatdekoolstofemissiesen detotalemilieuimpactvannieuwbouwendoorgedrevenrenovatievanresidentiëlewoningen lagerkunnenuitvallendandehuidigepraktijken.
DezestudieberekentheteffectvandeimpactvandeinvoeringvaneenM-peil,zowel territoriaal(impactinVlaanderen)alsglobaal(consumptieperspectief).Hetuitgangspuntis enerzijdseenbusiness-as-usualscenarioenanderzijdseenscenariometeensterkverhoogde inzetoprenovatieomtevoldoenaandeklimaatdoelstellingen.Eenderdeenvierdescenario bouwenhieropverderenvoereneenM-peilinrespectievelijkvoorenkelnieuwbouwenvoor zowelnieuwbouwalsrenovaties.HeteffectvandeintroductievanhetM-peilwordtindeze studiegesimuleerddoorvoorbouwelementen(bijvoorbeeldeendak,buitenmuurofraam) alternatieventezoekenmetdelaagstemilieu-impact.
Deresultatengevendeemissiesvanbroeikasgassenweer,alsookeenbrederekijkopdetotale milieu-impactalseencombinatievanzestienimpactcategorieën.Meerenergetischrenoveren veroorzaakteenstijgingvandebroeikasgasemissiesendetotalemilieu-impactmetruwweg eenderde,zowelinVlaanderenalsglobaal.DoorinvoeringvanhetM-peilvoornieuwbouwkan dezestijgingtenietgedaanworden,enzelfswordenomgekeerdalshetM-peilookvoor renovatiesingevoerdwordt:deimpactvandoorgedrevenrenoverenmetinvoeringvaneenMpeilvaltduslageruitdandeimpactvandehuidigepraktijken.VanuitVlaamsperspectiefliggen debroeikasgasemissiesentotalemilieu-impactdanrespectievelijk26en41%lagertenopzichte vanhetscenariometverhoogdeinzetoprenoverenmaarzonderM-peil.Detotalereductievan broeikasgasemissiesdoordeinvoeringvanhetM-peilvoorconstructieenrenovatievoorde Vlaamsenon-ETSsectorwordtgeschatopca.146kilotonCO2-eqperjaar;dewinstopvlakvan milieu-impactenwordtgeschatopca.9000puntenperjaar.Wanneerdeimpactbuiten Vlaandereninrekeninggebrachtwordt,vallendeeffectennogsterkeruit:ervindtdus allesbehalveeenburdenshiftingplaats.
Summary Inthisexploratorystudy,theeffectoftheintroductionofaso-calledM-levelonthe environmentalimpactofnewconstructionandrenovationofresidentialbuildingsinFlanders wasinvestigated.TheM-levelisthemaximumtotalenvironmentalimpactofabuildingand isbasedonthebuildingmaterialsused:itcanthereforeserveasanincentivetousebuilding materialswithalowerimpact.Newconstructionandrenovationrequirealotofbuilding materials,especiallyinlightofachievingtheclimateobjectives.Thesebuildingmaterialsalso haveanimpactthatmustbetakenintoaccount.ThestudymodelstheintroductionofanMlevelthroughtheuseoflowerimpactbuildingmaterialsandillustratesthatthecarbon emissionsandtotalenvironmentalimpactofnewconstructionandextensiverenovationof residentialhomescanbelowerthancurrentpractices.
ThisstudycalculatestheeffectoftheimpactoftheintroductionofanM-level,bothterritorially (impactinFlanders)andglobally(consumptionperspective).Thestartingpointisontheone handabusiness-as-usualscenarioandontheotherhandascenariowithagreatlyincreased focusonrenovationtomeettheclimateobjectives.Athirdandfourthscenariobuildfurtheron thisandintroduceanM-levelrespectivelyfornewconstructiononlyandforbothnew constructionandrenovations.TheeffectoftheintroductionoftheM-levelissimulatedinthis studybylookingforalternativebuildingelements(forexamplearoof,exteriorwallorwindow) withthelowestenvironmentalimpact.
Theresultsreflectgreenhousegasemissionsaswellasabroaderviewofthetotal environmentalimpactasacombinationofsixteenimpactcategories.Moreenergetic renovationcausesanincreaseingreenhousegasemissionsandthetotalenvironmentalimpact byroughlyathird,bothinFlandersandglobally.ByintroducingtheM-levelfornew construction,thisincreasecanbecanceledout,andevenreversediftheM-levelisalso introducedforrenovations:theimpactofextensiverenovationwiththeintroductionofanMlevelisthereforelowerthantheimpactofcurrentpractices.FromaFlemishperspective,the greenhousegasemissionsandtotalenvironmentalimpactarethenrespectively26and41% lowercomparedtothescenariowithanincreasedfocusonrenovationbutwithouttheM-level. ThetotalreductioningreenhousegasemissionsthroughtheintroductionoftheM-levelfor constructionandrenovationfortheFlemishnon-ETSsectorisestimatedatapproximately146 kilotonsofCO2-eq.peryear;thegainintermsofenvironmentalimpactsisestimatedat approximately9,000pointsperyear.WhentheimpactoutsideFlandersistakenintoaccount, theeffectsareevenstronger:aburdenshiftingishencenottakingplaceatall.
Chapter1:Contextandintroduction InternationalandEuropean1climatepolicysetsspecificandcleartargetstogreenhousegas(GHG) emissions:withatargetofclimateneutralityby2050andareductioninEuropeanGHGemissionswith 55%by2030comparedto1990.Inaregionalcontext,theFlemishClimatePolicyPlandefinestargets fortheGHGemissionsthatoccurinFlanders.OneoftheobjectivesoftheFlemishEnergyandClimate Plan2021-2030(VEKP2),whichwasapprovedin2019,wastoreducegreenhousegasemissionsinthe non-ETSsectorsby35%by2030comparedto2005.On5November2021,theFlemishGovernment decidedtoapproveapackageofadditionalmeasures,asaresultofwhichtheambitionintheVEKP 2021-2030withregardtothereductionofnon-ETSemissionswasfurtherincreasedto-40%by2030 (comparedto2005).Althoughtheplanfocusesontheterritorialemissions(inFlanders),itisstatedthat burdenshiftingshouldbeavoided.Footprint(consumption)indicatorsareconsideredtoidentify potentialrisksofburdenshifting.Indeed,animportantshareoftheclimatechangefootprintof productionandconsumptioninFlandersiscausedbyGHGemissionselsewhereandoriginatesfromall lifecycleproductionstepslikeextractionofmaterials,transportation,production,use,andendoflife ofallkindsofproducts.
"WhichadditionalmeasurescancontributetotherealisationofthecurrentFlemishEnergyandClimate Plan(VEKP)2021-2030?"isaquestionbyVEKAthatOVAMwouldliketo(partly)addressviathe implementationofamateriallevel(M-level)fortheconstructionandrenovationofbuildings.Correct figuresshouldfacilitateandsubstantiatethatchoice.
OVAMwantstofocusinthecomingyearsontheintroductionofanM-levelforconstructionworks(both constructionandrenovationofbuildings).Thepolicyprogramonconstruction“TowardsCircular Construction”(approvedbytheFlemishGovernmenton29April20223)strivestointroduceanM-level by2030.Inaddition,theFlemishgovernmentaimstoreducethematerialfootprintofFlemish consumption(broad,incl.construction)byanorderofmagnitudeof30%by20304comparedto17ton percapitain2010.
Tothisend,thisstudyfocussesontheeffectoftheintroductionofanM-levelforconstruction, demolition,andrenovationofresidentialbuildingsontheClimateChangeimpactsandthe EnvironmentalFootprint(bothdirectandindirectimpacts).
Thisstudybuildsuponthe2020reportfromthecirculareconomypolicyresearchcentre(CECenter) withthetitle“Impactofcirculareconomyonclimatetargets:casehousing”5andthefiguresand assumptionsmadeinresponsetothepreviousadjustmentoftheVEKP(2021).Apartfromanupdateof dataandmethodology,themajordifferenceisintheelaboratedscenarios.Here,weintroducethree scenarios,nexttoabusiness-as-usual(BAU)scenario.Acomparisonoftheresultsofthethree(new) scenarioswillallowtocapturetheenvironmental‘profit’resultingfromanoptimizationofmaterials usedinconstructionandrenovationofbuildings.
TheTOTEMpotentialstudy(“EstimationofthepotentialofTOTEMforenvironmentalimpact-part1”6) onthepossibleenvironmentalimpactreductionofbuildingsbyoptimizingmaterialchoices,servesasa
1Regulation(EU)2021/1119:Establishingtheframeworkforachievingclimateneutrality
2VlaamsEnergie-enKlimaatplan(VEKP)2021-2030|Vlaanderen.be(p.145).
3Beleidskeuzes(vlaanderen.be)
4Beleidsnota2014-2019.Omgeving|Vlaanderen.be;VlaamsEnergie-enKlimaatplan(VEKP)2021-2030| Vlaanderen.be
512.Impactofcirculareconomyonachievingtheclimatetargets:casehousing-Publication-Summa(vlaanderencirculair.be)
6Buildings(vlaanderen.be)
basisforcalculatingtheindirectsavingsonclimatechangeemissionsandthetotalenvironmental impact.Forexample,thestudyshowsthatthematerial-relatedenvironmentalimpactcanbereduced byapproximately30%,andthetotalenvironmentalimpactbyapproximately15%.
Table1visualisesthelevelofdetailoftheresultswhicharecalculatedforeachofthethreescenarios andtheBAU.Forexample,thecomparisonbetweenresultsofascenariowithoutandascenariowith theM-levelwillrevealtheadditionalenvironmentalgainsofimplementingthispolicymeasure.The tableshowsthedetailsoftheresultswhicharecalculatedforeachscenario:
-Adivisionbetweenconstructionofnewbuildingsandrenovation.
-AdistinctionbetweenemissionsfromETS-activitiesandnon-ETS-activities.
-Adisaggregationbetweenlocal(Flemish)emissionsandemissionoriginatingfromabroad.
Table1:Overviewofthelevelofdetailoftheresultsforclimatechangeandtheenvironmentalfootprintwhicharecalculated foreachscenario.
FlandersRest-of-world CO2,direct,usephase, representedviathe netenergydemand
(notcalculated,nodirectemissions)
non-ETS
Climatechange footprint(indirector embodied): production+ construction+EOL ETS non-ETS
Environmental footprint(indirector embodied): production+ construction+EOL ETS non-ETS
Thefollowingaspectsareoutofscope:
•Non-residentialbuildingsarenotmodelled,andinfrastructureworksarealsonotincluded, whichmeansthattheenvironmentalgainisunderestimated.
•ThemodellingoftheM-levelisbasedonreplacingnewmaterialswithothernewmaterialswith alowerimpact.Thereplacementofnewmaterialsby,forexample,reusedmaterials,oneofthe cornerstonesofmaterialpolicyinconstruction,couldleadtoafurtherreductionofthe environmentalimpact.Stillinsomespecificcasesreuseisalreadyconsidered(seeChapter3).
•Also,noaccountwastakenofanyotherinterventionsthatareoftencombinedwithanenergy renovation(e.g.changestoplanlayoutandmaterialsrequiredforthis).
•Norhasitbeenconsideredthattherecuperationofdemountableelementsandmaterials throughchange-orientedconstructioncanmeanaconsiderablesavingofmaterials,and thereforealsoamitigationofenvironmentalimpacts.
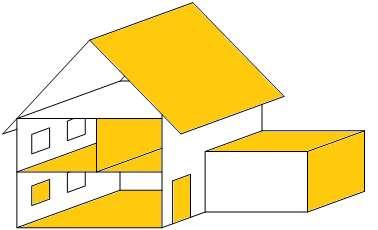
•Theinstallationandreplacementoftechnicalinstallations(e.g.,boilers),kitchens,bathrooms, etc.arenottakenintoaccount.Thescopeofconstructionandrenovationislimitedtotheimpact ofninebuildingselements(seeFigure1).Thefocusisonthestructuralelements,exceptfor foundationandinternaldoorswhichareleftoutofscope.
•Thematerialfootprintisnotassessed.
•Theproductionstage(A1-A3),theconstructionstage(A4-A5)andtheend-of-lifestage(C1-C4) areincludedinthescopeofthisstudy.Theusestage(B1-B5)isnotconsidered.Thisphase
containstheuse,maintenance,repair,replacement,andrefurbishments.Renovationsare modelledviademolitionofspecifiedelements(C1-C4)andtheproductionandconstructionof thenewelements(composedofdifferentmaterials)(A1-A5).SeeTable2formoredetails.
Thisreportfocusesontheresidentialhousingmarketexclusively,asalmosthalfoftheareaofthebuilt environmentisforresidentialuse7.Theassessmentinthisstudyisbasedonaquantitativemodelthat usesavailabledataonimpactofrenovationsofexistingdwellings(thescopeondwellingsincludesall residentialhousingunits,includingapartments)andtheconstructionofnewdwellings(includingall residentialhousingunits,includingapartments).Theassessmentstartsfromafootprintorconsumption perspectiveandthusincludestheproduction,constructionandend-of-lifestagesinthelifecycleof productsrelatedtotheconstruction/renovationofdwellings(e.g.theextractionofrawmaterials, productionofbuildingproducts,andtheirtransportationtothebuildingsite).Theusestage(B1-B5)is notconsidered:theenvironmentalimpactcausedbytheusageofabuilding,suchasregular maintenance(i.e.,fromcleaningtosmallrenovations),isexcludedfromthisassessment,asthefocusis ontheconstructionandrenovationofresidentialbuildingsandhowthiscanimpactthereductionof GHG-emissions.However,oneexceptionisthatthequantitativemodeldoesincludeamodule estimatingthenetenergyrequirementsforheatingofresidentialbuildingsinFlanders.Thereasonto includethenetenergydemandforheatingistoallowtoincludethelong-termeffectofenergetic renovationsandimprovedconstructionmethods(e.g.,betterisolation)onreducedenergydemandfor heating.Theend-of-life(C1-C4)treatmentofconstructionanddemolitionwastecausedbyrenovation, constructionandattheend-of-lifeofthedwellingsisincludedinthisstudy.Inshort,thisreportanalyses theembodiedclimatechangeemissionsandenvironmentalfootprintofrenovatingandconstructing residentialbuildingsandthenetenergyrequirementforheatingofthecurrentandprojectedhousing stockinFlanders.Thequantitativemodelstartsfromthecurrent(2022-data)situationsandincludes projectionsforthe2023-2050period.
7https://www.statistiekvlaanderen.be/bebouwde-oppervlakte
Chapter2:Dataandmethodology Thequantitativemodelcombines(historical)data,assumptions,andprojections.Themodelstartsfrom adescriptionofthecurrentsituationbasedondatadescribingtheyear2022.Theprojectionsfocuson the2023-2050period.Alldatasourcesandassumptionsareexplainedinthischapter,togetherwith theirlinktothequantitativemodel.ThemodelitselfiscompiledinanExcelfile.
Themodelcalculatestheclimatechangefootprintandenvironmentalfootprintofconstruction, renovation,anddemolition.Also,thenetenergydemandforheatingisestimated.Thedifferent modulesofthecalculationmodelaresummarisedinTable2.Thedatapermoduleisdescribedinmore detailbelow.
Table2:Themodulesofthecalculationmodel.
Element Pitchedroofandflatroof,externalwall,outsidedoor, outsidewindow,floorongrade,storeyfloor,loadbearinginternal/partywall,andnon-load-bearing internalwall = [geometricaldata] squaremetresperelement pertypeofbuilding * [inventorydata] impactperelement(i.e.the climatechangeor environmentalfootprintper squaremetre)
Sector/regionETSornon-ETS/Flandersorrest-of-world [emissiondata]
Stage Constructionofnewdwellings:productionstage(A1A3),andtransporttoandconstructiononsite(A4-A5) Renovation:end-of-lifestage(C1-C4),productionstage (A1-A3),andtransporttoandconstructiononsite(A4A5)
Typeofbuilding andbuilding period
Projection
Netenergy demandfor heating
Demolitionend-of-lifestage(C1-C4) [inventorydata]
SeeTable3. Constructionofnewdwellings:only2018isused [buildingstock] [timberframeconstruction]
Projectionofthenumberofhousingunitsin construction,renovation,anddemolitionintheperiod 2023-2050. [projections]basedon [numberofhouseholds] [permits]
Thenetenergydemand,inGWhperyear,forheating.[energy]
Atotalof44typesofbuildingsareincludedinthequantitativemodel.Thetypologyisbasedona combinationofthedatafromStatbel8,Eeckhoutsmasterthesis9andTABULA10
Table3:The44typesofbuildingsincludedinthequantitativemodel.
ConstructionperiodBuildingstyleTypeofbuilding before1945solidconstruction building:detached,semi-detached,terraced apartment:enclosed,exposed between1946and1970solidconstructionbuilding:detached,semi-detached,terraced
8Gebouwenpark|Statbel(fgov.be)
9Eeckhout,F.(2019).Developmentofenvironmentalbenchmarksforresidentialbuildings,masterthesisKU Leuven.
10BE_TABULA_TypologyBrochure_VITO.pdf(episcope.eu)
apartment:enclosed,exposed between1971and1990solidconstruction building:detached,semi-detached,terraced apartment:enclosed,exposed between1991and2005solidconstruction building:detached,semi-detached,terraced apartment:enclosed,exposed between2006and2011 solidconstruction building:detached,semi-detached,terraced apartment:enclosed,exposed timberframeconstructionbuilding:detached,semi-detached,terraced between2012and2017 solidconstruction building:detached,semi-detached,terraced apartment:enclosed,exposed timberframeconstructionbuilding:detached,semi-detached,terraced 2018andlater solidconstruction building:detached,semi-detached,terraced apartment:enclosed,exposed timberframeconstructionbuilding:detached,semi-detached,terraced
Foreachcombinationoftheconstructionperiod,thebuildingstyleandthetypeofbuilding,nine buildingelementsaredescribed:pitchedroofandflatroof,externalwall,outsidedoor,outsidewindow, floorongrade,storeyfloor,load-bearinginternal/partywall,andnon-load-bearinginternalwall.
Figure1:Highlightedpartsofthebuildingthatareincludedinthequantitativemodel.
Thequantitativemodelincludes44typesofbuildings(basedonconstructionperiod,buildingstyleand typeofbuilding).Foreachtypeninebuildingelementsareincluded.Eachbuildingelementconsistsof differentmaterials.Forexample,abuildingfromtheconstructionperiod1946-1970(solidconstruction, alltypesofbuildings)isassumedtohaveafloorongrade(i.e.abuildingelement)consistingoutof4 materials:levellinglayerofsand(180kg/m²),reinforcedconcrete(372kg/m²),screed(71,5kg/m²)and ceramictiles(incl.adhesiveandgrout;24,93kg/m²).Thesurfaceareaoffloorongradepertypeof buildingisdeterminedinsection2.3,andtheenvironmentalimpactpersurfaceareaisdeterminedin section2.6InventorydataThecompositionofmaterialsperbuildingelementisshownintheAnnex.
Thefoundationsandinternaldoorswereexcludedastherearenodataontheamountswithinthe sourcesused.Onlyonetypeoffloorfinishingandwallfinishingisconsideredperbuildingperiod.There arenovariationsconsidered.
EnclosedandexposedflatsareincludedseparatelyinTABULA.Weusethenumberofbuildinglayersfor apartmentbuildingsinseveralconstructionperiodstoderivehowmanyapartmentsaresituatedonthe topfloor(i.e.howmanyapartmentsinanaveragebuildingare‘exposed’tooutdoors).Inthiswaywe cantranslatethenumbersoftheapartmentbuildingsreportedinthebuildingregistrytoexposedand enclosedapartments.Whilethemethodisadmittedlyrough,theauthorsarenotawareofbetter estimatesthatareavailable.
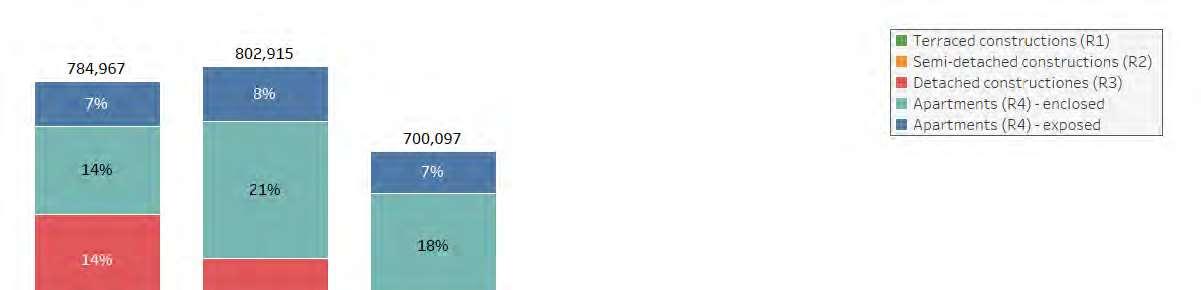
2.1Buildingstock InformationonthecurrenthousingstockwasobtainedfromStatbel11.Itreportsayearlyupdateofthe housingstockregister(‘kadaster’,statusonthe1stofJanuaryforeachdatayear).Thesedatarevealthe numberofbuildingsfromeachconstructionperiodinthecurrenthousingstockofFlanders.Thedatais disaggregatedintohousingtypes: -Terracedconstruction(R1), -Semi-detachedconstruction(R2), -Detachedconstruction(R3), -Apartments(R4), -Commercialbuildings(R5), -Allotherbuildings(R6),and -Total(R7). CategoriesR5andR6arenotconsideredwithinthisstudy.
DataontheFlemishRegionshowsthenumberofbuildingsinFlandersperconstructionperiod(yearof constructionisaggregatedinto10timeperiods).Theconversionfromthese10timeperiodsintothe7 timeperiodsusedinthequantitativemodelisshowninTable4.
Table4:ConversionfromthebuildingstockdatafromStatbeltothecategoriesofthequantitativemodel.
BuildingstockfromStatbelQuantitativemodelRemarks before1900 before1945Sumofthreecategories.between1900and1918 between1919and1945 between1946and1961 between1946and1970Sumoftwocategories.between1962and1970 between1971and1981between1971and1990Althoughtheoverlapisnotperfect,nocorrection isapplied. between1982and1991 between1992and2001between1991and2005
Thiscategoryincludesthebuildingstockof dwellingsconstructedbetween1992and2001and thenewlyconstructeddwellingsfrom2001till 2005.From2001onwards,thedataofStatbelare availableintime-series.Weassumethatthe differencebetween2001and2002inthemost recentcategoryshowsthenumberofnewly constructeddwellingsduring2001.The(negative) differencefortheothertimeperiodsisassumedto equalthenumberofdemolitions.
between2002and2011between2006and2011
2012andlater between2012and2017
2018andlater
Thebuildingstockofdwellingsconstructed between2006and2011includesallbuildings constructedintheyears2006till2010,basedon theannualdifferencebetweenthedataonthe buildingstock(seepreviouscategory).
Thebuildingstockofdwellingsconstructed between2012and2017includesallbuildings constructedintheyears2012till2016,basedon theannualdifferencebetweenthedataonthe buildingstock(seecategorybetween1991and 2005).
Thebuildingstockofdwellingsconstructedin2018 andlaterincludesallbuildingsconstructedinthe
11https://statbel.fgov.be/nl/themas/bouwen-wonen/gebouwenpark
years2018tillnow,basedontheannualdifference betweenthedataonthebuildingstock(see categorybetween1991and2005).
Thedatasetalsoshows,nexttothenumberofbuildings,thenumberofresidentialunitsperhousing type.Aresidentialbuildingcancontainoneormorethanoneresidentialunit.Forexample,theaverage detachedbuildinginFlandersin2021contains1.01residentialunits,whiletheaverageapartment buildingcontains6.52residentialunits11.Themodelcalculationsarebasedonthenumberofresidential units.
InJanuary2022,atotalof3,149,781residentialunitswereavailableinFlanders.Theseresidentialunits aredistributedacross2,307,408residentialbuildings.Nexttotheseresidentialbuildings,thereare another414,519buildingsinFlandersforotherthanresidentialpurposes.Figure2showsthe distributionofthetotalnumberofresidentialunitsacrossperiodsofconstructionandthebuildingtype.
2.2Timberframeconstruction TABULAnorthebuildingstockregistryavailablethroughStatbelholdinformationonthenumberof timberframeconstructedbuildings.TheseareinsteadderivedfromaquestionnairelaunchedbyHout infobois12.Thisquestionnairedoesnothaveinformationonthefractionoftimberframeconstructed buildingspriorto2011andthemasterthesisfromEeckhoutonlygivesdetailsfortimberconstructed dwellingsfrom2006andonwards.Wethereforeassumeittohavebeenzerointhebuildingperiods 12Houtinfobois(2018).HoutbouwinBelgië2017-2018.https://houtinfobois.be/nl/nieuw-houtbouw-in-belgie2017-2018/
Figure2:StockofresidentialunitsinFlanders,January2022.Source:Owncalculationsbasedonthebuildingstockdatafrom StatBel.
before2006-2011andassumeittobehalfofthefractionof2011oftimberframeconstructedbuildings fortheperiodof2006-2011,implicitlyassumingthattheshareoftimberframeconstructionstartedto increaseduringthisperiod.Timberframeconstructiontechniquesaregenerallynotusedforthe constructionofapartmentbuildingswhicharethereforeassumedtohavenotimberframeconstructed buildings.Forthetimberframeconstructedbuildings,itisassumedthattheyhavethesamesurface areaassolidconstructedbuildings.
2.3Geometricaldata Geometricaldatadescribetheaveragesurfaceareaofeachelementperbuildingtypes(Table3).The composeddatasetcontainsanestimateoftheaveragesurfaceareaperelementforeachofthe44 buildingtypes.
ThegeometricaldataoriginatesfromtheTOTEM-toolandTABULA-reporting.
Flatandpitchedroofsconsistofdifferentbuildingelementcompositions.Whilewehaveinformationon thecompositionofbothroofsystems,thebuildingregistrysystemthatweusedoesnotcontain informationontheroofsystem.Itisthusnecessarytoobtainestimatesontheshareofbuildingsthat haveeachroofsystemforeachperiod.WederivedthisfromtheanalysisoftheEPCdatabankby SteunpuntWonen13.Weassumethatafter2011theratioofflat-to-pitchedroofremainedunchanged.
13Verbeeck,G.andCeulemans,W.(2015).AnalysevandeEPCdatabank.Resultatentotenmet2012.Steunpunt Wonen.Table30isthebasisforourapproximation.Sincethefrequencyofthebuildingperiodsisdifferentthan theoneweapplyinthisstudy,weusewhennecessarythemiddleoftheperiodestimate.
semi-detached construction (R2)solid
detached construction (R3)solid construction210.0766.0158.40.087.3122.79.541.270.0113.6
apartments (R4) - enclosedsolid construction85.0320.30.017.90.085.00.026.863.223.2
apartments (R4) - exposedsolid construction85.0320.3100.163.70.085.00.026.863.223.2
1946-1970terraced construction (R1)solid construction160.0546.690.879.135.7124.39.529.8145.569.9
1946-1970semi-detached construction (R2)solid construction163.0531.7101.4133.143.7119.39.530.6119.553.6
1946-1970detached construction (R3)solid construction197.0648.5158.20.056.3140.79.541.665.7106.6
1946-1970apartments (R4) - enclosedsolid construction86.0320.30.017.90.086.00.026.863.923.5
1946-1970apartments (R4) - exposedsolid construction86.0320.3100.163.70.086.00.026.863.923.5
1971-1990terraced construction (R1)solid construction159.0462.878.670.134.9124.19.524.4144.669.4
1971-1990semi-detached construction (R2)solid construction162.0509.6108.5122.952.5109.59.532.3118.753.3
1971-1990detached construction (R3)solid construction220.0655.7170.00.054.8165.29.540.273.3119.0
1971-1990apartments (R4) - enclosedsolid construction86.0320.30.017.90.086.00.026.863.923.5
1971-1990apartments (R4) - exposedsolid construction86.0320.3100.163.70.086.00.026.863.923.5
1991-2005terraced construction (R1)solid construction166.0526.980.975.237.9128.19.526.7151.072.5
1991-2005semi-detached construction (R2)solid construction180.0615.9125.2121.465.7114.39.534.1131.959.2
1991-2005detached construction (R3)solid construction251.0710.5161.60.050.7200.311.545.483.7135.8
1991-2005apartments (R4) - enclosedsolid construction96.0320.30.017.90.096.00.026.871.426.3
1991-2005apartments (R4) - exposedsolid construction96.0320.3100.163.70.096.00.026.871.426.3
2006-2011terraced construction (R1)solid construction168.0549.876.372.035.9132.19.536.6152.873.4
2006-2011semi-detached construction (R2)solid construction187.0642.7118.0118.362.2124.89.547.1137.061.5
2006-2011detached construction (R3)solid construction247.0741.4152.3173.248.0199.09.562.982.3133.6
2006-2011apartments (R4) - enclosedsolid construction96.0320.30.017.90.096.00.026.871.426.3
2006-2011apartments (R4) - exposedsolid construction96.0320.3100.163.70.096.00.026.871.426.3
2006-2011terraced
2006-2011semi-detached construction (R2)timber
2012-2017apartments (R4) - enclosedsolid construction96.0320.30.017.90.096.00.026.871.426.3
2012-2017apartments (R4) - exposedsolid construction96.0320.3100.163.70.096.00.026.871.426.3
2012-2017terraced construction (R1)timber frame construction168.0549.876.372.035.9132.19.536.6152.873.4
2012-2017semi-detached
apartments (R4) - exposedsolid construction96.0320.3100.163.70.096.00.026.871.426.3 terraced construction (R1)timber frame
semi-detached construction (R2)timber frame construction187.0642.7118.0118.362.2124.89.547.1137.061.5 detached construction (R3)timberframe construction247.0741.4152.3173.248.0199.09.562.982.3133.6
Figure3:Summaryofthegeometricalinputdata.
2.4Energy Thenationalbrochureontheresidentialunittypologies(TABULA-reporting)showsthenetenergy demandforheating,expressedinkWh/jr.m².Thedataareavailableperconstructionperiodandtypeof building.Boththecurrentsituationandalow-energyscenarioareprovided.
TheFlemishEnergyandClimateAgency(VEKA)putforwardamonitoringpathuntil2050forresidential buildings(Figure4).This2050monitoringpathshowstheminimumboundarieswithinwhichthelabels (energyperformancecertificate)shouldevolvetoachievethe2050target.Theambitionisthatby2030 theshareofhomeswithEandFlabelswillhavefallentoamaximumof15%.By2040,thisshareshould belessthan1%.Currently,alargepartoftheFlemishhousingstockisinanenergeticallybadshape: almost4outof10homescurrentlyhaveaverypoorenergyperformancewithenergylabelE(12%)orF (26%).
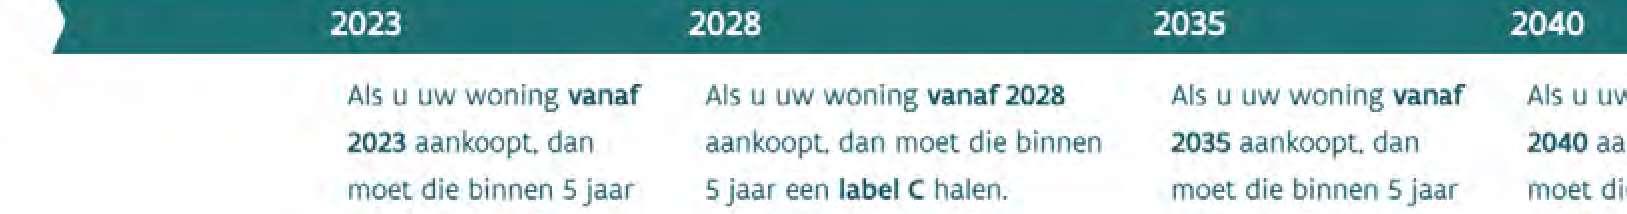
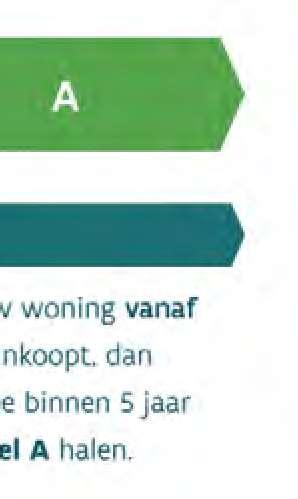
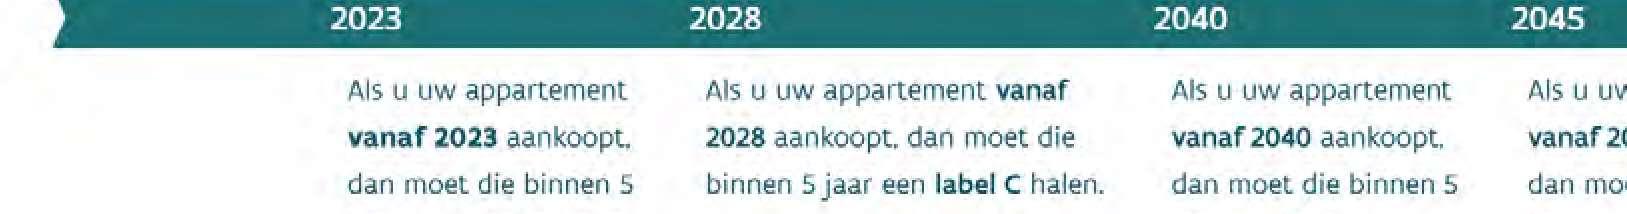
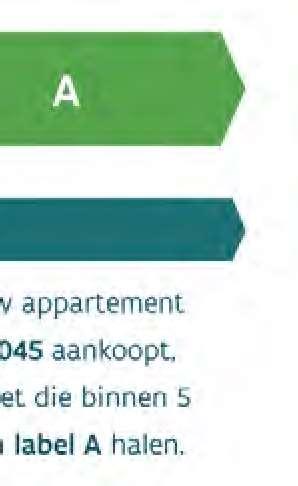
Therenovationobligationforresidentialbuildingsfrom2023stipulatesthatallhousesandapartments purchasedfrom2023onwardswithlabelEorFmustberenovatedtolabelDorbetter,within5years ofpurchase.ThetrajectoryforbuildingsandapartmentsisstipulatedinFigure5andFigure6.
Figure4:MonitoringpathforenergyperformancecertificatesofexistingresidentialbuildingsinFlanders,FlemishEnergyand ClimateAgency(VEKA),Source:VEKApressrelease10/11/2022.
Figure5:Trajectoryfortherenovationofresidentialunits(buildings)inFlanders,Renovationobligationforresidentialbuildings from2023,Renovatieverplichtingvoorresidentiëlegebouwenvanaf2023|Vlaanderen.be
Figure6:Trajectoryfortherenovationofresidentialunits(apartments)inFlanders,Renovationobligationforresidential buildingsfrom2023,Renovatieverplichtingvoorresidentiëlegebouwenvanaf2023|Vlaanderen.be
2.5Emissiondata Theclimatechangefootprint(inkgCO2-eq.)andtheEnvironmentalFootprint(calculatedwiththe ProductEnvironmentalFootprint(PEF)methodology,inmilipoints)14arebasedoncurrentlifecycle inventory(LCI)databases,andareavailablepercombinationoftheelement,period,typeofconstruction andmaterial.Thedatadetailsbetweentheproductionstage(A1-A3),transporttoandconstructionon site(A4-A5),andend-of-lifestage(C1-C4)15
Thesetotalsshowafootprintperconstructionmaterial.Thesefootprintsaredisaggregatedintoa sectoralandageographicaldimension:adisaggregationismadebetweenETSandnon-ETSsectors,and adisaggregationismadebetweenFlandersandtherestofworld(RoW).Thismeansthetotalfootprint isdisaggregatedintofourparts:ETS-Flanders,non-ETS-Flanders,ETS-RoW,non-ETS-RoW.
Theallocationofthetotalfootprintintothesectoralandgeographicaldimensionisbasedonasectorbasedanalysisusingtheinterregionalinput-outputtablesofBelgiumwhicharelinkedtoamulti-regional input-outputmodeltocapturesupplynetworksabroadaswell.
2.6Inventorydata Todeterminethecurrentmaterialsforthedifferentbuildingelementsandconstructionperiodsthe followingsourceswereused:
ForthecompositionsandU-valueoftheelementsperbuildingperiodbefore2006:themaster thesisbyEeckhout16wasusedwhichisbasedupontheIEETABULAproject(2009-2012)17.The mentionedmasterthesisaswellasthereportoftheTABULAproject18wereconsultedtohave acompletepictureofalltheneededdetails.
Fortheelementsfrom2006andonwards:themasterthesisbyEeckhoutwasusedforthe compositions,buttheU-valuewerebasedupontheEPB-cijferrapport19.SurfaceweightedUvaluesfortheperiods2006-2011and2012-2017werecalculatedbasedonthesurfaceweighted U-valuesperyearintheEPB-cijferrapport.AsU-valuefortheelementsfrom2018andonwards, thesurfaceweightedU-valuesoftheyear2017weretakenasstartingpointandnotthe maximumU-valuerequirementof0.24W/m2K,astheEPB-cijferrapportshowthatthe residentialbuildingsinFlandershavebetterU-valuesthanthelegalrequirementssince2006.
AdeviationwasmadefromthemasterthesisbyEeckhoutregardingthecompositionofthe windowsforsolidconstructionafter1990:insteadofonlyconsideringaluminiumframesfor dwellingsfrom1991to2011inclusiveandonlyPVCfordwellingsafterfrom2012,bothtypes wereconsideredforallperiodsafter1990witha50-50division20,astheCO2-footprintof
14TheProductEnvironmentalFootprint(PEF)isamethodologytocalculatetheEnvironmentalFootprintindicator, thePEFscore,forproducts.ThePEFmethodologyprovidesforexampleguidelinesanddefaultvalues.Product EnvironmentalFootprintandEnvironmentalFootprintareusedassynonymsinthisstudy.
15Formoredetails:https://www.totembuilding.be/services/rest/downloads/download?id=1&lang=EN&transId=1&v=7 16Eeckhout,F.(2019).Developmentofenvironmentalbenchmarksforresidentialbuildings,masterthesisKU Leuven.
17http://episcope.eu/iee-project/tabula/ 18W.Cyx,N.Renders,M.VanHolm,S.Verbeke(2011).IEETABULA–TypologyApproachforBuildingStockEnergy Assessment,scientificreport,VITO. 19VlaamsEnergieagentschap(2019).EPB-Cijferrapport,Procedures,resultatenenenergetischekarakteristieken vanhetVlaamsegebouwenbestand–periode2006-2018
20ThemarketshareofPVCframesisincreasingandisaround50%currentlyinBelgium;followedbyaluminum frameswithashareofaround40%.TheEuropeanmarketisshowingasimilarpicture.(sources:
aluminiumframesstoodoutcomparedtotherenovationimpactofolderdwellings.Wooden windowframesareconsideredfortimberframeconstructions.
ThecalculationmodelTOTEM21wasusedtomodelthebuildingelements.Tobespecific:the amounts,thickness,thermalconductivity()orthermalresistance(R)andweightofthe materials,andtheclimatechangefootprintandaggregatedEnvironmentalFootprintscoreto produce,totransportandtoinstall,andtheend-of-life(EOL)ofthebuildingmaterials22
AnnexApresentsthecompositionsandU-valuesperbuildingperiodandbuildingelementapplied withinthisstudy:theleftsideshowsthevaluesbeforerenovationandtherightsideshowsthevalues fortherenovationscenarios(moreexplanationontherenovationscenariosisincludedinsection3). However,firstsomeremarks:
Theimpactdataandweightarebasedoncurrentlifecycleinventory(LCI)databases.The productionprocessesusedtomodeltheenvironmentalimpactsrepresentcurrentproduction processesandnotprocessesfromtherespectivebuildingperiod,assuchdataisnotavailablein LCIdatabases.
Thethermalconductivity()valuesappliedinthisstudytodeterminetheU-valueofanelement arecurrentvaluesofmodernbuildingmaterials,andnotvaluesfromtherespectivebuilding period.Thecurrentthermalconductivityofmaterialsisbetterthaninthepast,thismeansthat asmallerthicknessiscalculatedandconsequentlylessmaterialisconsidered.
WehavetriedtoreproducetheU-valuesaspresentedintheTABULAprojectandEPBcijferrapportasmuchaspossible,howevertherecouldbesmalldifferencesduetothe-values assumedinTOTEM,orbecausecertainmaterialswerenotavailableinTOTEMinacertain thicknessandcouldnotbesimplyextrapolatedbecauseitwoulddeviatetomuchfromthe buildingpractice.Forinstance,TOTEMhassomespecificdoorsinitsdatabasewithcertainRvaluesthatareverydifferentthantheonespresentedinTABULA.
2.7Numberofhouseholds AprojectionofthenumberofhouseholdsisavailablefromStatbel23.Theprojectionincludesanestimate ofthenumberofhouseholdsinFlandersfromnowtill2071.Theannualgrowthinthenumberof householdscanbedeductedbycalculatingthedifferenceoftwoconsecutiveyears.Importanttonote isthattheseprojectionsshowasubstantialreductioninthegrowthofthenumberofhouseholds, implyingthatthenumberofadditionalresidentialunitswillbeprojectedlowercomparedtothecurrent demand.
2.8Permits
ThenumberofbuildingpermitsissuedistakenfromStatbel11.Thedatashowthenumberofpermits issuedforresidentialunitsforbuildingsandapartmentsseparately,aswellasanumberforannual renovations.Allfortheperiod1996-2021.
https://www.ikgabouwen.be/ramen-in-hout-pvc-of-aluminium-wat-is-de-beste-keuze-voor-je-woning/; https://www.bouwenwonen.net/artikel/Omvang-Europese-kozijnmarkt-daalt/3178; http://www.abramenendeuren.be/wp-content/uploads/2011/09/Newsflash072009prestigebroch.pdf) 21TOTEM,https://www.ovam.be/materiaalprestatie-gebouwen-0.Version2.4.5wasused.
22IntermsoftheCENEN15804standard,theEuropeanbuildingproductLCAstandard:moduleA1-A3 (production),modulesA4andA5(transportandinstallationonbuildingsite),andmoduleC(EOL).
23Source:Numberofprivatehouseholds,byregionon1January,Source:Statbel,1992-2021-data.;2022-2071: outlook-UpdateUkraine,FPBandStatbel,FederalPlanningBureau,FPSEconomy–Statbel
2.9Projections Inordertoobtainacompletepictureofalltherequiredconstructionmaterialsupto2050,aprojection onhowconstructionofnewhousingunitsissettoevolve,aswellasthenumberofrenovationsand demolitionofresidentialunitsinFlandersisneeded.
TheprojectionisbasedontheprojectednumberofhouseholdsinFlanders.Theannualstockof residentialunitsintheperiodisequaltotheprojectednumberofhouseholdsinFlandersmultipliedwith anexcessfactor(f1).
Theexcessfactor(f1)representsthefactthattherearemoreresidentialunitsthanhouseholdsin Flanders.In2021,thereare2,867,565householdsinFlandersand3,114,921residentialunits.Theratio betweenthetwo,ortheexcessfactor,is1.086.Inourprojection,weassumethisfactortobeconstant overtime,althoughthisfactorincreasedfrom1.048in2002to1.086in2021.Thedifferencebetween thetotalnumberofresidentialunitsintwoconsecutiveyearsshowsthenetdemandfornewbuildings, whichiscoveredbythedifferencebetweenconstructionanddemolition.
Thenumberofdemolitionsofresidentialunitsisassumedtoequal,onaverage,0.5timesthenumber ofconstructions,meaningforeverytwonewlyconstructedresidentialunitsoneresidentialunitis demolished.The0.5ratioisdeterminedbasedonthehistoricalratio(2001-2021)betweenconstruction anddemolition.
Weassumeaconstantshareforconstructionofdetached,semi-detached,terracedandapartmentsof 9.0%,20.7%,16.4%and53.9%.Thesesharesarebasedonthe2021-ratiosforconstruction.
Weassumethattheincreasingtrendintimberframeconstructioniscontinued.
Figure7showstheresultoftheprojectionforconstructionofresidentialunitsinFlanders.Thedecrease resultsfromthedecreaseintheprojectedgrowthofhouseholdsinFlanders(seeSection2.7). Remarkablearethelowervaluesfortheyears2023and2024.In2022,thearrivalofUkrainianrefugees ledtoamuchhighergrowthinhouseholdsinFlanders.In2023and2024,itwasprojectedthatthese refugeeswouldemigrateagain,leadingtomuchlowergrowthvaluesin2023and2024(FPB,2022)24 From2025,thiseffectisnotincludedanymoreinthenumbers.
24Householdprojections2022-2070,FederalPlanningBureau.
Figure7:Thenumberofnewlyconstructedresidentialunits,projectionforFlanders,2023-2050.Comparedtotheprojected annualgrowthinthenumberofhouseholds,Flanders,source:FPB.
Note:ThearrivalofUkrainianrefugeesin2022willaffectemigrationintheyearsafter(expectedin2023and2024)(FPB, 2022).
Chapter3:Scenarios Fourscenariosareelaboratedinthisstudy.Eachofthesescenariosincludesrenovation,constructionof newbuildings,anddemolitionfortheperiod2023-2050.Bothnewconstructionandrenovationeither doordonotintroducetheM-level.
Tomodeltherenovationthefollowingassumptionswereconsidered: Theenergygoals205025aremetbyfollowingtrack1whichmeansthatthefollowingseparate requirements26aremet:
oRoof,floorandwalls:U=0.24W/m2K
oGlazing:Ug=1.0W/m2K
oWindows(=glazingandwindowframestogether):Uw=1.5W/m2K Tomeetthe0.24U-valuerequirementoftheroof,floorongradeandexternalwall,additional insulationisadded:
oThetypeofinsulationmaterialstayedthesameintherenovationscenario.Existing insulationiscompletelyremovedbeforeaddingthenewinsulation,exceptforcavity insulationwhichisassumedtobeleftincavityasitwas.Inthiscase,additional insulationisadded(e.g.,usingPURboard)viathecavityorontheoutside.
oInpractice,therearedifferentwaysofaddinginsulationtoanexistingconstruction (fromtheoutside,insideorincaseofcavitywallsinthecavity),onlyonewayis consideredinthisstudybasedonthemostlikelyoptionthatcanbeappliedinmost situations.Exceptforsolidconstructedexternalwalls:addinginsulationfromtheinside aswellasfromtheoutsideareconsidered.Thewayofinsulatingextrafromtheoutside wasspecificallyaddedfordetacheddwellings.
oIncasetherearefinishinglayersorotherlayersappliedontheinsulationlayer,then thoselayersareremovedandnewlyinstalledfortherenovationincasethematerials cannotbereusedproperly,otherwisea5%ofreplacement/repairsisconsideredwith thereuse.
Tomeettherequirementsforthewindowsandglazing,theframeneedstobereplaced completelybyanewframeasinpracticeexistingframeswillnotbesuitablefordoubleortriple glazingduetoabiggerthicknessoftheglazing27.Basedonthemostrecentnumbersfoundon thedistributionofthetypesofframes28,itisassumedthat50%oftherenovatedframesused insolidconstructionbuildingsconsistofPVC,40%consistofaluminiumand,finally,10%are woodenframes.Fortimberframeconstruction,itisassumedthatalltherenovatedframes consistofwood.
Itisimportanttoremarkthattheassumedrenovationscenarioisonlyconsideringaminimalenergy renovationtomeettheabovementionedenergygoalsattheminimallevel.Itisoftenthepracticethat whendwellingsarerenovatedmoreparts(e.g.internalwalls,thekitchen,orthebathroom)arealso renovatedatthesametime.However,ouranalysisissolelyfocusedonthebuildingelementsmentioned aboveandtheinclusionofkitchens,bathrooms,etc.wouldthusoverlyexpandthescopeoftheanalysis withelementsthatdonotdirectlyaffecttheenergyperformanceofadwellingwithinthescopeofthe Flemishclimateplan.
25https://www.energiesparen.be/energiedoelstellingen-tegen-2050
26Track1oftheenergygoals2050alsohasafourthrequirementregardingtheefficiencyofheatingsystems.This isnotincludedinthisstudy,asnodataonheatingsystemsisincluded.
27Thecaseinwhichdoubleglassisreplacedbydoubleglasswithbetterperformanceswithoutreplacingthe frame),isnotconsideredhere.
28Ikgabouwenenrenoveren.(2016).Rameninhout,pvcofaluminium:watisdebestekeuzevoorjewoning? Consultedon29thofOctober,2019.https://www.ikgabouwen.be/ramen-in-hout-pvc-of-aluminium-wat-is-debeste-keuze-voor-je-woning/.
TheM-levelimplementationissimulatedusingthefollowing80%rule: Foreachelementconstructedorrenovated(seerenovation),thetotalembodiedenvironmental impactiscalculated.
oUsingEnvironmentalFootprintscore(PEFmethodology)
oInTOTEM
Allcomponentsaccumulatingtoatleast80%ofembodiedenvironmentalimpact(i.e.the normalisedandweightedscoreofsixteenenvironmentalimpacts)oftheelementare considered.
oLargestimpactsareconsideredfirst(rankedfrombiggesttosmallest)
oOncethe80%isreached,theothermaterialsarenotconsideredanymore Foreachconsideredcomponent,allrelevantsubstitutesarecompared.
oIncludingtheconsideredcomponentitself
oSubstitutesavailableintheTOTEMlibrary29
oOnlysubstituteshavingasimilarfunctionandstructureareincluded Forexample:atimberloadbearingframeworkisnotconsideredasasubstitute forabrickworkloadbearingwallelement
Forexample:asand-limebrickworkloadbearingwallelementisconsideredas asubstituteforacellularconcretebrickworkloadbearingwallelement
oOnlyreasonablycommonapplicationsareincluded Forexample:strawbaleinsulationisexcluded
Thecomponenthavingthelowestenvironmentalscoreisselected.Keepinmindthatinreality thissubstitutemighttechnicallybelessopportune.
TheM-levelisappliedtonewconstructioninscenario3andtonewconstructionsand renovationinscenario4.
Thefollowingscenariosaredetermined:
•Scenario1(business-as-usual)showstheforecastifthecurrentsituationcontinues:22,00030 homesarerenovatedenergeticallyeveryyear(i.e.theroundednumberofpermitsfor renovationsin2021).
•Inscenario2,thenumberofenergyrenovationsisdoubledto44,000peryear.Thisvaluemakes itpossibletorenovateallcurrenthomeswithenergylabelEorFtolabelAby2050.
•Scenario3isidenticaltoscenario2butintroducestheM-levelfornewconstructionfrom2023, optimizingthechoiceofmaterialsandtheassociatedimpact.
•Scenario4isidenticaltoscenario3butappliestheM-levelnotonlytonewconstruction,but alsotorenovationsfrom2023.
Table5:SummaryofthescenariosforconstructionandrenovationinFlanders.
Scenario1
Scenario2
Scenario3
(seeSection2.9)
(seeSection2.9)
(seeSection2.9)
Scenario4Basedonprojection (seeSection2.9)
29ResultsarebasedonourmodelruninDecember2022.
30Onthe1stofJanuary2022,only6.8%ofFlemishdwellingshasalabelA(VlaamsEnergie-enKlimaatagentschap).
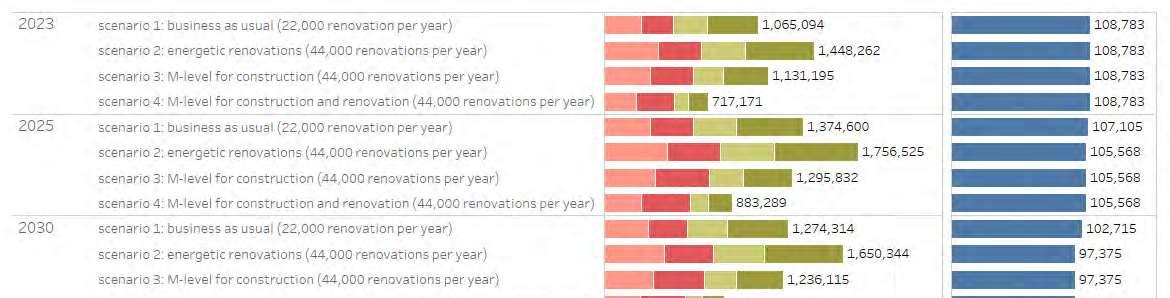
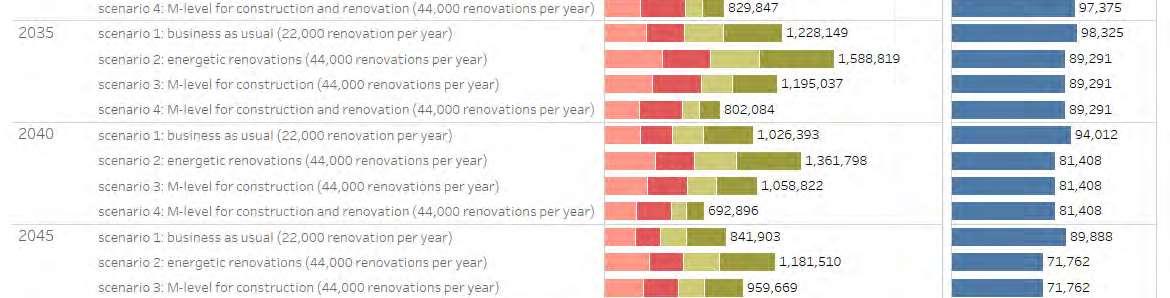
Chapter4:Results Theresults,presentedfrom2023to2050,showannualClimateChangeimpactsexpressedintonsCO2equivalents(Figure8andError!Referencesourcenotfound.)andtheEnvironmentalFootprintimpact inpoints(Figure9andError!Referencesourcenotfound.)fromnewconstructionandrenovation.Next totheannualresults,asummationfortheperiod2023-2050ispresentedaswell.
Figure8showstheannualClimateChangeimpactsfortheperiod2023to2050intonsCO2-equivalents, showingtheimpactofnewconstruction,renovation,anddemolition.Toincreasethereadability,only theyears2025,2030,2035,2040,and2045areshown.Thedatapresentannualemissions(thusno cumulatedimpacts).Theannualemissionsaredisaggregatedaccordingtothesector/regionfromwhich theyoriginate:eitheremissionsinFlandersoroutsideFlanders(i.e.restofworld,RoW),andeither emissionsfromETS-sectorsornon-ETS-sectors.
Figure8:AnnualresultsforClimateChangeforscenario1to4,intonsCO2-equivalentsperyear.
Thenetenergydemandforheatingisadded(mainly)torepresenttheeffectofrenovationsonthe energydemandforheatingresidentialunits:duetoenergeticrenovations(withorwithoutfollowing theintroductionoftheM-level)theenergydemandforheatingdecreasestowards2050,evenwitha projectedincreaseinpopulationandanaccompanyingincreaseinthenumberofresidentialunitsfrom 2023to2050(from3.2millionresidentialunitsin2023toaprojected3.6millionresidentialunitsin 2050).
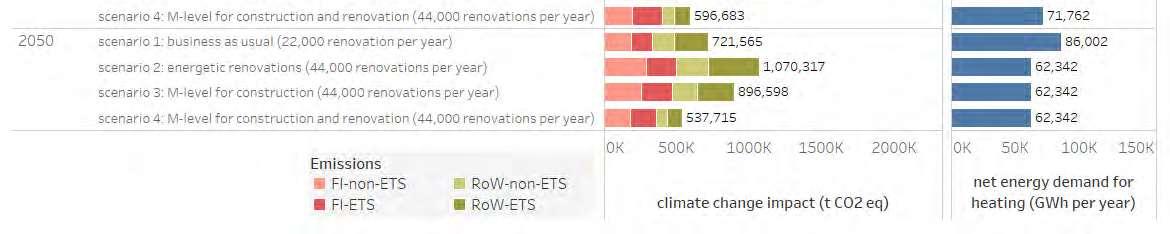
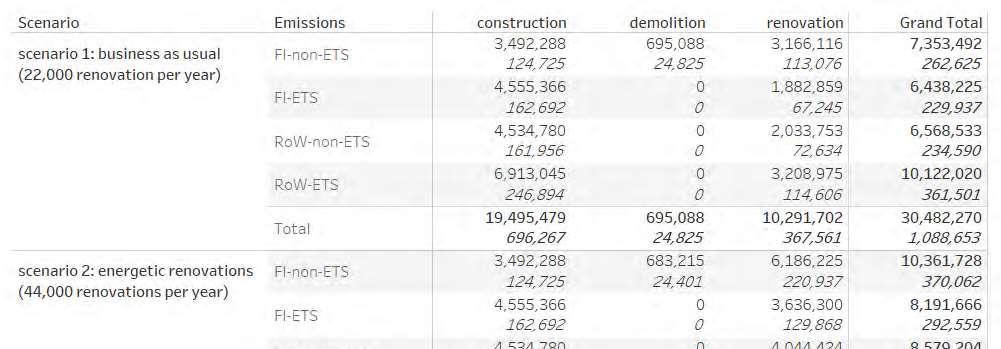
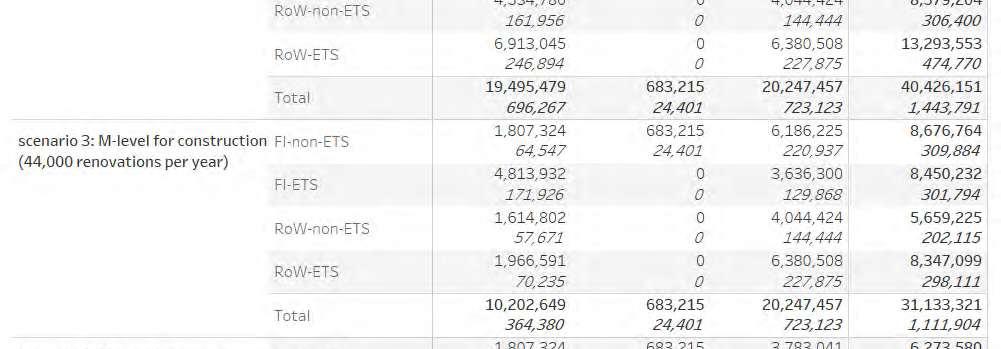
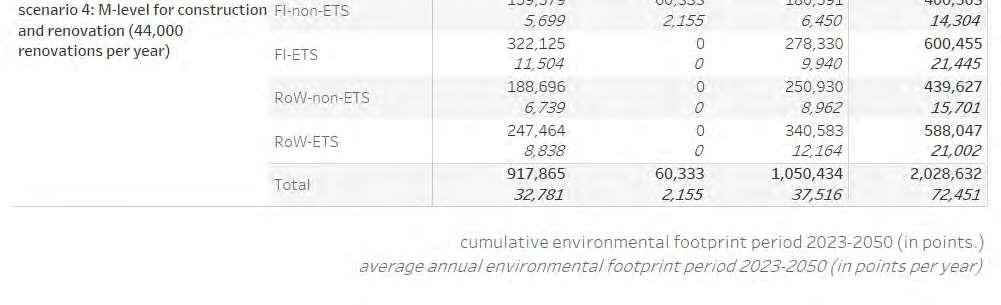
Error!Referencesourcenotfound.presentsthetotalaccumulatedclimatechangeimpactfortheperiod 2023-2050andinitalicanannualaveragevalue(averageimpactconsideringthewholeperiod).Thedata isdisaggregatedintonewconstruction,renovation,anddemolition,aswellintothesector/regionorigin
oftheemissions.Scenario2resultsinthehighestaccumulatedClimateChangeimpactof40.4million tonsCO2-eq,followedbyscenario3with31.1milliontonsCO2-eq,scenario1with30.5milliontonsCO2eqandscenario4with20.4milliontonsCO2-eq.Rememberthatthetotalenergydemandforheatingis 11%lowerforscenarios2to4(2.4millionGWhaccumulatedinthe2023-2050period),comparedto scenario1(2.7millionGWh).
Table6:TotalandaverageannualresultsforClimateChangeforscenario1to4,intonsCO2-equivalentsperyear(Totalinthe tableequalstheglobalemissions)
Figure9andError!Referencesourcenotfound.shouldbeinterpretedlikeFigure8andError!Reference sourcenotfound.,exceptfortheimpactcategorybeingdifferent.TheEnvironmentalFootprintimpact isthenormalisedandweightedresultsof16impactcategories31ofwhichClimateChangeisone.The assessmentcoverstheenvironmentalimpactcategoriesoftheEnvironmentalFootprint(EF)method32.
31SeeTable6ofthereport‘Environmentalprofileofbuildings,update2021’formoredetails: https://www.totem-building.be/services/rest/downloads/download?id=1&lang=EN&transId=1&v=7 32Environmentalfootprintmethods(europa.eu)
Thismethod,endorsedbytheEuropeanCommission,includesawidevarietyofenvironmentalimpacts, andalsoprovidesguidancetoprocess(normalisationandweighting)impactresultsintoasingle aggregatedscore(expressedinpoints,Pt).
TheEnvironmentalFootprintcovers:
Climatechange(kgCO2-eq.)
Ozonedepletion(kgCFC-11eq)
Ionisingradiation,humanhealth(kBqU235eq.)
Photochemicalozoneformation(kgNMVOCeq.)
Particularmatter(diseaseincidence)
Humantoxicity,non-cancer(CTUh;comparativetoxicunitforhumans)
Humantoxicity,cancer(CTUh;comparativetoxicunitforhumans)
Acidification(molH+eq.)
Eutrophication,freshwater(kgPeq.)
Eutrophication,marine(kgNeq.)
Eutrophication,terrestrial(molNeq.);
Ecotoxicity,freshwater(CTUe;comparativetoxicunitforecosystems)
Landuse(Pt;dimensionless;soilqualityindex)
Wateruse(m³deprivation)
Resourceuse,fossils(MJ)
Resourceuse,minerals,andmetals(kgSbeq.;kilogramantimonyequivalent).
Figure9:AnnualresultsforEnvironmentalFootprintforscenario1to4,inpointsperyear.
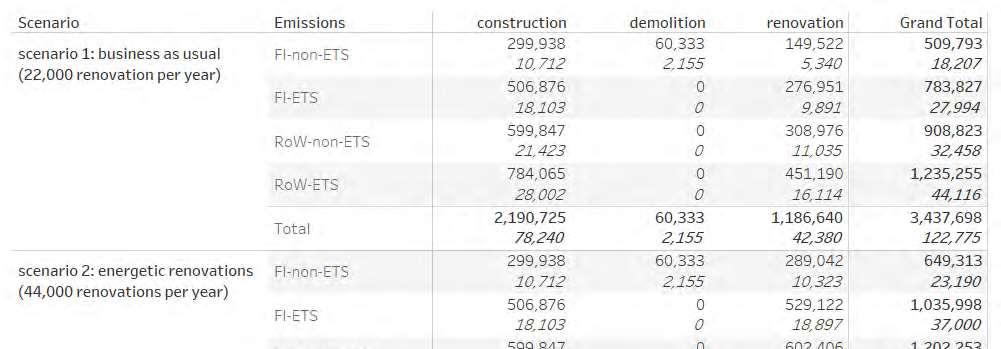
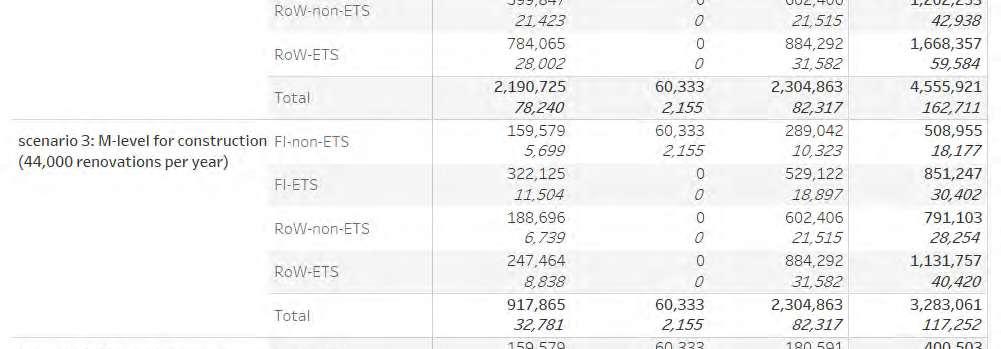
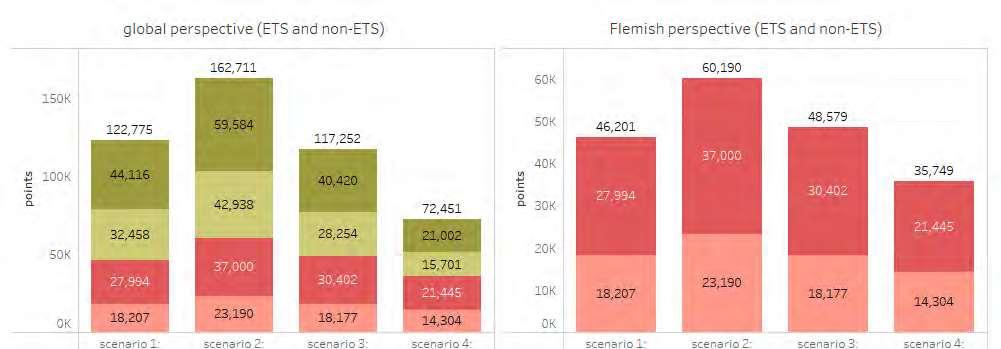
Table7:TotalandaverageannualresultsforEnvironmentalFootprintforscenario1to4,inpointsperyear(Totalinthetable equalstheglobalemissions)
Figure8showsthedecreaseinnetenergydemandforheatingasaresultoftheincreaseinthenumber ofrenovationswithanimprovedenergyperformance.Inscenarios2to4thiseffectisalowernetenergy demandforheatingcomparedtoscenario1,becauseoftheincreasedeffortinrenovations(doublingof thenumberofresidentialunitsbeingrenovated).Ofcourse,thisincreasedrenovationspeedincludesa reboundeffect.Theincreaseddemandforbuildingmaterialsneededforrenovationdoesalsogenerate anenvironmentalimpact,i.e.the(indirect)ClimateChangeemissionsandEnvironmentalFootprint.A moredetailedcomparisonbetweenthescenariosisprovidedbelow.
First,thetotalfootprintisdiscussed.Thedifferencebetweenscenario1and2isanadditionaleffortfor renovations:thenumberofenergeticrenovationsisdoubledfrom22,000residentialunitsperyearto 44,000.InbothscenariostheintroductionoftheM-levelisnotconsidered.Theincreasedrenovation effortalmostdoublesthecumulativeindirectglobalClimateChangeemissionsfromrenovationsfrom 10.3to20.2milliontonsCO2-eqatgloballevel(includingbothETSandnon-ETS).Also,limitingthefocus totheFlemishterritorialemissions,includingETSandnon-ETS,showsthesameresult:adoublingof
indirectemissionsfrom5.0to9.8milliontonsCO2-eq(Table6).Bothscenariosresultinthesameimpact fromnewconstructionanddemolition,asscenario2differsfromscenario1inthenumberof renovationsonly.ThetotalyearlyindirectClimateChangeemissionsincreaseby33%atgloballeveland by35%33atFlemishlevel(includingnewconstruction,renovation,anddemolition).
SimilarresultsarefocussingontheEnvironmentalFootprint,showadoublingoftheimpactfrom renovationsfrom1.2to2.3millionpointsatgloballevel(Table7).AtFlemishlevel,theEnvironmental Footprintincreasedfrom426000to818000points.
Thedifferencebetweenscenario2and3istheintroductionofaM-levelfornewconstructionsof residentialunits.Atgloballevel,theClimateChangeemissionstriggeredbynewconstructionreduceby 48%(from19.5to10.2milliontonsCO2-eq),whiletheFlemishterritorialemissionsdecreasewith18% (from8.0to6.6milliontonsCO2-eq)(Table6).TheintroductionofaM-levelfornewconstructionmainly hasaneffectonClimateChangeemissionsabroad(-69%)andontheFlemishnon-ETS-emissions(-48%).
Again,comparingthescenarios2and3,theresultsfortheEnvironmentalFootprintaresimilar.They showasubstantialdecreasefrom2,191to918thousandpointsatglobalscale.LookingattheFlemish territorialperspectiveonly,theresultsshowadecreasefrom807to482thousandpoints(Table7).
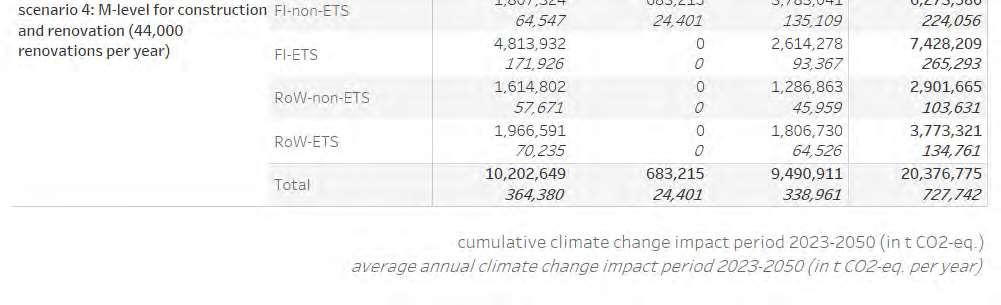
Comparingscenario2and4showstheintroductionofaM-levelforbothnewconstructionand renovation(inbothscenariosdoubledto44,000renovationsperyear;inscenario4anM-levelis introduced),itcanbeseenthatthetotalClimateChangeemissionsarehalvedfrom40.4to20.4million tonsCO2-eq,andtheFlemishterritorialemissionsreduceby26%from18.6to13.7milliontons(Table 6).
ComparingtheEnvironmentalFootprintbetweenscenario2and4shows,forthetotal,adecreasefrom 4,556thousandpointsto2,029thousandpoints,itcanbeseenthatatFlemishleveltheimpactreduces from1,685to1,001thousandpoints(Table7).
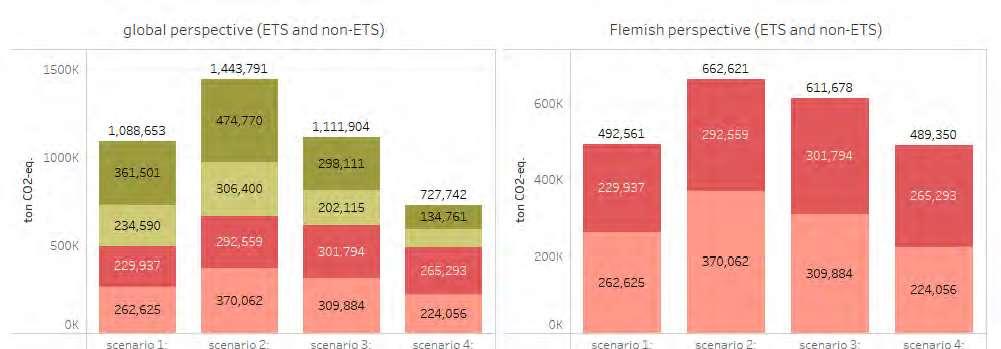
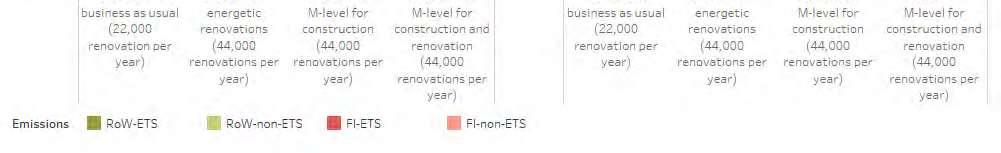
Nexttoadiscussionofthetotalvalues,asummaryontheaverageannualimpactforClimateChange (Figure10)andtheEnvironmentalFootprint(Figure11)isprovidedbelow.Adistinctionismadebetween totalimpactsandimpactsfromaFlemishterritorialperspective.Ingeneral,theintroductionofanMlevelhasalargereffectonthetotalglobalemissionsandasmallereffectontheFlemishterritorial emissions.
33SeeTable6:TotalglobalClimateChangeemissionsinscenario2:1,443,791.Thisis33%higherthanthevalue forscenario1,1,088,653;TotalClimateChangeemissionsinFlandersinscenario2:662,621.Thisis35%higher thanthevalueforscenario1:492,562.
Figure10:SummaryoftheaverageannualimpactonClimateChangefromthefourscenarios,intCO2 eq.
Figure11:SummaryoftheaverageannualimpactonEnvironmentalFootprintimpactsfromthefourscenarios,inpoints.
Chapter5:Conclusions Initsclimatestrategyandlong-termrenovationstrategy,theFlemishGovernmentaspiresadrastic increaseinthenumberofrenovationstoreducedirectemissions.More(energetic)renovationwithout additional(material-conscious)measures,however,willincreasetheindirectenvironmentalimpacts, duetotheimpactsgeneratedinthedifferentlifecyclestagesofthesematerials(mining,production, construction,transport,end-of-life,etc.)neededfortherenovations.
Acomparisonbetweentheresultsofscenario1and2showstheadditionaleffortforincreasingthe renovationrate:thenumberofenergeticrenovationsisdoubledfrom22,000residentialunitsperyear to44,000.Theresultsshowasubstantialincreaseintheseindirectimpacts,bothfromafootprint perspectiveandaterritorialperspective.Althoughinthelongtermtheenergydemandforheatingwill decrease(whichisthemaindriverofthedirectimpacts),theinstanteffectofrenovationsisanincrease inindirectemissions.TheincreasefromaFlemishterritorialperspectiveisestimatedat170kilotons CO2-eqperyear34(consideringanincreasefrom22,000renovationsto44,000renovationsperyear),of which107kilotonsCO2-eqperyearisfromFlemishnon-ETSsectors.
ThisconsiderableincreaseinterritorialemissionscanbereducedviatheintroductionofanM-level.To completelynullifyorevenreversethereboundeffect,anintroductionoftheM-levelonbothnew constructionandrenovation(scenario4)isneeded.Basedonourassumptions,theimplementationof theM-levelononlynewconstruction(scenario3)doesreducetheeffectonincreasedindirectemissions butisnotsufficienttocompletelynullifytheeffect.AbiggerleverispossibleviaintroducingtheM-level forrenovationsaswell.ThetotalindirectClimateChangeimpactsandtheEnvironmentalFootprintsare thelowestforscenario4.IntroducingtheM-levelfornewconstructionandrenovation(scenario4) reducestheterritorialindirectimpactinFlandersbyalmost26%forClimateChangeand41%forthe EnvironmentalFootprint(comparedtoscenario2withoutanM-level).
Intotal,theannualClimateChangegainofintroducingtheM-levelforbothconstructionandrenovation fortheFlemishnon-ETSsectorisestimatedatca.146kilotonsofCO2-eqperyear;theannual EnvironmentalFootprintgainisestimatedatca.9thousandpoints.(i.e.thedifferencebetween scenarios2and4).Basedontheresults,theintroductionoftheM-leveldoesnotshifttheburden:next toareductionintheterritorialimpacts,alsothefootprint(includingindirectimpactsabroad)andimpact withintheETS-sectordecrease.TheseresultsstandfirmlookingattheEnvironmentalFootprintasa whole,andwithanarrowerfocusonClimateChangeonly.
AsareminderwerefertothelimitationofthestudyexplainedinChapter1.Thescopeoftheseresults onlyfocusesonresidentialbuildings.AnintroductionofanM-levelfornon-residentialbuildingsisnot considered.TofullygraspthepotentialoftheM-levelandtobeabletosuccessfullycarryout projections,itisnecessarytoexpandthescope.
34thisvalueisthedifferencebetweenscenario1and2.
Disclaimer: Thispublicationrtheviewsonlyofthe authors,andtheFlemishGovernmentcannotbeheld responsibleforanyusewhichmaybemadeofthe informationcontainedtherein.