• 2022 Cost impact overview

• Subcontractor survey results
• Current market trends for costs
• Everything has changed
• Wild Cards
* Political
* Labor issues and subcontractor default
* Weather
* Capital markets & banking
* Energy
* The Ukraine War
• Forecast
DUROTECH REPORTS: Annual Construction Costs Forecast

June 2023
The last two years have been difficult for Owners/Design Teams, and Contractors - for some, the most difficult and problematic ever encountered. Budgets have been stretched and broken, schedules delayed and extended by materials and covid issues, and only a handful of projects have emerged unscathed. After reviewing subcontractor survey results, this report will look at current local and global trends affecting local costs and potentially impacting costs for several years in an effort to provide some potential look ahead awareness. The Houston market is still very busy. It will be important to be aware of potential cost and delivery disruptions, but also to be able to explain them to constituencies in the event they occur.
The forecast will also attempt to identify some cost impactful wild cards as yet unfactored in the markets, and when they potentially could occur. We believe construction cost and materials markets will experience periodic choke point disruptions in the near and mid term. We will move very fast with many graphics to depict the basis of these potentialities. The forecast concludes with a construction cost projection for the next 3 years based on these circumstances.
Construction Outlook
11931 Wickchester, Suite 205 Houston, Texas 77043 www.durotechgc.com Phone: 281.558.6892
For more information contact: Bobr@durotechgc.com
PAGE 1 © 2022 Durotech Inc, All Rights Reserved. May not be reproduced or used in whole or in part without the written permission of Durotech Inc.
DUROTECH
IN THIS ISSUE:
Newsletter
2022 Cost Impact Overview and 2023 Material Trend
Everyone knows how tumultuous 2021 and 2022 were for materials costs and deliveries and, in some cases for labor. We’re going to review the overall situation very quickly. This and the forward economics will provide some information for your constituencies, should you need it.

Our 2022 forecast had 2 scenarios, one for a quick supply chain restructure and Ukraine settlement and one for a longer restructure and Ukraine settlement and indicated it would likely be the second scenario with the rate at the end (19%) (Table 1).
Advertisingspacesalesinperiodicals,newspapers,directoriesandmailinglists(2)3610.60.2-0.50.6-0.31.0 Residentialwiredtelecommunicationservices37114.20.92.40.20.00.1 Wirelesstelecommunicationservices3722.00.50.00.00.4-0.1 Cableandsatellitesubscriberservices3738.10.31.10.61.10.6 Internetaccessservices(2)374-2.0-0.30.2-0.2-0.7-0.3 Bundledwiredtelecommunicationsaccessservices(2)3755.50.41.71.2-0.3-0.2 Consumerloans(partial)39121.04.4-0.40.03.4-6.8 Depositservices(partial)(2)39213.7-1.24.0-0.2-0.916.4 Othercreditintermediation,incl.trustservices(partial)(2)393-5.8-4.80.50.0-2.50.0 Securitiesbrokerage,dealing,investmentadvice,andrelatedservices(2)40120.79.5-1.84.110.70.4 Portfoliomanagement(2)402-14.12.21.6-1.71.3-1.0 Lifeinsurance(2)4111013.30.00.00.10.00.0 Disabilityinsurance,includingaccidentaldeath(2)411102-0.40.00.00.00.00.0 Healthandmedicalinsurance4111031.90.20.20.30.20.3 Propertyandcasualtyinsurance(2)4111044.20.10.40.10.11.2 Annuities(2)412-1.20.00.5-0.30.00.0 Residentialpropertysalesandleases,brokeragefeesandcommissions43217.21.10.1-0.4-0.4-0.1 Passengercarrental441-2.53.7-0.72.5-3.7-0.8 Legalservices4514.80.40.80.40.40.2 Taxpreparationandplanning4521026.00.90.4-0.70.6-0.6 Architecturalandengineeringservices4535.60.40.10.00.3-0.1 Management,scientific,andtechnicalconsultingservices4540.40.0-0.3-0.80.21.0 Arrangementofflights(partial)47111.4-0.40.0-0.80.4-1.3 Arrangementofvehiclerentalsandlodging(2)4724.3-0.6-0.2-0.30.70.6 Arrangementofcruisesandtours(2)47319.00.1-5.34.70.66.6 Physiciancare5111010.60.00.20.50.10.2 Medicallaboratoryanddiagnosticimagingcare(2)511102-0.70.00.00.0-0.40.1 Homehealthandhospicecare5111032.20.20.11.00.10.2 Hospitaloutpatientcare(2)5111042.3-0.3-0.2-1.00.4-0.1 Dentalcare5111053.70.00.6-0.10.10.1 Hospitalinpatientcare5121014.3-0.10.20.90.00.3 Nursinghomecare5121024.60.70.40.30.40.3 Traveleraccommodationservices53114.4-3.62.92.81.2-3.4 Foodandbeveragesforimmediateconsumptionservices(partial)(2)541-3.50.3-1.0-0.40.5-0.8 Motorvehiclerepairandmaintenance(partial)5524.50.40.40.50.40.0 Membershipduesandadmissionsandrecreationfacilityusefees(partial)(2)5615.5-0.30.41.01.71.2 Recreationalactivityinstructionfees(partial)(2)5621.60.10.00.00.00.0 Gamingreceipts(partial)(2)5630.5-2.35.4-0.2-4.30.5 Miningservices(2)60111.00.92.40.20.40.2 FinaldemandconstructionFD4318.50.20.22.70.10.0 Newwarehousebuildingconstruction(2)80110120.90.00.22.10.3-0.2 Newschoolbuildingconstruction(2)80110217.90.10.33.30.0-0.1 Newofficebuildingconstruction(2)80110320.20.30.22.40.00.3 Newindustrialbuildingconstruction(2)80110420.80.10.12.80.2-0.1 Newhealthcarebuildingconstruction(2)80110518.10.10.13.30.10.1 IntermediateDemandbyCommodityType ProcessedgoodsforintermediatedemandID614.7-1.4-0.1-0.1-0.8-2.8 ProcessedfoodsandfeedsID6911211.3-0.1-0.2-0.10.7-0.8 Meats0221-1.10.3-0.6-0.52.41.4 Processedpoultry0222-5.7-2.6-5.8-7.02.9-9.9 Dairyproducts02312.7-1.9-1.40.2-0.6-0.3 Processedfruitsandvegetables(2)02418.51.02.90.91.80.3 Refinedsugarandbyproducts(2)02539.60.74.50.2-0.20.8 Fatsandoils(2)02711.6-1.2-0.2-2.42.5-3.0 Preparedanimalfeeds(2)02914.11.00.2-1.70.6-0.4 ProcessedmaterialslessfoodsandfeedsID691114.2-1.5-0.1-0.1-0.9-3.0 Syntheticfibers(2)0316.42.21.00.1-0.2-1.2 Processedyarnsandthreads(2)0328.5-0.1-3.0-3.8-1.50.2 Finishedfabrics(2)0348.60.60.0-0.30.7-0.5 Liquefiedpetroleumgas(2)0532-10.1-4.2-14.5-14.012.4-12.9 Seefootnotesatendoftable.3
Local subcontractors reported slightly higher costs than 19.2% in 2022 just for materials (Table 3). Labor and materials costs for Houston subcontractors totaled 15.96% when proportionately allocated.

Houston Subcontractors 2020 7.3%
Houston Subcontractors 2021 13.6%
Houston Subcontractors 2022 19.6%
Houston Subcontractors 2023 9.9%


Table 3
The rate of cost increase is currently trending down. This 16.2% is the USBLS Construction Cost increase for February 2023 over February 2022, and is a good indicator that the rate of increase is falling, not the costs. Some local sources suggest the Houston January to January YOY rate increase was 8%. Durotech believes Houston 1/22-1/23 YOY increase is slightly over 7%, but it is varying month to month. We will see this pattern nationally in this report.
PAGE 2 © 2023 Durotech Inc, All Rights Reserved. May not be reproduced or used in whole or in part without the written permission of Durotech Inc.
Multi-year supply chain restructure, Ukraine Consequences longer, more severe; China COVID lockdown is extended 2022 2023 2024 16-19% increase 12-16% increase 10-12% increase Note: You should not rely on Durotech’s projections as a basis for any determination for your purposes. You should retain professional expertise and evaluate the individual circumstances of your factual scenario in determining any escalation for any building program under consideration. USBLSConstructionPPI12/21–12/2218.5% 2022HoustonSubcontractorsActualCostIncreases Materials19.6% Labor11.5%
Table 2 [December 2022] Unadjusted 12-month percent change(1) Group codeItem code Dec. 2021 to Dec. 2022(p) July to Aug. Aug. to Sept.(p) Sept. to Oct.(p) Oct. to Nov.(p) Nov. to Dec.(p) Seasonally adjusted 1-month percent change(1) Commodity code Grouping Table 2. Producer price index percentage changes for selected commodity groupings by Final Demand-Intermediate Demand category, seasonally adjusted
The last US Bureau of Labor Statistics report for the year came in at 18.5% for Construction (Table 2).
Table 1
K12 2022 Results and 2023 Design Professionals Survey


The historically accurate projections by our design professionals suffered from the budget stresses experienced on all projects across the board in 2022 due to market conditions.
Due to the national market conditions in 2022, only 11% of projects were in budget and 89% were out of budget.
2022 Projects
11% In Budget
89% Over Budget by an average of 12.4%
Despite generous Design Professionals 2022 estimates, the materials conditions simply outpaced budget projections (Table 4).
project costs again. The high in recent years as prototypes evolve-low spread has been increasing.
The anticipated cost breakout of Middle/JH Schools has taken place as new project design standards and costs have appeared.
The annual year over year cost percentage increase was dramatic. It even upwardly impacted the 8 year average increase. Both a lower 8 year and a higher 3 year average are shown (Table 6).
Table 6
Costs by major building type for the last several years showing the dramatic increases are shown below (Table 7, 8 & 9).


2017-2022 Square Foot Data Average Ranges Greenfield
Greenfield cost ranges had the widest high/low spread on record. Several modest prototypes held the low end of the cost ranges down, but we will likely see these lower new

PAGE 3 © 2023 Durotech Inc, All Rights Reserved. May not be reproduced or used in whole or in part without the written permission of Durotech Inc.
Greenfield Estimated / Actual Costs 2017 2018 2019 2020 2021 2022 Est. / Actual Est. / Actual Est. / Actual Est. / Actual Est. / Actual Est. / Actual Elem School $203 / $181 $203 / $203 $229 / $202 $222 / $207 $225 / $254 $285 / $295 Middle School $216 / $202 $241 / $211 $250 / $222 $231 / $211 $245 / $220 $290 / $332 High School $251 / $238 $268 / Insufficient Data $280 / Insufficient Data $267 / Insufficient Data $230 / Insufficient Data $290 / Insufficient Data Note: The above SF costs are for new schools only and do not include any addition, renovation, or replacement schools The escalation projections above are not endorsed by the AGC or A4LE and are strictly the opinion of Durotech Inc. based on multiple variables which they have taken into account. You should not rely on Durotech’s projections as a basis for any determination for your purposes. You should retain professional expertise and evaluate the individual circumstances of your factual scenario in determining any escalation for any building program under consideration. Source:DurotechInc.proprietaryTexasmarketwidecostsurvey.
Table 4
Not only was there a significant increase in 2022 costs but the range from highest to lowest costs widen considerably due to the last appearances of some old prototypes (Table 5).
Elementary School Cost Data 2017 2018 2019 2020 2021 2022 Spread $153-200 $172-233 $151-253 $180-275 $208-306 $211-310 Low/High $47 $61 $102 $95 $98 $99 Middle/Jr. High School Cost Data 2017 2018 2019 2020 2021 2022 Spread $178-254 $182-256 $168-248 $209-266 $208-253 $299-371 Low/High $76 $74 $81 $57 $45 $72 High School Cost Data 2017 2018 2019 2020 2021 2022 Spread $218-263 Insufficient Data Insufficient Data Insufficient Data Insufficient Data Insufficient Data Low/High $45 HISD not included in this survey. Note: The above SF cost are for new schools and do not include any addition, renovation, or replacement schools. Source: Durotech Inc. proprietary Texas market wide cost survey. Table 5
Actual Annual Increase Over Prior Year 2015 2016 2017 2018 2019 2020 2021 2022 Average Elementary School 12% 2% -7% 11% -0.5% 1.02% 8.7% 16% 5.41%-8.57% Middle School 30% 0% -2% 4.5% 5% -5% 9% 51% 11.5%-18.33% High School 15% 5% -1% N/A N/A N/A N/A N/A 6.33% Source: Durotech Inc. proprietary Texas market wide cost survey.
2016 2017 2018 2019 2020 2021 2022 Elementary Elementary Elementary Elementary Elementary Elementary Elementary Low 170 $ 150 $ 166 $ 167 $ 180 $ 208 $ 229 $ High 220 $ 210 $ 230 $ 253 $ 275 $ 306 $ 310 $ Diff 50 $ 60 $ 64 $ 86 $ 95 $ 98 $ 81 $ Note: to add a year: enter data in the next column Then click on the graph "one of the columns in yellow" and then on the menu "Chart Design, Select Data" above click on the "Low" formula and change the ending value to include the new column etter - G, H, I etc. $140 $155 $170 $185 $200 $215 $230 $245 $260 $275 $290 $305 $320 $335 $350 $365 $380 Elementary 2016 Elementary 2017 Elementary 2018 Elementary 2019 Elementary 2020 Elementary 2021 Elementary 2022 Elementary School Square Foot Trends Source: Durotech Inc. proprietary Texas market wide cost survey. Table 7 2016201720182019202020212022 Jr.HighJr.HighJr.HighJr.HighJr.HighJr.HighJr.High Low170$180$182$170$209$208$299 $ High250$250$256$250$266$253$371 $ Diff80$70$74$80$57$45$72 $ Note:toaddayear:enterdatainthenextcolumn.Thenclickonthegraph"oneofthecolumnsinyellow"andthen onthemenu "Chart Design, Select Data" aboveclickonthe"Low"formulaandchangetheendingvaluetoincludethe newcolumnletter-G,H,Ietc. $160 $170 $180 $190 $200 $210 $220 $230 $240 $250 $260 $270 $280 $290 $300 $310 $320 $330 Jr. High 2016 Jr. High 2017 Jr. High 2018 Jr. High 2019 Jr. High 2020 Jr. High 2021 Jr. High 2022
Source: Durotech Inc. proprietary Texas market wide cost survey. Table 8 2016 High School2017 High School2018 High School2019 High School2020 High School2021 High School2022 High School2023 High School Sample too SmallSample too SmallSample too SmallSample too SmallSample too Small Low 220 $ 220 $ - $ - $ - $ - $ - $ 270 $ High 260 $ 270 $ - $ - $ - $ - $ - $ 315 $ Diff 40 $ 50 $ - $ - $ - $ - $ - $ 45 $ Note: to add a year: enter data in the next column. Then click on the graph "one of the columns in yellow" and then on the menu "Chart Design, Select Data" above click on the "Low" formula and change the ending value to include the new column etter - G, H, etc. $200 $210 $220 $230 $240 $250 $260 $270 $280 $290 $300 $310 $320 2016 High School 2017 High SchoolSample too Small 2018 High School Sample too Small 2019 High School Sample too Small 2020 High School Sample too Small 2021 High School Sample too Small 2022 High School 2023 High School High School
Foot
Source: Durotech Inc. proprietary Texas market wide cost survey. 2017 2016 2023 Table 9
Jr. High School Square Foot Trends
Square
Trends
2023 Design Professionals Concerns


Permit, utility service issues and longer construction schedules have long been a rising concern of design professionals. This year they have increased again in concern. These issues are negatively stressing the cost and delivery of projects. These are curable by Owners but require proactive, early measures.
Design professionals concerns are becoming more uniform and foreshadow rising costs. Evolving curriculum changes and rising standards are becoming uniform drivers (Table 10 & 11).
Adequate staff availability has been a rising concern since 2008 when, due to the economy, many young architects could not find jobs and exited the profession. Architectural enrollment has not recovered. Architectural staff compensation, especially in the face of rising housing and living costs is becoming an issue (Table 12).

Comparing design professionals 2022 forward cost projections for 2023 and 2024 to the 2023 projections reflects another, market driven dramatic upward shift of as much as 30% for the period 2023-2025. These projections are likely more workable for market conditions going forward (Table 13).
2023 Cost Forecast


Of more interest may be the uniformity of response on design professionals concerns (Table 12).


© 2023 Durotech Inc, All Rights Reserved. May not be reproduced or used in whole or in part without the written permission of Durotech Inc.
0% 5% 10% 15% 20% 25% 30% 35% 40% 45% 50% 55% 60% 65% 70% 75% ELEMENTARY SCHOOL 2020 ELEMENTARY SCHOOL 2021 ELEMENTARY SCHOOL 2022 ELEMENTARY SCHOOL 2023 JR. HIGH SCHOOL 2020 JR. HIGH SCHOOL 2021 JR. HIGH SCHOOL 2022 JR. HIGH SCHOOL 2023 HIGH SCHOOL 2020 HIGH SCHOOL 2021 HIGH SCHOOL 2022 HIGH SCHOOL 2023 Design Professionals Concerns -Curriculum Cost Impact Table 10 0% 5% 10% 15% 20% 25% 30% 35% 40% 45% 50% 55% 60% 65% 70% 75% 80% 85% 90% ELEMENTARY SCHOOL 2020 ELEMENTARY SCHOOL 2021 ELEMENTARY SCHOOL 2022 ELEMENTARY SCHOOL 2023 JR. HIGH SCHOOL 2020 JR. HIGH SCHOOL 2021 JR. HIGH SCHOOL 2022 JR. HIGH SCHOOL 2023 HIGH SCHOOL 2020 HIGH SCHOOL 2021 HIGH SCHOOL 2022 Design Professionals Concerns -Owner Design Expectations Table 11
LongerDesignSchedulesLongerCostSchedulesPermitTimeProblemsUtilitiesProblemsAdequateStaffAvailabilityLaborAvailability 0% 5% 10% 15% 20% 25% 30% 35% 40% 45% 50% 55% 60% 65% 70% 75% 80% 85% 90% 95% 100% Design Professionals Concerns Longer Design Schedules Longer Construction Schedules Permit Time Problems Utility Problems Adequate Staff Availability Economy Labor Availaility Labor Productivity Source: Durotech Inc. Proprietary Annual Design Professionals Survey 2020202120222023
12
Table
Design Professional Average Future Cost Projections $293-352/sf (Avg. $323/sf) $285-381/sf (Avg. $328/sf) $300-395/sf (Avg. $384/sf) $310-375/sf (Avg. $343/sf) $315-395/sf (Avg. $355/sf) $318-436/sf (Avg. $377/sf) $320-425/sf (Avg. $373/sf) $328-450/sf (Avg. $389/sf) $322-482/sf (Avg. $401/sf) Source: Annual Design Professional Survey by Durotech Inc. Table 13
Source: Annual Design Professionals Survey by Durotech
Source: Annual Design Professionals Survey by Durotech
2022 Subcontractor Survey Results
Turning to the annual Subcontractor survey in Table 4 below, the results this year have been very interesting. 2022 projections overall and in MEP trades for 2022 materials increases and cost increases have proven to be accurate.
inflated but margins have still not recovered. Over 2022-23, driven primarily by materials increases revenue rose market wide by nearly 27% but in real terms margins are, in effect, going backwards as a revenue derivative. Materials in the period 2021-23 show a 57% increase, but revenue is up by 30% and margins have only increased during that period by 1.6% (-1.6% = the net actual 2021 through 2023).
A deviation of magnitude is in the specialty trades, where the subcontractors experienced supply chain pressures and delivery problems. Projections for materials and labor increases in 2023-which are heavily driven by projected MEP materials increases - if allocated a combined materials / labor inverse ratio of traditional calculations (due to continued supply chain issues), the subcontractors projected 2023 annual increase rate comes close to our projection at the end of this presentation.
Unseen in these projections is the increased cost of heavy equipment this year and going forward due to interest rate and covid responsive alterations in manufacturing supply chains. These equipment increases will likely be in the 8% range.
Note how much lower the 2023 rate of increase is projected to be. As we will discuss, there could be upwardly impactful movement later in the year.
Please look closely at the 2022 margin increases on the table relative to revenue and the 2023 projections for margin and revenue increases. Subcontractors are acutely aware of these numbers. It is important for the overall construction and design community to understand what has happened to fully grasp this potential project impact.
In 2022 due to covid recovery and inflated materials, revenue took a huge jump but there was NO margin increase. Instead, many Subcontractors absorbed significant price increases. With 2023 sales increasing at a more normalized rate, materials prices remain
This is a real problem. This, for illustrative purposes, is Table 14, a theoretical cumulative cash flow curve effect of these conditions on companies in the subcontracting community.
Available internal cash (captioned “Cash Resources”) to support operations is falling in many cases. This is already manifesting locally -and especially nationallyin subcontractor defaults and closures.
In the next 18 months, there is a genuine danger of subcontractors and some general contractors experiencing cash flow difficulties.
In other subcontractor survey results shown in Table 15 below, as would be anticipated, major Subcontractor concerns revolve around the economy and overall labor availability. Schedule tends to be less concerning to Subcontractors looking at their portion of a schedule, than to Owners, Design Teams and General Contractors concerned with the overall schedule. The Aha! year for labor availability remains 2018. Since then all subcontractors have been very sensitive to both labor availability and to keeping their existing forces on staff.
PAGE 5 © 2023 Durotech Inc, All Rights Reserved. May not be reproduced or used in whole or in part without the written permission of Durotech Inc.
2019 Actual 2020 Actual 2021 Actual 2022 Est. 2022 Actual 2023 Est. 2019 Actual 2020 Actual 2021 Actual 2022 Est. 2022 Actual 2023 Est. 2019 Actual 2020 Actual 2021 Actual 2022 Est. 2022 Actual 2023 Est. 2019 Actual 2020 Actual 2021 Actual 2022 Est. 2022 Actual 2023 Est. 3.505.4038.1015.9012.609.302.988.4015.6015.5022.808.806.1711.2028.8324.9022.1312.504.007.6029.0018.3019.609.90 4.104.909.7015.909.506.403.506.106.806.6012.806.804.564.7511.8310.4611.759.884.605.009.5010.1011.507.40 0.290.184.400.79-1.40-0.60-1.803.81-1.807.709.076.300.442.080.441.564.207.750.291.808.907.104.304.50 7.50-2.126.4112.886.634.20-2.2011.80-2.606.506.5010.4014.8914.004.176.177.3811.386.316.502.808.6024.608.70 -1.202.000.903.60-6.800.800.600.204.902.502.303.3027.220.045.006.254.134.500.020.08-1.704.000.002.80 Specialty Contractor Surveys & Trends Labor Intensive TradesFinish/Specialty Trades MEP Trades Average All Trades Source:DurotechInc.proprietaryAnnualSubcontractorSurvey. Materials Cost Increases Labor Cost Increase Labor Production Rate Increase Revenue Increase Margin Increases *Percentageindicatedareanaverageofallrespondentsineachcategoryandoverall.
Table 4
2020 2021 2022 2023 2024 Sample Subcontractor Industry Cash Curve Prices Cash Resources Cash Needs Table 14
Notice that material as a concern is falling, but delivery concerns are not. Presently freight deliveries are still not yet dependable due to both trucking conditions and materials supply flows. Deliveries remain affected by trucking problems. There is not a shortage of licensed commercial drivers. There is a regulatory environment which makes it increasingly difficult for independent drivers to earn a living and for fleet drivers to earn an acceptable living. This will reach a tipping point in the next few years.
The volatility of recent year local subcontractor materials projections appears to have peaked as seen as seen more dramatically for 2023 in the subcontractor survey results in Table 16.
Current Market Trends for Costs


16
Going forward, materials shortages and delays remain, particularly in electrical and metal component items. This will continue over the next several years as supply chains are restructured, disruptive geopolitical events such as the Ukraine war continue, and if other systematic stresses and risks appear, as will be discussed later.
Missing in the subcontractor survey - perhaps buried in the concerns about economy - is the current lending environment. We will address that issue as part of the local and global influencers on prices and construction in this market.
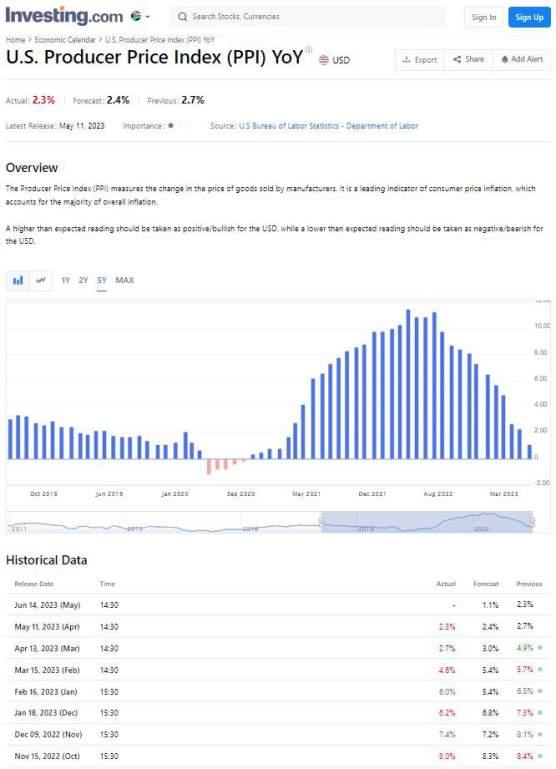
The producer price index is the correct index to use for manufacturers and capital goods such as building materials and contractors as opposed to the more familiar CPI-Consumer Price Index-which lacks capital goods materials. This graph clearly illustrates what has happened to manufactured product prices between January 2019 and January 2023. It is falling, but remains well above 2019 levels (Table 17).
PAGE 6 © 2023 Durotech Inc, All Rights Reserved. May not be reproduced or used in whole or in part without the written permission of Durotech Inc. 0% 10% 20% 30% 40% 50% 60% 70% 80% ECONOMYLABOR AVAILABILITYLABOR PRODUCTIONCOMPETITION SCHEDULE MATERIAL DELIVERY 37% 27% 17% 16% 57% 79% 36% 39% 32% 28% 13% 18% 7% 41% 21% 9% 16% 8% 48% 18% 9% 17% 8% 26% 19% 7% 7% 5% 20% 13% 30% 17% 9% 10% 6% 15% 12% Subcontractors' Major Concerns in 2023 2017 2018 2019 2020 2021 2022 2023 Source: Durotech Inc. proprietary Annual Subcontractor Survey Houston Subcontractors 2020 7.3% Houston Subcontractors 2021 13.6% Houston Subcontractors 2022 19.6% Houston Subcontractors 2023 9.9%
Table
Table 15
Table 17
Similarly, the Global Supply Chain Pressure Index, shown in Table 18 from 1998 through 2022, clearly indicates the major drop in raw shipping costs, container costs, and supply chain costs.
Materials prices (Table 20) for our key non-energy commodities has begun to fall. These raw materials and transport related numbers reflect a slowing global economy with a cooling demand for basic industrial materials. The Baltic Dry rate, the shipping rate for how raw materials are transported, confirms demand is not present at pre or immediately post covid intensity. Even bauxite ore-aluminum-is falling despite a recent 200% tariff on Russian ore. Demand is cooling. That bodes well for price stability.
Materials Commodity Prices

Port Congestion Easing

The actual container volume from China into US ports has fallen very dramatically and manufacturing orders have fallen 40% in China (Table 19). Falling US orders to China have reduced bottlenecks as the supply chain shift gets underway.


The actual month by month TEU import container volume shown in the blue line has fallen until March of 2023 (Table 21). In April, it has begun to rise (Table 22).


By Port of Entry container volume has been moving more selectively to ports, in this case from February to March. However in February, Houston was the only major port to see a big container increase (20%) and it maintained that level at 0% March change (Table 23). It and all ports except Tacoma are rising again, but LA/Long Beach is nowhere near their prior volume (Table 24).


PAGE 7 © 2023 Durotech Inc, All Rights Reserved. May not be reproduced or used in whole or in part without the written permission of Durotech Inc.
Table 18
Table 19
Copper Iron Ore Aluminum Baltic Dry Index ($135,000 in 2008) 14-Mar$3.04/lb11-Jan$180.00/ton11-Feb$1.20/lb12-Jan$1,783 15-Mar$2.74/lb 14-Jan$2,337 16-Feb$2.02/lb16-Feb$45.58/ton16-Feb$0.68/lb16-Feb$2,417 17-Feb$2.78/lb17-Feb$86.60/ton17-Feb$0.84/lb17-Feb$7,402 18-Jun$3.38/lb18-Jun$66.00/ton18-Jun$1.05/lb18-Jun$1,340 19-Mar$2.92/lb19-Mar$85.79/ton19-Mar$0.95/lb19-Mar$600 20-Mar$2.84/lb20-Mar$83.76/ton20-Mar$0.87/lb20-Mar$582 21-Mar$3.99/lb21-Mar$163.68/ton21-Mar$1.00/lb21-Mar$2,072 22-Mar$4.62/lb22-Mar$150.11/ton22-Mar$1.66/lb22-Mar$2,684 23-Mar$4.10/lb23-Mar$126.01/ton23-Mar$1.08/lb23-Mar$1,407 48% Decrease Source: Composite of Spot Market sources
11% Decrease 16% Decrease 33% Decrease Table 20
Table 23
Table 24
Table 21
Table 22
Table 26
of gravel for Genoa's new foranea dam

Genoa
Two ships carry 3,000 tons of material per day from Piombino

SHIPPING
The first ship of the Diamond Line PNX service is approx
Go Ligure
The line links Italy with Turkey through the port of Piraeus
Currently the West Coast longshoreman’s contract is being renegotiated. It will affect future shipping plans. Some importers are returning only portions of their business to LA-Long Beach. Typically those are smaller and mid size importers. Larger firms can shift and reposition their distribution network to other ports and locales. As shown on the red bar in this article (Table 27), 51% have made changes and many are only partly returning to the West Coast.


JOBS
Filt, Fit and Uilt deem positive the government's first measures

Print Close
I'm a successful female minority truck driver. California's AB5 forced me to leave the state I love

By Dee Sova
Published January 30, 2023
Fox News

To most people, owning your own business is a way to become successful. For me, it was a mission – a lifeline to a brighter future for myself and my daughters.
That journey began in California more than three decades ago, when dropped my nursing studies to get a commercial driver’s license. As a woman, the thought of working in a male-dominated field was intimidating at first. But those initial fears soon gave way to the rewarding opportunities that a career in trucking offers.

The change was unexpected. As a single parent raising four daughters, I needed both flexibility and the opportunity to provide for them. Which is why, in 2015, I partnered with Prime Inc. to become an independent
Manufacturers and distributors can no longer depend on a just in time delivery system, (see below). They are increasing domestic
and volumes. “The more data shippers can provide to a carrier, the fewer surprises they have when engaging in negotiations and contracts,” Bourke says. Some 3PLs recommend shopping carrier rates for every shipment.

“If you aren’t shopping carriers on every order, you are overspending and under-delivering,” says Sean Henry, co-founder and CEO of supply chain start-up Stord. “At the same time,
robust technology to intelligently shop carriers is critical the more you add to your portfolio.”
Saatva looks at online reviews during the carrier vetting process but takes them with a grain of salt because it’s rare for satis ed customers to leave positive feedback.
“If we used Google or Yelp reviews during the initial stages of our vetting, we wouldn’t have been able to build our network at all,” Dimilta says. n
DISRUPTIONS MEAN BUSINESS
Supply chain disruptions have had a positive impact on expedited final-mile providers. Shipments that used to go less-than-truckload (LTL) now go to last-mile carriers, says The Customized Logistics and Delivery Association (CLDA), which represents the first to final miles of the supply chain in the United States and worldwide.


“The delays in the supply chain mean that shippers can’t always depend on LTL transportation to get things where they need when the customer needs them,” says Tim Cocchia, COO of Xcel Delivery Services and CLDA board member. “In these cases, they turn to lastmile delivery partners.

“Before the disruptions, LTL could get products to their destinations in a timely manner,” Cocchia says. “But with the disruptions that’s no longer the case. Last-mile providers take delivery of the items, store them in our warehouses until they are needed, and deliver them when it’s time. We have always done some of these deliveries, but the demand has dramatically increased.”
IMPACT ON JUST-IN-TIME
150 carriers over many years, the Saatva team can spot problems and take action.
“We are so good at monitoring our partners that we can tell whether or not it’s a new delivery team, even when there’s a mechanical breakdown in our delivery partner’s day-to-day operations,” Dimilta notes. Saatva’s claim rate is less than 1% of all deliveries.
When selecting carriers, ask them to provide quotes for actual shipments, using six to 12 months of anonymized data to give a realistic view of lanes
Supply chain issues have had a dramatic impact on companies that depended heavily on the just-in-time model. “Right now, just-in-time doesn’t work,” says Cocchia. “In the past, just-in-time made economic sense. It worked because those in procurement knew they could wait until the last minute to order what they needed and get it right away. The customer could keep their money in the bank, order at the last minute possible, and have it show up on the day it was supposed to without redelivery and warehousing fees.
“Not anymore,” he adds. “Today, companies order products ahead of time because they’re not sure when they’ll come in. They ship those products to last-mile providers’ warehouses to hold them for as long as needed, and then deliver them exactly when needed.”
PAGE 8 © 2023 Durotech Inc, All Rights Reserved. May not be reproduced or used in whole or in part without the written permission of Durotech Inc.
25
Descartes Datamyne
Table
Source:
09 June 2023 Year XXVII Independent journal on economy and transport policy 19:16 GMT+2 This page has been automatically translated by Original news PORTS To February the -43.1% of the traffic of the container in the port of Los Angeles confirms the phase of crisis of the Californian ports The port ports of call on the East Coast also suffer A modest recovery is expected from March Los Angeles March 20, 2023 As well as the Port Authority of Long Beach that motivated The strong decrease of the -31,7% of the traffic of the container enlivened by the Californian airport in February 2023 charging it at the lowest expense of consumers, warehouses already saturated with goods and at the standstill of production in Asia ( of 15 March 2023), also ECONOMY Agreement the Italian and Mauritanian maritime clusters Rome It has been initialed by Federation of the Sea, Cluster BIG and Cluster Maritime Mauritanien PORTS Webuild posits about 100,000 tons
However, in February LA-Long Beach Traffic was still down by 43.1% from pre-covid levels, reflecting the shift to other ports. Truck problems caused by the California legislature persist as shown in this story of a minority trucker who was forced to move her business to Missouri because of the new laws affecting trucking in Californiashown below.
contractor Independent contractor Dee Sova moved her trucking business to Missouri after California passed its AB5 law. (American Trucking Associations) Being an independent truck driver empowered me to run my truck as my own small business. I loved traveling on the job, the freedom to be my own boss, and the option to take my children with me on long hauls when I could. WHAT DOES CALIFORNIA GIG ECONOMY LAW AB5 DO? Making good money while seeing the country, I built a wonderful life back in California – a place was proud to call home. I was living my version of the American Dream. But lawmakers in Sacramento soon had a very different plan for me. When the state legislature began debating Assembly Bill 5 – a law effectively banning independent contractors in trucking – my dream was put in jeopardy AB5 would have demoted me from small business owner to company employee – affecting my hours, benefits, flexibility and overall ability to earn on my own terms. It would effectively kill the dream I worked so hard to build over so
27 112 Inbound Logistics January 2023 Saatva uses DispatchTrack to provide real-time visibility into deliveries, including scheduling and customer acceptance of the order. “If there are any issues between the customer and our delivery partner, we hear about them right away,” says Dimilta. “It has become an invaluable part of not just our delivery business but also our customer service experience.” SELECTING PARTNERS Especially in the consumer realm, the last-mile experience is intertwined with the seller’s brand reputation, regardless of the delivery contract’s details. Finding last-mile partners is as much an art as it is a science, Dimilta notes, and Saatva has developed its own process for selecting and vetting carriers. “Partnering with smaller delivery partners suits the type of hands-on experience we offer more than dealing with larger delivery companies,” he says. The Saatva vetting process focuses on whether the carrier has mattresshandling and furniture assembly experience, two-person crews, and can commit to the four-hour window for scheduling and delivery times. Other vetting questions dive into the business, such as whether the eet is company or contractor owned and its technology capabilities. Once Saatva brings a carrier onboard, detailed daily, weekly and monthly internal carrier reporting takes place. Carriers that fall below service thresholds are selected for review. Based on monitoring more than
Table
F5_LastMile_0123_FINAL.indd 112 1/22/23 4:25 PM
inventories. Over time this will create higher materials costs due to more storage and inventory carrying costs. As networks change, increased costs will be pushed onto customers.
For now, logistics firms and manufacturers say just in time delay systems are a thing of the past. Some are considering more changes.
Source: Descartes Datamyne
Flexibility is now key. What all of this means to your projects is:
a. Costs are down but land transit for deliveries can still be an issue.
b. Ocean shipping costs will be lower until a portion of the merchant fleet ages and is scrapped.
c. West Coast longshoreman’s strike and wage increases will affect some mid and small supply chains and push traffic elsewhere.
2022 - 2023 White Collar Lay-offs
d. The delivery portion of the supply chain appears to be stabilizing, except for trucking. A restructuring is underway in the tech and bio-tech businesses. These 2022 layoffs of 24,600+ works and biopharma layoffs of 7,400 workers are only a portion of the white collar disruption in these industries (Table 28).
2022 - 2023 White Collar Lay-offs

Table 29
Layoffs in these sectors accelerated in 2023 with almost 35,000 tech layoffs through early February 2023 and 21 bio-pharma companies announcing 2023 layoffs, as opposed to only 1 major manufacturing layoff of 2,500 workers (Table 29).
Disruption and change have arrived at industries once promoted as unstoppable juggernauts have laid off 60,000 white collar personnel in the last 1-1/2 years. It is a sign of industries maturing.

It is a sign of Change.
Notice something important in these statistics: there are no blue collar layoffs other than at one manufacturer.
PAGE 9 © 2023 Durotech Inc, All Rights Reserved. May not be reproduced or used in whole or in part without the written permission of Durotech Inc.
MonthCompany# of People % of Company Workforce Month Company# of People % of Comp Workfor Jun-22 Compass undetermined 1/4/2023 Vimeo 11% Jul-22 Vimeo 6% 1/5/2023 Compass undetermi Sep-22Goldman Sachs 3,200 6.5% 1/18/2023 Microsoft 10,000 Sep-22 BNY Mellon 1,500 3% 1/18/2023 Crypto 20% Sep-22 Verily 200 15% 1/18/2023 BlackRock 500 3% Sep-22Direct TV (Managerial) 10% 1/19/2023 WeWork 300 Sep-22 Coinbase 950 20% 1/19/2023 Wayfair 1,000 5% Oct-22 Compass 750 1/20/2023 Google 12,000 6% Oct-22 Stitchfix 20% 1/20/2023 Vox 133 7% Nov-22 Amazon 18,000 1/26/2023 Dow 2,000 Nov-22 Salesforce 18% 1/26/2023 SAP 3,000 Nov-22 Everlane 17% 1/26/2023 Spotify 600 6% 2022 White Collar Lay-offs24,600 1/26/2023 IBM 3,900 2% 2/7/2023 Zoom 1,300 2022 Bio-Pharma Lay-offs7,387 2/8/2023 Autodesk 250 2023 Non-Manufacturing Lay-offs34,983 Bio-tech Financing 2022-2023 White Collar Lay-offs59,583 Jan-23Finch Theraputics 95% of st Cytier Theraputics 70% of st 1/26/20233M Manufacturing 2,500 2021 IPO's $16.5 billion 2022 IPO's $1.5 billion 19 Drug Developers plan lay-offs
Table 28 MonthCompany# of People % of Company Workforce Month Company# of People % of Company Workforce Jun-22 Compass undetermined 1/4/2023 Vimeo 11% Jul-22 Vimeo 6% 1/5/2023 Compass undetermined Sep-22Goldman Sachs 3,200 6.5% 1/18/2023 Microsoft 10,000 Sep-22 BNY Mellon 1,500 3% 1/18/2023 Crypto 20% Sep-22 Verily 200 15% 1/18/2023 BlackRock 500 3% Sep-22Direct TV (Managerial) 10% 1/19/2023 WeWork 300 Sep-22 Coinbase 950 20% 1/19/2023 Wayfair 1,000 5% Oct-22 Compass 750 1/20/2023 Google 12,000 6% Oct-22 Stitchfix 20% 1/20/2023 Vox 133 7% Nov-22 Amazon 18,000 1/26/2023 Dow 2,000 Nov-22 Salesforce 18% 1/26/2023 SAP 3,000 Nov-22 Everlane 17% 1/26/2023 Spotify 600 6% 2022 White Collar Lay-offs24,600 1/26/2023 IBM 3,900 2% 2/7/2023 Zoom 1,300 2022 Bio-Pharma Lay-offs7,387 2/8/2023 Autodesk 250 2023 Non-Manufacturing Lay-offs34,983 Bio-tech Financing 2022-2023 White Collar Lay-offs59,583 Jan-23Finch Theraputics 95% of staff Cytier Theraputics 70% of staff 1/26/20233M Manufacturing 2,500 2021 IPO's $16.5 billion 2022 IPO's $1.5 billion 19 Drug Developers plan lay-offs
In November of 2022 the Architectural Billings Index, which foreshadows construction activity, dropped for the first time since January 2021. It has continued to drop every month since then. This is a reflection of increased interest, cap rates, and recession fears in the private sector. Yet the Houston purchasing manager index of activity continues above the critical 50% line, indicating upbeat activity (Table 30). This and other contradictions exist because our traditional paradigm of economic structure has changed.


Apartment rents are falling nationally and the National Association of Home Builders predicts a national decline of 28% in 2023 multi-family construction. Houston new inside the loop apartments only have a 54%occupancy as of the February 2023 Houston apartment market occupancy report. But there are currently 1 million apartment units under construction nationally.


NAHB 2023 Forecast is for a decline of 28% in multi-family construction nationally. In February 2023 local market occupancy report, new inside the loop apartments only have 54% occupancy.
By contrast, on 11/3/22, Simon Group Chairman David Simon reported nationwide retail occupancy of 95.6% and record sales of $746 per square foot. Locally Simon Group owns The Galleria and several outlet centers.

PAGE 10 © 2023 Durotech Inc, All Rights Reserved. May not be reproduced or used in whole or in part without the written permission of Durotech Inc.
30
Table
The major national brokerage firms are being driven down by the current office market, cutting staff and seeking new lines of business primarily due to post covid office vacancies. Despite this, Simon Group Chairman David Simon, owner of premium malls nationally (including The Galleria complex), reported in November of 2022 that Simon had 94.6% occupancy and record malls sales of $746 per square foot-a complete contradiction to the apartment market and to much of retail, which continues to downsize and where even some retail chains are collapsing.

It is also a job creator in a tight labor market: 406,000 manufacturing jobs in 2023.
Manufacturing is driving construction starts and it is just picking up steam. Billions are being spent on new plants. Non-residential building activity in December 2022 is up 38% over the same month a year earlier. It is now starting to fall. But it now moves up and down monthly Manufacturing reshoring and restructuring is a 15 plus year cycle, so we should anticipate significant longer term workforce and construction impact from this movement.


At the same time, logistics firms are looking to expand by acquisition and manufacturing firms are bringing factories back to the US and Mexico from overseas but this restructuring takes time.

Site selectors see 2023 as their super bowl - the once in a generation shift in global manufacturing.


Table 31
Table 32
And in February, building materials saw a price increase. In March, some prices fell. It alternates monthly, in contradiction to historic patterns (Table 33).


Table 33
All this activity is contradictory to our historic measures and paradigms. For example, by March, the Dodge Momentum Index of new construction activity was starting to drop. But at the same time, while construction job openings fell in February, the pay scale increased.


PAGE 11 © 2023 Durotech Inc, All Rights Reserved. May not be reproduced or used in whole or in part without the written permission of Durotech Inc.
Vol. 23, No. 9 March 6-10, 2023
Construction employment, pay climb in February; job openings shrink in January but hires jump.
By April, unfilled construction jobs hit a record high and construction unemployment hit a record low. And while major construction projects experienced big cost increases and tariffs impact construction materials, cost increases have begun to mitigate. Again, contradictions we are unaccustomed to seeing have begun to appear everywhere.
This clearly proves out supply chain and manufacturing demand. By 2025, we will see new distribution space slowing. Still, some longer term incredibly large industrial projects are planned, including a $25 Billionin higher, California costs - industrial park in California.


Locally apartments are being built but their construction is falling; Houston office buildings vacancies are the 2nd highest in the country at 22% (San Francisco is first) but some 14 office buildings are underway or are planned. Industrial projects, driven by shifting supply chains will continue for 24 months +/-. The industrial leasing activity in Houston remains high above the normal Houston average as shown in Table 34.
Despite this activity, the national AGC survey for 2023 activity shows infrastructure work - driven by the new infrastructure rebuild act - is projected to be the primary driver of activity (Table 36)


Buy America Act required domestic materials:
• Lumber
• Glass
• Drywall
• Fiber Optics
• Roads
Houston’s industrial market is wrapping up another banner year. As 2022 comes to an end, the region’s total net absorption will likely exceed 30 million square feet, a performance that is bested only by 2021, when absorption in the Houston market hit a record-breaking 33 million square feet.


Nationally, the NAIOP Foundation has been historically very accurate in predicting annual new industrial supply and net industrial absorption (net absorption = space leased - space vacated) until 2020 when all the rules changed. The blue box above, (Table 35) is the actual net absorption; grey is the new space.

• Bridges
• Highways
Expect to see work in place in 2024.
What everyone is missing, is part of this act has a Buy America clause requiring the purchase of domestic only materials in the categories shown above (Table 36) which will drive up some prices.

PAGE 12 © 2023 Durotech Inc, All Rights Reserved. May not be reproduced or used in whole or in part without the written permission of Durotech Inc.
Table 34
Table 35
Table 36
We can expect to see infrastructure work going into place this year and by Spring 2024 - because 2024 is an election year.
There are other cost drivers moving under the radar. One is as $4.1 billion push for long delayed funding need for VA hospital improvements and new facilities. Many state governments have similar needs.


Local governments are also faced with pressing needs for new and replacement facilities in rapidly growing areas as we can see in most suburban areas in Texas.
All this growth and, sometimes, once in a generation requirements will also put an increased demand for capital on the financial system.
While some materials fall in cost, what we are actually seeing is a slowing in the rate of increase.
Earlier we saw this construction PPI for February 2023 as compared to February 2022 by the US Bureau of Labor Statistics which you may want to show to people who question project budgets (Table 37). It shows a 16.2% overall increase for construction for that period and breaks that down by cost increase by building type. These percentages will move up and down in the coming months. Your constituencies should not be swayed by short term movements, although they will become points of contention due to not understanding their transitory nature.
Locally some trackings have Houston much lower, with a January to January cost increases n the 8% range. Durotech internal statistics, using a very solid yardstick, tracks Houston January 2023 vs. January 2022 at slightly over a 7% increase.
HOUSTON CONSTRUCTION OUTLOOK

Despite some private sector slowdown, we have a lot of contradictory activity for a supposedly down economy. In Texas and nationally, major multi-billion public and private sector projects are moving forward.
PAGE 13 © 2023 Durotech Inc, All Rights Reserved. May not be reproduced or used in whole or in part without the written permission of Durotech Inc.
Grouping Commodity code Unadjusted 12-month percent change(1) Seasonally adjusted 1-month percent change(1) Group code Item code Feb 2022 to Feb 2023(P) Sept to Oct Oct to Nov (P) Nov to Dec (P) Dec to Jan (P) Jan to Feb (P) Disability insurance inc uding accidental death(2) 41 1102 -0 3 0 0 0 0 0 0 0 0 0 0 Hea th and medical insurance 41 1103 0 9 0 3 0 1 0 2 -0 8 0 3 Property and casualty insurance(2) 41 1104 4 6 0 0 0 1 1 1 1 0 0 1 Annuities(2) 41 2 -0 2 -0 3 -0 9 0 0 -0 1 0 0 Residential property sales and leases, brokerage fees and commissions 43 21 1 5 -0 1 -0 2 0 0 -0 4 -1 0 Passenger car rental 44 1 1 6 2 6 -2 9 0 1 -1 9 -1 3 Legal services 45 1 6 6 0 4 0 4 0 3 1 6 1 1 Tax preparation and planning 45 2102 8 8 -0 4 0 3 2 5 -0 1 0 6 Arch tectural and engineer ng services 45 3 4 2 0 2 0 4 0 1 0 1 0 5 Management scientific and technical consulting serv ces 45 4 0 1 -0 6 0 0 1 2 1 1 -1 2 Arrangement of flights (partial) 47 1 14 8 2 6 0 5 -1 1 -0 5 1 1 Arrangement of vehic e rentals and odging(2) 47 2 3 8 1 9 0 7 0 5 0 3 1 3 Arrangement of cruises and tours(2) 47 3 7 4 4 6 0 5 6 5 -0 1 -7 8 Physician care 51 1101 1 0 0 4 0 1 0 2 -0 5 0 6 Med ca laboratory and diagnostic imaging care(2) 51 1102 0 0 0 0 -0 2 0 0 0 6 0 0 Home health and hospice care 51 1103 1 8 1 3 0 2 0 3 -0 6 0 0 Hospital outpatient care(2) 51 1104 1 7 -0 9 0 3 -0 1 1 2 0 0 Dental care 51 1105 4 9 -0 1 0 2 0 1 0 5 2 9 Hospital inpatient care 51 2101 3 5 0 5 0 4 0 4 0 2 0 2 Nursing home care 51 2102 5 7 0 8 0 4 0 2 0 5 0 3 Traveler accommodation services 53 11 10 0 3 5 2 4 1 9 -2 5 -2 7 Food and beverages for immediate consumption serv ces (part al)(2) 54 1 3 4 -0 3 0 7 -0 4 0 9 0 2 Motor vehicle repair and maintenance (partial) 55 2 5 2 0 5 0 3 0 3 1 1 -0 2 Membership dues and admissions and recreation facility use fees (partial)(2) 56 1 7 7 1 0 1 3 1 1 2 7 0 9 Recreational activity instruction fees (partial)(2) 56 2 1 6 0 0 0 0 0 0 0 0 0 0 Gaming receipts (part al)(2) 56 3 1 5 -0 2 -4 3 0 3 1 7 0 4 Mining services(2) 60 1 10 0 0 2 0 4 0 3 0 6 0 8 Final demand construction FD 43 16 2 2 6 0 1 0 0 1 8 0 1 New warehouse bui ding construction(2) 80 1101 12 9 2 0 0 3 -0 2 0 0 -0 4 New school building construction(2) 80 1102 16 2 3 3 0 0 -0 1 1 4 0 0 New office building construction(2) 80 1103 19 0 2 3 0 1 0 3 3 9 0 2 New industr al building construction(2) 80 1104 17 4 2 8 0 2 -0 1 1 1 0 2 New hea th care building construction(2) 80 1105 18 0 3 3 0 1 0 1 1 8 0 3 Intermediate Demand by Commodity Type Processed goods for intermediate demand ID6 1 2 1 -0 2 -0 5 -2 5 1 1 -0 4 Processed foods and feeds ID6 9112 5 0 -0 2 0 8 -0 6 0 2 -1 9 Meats 02 21 -1 7 -0 8 1 9 1 4 2 0 -1 0 Processed poultry 02 22 -12 9 -7 9 3 1 -9 9 1 2 -2 5 Dairy products 02 3 2 1 0 1 -0 2 -0 2 -1 6 -1 2 Footnotes (1) Al indexes are subject to rev sion for 4 months after their or ginally scheduled pub ication to ncorporate late reports and correct ons by survey respondents In addit on seasonally ad usted indexes are subject to change for up to 5 years due to the recalculat on of seasonal factors pub ished each January (2) Seasonal tests d d not ndicate the presence of seasonality Data shown is not seasonally ad usted (3) Trade ndexes measure changes in marg ns received by who esalers and retai ers (P) Pre im nary - Data not avai ab e NOTE: The term "(part al)" denotes ncomp ete coverage of the index category
Table 37
Locally major construction activity continues. MD Andersen alone plans $6.4 billion in new construction in the next 4 years. LBJ Hospital alone will have a $630 million addition. The Medical Center is underway with a major expansion which will add 100,000 new jobs. That is roughly 30 million more sf, which is going to eat up a lot of construction labor and pay higher wages, potentially driving up local costs.
This growth is going to strain infrastructure -as we have seen with a moratorium in Magnolia and larger capital recovery charges on Fulshear residential projects. Nationally California is having power problems-as, in a similar way, most people are experiencing here securing utility service.


What all these contradictions say, what all the economists are telling us in the constant daily predictions of recessionno recession - maybe a recession, is that all measures used for the last two or even three generations to evaluate and predict economic activity or a cycle, all the familiar terms and metrics that have been commonplace to use, are no longer applicable.
The ability of economic and political systems to adjust to events as they have in the recent past is no longer present to the same degree. Things will not return to what we knew them to be.
MD Anderson plans $6.4 Billion in project starts over the next 4 years.

The Urban Land Institute, PwC Emerging Trends 2023 report projects that Houston will add 100,000 residents per year for the next 5 years.
The easiest population scalable order of magnitude is house formation and educational impact: somewhere between 3,250,00) and 6 million sf of new K-12 projects per year are needed for this growth if a 250/sf/new student ratio is used.
Urban Land Institute/PwC Emerging Trends 2023 report:
• “Houston will add 500,000 new residents over the next 5 years.”

• At 50% household formation and 50% children, that equates to:

• 25,000 new students per year = 6,250,000 sf
• 13,000 new students per year = 3,250,000 sf

PAGE 14 © 2023 Durotech Inc, All Rights Reserved. May not be reproduced or used in whole or in part without the written permission of Durotech Inc.
Everything has Changed

We have to adapt, be agile, adjust, and recognize potential issues we may have to face in the daily functioning of facilities/real estate/design/construction/and real property administration and ownership.
Below are some issues which potentially could impact us, and then the possible cost environment for the next three years. There are only 3 or 4 high public visibility figures who are speaking directly to Change.
One is the Managing Director of the International Monetary Fund, who is quite candid about how Covid restructured global economics, and the war in Ukraine has changed both economics and geopolitical structures -the realignment of both alliances and trading patterns-, and why it is necessary to defeat Russia in Ukraine. She openly states economic and geopolitical structures have changed because of Covid and that war.


Mohamed El Erian, former head of PIMCO, the Harvard Endowment and now Cambridge University, is an internationally recognized economist and fund manager. He also is candid about how the era of easy money to which we have become accustomed has ended, and how going forward things will be different. The financial market has transitioned. It has already Changed.

Potential Cost Impactful Wild Cards Which Can Affect Us
Wild Cards
A number of near term wild cards can have immediate or longer duration impact on our local cost structures and are areas where Change is already in process.
None of what we are going to review about should be viewed as advocacy or critique of any particular political position.
What we are looking at are the signals of changing direction and trends which can affect our local cost structure from a local to a global perspective.

PAGE 15 © 2023 Durotech Inc, All Rights Reserved. May not be reproduced or used in whole or in part without the written permission of Durotech Inc.
Wild Card: Political
The political structure domestically and internationally has already Changed. Transition is in progress. Economic forecasters see polarized legislative bodies of all types and gridlock at all levels restricting important economic legislation.
The World Economic Forum, long promoting itself as the non-governmental pacesetter in addressing global issues, is now playing catchup with issues directly affecting everyday lives, in this case, from their most recent Davos gathering, waking up to the cost of living.


A recent Gallup poll shows a large number of Republican and Democratic voters - 42% of the electorate - now view the US government as the biggest problem in the US. Absent bipartisan resolution this percentage could increase and impact everyone.


PAGE 16 © 2023 Durotech Inc, All Rights Reserved. May not be reproduced or used in whole or in part without the written permission of Durotech Inc.
Foreign Affairs,the Journal of the very influential Council of Foreign Relations, often articulates issues 6 months or more before those issues appear in the mainstream. It, too, is playing some catchup with the rapid current of Change. Both articles appeared in The December 2022 Issue.

In the same issue, an article advocating a shift from NeoLiberalism toward the center, echoes an article from the first term of President Obama which advocated a shift from NeoConservatism to the center.

Again, playing catchup with a transition already in motion. Moving away from countries advocating global economics to more localized economic structures and basis is a key theme in this article.
The article “The New Industrial Age” (right), by the Congressman representing Silicon Valley (which he likely did not write) advocates a shift back to domestic manufacturing with an emphases on skilled workers, which has been a key factor in German economic success. We are already seeing this shift take place. The CFR is playing catchup.


All these are symptoms that Change has already occurred. Institutions regarded as thought leaders setting the pace are playing catchup. This a barometer that more Change in the political and geopolitical arena is underway.
In his 2020 book, “The Storm Before the Calm”, former Stratfor Chairman George Friedman forecast ten years’ domestic turmoil before the US politically balances its ship.
PAGE 17 © 2023 Durotech Inc, All Rights Reserved. May not be reproduced or used in whole or in part without the written permission of Durotech Inc.
Wild Card: Labor Shortage and Subcontractor Default


For some time there has been a growing construction labor shortage and slow rise in labor costs. At present, the skilled workforce is limited. Employees just shift from company to company. In the near future there will be a breakout of labor costs.
The Urban Land Institute, again as for ranks the last several years, availability of qualified labor, as the 2nd most important economic issue facing the entire built environment, outranked by only interest rates and cost of capital.

Despite some economic slowing, new jobs are adding to the economy month after month in excess of forecasts and traditional patterns, aggravating the construction workforce problem. By April 2023, construction unemployment was at a record low.


National forecasts of a rising labor shortage is an impactful -and performance restrictive- construction issue for which there is no quick solution. It is only a matter of time before it translates into increased costs.

Inflation is pushing up wages into higher construction paying jobs. ABC predicts that the construction workforce continues to face a 500,000 plus job opening gap vs. personnel available. National construction recruiter Birmingham Group’s annual salary survey showed 70% of contractors had to pay new employee salaries over their budgets and predicts a 5% wage increase in 2023.


In 2022, 70% of construction companies had to pay more than was budgeted for new hire salaries. In 2023, salaries will increase another 5%.
The Birmingham Group Newsletter

PAGE 18 © 2023 Durotech Inc, All Rights Reserved. May not be reproduced or used in whole or in part without the written permission of Durotech Inc.
Many contractors report higher backlogs but are struggling to find staff.


A recent NY Times essay (below) on why construction productivity is continuously falling, linked it to the same drop in the overall economy labor productivity and offered a researched conclusion that the productivity drop is due to an increasing regulatory environment.


Even the annual AGC Risk conference of bonding agents sees the worker shortage as the #1 construction risk. Risk #3 is subcontractor default (failure/bankruptcy).

Many General Contractors are experiencing more and more subcontractor failures. This failure rate will accelerate over the next 18 months. This is important to project owners and design teams because it can delay and financially impact projects, regardless of who the General Contractor may be.

We saw this cash curve earlier but need to revisit this example (Table 38) for illustrative purposes of how the rise in materials prices has drained down subcontractor and some general contractor cash reserves. A drain down leaves a firm in a weakened position and more susceptible to potential default.
The same regulatory symptom surfaced a month later in another Times article on why chip plants cost so much to build in the US.

Table 38
Over the next 18 months, subcontractor selection will be a critical part of project performance. Owners would be prudent to consider General Contractor subcontractor recommendations.
The key aspect of this part of the report is that we can, at some near term future date, expect labor cost to rise as the qualified labor supply further reduces and should prepare for potential subcontractor defaults. Owners can reduce some regulatory cost impact by securing earlier all utilities, permits, and services.

PAGE 19 © 2023 Durotech Inc, All Rights Reserved. May not be reproduced or used in whole or in part without the written permission of Durotech Inc.
2020 2021 2022 2023 2024 Sample Subcontractor Industry Cash Curve Prices Cash Resources Cash Needs
Wild Card: Weather

National weather has been severe and disruptive for several years. Media reports completely miss the rebuilding cost caused by tornadoes, flood, and the impact we have yet to see from heavy snow melting.


Some cost impact on key electrical equipment - the need to replace storm damaged transformers, switchboards, switchgear and electrical lines - may arise. If replacement needs are widespread, it could further negatively pressure delivery dates for already slow to procure materials.
However, if we look at conservative Northern Trusts’ 2023 and 2024 forecasts for real GDP growth, they were healthy at 4.6% and 3.9% respectively - contradictory to recessionary forecasters. They recently lowered their forecast - a sign of confusion in economic indicators. The Federal Reserve is less optimistic (Table 39).


Wild Card: Capital Markets and Banking

Larry Summers is a well credentialed financial leaderformer Treasury Secretary; Former Chairman of the Council of Economic Advisors; Former Harvard President, among other positions.
He predicts 3 upcoming strains on the capital system:
(1) People seeking higher yield after years of a lower yielding market.


(2) Defense spending driven by the repercussions of the Ukraine war-and this will be a worldwide trend - plus conventional and asymmetric threats from increasingly aggressive states such as China, Russia, and Iran and its proxies. This spending will require significant capital from the government.
(3) Capital demands for infrastructure, debt repayment, and for-profit entities needing to replace older, low-cost debt with equity.
A salient sign that everything has permanently Changed is no forecaster is able to predict with any semblance of past accuracy what is going to happen in the economy. Every forecast is different. Methods which no longer have the same accuracy due to systemic structural changes are being used.


Our take-away is: there is no consensus. Past measures are not working. We have to be prepared for good or for worse. Even one of the Federal Reserve Presidents thinks interest rates are too low to cool inflation, as does JP Morgan Chairman Jamie Dimon. It is unlikely rates will rise again at this time and inflation will stay with us. It takes about 12 months for rate changes to impact the markets and 2024 is an election year. The Fed always sides with lesser electorate impact in an election year.

PAGE 20 © 2023 Durotech Inc, All Rights Reserved. May not be reproduced or used in whole or in part without the written permission of Durotech Inc.
Table 39
JP Morgan Chairman Jamie Dimon is one of the few articulating things have changed and who has the courage to cry out in the wilderness. In this case, as you can see from the face of the Fox interviewer, he is calling out serious future economic dangers. His point is shown at the bottom graphic in a CBO projection (Table 40). While Congress tries to cut federal spending by cutting social security (but not Congressional pensions), interest on national debt will in a relatively short period exceed both Social Security and Medicare costs. This issue has been discussed for decades but at this level could cripple the economy if unresolved.
of commercial real estate loans valued at $1.5 trillion are due in the next 3 years with commercial real estate owners foreseeing a disaster. A negative, major drop in real estate valuations would affect public sector tax revenues. There are systemic consequences if this happens.
Goldman Sachs is the sole source stating it will not be as bad as predicted.


Table 40
Another looming financial issue is commercial real estate mortgages, (Table 40) with over $270 billion coming due this year in a down commercial real estate (CRE) marketespecially for office buildings - and 380 million square feet


PAGE 21 © 2023 Durotech Inc, All Rights Reserved. May not be reproduced or used in whole or in part without the written permission of Durotech Inc.
This March 2023 Newsweek bulletin sums up 3 of our potential Wild Card themes: banking issues, weather impact, and defense spending.


Overlooked is a simultaneous observation from Stephanie Pomboy, who seldom speaks publicly but provides very expensive, insightful, and accurate by subscription only advisory services to financial institutions and major investment firms. She states the US banking system currently has a $620 billion problem. Banks typically invest in government securities. When interest rates were very low they bought heavily into 1% +/- US T Bills and still hold them. T Bills are now in the 4-5% range. As a result, the older T Bills are worth less than their face value in the current market. They will pay off face value and yield at maturity. However, if forced to follow mark to market accounting policies (i.e. value the securities at present market value), which (for example) in the last few years bankrupt a number of oil companies in reserve value write downs, then the banking system is under water with losses and equity write-offs, and bank failures will rise.


PAGE 22 © 2023 Durotech Inc, All Rights Reserved. May not be reproduced or used in whole or in part without the written permission of Durotech Inc.
A key point here is Moody’s cutting its credit -worthiness rating of the US banking sector after several recent banking failures.
Presumably they will be allowed to forego market to market, but no such relief is presently in sight. They will have to raise both their loan underwriting standards and the rates they charge, affecting contractors and materials supply cost inputs. Big banks currently report much higher earnings. The largest banks may not be the ones most damaged, as high earnings can offset some mark to market hits.

The banking/financial sector creates private sector project cancellations due to higher underwriting, interest, and equity contribution required. If so, we may see a migration of public sector inexperienced private sector contractors into public sector work at possibly artificially or erroneously low prices. This is a period requiring caution and prudence.

Wild Card: Energy
Over the last several years, the media and the current administration have worshiped electric vehicles while castigating and threatening electricity suppliers and energy companies. Traditional energy suppliers see the administration as their adversary and traditional energy supplies are less available than in the past. Even OPEC recently cut production by 1 million barrels per day.

Domestically, Pioneer Natural Resources CEO Scott Sheffield predicts domestic production cannot be grown, and more working rigs will simply raise cost and energy prices due to a shrunken oil services sector (Table 41).


PAGE 23 © 2023 Durotech Inc, All Rights Reserved. May not be reproduced or used in whole or in part without the written permission of Durotech Inc.
Table 41
Such a rise will directly and quickly impact construction cost on your projects if either comes to fruition, both in manufacturing and transport cost inputs. Based on recent painful experiences, contractors and manufacturers will not hold down pricing if they see an increase. Others may be trapped in a cost structure which is prohibitive under new energy costs. The consequentials for project cost could be meaningful.

Beginning late last year, a diesel problem was already appearing across the country and some diesel suppliers are beginning to require a 3 day delivery notice.


If an energy price rise hits, here is insufficient spare production capacity available to respond to it. As this graphic shows, (Table 42) it was available during the pandemic but is not presently available. Additionally, the government drew down the national strategic petroleum reserve to below 1985 levels - but has not replaced it and has significant additional draw downs scheduled. The chart on the right tracks the reserve draw down to oil prices. A reserve replacement will force prices up, unless executed by expert traders (Table 43).


PAGE 24 © 2023 Durotech Inc, All Rights Reserved. May not be reproduced or used in whole or in part without the written permission of Durotech Inc.
Table 42
43
Table
Similarly, during the pandemic, the US had a significant inventory of DUC (Drilled but Uncompleted) wells ready to put into production ( exists and drilling is not at past levels due to the adversarial industry relationship of the administration and media and the destruction of the oil services industry. Nor is the workforce available to restore it.


The CEO of Pioneer predicted $90 barrel oil (bbl) by summer. In mid-April it sat at $82. In mid-May it was $71/bbl. (Table 45) Raymond S. James energy analysts predict it will break $100/ bbl this summer based on demand, reserve levels, DUC’s, and lack of drilling incentives and capacity (Table 46).

Annual Averages 2021A2022 RJ Est.2022A'21-'22 Change2023 RJ Est.'22-'23 Change


CrudeOilPrice(WTI)$67.07$75.00$94.0040%$100.006% CrudeOilPrice(Brent)$70.53$78.00$99.0040%$105.006% NaturalGasPrice(HenryHub)$3.89$4.00$6.5268%$6.00-8% U.S.RigCount47065072254%80011% Year-End Index Values 2021YE2022YE RJ Est. 2022YE'21-'22 Change2023YE RJ Est.'22-'23 Change S&PTotalMarketE&PIndex36864707-5084510338%6124-663420-30% PHLXOilServiceIndex53NM8154%98-10620-30% S&P1500IntegratedOil&GasIndex422465-50870868%814-84915-20% S&P1500Refining&MarketingIndex1,3721579-1819220461%2535-275515-25% WilderHillCleanEnergyIndex149181-19676-49%99-10630-40% AlerianMLPIndex179210-21921319%245-25615-20% Source:Factset,RaymondJamesresearchNote:2022RJestimatesdenoteRJforecastsatyear-end2021
Oil price outlook: We forecast prices averaging in the triple-digits in 2023, with an upward trajectory during the year.
PAGE 25 © 2023 Durotech Inc, All Rights Reserved. May not be reproduced or used in whole or in part without the written permission of Durotech Inc.
roduced in any form without written permission of Durotech Inc. Oil Supply-Demand: Year-Over-Year Changes (MMbpd) –RJ Estimates 2023E 2022E 2021A 2020A 2019A -0.1 -2.4 2.3 0.1 0.8 Previous Year Build/Draw 0.8 0.9 -0.8 1.0 0.6 2.9 0.3 0.2 1.1 -0.6 -0.8 -5.3 1.8 0.3 -1.8 U.S.SupplyGrowth Non-OPEC,Ex-U.S.&Biofuels OPEC+SupplyGrowth 0.9 4.5 1.5 -6.7 0.3 Total Supply Change 1.4 2.3 6.1 -8.9 0.8 Total Demand Change -0.6 -0.1 -2.4 2.3 0.3 Inventory Build Estimate Source: IEA, EIA, Raymond James research
2022. All rights reserved. May not be reproduced in any form without written permission of Durotech Inc. 2023E 2022E 2021A 2020A 2019A Previous Year Build/Draw U.S.SupplyGrowth Non-OPEC,Ex-U.S.&Biofuels OPEC+SupplyGrowth Total Supply Change Total Demand Change Inventory Build Estimate Source:
ission of Durotech Inc. 61 s 23E .1 .8 .9 .8 .9 .4 .6
©Durotech
IEA, EIA, Raymond James research
2021-22 Actual and 2023 Forecasts
Even Foreign Affairs in a mid-April issue predicts energy resources will become a matter of national interest for all states and it has already started a realignment of geopolitical interests. If that isn’t enough, we have a final wild card.
Table 44
Table 45
Table 45
Table 46
Wild Card: The Ukraine War


Jamie Dimon, JP Morgan CEO, has accurately stated that the Ukraine War is the greatest existential Geopolitical threat since WWII and that its outcome will determine the course of the rest of this century. The IMF head and Larry Summers agree with him. It is important to understand why they have this view and how dangerously it can impact us. To do that, we need to ignore the fog from the media and Washington and follow the 25 year progression which has manifested into this situation.
• “This is the most serious geopolitical thing we’ve had to deal with since World War II,” Dimon said Monday, also highlighting the war’s impact on relations with China.


With the fall of communism, Russia lacked a focus and unifying vision, like defeated post WWI Germany. It struggled with its identity and its future as a nation. Then in 1997, questionably balanced Russian PhD Alesander Dugin published his book “Foundations of Geopolitics”. It proposed a galvanizing vision for Russia which quickly found supporters in the disenfranchised political, intelligence, and military elite: disrupt western political and information systems; conquer and destroy the Ukraine and quickly retake all former Soviet satellite states; threaten the remaining European states into submission with nuclear weapons; and, aligned with China and Iran, first isolate then later destroy the UK and the US. This book, as incredulous to us as its premise may seem, is taught in the Russian General Staff College to all top Russian military leaders. The people around Putin support it as the vision for their regime, and Russian national actions follow its playbook. The first phase was to sow confusion, polarization, and distrust in the American political system and media. The second phase is delayed in the Ukraine; the third phase is underway. This is really what Dimon, Summers, and the IMF head are speaking to. It is why Finland joined NATO and Sweden has applied. This information is not at all hard to find. American media and many politicians appear oblivious to it.
War effects at this point are far reaching. Chatham House a London based International Affairs Think Tank, has issued an early report on how this war has impacted the world so far in major strokes.

This war has already started massive spending worldwide on new defense systems. The US this year has an $886 billion defense budget. The navy is asking for $380 billion more for additional submarines. Larger expenditures will be forthcoming. Other countries are taking similar steps. This will result in more capital markets pressure.

PAGE 26 © 2023 Durotech Inc, All Rights Reserved. May not be reproduced or used in whole or in part without the written permission of Durotech Inc.
• The outcome in Ukraine will determine the events for the rest of this century.
And Ukraine may be the unfortunate prototype for future regional wars, in this case, one which could arise in Asia although the Persian Gulf would seem more likely. The Ukraine war is another demonstration that Changes with major consequences have already altered past paradigms.
Local Construction Cost Impactors
2-4 Year Events
Inflation High probability it will continue through 2025
Materials Cost and delays continue through Q3/2022 and are bumpy in 2024.
4-7 Year Events
Infrastructure Work, especially at Houston metro level, raises steel / concrete / underground / site costs. Buy America impact.
Texas Medical Center 3 More construction begins, drawing down skilled labor supply. In Billions.
Metro Area Residential
Subdivisions Increase and multi-family work pushes some costs.
K-12 $8 billion+ of Houston metro area K-12 2022 bonds on 2022 ballots
Banking Work out of systemic issues
Political Rebalancing
15 + Year Event
Labor Costs appear likely rise for skilled labor. This can become a long-term impact / Davis Bacon Impact.

Energy Cost Appear likely to rise and filter into all product costs due to petroleum-based components. Expect price increases
Defense Spending rises causing some metals and critical materials and electronic costs to increase. Expect large expenses
Reshoring/Restructuring of Supply Chain Increases manufacturing/distribution construction and costs
Ukraine war consequences Impacts rest of the century
Source: Durotech Inc. proprietary Texas market wide cost survey.
Table 47
Last year we offered this list of contributors to the causes for the cost explosion and supply chain issues.
Nothing among them has changed. There are other factors arising which have been added and which could be impactful in our immediate future (Table 47).
Looking at possible wild card cost impacts, the following near term possibilities may appear:
We may continue to see a slide in costs during the year as some alternate non-electrical supply chain issues improve or resolve (electrical will continue to be problematic). However, it appears possible that later in the year, as a consequence of some of the wild cards we have discussed, we could see a rise in costs. (Table 48).


Table 48
The first would be oil price increases starting this summer with construction costs responding quickly. (Table 49).

Table 49
The second would be banking and construction bond underwriters raising loan and bond underwriting requirements. This would raise costs to contractors and be passed through to projects. GL cost have already been scheduled to rise in single digits this year (Table 50).
Table 50
PAGE 27 © 2023 Durotech Inc, All Rights Reserved. May not be reproduced or used in whole or in part without the written permission of Durotech Inc.
The third would be rising contractor default rates. This started last year and will continue to increase over the 18 months. If so, this will directly impact projects costs (Table 51).
BUT despite all these factors, we do not believe the potential cost implications are as severe as they might appear.
Last year our 3 year slower recovery forecast was for 8 to 12%.
This year we believe the cost increase could fall between 8 to 12% depending on how many wild cards play out and when and how quickly the construction cost market responds to them (Table 53). To venture a closer guess, we would say 9.25%. That number will continue into early 2024, and fall with energy prices.


If weather damage creates a strain on the supply chain for specialty and key electrical materials, it appears likely to hit about the same time as the storm damage assessment is completed and replacement materials are ordered. The net result of any or all of these appear to possibly arrive in the construction sector in the 2nd half of the year between July and November, pushing costs upward depending on how quickly contractors and suppliers respond (Table 52).
At this time, it looks like 2024 could be a 6-10% increase. 2025, if things settle down further, appears at this time to be in the range 5-8% increase.
All in all, this would be a better cost ride than we have had in recent years. Hopefully it will be lower than our forecast. However, so many macroeconomic variables are at play, until some conditions ore stabilize, the best mode for all parties in the built environment is remain alert to possible shifts in macroeconomic circumstances which could have farther reaching effects on their projects.
Note: This cost projection is an opinion and is not warranted in any way due to the volatility of the current circumstances. Facility Owners are advised to consult with their professional advisors.
Note: You should not rely on Durotech’s projections as a basis for any determination for your purposes. You should retain professional expertise and evaluate the individual circumstances of your factual scenario in determining any escalation for any building program under consideration.
PAGE 28 © 2023 Durotech Inc, All Rights Reserved. May not be reproduced or used in whole or in part without the written permission of Durotech Inc.
Table 51
Table 52
Table 53

