
9 minute read
Port Congestion Easing

The actual container volume from China into US ports has fallen very dramatically and manufacturing orders have fallen 40% in China (Table 19). Falling US orders to China have reduced bottlenecks as the supply chain shift gets underway.
The actual month by month TEU import container volume shown in the blue line has fallen until March of 2023 (Table 21). In April, it has begun to rise (Table 22).
Advertisement
By Port of Entry container volume has been moving more selectively to ports, in this case from February to March. However in February, Houston was the only major port to see a big container increase (20%) and it maintained that level at 0% March change (Table 23). It and all ports except Tacoma are rising again, but LA/Long Beach is nowhere near their prior volume (Table 24).
Table 26
of gravel for Genoa's new foranea dam
Genoa
Two ships carry 3,000 tons of material per day from Piombino
SHIPPING
The first ship of the Diamond Line PNX service is approx
Go Ligure
The line links Italy with Turkey through the port of Piraeus
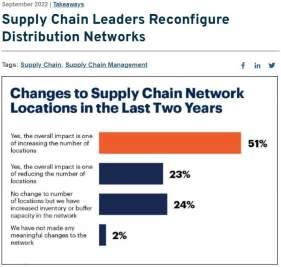
Currently the West Coast longshoreman’s contract is being renegotiated. It will affect future shipping plans. Some importers are returning only portions of their business to LA-Long Beach. Typically those are smaller and mid size importers. Larger firms can shift and reposition their distribution network to other ports and locales. As shown on the red bar in this article (Table 27), 51% have made changes and many are only partly returning to the West Coast.
JOBS
Filt, Fit and Uilt deem positive the government's first measures
Print Close
I'm a successful female minority truck driver. California's AB5 forced me to leave the state I love

By Dee Sova
Published January 30, 2023
Fox News
To most people, owning your own business is a way to become successful. For me, it was a mission – a lifeline to a brighter future for myself and my daughters.
That journey began in California more than three decades ago, when dropped my nursing studies to get a commercial driver’s license. As a woman, the thought of working in a male-dominated field was intimidating at first. But those initial fears soon gave way to the rewarding opportunities that a career in trucking offers.

The change was unexpected. As a single parent raising four daughters, I needed both flexibility and the opportunity to provide for them. Which is why, in 2015, I partnered with Prime Inc. to become an independent
Manufacturers and distributors can no longer depend on a just in time delivery system, (see below). They are increasing domestic and volumes. “The more data shippers can provide to a carrier, the fewer surprises they have when engaging in negotiations and contracts,” Bourke says. Some 3PLs recommend shopping carrier rates for every shipment.
“If you aren’t shopping carriers on every order, you are overspending and under-delivering,” says Sean Henry, co-founder and CEO of supply chain start-up Stord. “At the same time, robust technology to intelligently shop carriers is critical the more you add to your portfolio.”
Saatva looks at online reviews during the carrier vetting process but takes them with a grain of salt because it’s rare for satis ed customers to leave positive feedback.
“If we used Google or Yelp reviews during the initial stages of our vetting, we wouldn’t have been able to build our network at all,” Dimilta says. n
Disruptions Mean Business
Supply chain disruptions have had a positive impact on expedited final-mile providers. Shipments that used to go less-than-truckload (LTL) now go to last-mile carriers, says The Customized Logistics and Delivery Association (CLDA), which represents the first to final miles of the supply chain in the United States and worldwide.
“The delays in the supply chain mean that shippers can’t always depend on LTL transportation to get things where they need when the customer needs them,” says Tim Cocchia, COO of Xcel Delivery Services and CLDA board member. “In these cases, they turn to lastmile delivery partners.
“Before the disruptions, LTL could get products to their destinations in a timely manner,” Cocchia says. “But with the disruptions that’s no longer the case. Last-mile providers take delivery of the items, store them in our warehouses until they are needed, and deliver them when it’s time. We have always done some of these deliveries, but the demand has dramatically increased.”
IMPACT ON JUST-IN-TIME
150 carriers over many years, the Saatva team can spot problems and take action.
“We are so good at monitoring our partners that we can tell whether or not it’s a new delivery team, even when there’s a mechanical breakdown in our delivery partner’s day-to-day operations,” Dimilta notes. Saatva’s claim rate is less than 1% of all deliveries.
When selecting carriers, ask them to provide quotes for actual shipments, using six to 12 months of anonymized data to give a realistic view of lanes
Supply chain issues have had a dramatic impact on companies that depended heavily on the just-in-time model. “Right now, just-in-time doesn’t work,” says Cocchia. “In the past, just-in-time made economic sense. It worked because those in procurement knew they could wait until the last minute to order what they needed and get it right away. The customer could keep their money in the bank, order at the last minute possible, and have it show up on the day it was supposed to without redelivery and warehousing fees.
“Not anymore,” he adds. “Today, companies order products ahead of time because they’re not sure when they’ll come in. They ship those products to last-mile providers’ warehouses to hold them for as long as needed, and then deliver them exactly when needed.”
Flexibility is now key. What all of this means to your projects is: a. Costs are down but land transit for deliveries can still be an issue. b. Ocean shipping costs will be lower until a portion of the merchant fleet ages and is scrapped. c. West Coast longshoreman’s strike and wage increases will affect some mid and small supply chains and push traffic elsewhere.
2022 - 2023 White Collar Lay-offs
d. The delivery portion of the supply chain appears to be stabilizing, except for trucking. A restructuring is underway in the tech and bio-tech businesses. These 2022 layoffs of 24,600+ works and biopharma layoffs of 7,400 workers are only a portion of the white collar disruption in these industries (Table 28).
2022 - 2023 White Collar Lay-offs
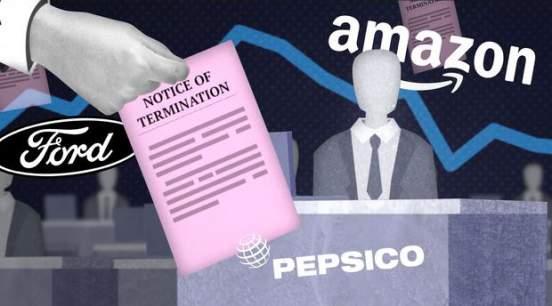
Table 29
Layoffs in these sectors accelerated in 2023 with almost 35,000 tech layoffs through early February 2023 and 21 bio-pharma companies announcing 2023 layoffs, as opposed to only 1 major manufacturing layoff of 2,500 workers (Table 29).
Disruption and change have arrived at industries once promoted as unstoppable juggernauts have laid off 60,000 white collar personnel in the last 1-1/2 years. It is a sign of industries maturing.

It is a sign of Change.
Notice something important in these statistics: there are no blue collar layoffs other than at one manufacturer.
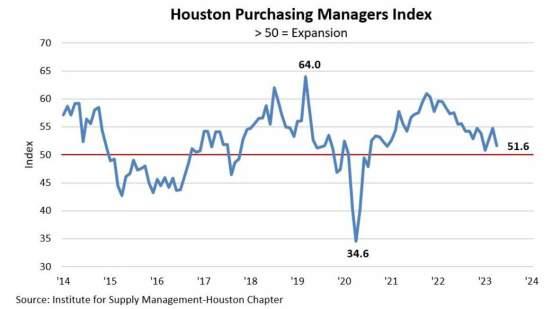
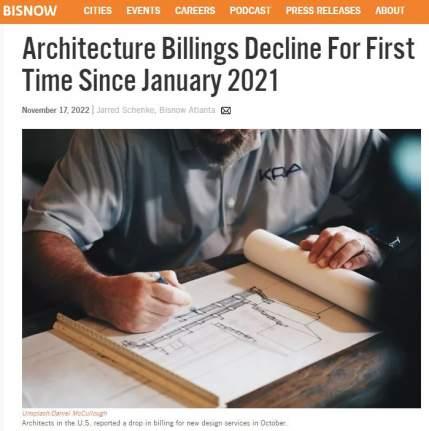
In November of 2022 the Architectural Billings Index, which foreshadows construction activity, dropped for the first time since January 2021. It has continued to drop every month since then. This is a reflection of increased interest, cap rates, and recession fears in the private sector. Yet the Houston purchasing manager index of activity continues above the critical 50% line, indicating upbeat activity (Table 30). This and other contradictions exist because our traditional paradigm of economic structure has changed.
Apartment rents are falling nationally and the National Association of Home Builders predicts a national decline of 28% in 2023 multi-family construction. Houston new inside the loop apartments only have a 54%occupancy as of the February 2023 Houston apartment market occupancy report. But there are currently 1 million apartment units under construction nationally.

NAHB 2023 Forecast is for a decline of 28% in multi-family construction nationally. In February 2023 local market occupancy report, new inside the loop apartments only have 54% occupancy.
By contrast, on 11/3/22, Simon Group Chairman David Simon reported nationwide retail occupancy of 95.6% and record sales of $746 per square foot. Locally Simon Group owns The Galleria and several outlet centers.
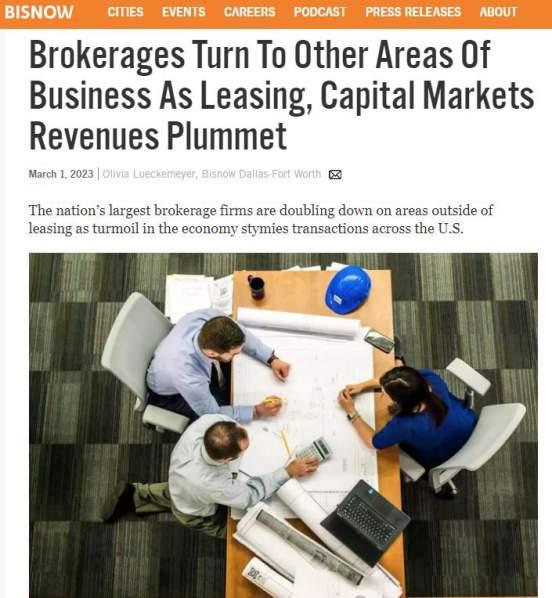
The major national brokerage firms are being driven down by the current office market, cutting staff and seeking new lines of business primarily due to post covid office vacancies. Despite this, Simon Group Chairman David Simon, owner of premium malls nationally (including The Galleria complex), reported in November of 2022 that Simon had 94.6% occupancy and record malls sales of $746 per square foot-a complete contradiction to the apartment market and to much of retail, which continues to downsize and where even some retail chains are collapsing.
It is also a job creator in a tight labor market: 406,000 manufacturing jobs in 2023.
Manufacturing is driving construction starts and it is just picking up steam. Billions are being spent on new plants. Non-residential building activity in December 2022 is up 38% over the same month a year earlier. It is now starting to fall. But it now moves up and down monthly Manufacturing reshoring and restructuring is a 15 plus year cycle, so we should anticipate significant longer term workforce and construction impact from this movement.
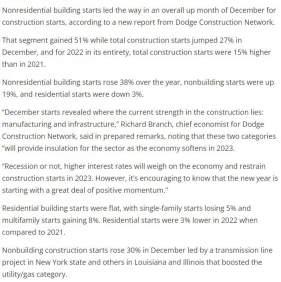
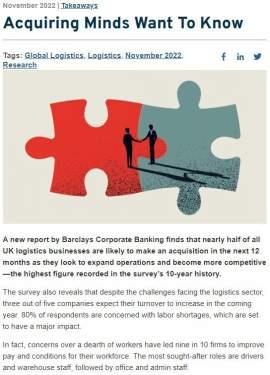
At the same time, logistics firms are looking to expand by acquisition and manufacturing firms are bringing factories back to the US and Mexico from overseas but this restructuring takes time.
Site selectors see 2023 as their super bowl - the once in a generation shift in global manufacturing.
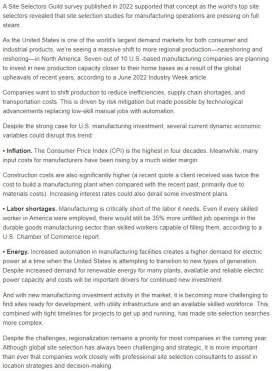


Table 31
Table 32
And in February, building materials saw a price increase. In March, some prices fell. It alternates monthly, in contradiction to historic patterns (Table 33).
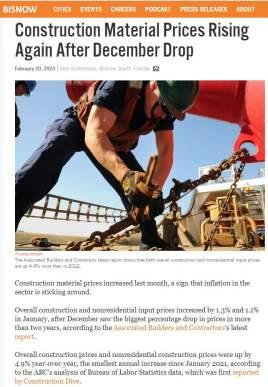
Table 33
All this activity is contradictory to our historic measures and paradigms. For example, by March, the Dodge Momentum Index of new construction activity was starting to drop. But at the same time, while construction job openings fell in February, the pay scale increased.
By April, unfilled construction jobs hit a record high and construction unemployment hit a record low. And while major construction projects experienced big cost increases and tariffs impact construction materials, cost increases have begun to mitigate. Again, contradictions we are unaccustomed to seeing have begun to appear everywhere.
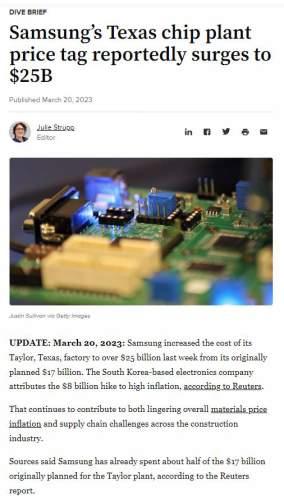
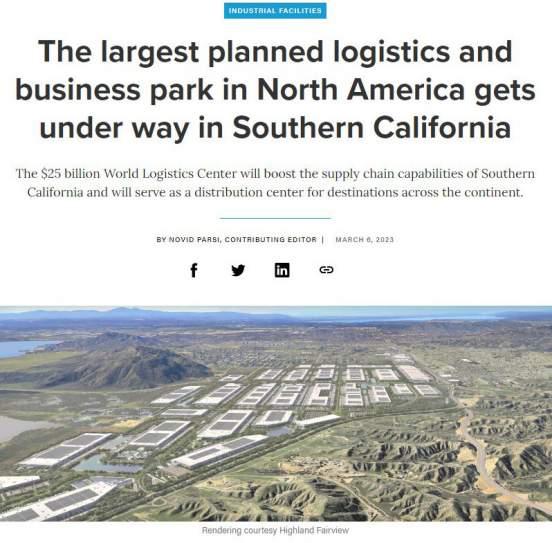
This clearly proves out supply chain and manufacturing demand. By 2025, we will see new distribution space slowing. Still, some longer term incredibly large industrial projects are planned, including a $25 Billionin higher, California costs - industrial park in California.
Locally apartments are being built but their construction is falling; Houston office buildings vacancies are the 2nd highest in the country at 22% (San Francisco is first) but some 14 office buildings are underway or are planned. Industrial projects, driven by shifting supply chains will continue for 24 months +/-. The industrial leasing activity in Houston remains high above the normal Houston average as shown in Table 34.
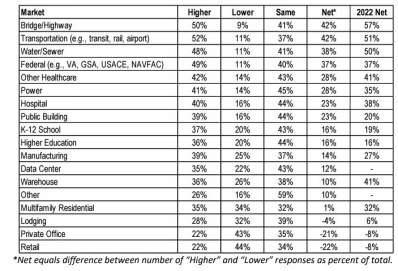
Despite this activity, the national AGC survey for 2023 activity shows infrastructure work - driven by the new infrastructure rebuild act - is projected to be the primary driver of activity (Table 36)
Buy America Act required domestic materials:
• Lumber
• Glass
• Drywall
• Fiber Optics
• Roads
Houston’s industrial market is wrapping up another banner year. As 2022 comes to an end, the region’s total net absorption will likely exceed 30 million square feet, a performance that is bested only by 2021, when absorption in the Houston market hit a record-breaking 33 million square feet.

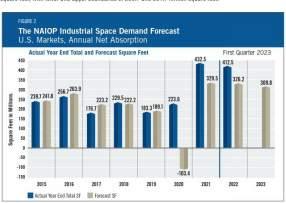
Nationally, the NAIOP Foundation has been historically very accurate in predicting annual new industrial supply and net industrial absorption (net absorption = space leased - space vacated) until 2020 when all the rules changed. The blue box above, (Table 35) is the actual net absorption; grey is the new space.
• Bridges
• Highways
Expect to see work in place in 2024.
What everyone is missing, is part of this act has a Buy America clause requiring the purchase of domestic only materials in the categories shown above (Table 36) which will drive up some prices.
We can expect to see infrastructure work going into place this year and by Spring 2024 - because 2024 is an election year.
There are other cost drivers moving under the radar. One is as $4.1 billion push for long delayed funding need for VA hospital improvements and new facilities. Many state governments have similar needs.


Local governments are also faced with pressing needs for new and replacement facilities in rapidly growing areas as we can see in most suburban areas in Texas.
All this growth and, sometimes, once in a generation requirements will also put an increased demand for capital on the financial system.
While some materials fall in cost, what we are actually seeing is a slowing in the rate of increase.
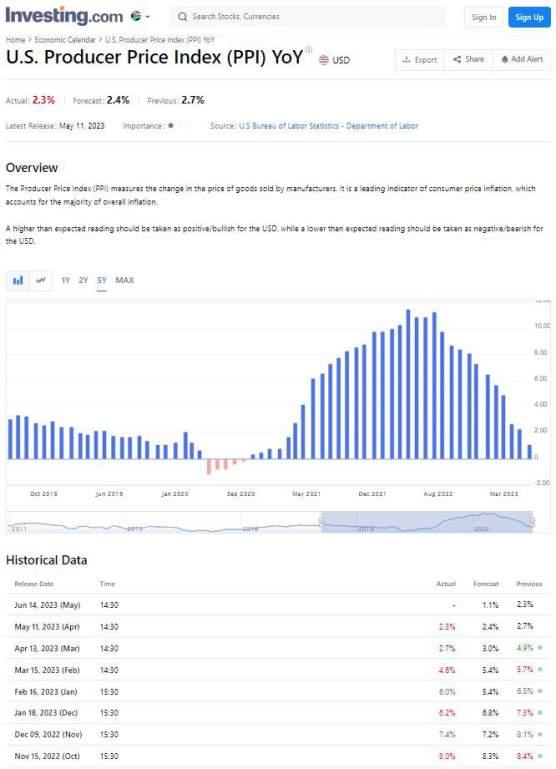
Earlier we saw this construction PPI for February 2023 as compared to February 2022 by the US Bureau of Labor Statistics which you may want to show to people who question project budgets (Table 37). It shows a 16.2% overall increase for construction for that period and breaks that down by cost increase by building type. These percentages will move up and down in the coming months. Your constituencies should not be swayed by short term movements, although they will become points of contention due to not understanding their transitory nature.
Locally some trackings have Houston much lower, with a January to January cost increases n the 8% range. Durotech internal statistics, using a very solid yardstick, tracks Houston January 2023 vs. January 2022 at slightly over a 7% increase.


