DOWNTOWN LA MARKET REPORT
YEAR-END, 2O22
Photo by Vistity
ABOUT THE DCBID
Founded in 1998, the Downtown Center Business Improvement District (DCBID) has been a catalyst in Downtown Los Angeles’ transformation into a vibrant 24/7 destination. A coalition of more than 2,000 property owners in the Downtown Center, the DCBID members are united in their commitment to enhance the quality of life in Downtown LA.
The mission of the Economic Development team is to improve and revitalize the District and bring investment and new businesses to the area. We provide services to current and prospective residents, workers, and businesses, including:
• Development Consulting
• Research and Information Requests
• Events and Marketing
• Housing and Office Tours
• Customized Tours and Reports
Whether you need information on development, opening a business location, or you just want to learn more about Downtown’s market sectors and dynamics, we are the portal for information about the District and DTLA.
To learn more about Downtown’s Renaissance and how to join us, visit www.DowntownLA.com
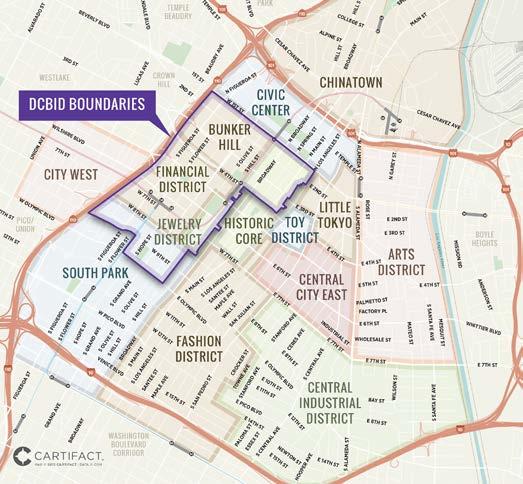
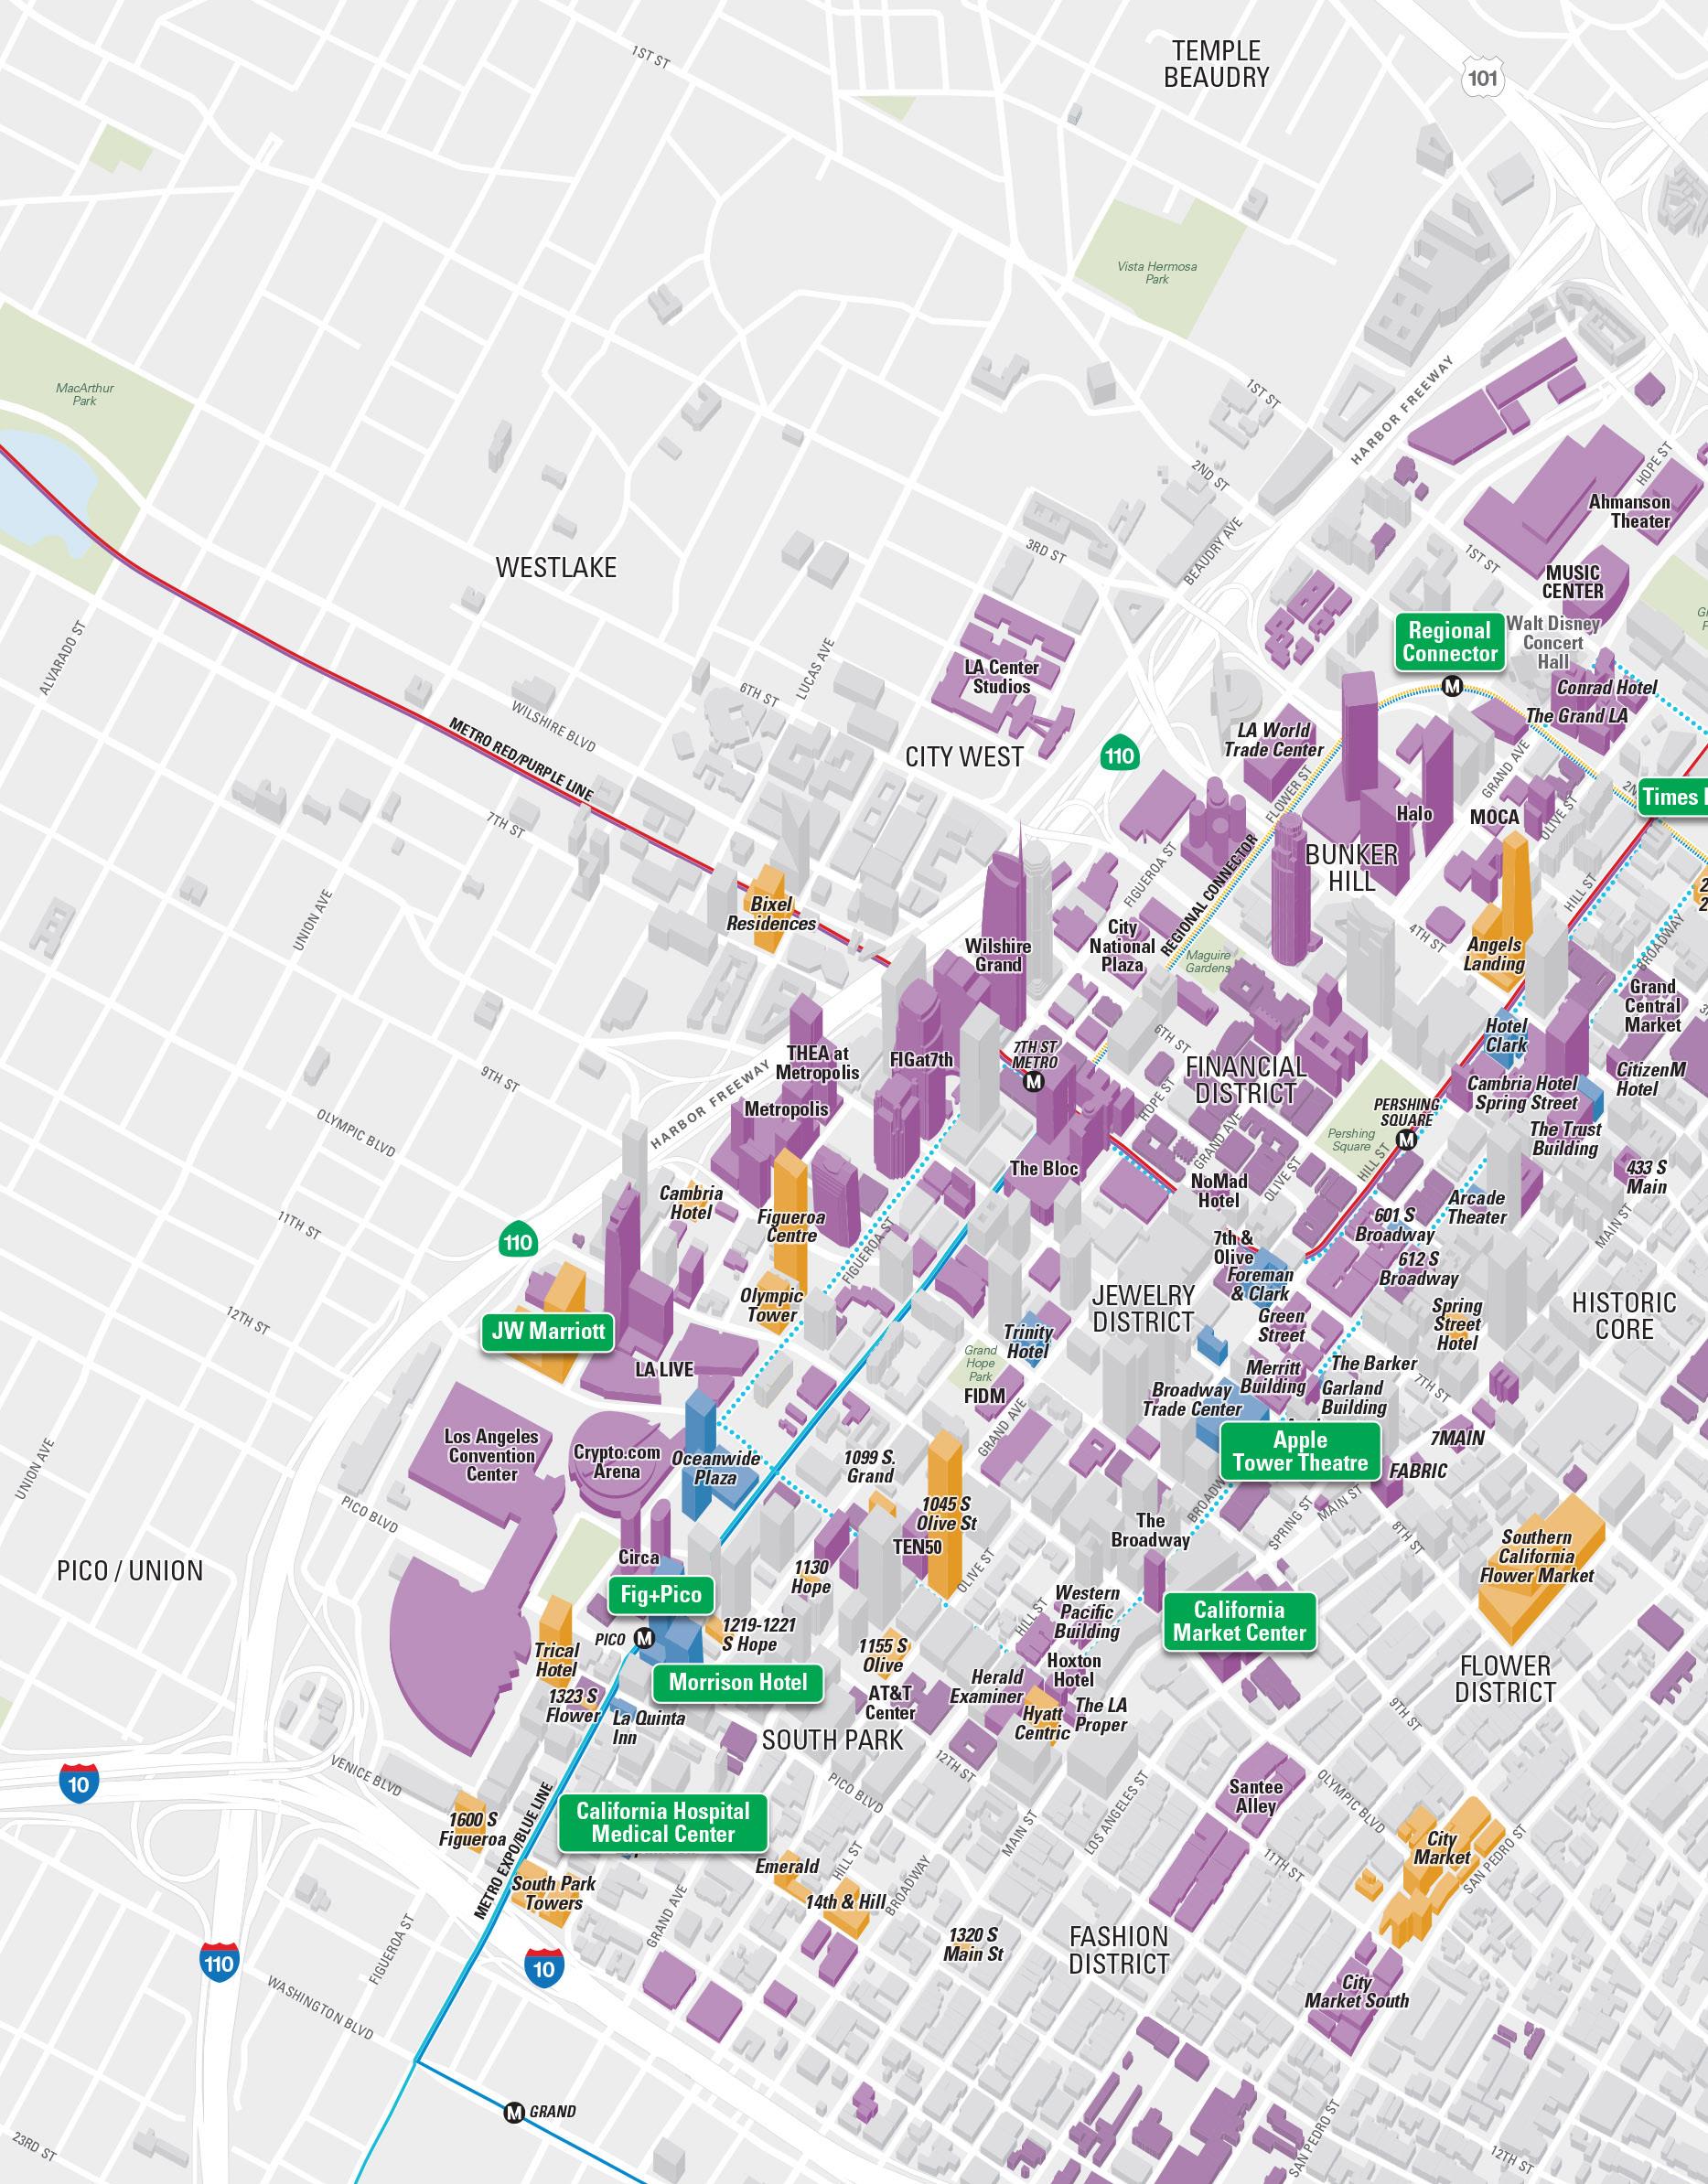
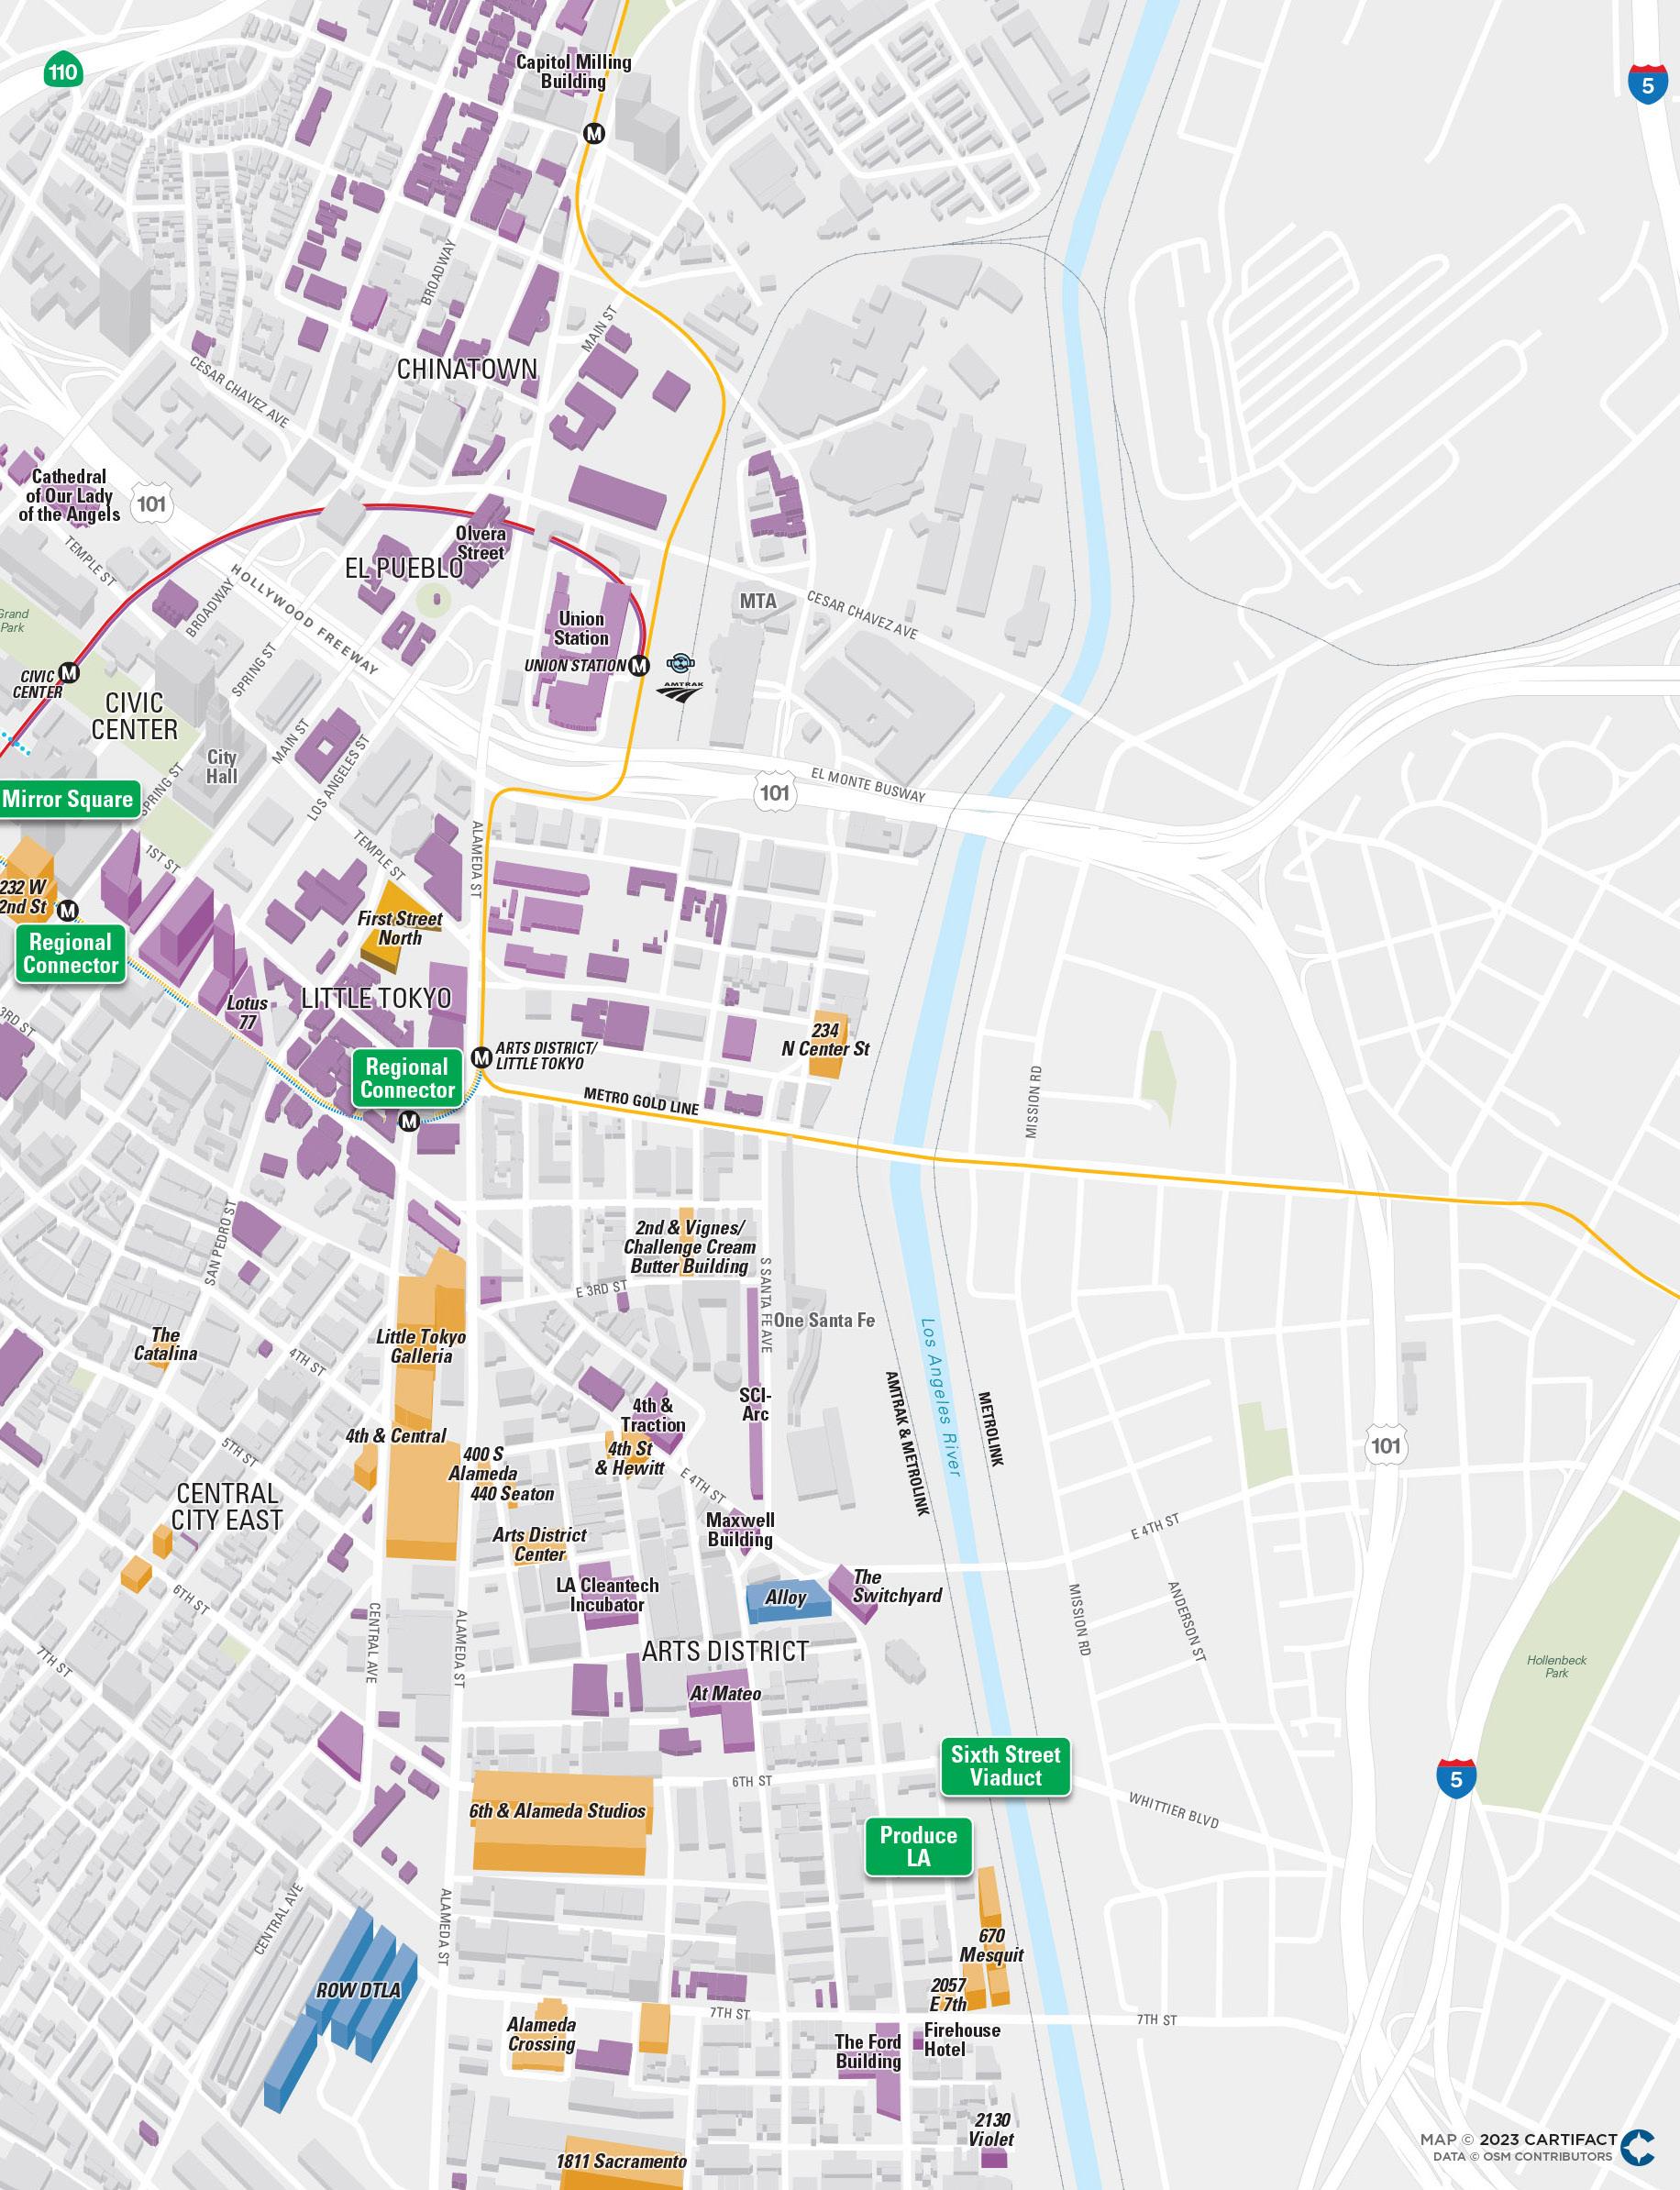
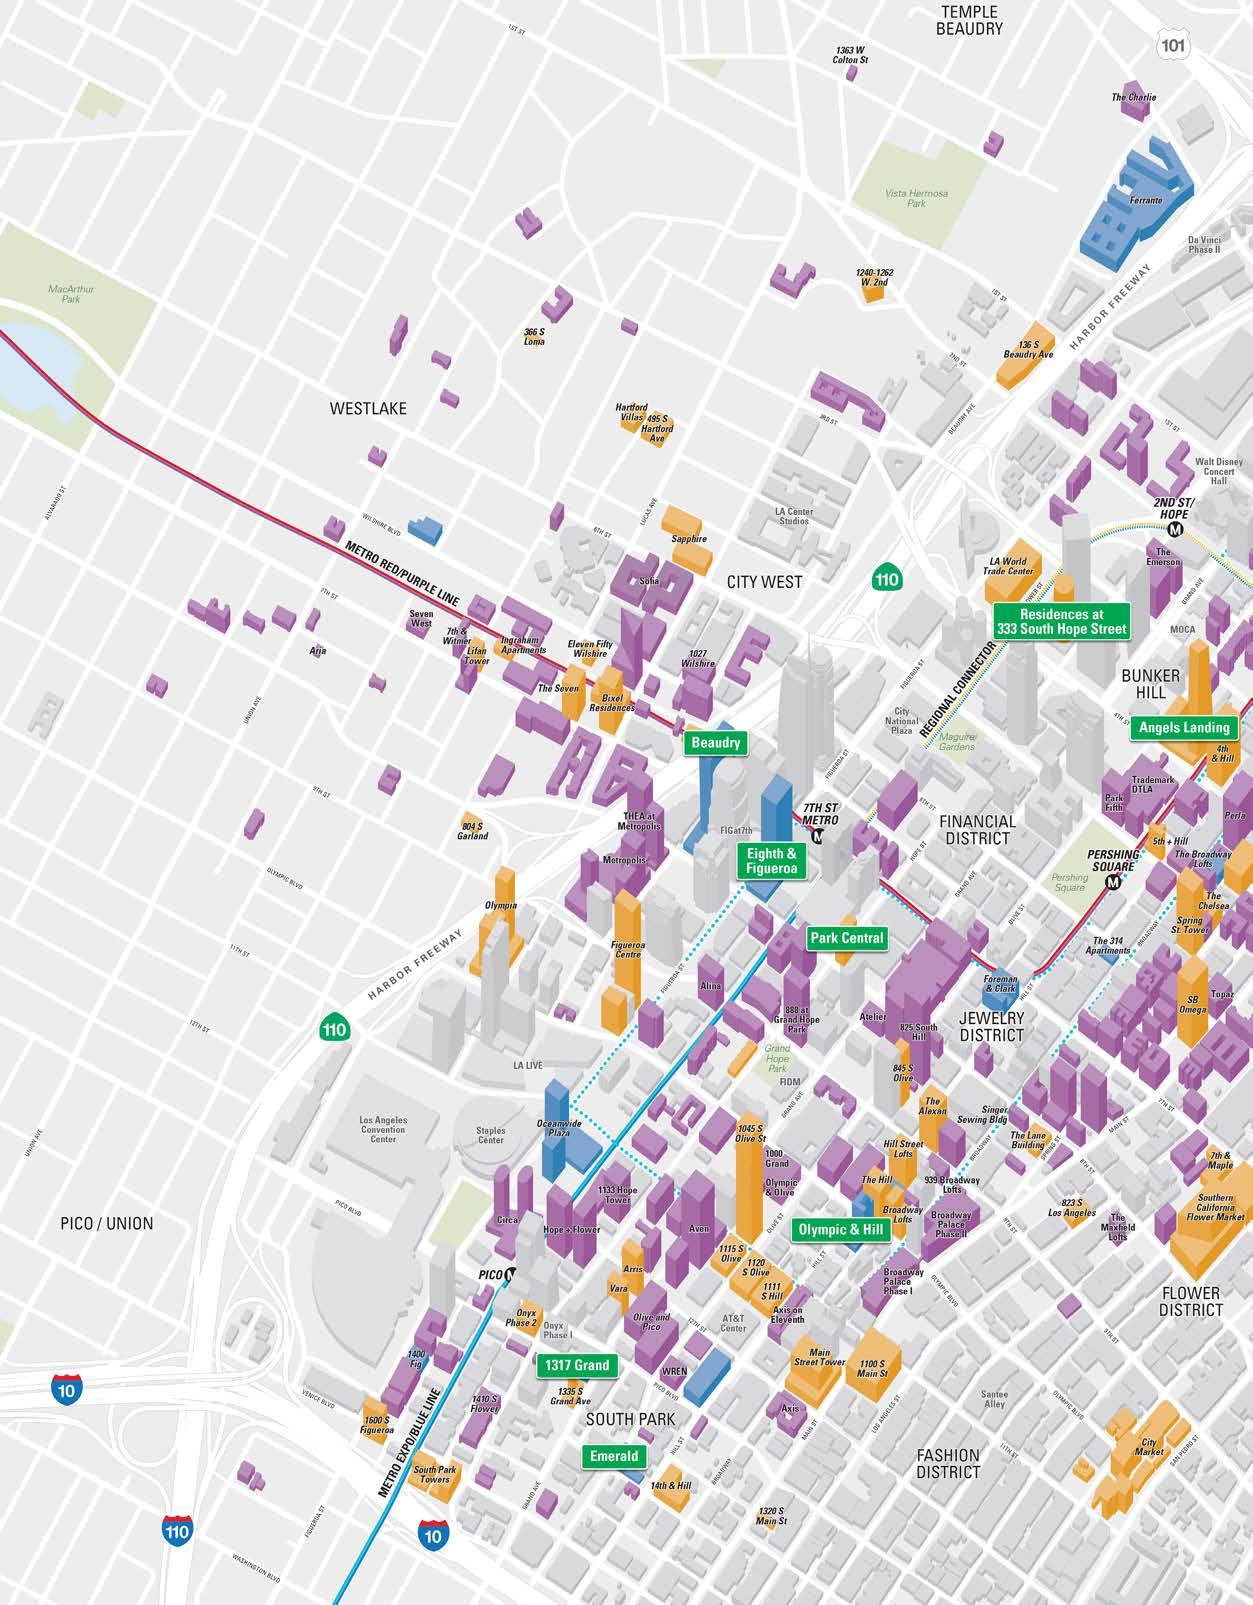
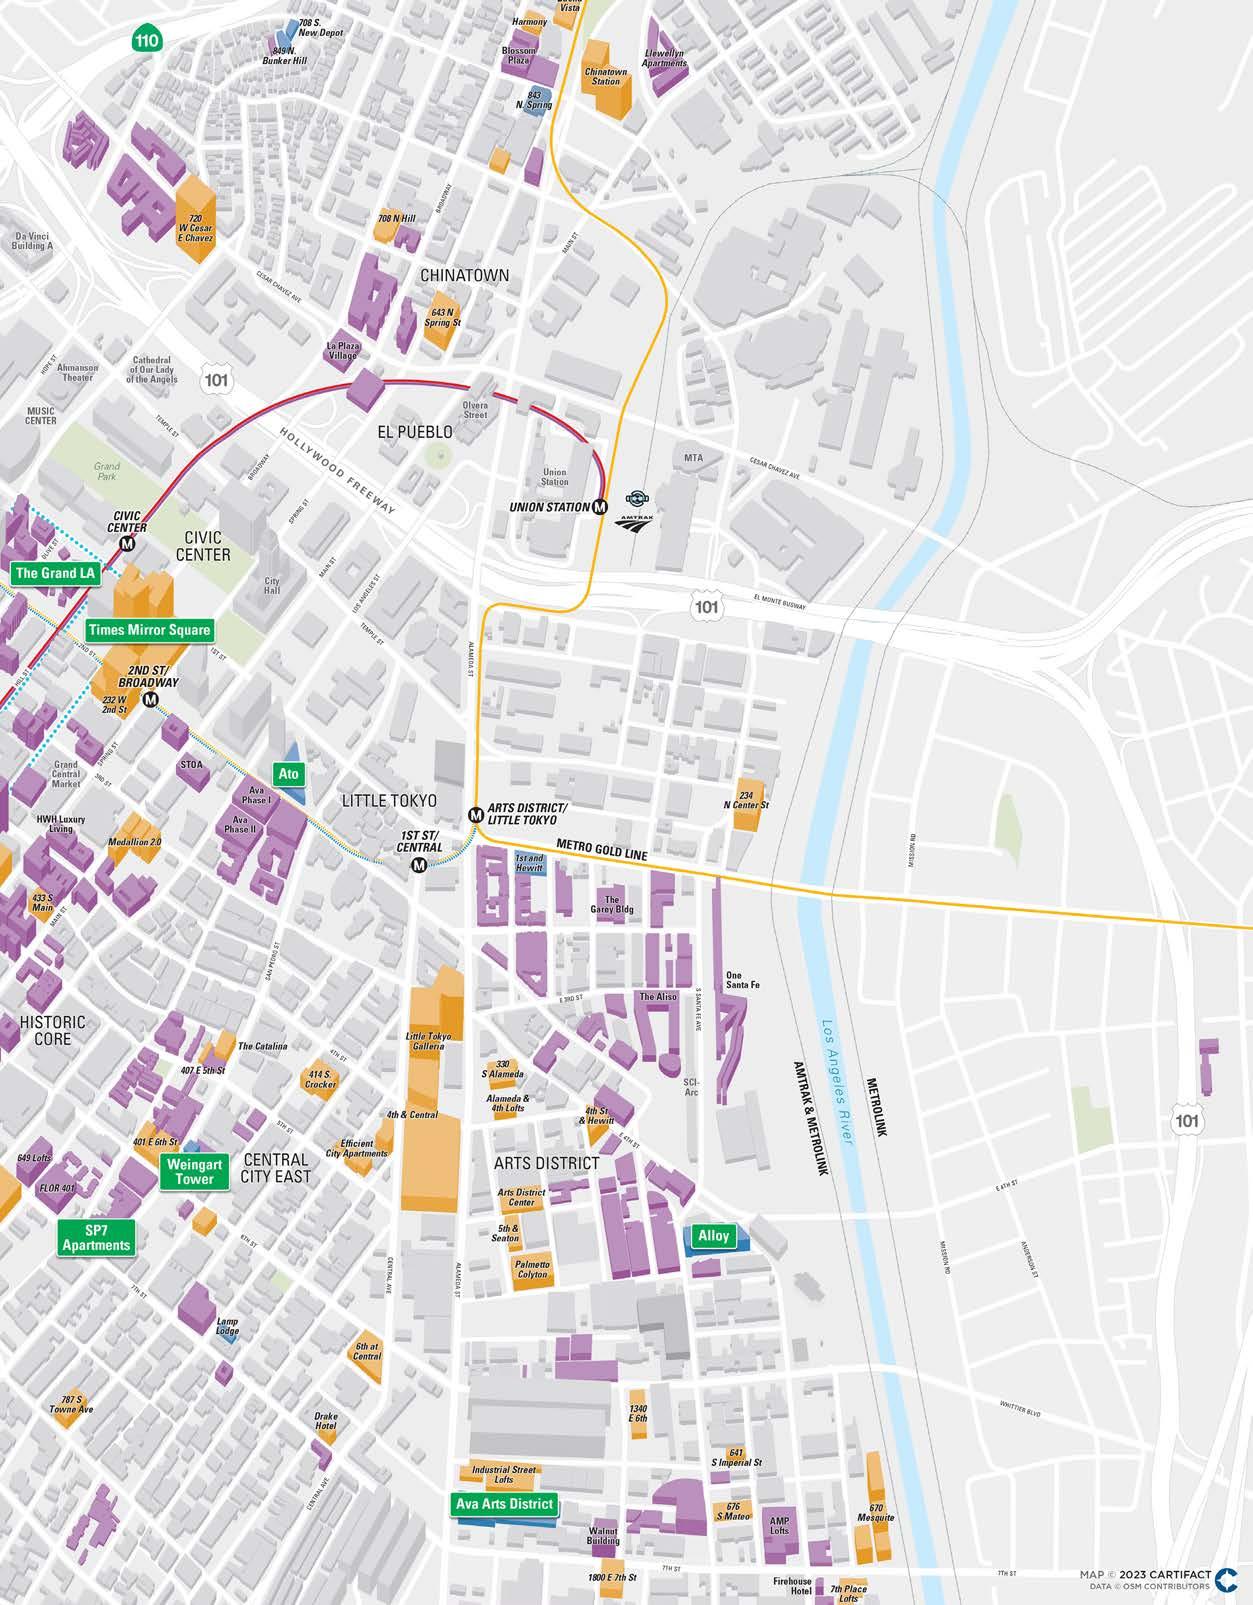
DEFINITION OF DOWNTOWN LA
The DCBID defines Downtown Los Angeles as the area bounded by the 110, 101 and 10 freeways and the LA River, plus Chinatown, City West, and Exposition Park. The projects contained in this report are within a portion of Downtown Los Angeles, shown on the map to the left.
2 Downtown Center Business Improvement District YEAR-END 2022 MARKET REPORT
3 Downtown Center Business Improvement District EXECUTIVE SUMMARY ........................................ 4 MARKET OVERVIEW Residential & Office .......................................... 5 Retail & Hotel .................................................... 5 2022 MARKET HIGHLIGHTS Projects Opened ............................................... 6 CRE Sales ........................................................... 6 Office Leases ..................................................... 7 Food and Beverage Openings ........................... 7 QUARTERLY TRACKING STATS Residential & Office .......................................... 8 Retail & Hotel .................................................... 9 VISITATION INSIGHTS Average Monthly Visits .................................. 10 Workplace Visits ............................................ 11 DEVELOPMENT MAPS Commercial 12 Residential 14 DEVELOPMENT UPDATE Under Construction 16 Proposed 18 FEATURED PROJECTS Now Open 22 Under Construction ....................................... 26 TABLE
CONTENTS 25 28 29
OF
EXECUTIVE SUMMARY
Given that 2022 began amidst California’s largest COVID outbreak with daily records in the 100,000s of new cases, it is with relief that we report that it ended with Downtown LA’s recovery from the pandemic well underway. While there are still challenges to face, a greater sense of normalcy has returned to DTLA.
Nowhere is this more evident than in the residential sector. Not only have rents and occupancy rates returned to pre-pandemic levels, interest in new investment has followed, as demonstrated by new groundbreakings such as Onni Group’s new tower at Olympic & Hill, and new proposals such as Alveare, which will be an affordable housing project at 14th and Broadway.
Similarly, the hospitality sector has come come back solidly, with 2022 RevPAR now at 92% of its 2019 level. As with residential, there is a healthy pipeline of new projects, from the massive AC/Moxy Hotel with over 700 rooms in its first tower ready to open, to the more boutique, such as the proposed Mama Shelter project at Olympic and Main that announced in Q4.
On the retail front, although 2022 did not see significant new store openings, it was a different story on the food and beverage side, where over 30 new offerings were added to the already world-class dining scene in DTLA. The newest of these is Café Basque, led by Michelinstarred chef Daniel Rose, which opened on the ground floor of The Hoxton hotel at 11th and Broadway.
Meanwhile, the office market remains very much in flux, as employers and employees continue to navigate the
Q4 KEY STATS
future of remote work. While office workplace occupancy in the greater LA market has only recently reached 50%, as reported by Kastle Systems, 2022 visitation to all workplaces in DTLA (not just offices) reached 68% of prepandemic levels, a 26% improvement compared to the start of the year. In market terms, the shift to remote work was the principal cause for DTLA’s negative net absorption of -450K SF in 2022, which represents approximately 0.9% of the total inventory. While this is significant, it is in line with the broader LA region, which saw an almost identical decline of 0.8%. Several submarkets were hit much harder, such as Brentwood, Burbank, Miracle Mile, and Woodland Hills, which lost 3-5% of their totals.*
Moreover, while many central business districts across the country currently face existential crises due to a lack of diversity in their office-dominant real estate market, DTLA’s appeal goes well beyond its office towers. This is evident from the significant commercial real estate sales in 2022. While buyers are certainly seeking value in the current marketplace, they are also demonstrating their faith in the future of the area.
Considering how 2022 started for DTLA, how it ended is testament to its resilience and enduring appeal. It is also validation of the vision of the Downtown Renaissance, which since 1999 has transformed the area from a purely commercial business district into a dynamic mixed-use community, active 24 hours a day, seven days a week. The success of that effort has ensured that while DTLA will continue to evolve, it is well-positioned to succeed in the future.
*Per CoStar Markets & Submarkets Report
Q4 KEY HIGHLIGHTS
Onni Group broke ground on its newest residential tower at Olympic and Hill.
THEA at Metropolis was sold by its developer, Greenland USA, to Northland, a division of Essex Homes, for $504 million.
Café Basque opened at The Hoxton under Michelinstarred head chef Daniel Rose.
4 Downtown Center Business Improvement District YEAR-END 2022 MARKET REPORT
Average Class A Office Rent Per Square Foot $3.33 Apartment Asking Rent Per Square Foot 21.0% Office Vacancy Rate 93.1% Residential Occupancy Rate $157.20 Hotel RevPAR
$3.82
MARKET OVERVIEW
5 Downtown Center Business Improvement District OFFICE Q4 2022 Q4 2021 Vacancy Rate 21.0% 19.8% Class A Rent PSF $3.82 $3.80 Overall Rent PSF $3.67 $3.70 YTD Net Absorption -456,495 -854,408 YTD Leasing Activity 2.2m 1.8m Source: CoStar RESIDENTIAL Q4 2022 Q4 2021 Apartment Occupancy Rate 93.1% 93.8% Apartment Asking Rent PSF $3.33 $3.35 Average Effective Rent Per Unit $2,822 $2,810 Condo Sales 65 138 Condo Price PSF $678 $678 Source: DTLA Life, CoStar RETAIL Q4 2022 Q4 2021 Vacancy Rate 6.8% 6.4% Average Rent PSF $3.20 $3.11 YTD Net Absorption 91,288 -108,587 Source: CoStar HOTEL Q4 2022 Q4 2021 YTD Occupancy Rate 68.2% 53.5% YTD Average Daily Rate $230.60 $180.36 YTD RevPAR $157.20 $96.50 Source: CoStar
Residential Units Current Inventory Under Construction Total When Complete Proposed Market Rate Rental 33,863 4,067 37,930 22,698 Condos 7,210 504 7,714 2,747 Affordable 12,742 621 13,363 3,418 Total 53,815 5,192 59,007 28,863 Projected Population* 92,024 8,878 100,902 Office Space 40m SF 2.2m SF 42.2m SF 4.6m SF Retail Space 4.3m SF 0.9m SF 5.2m SF 2.0m SF Hotel Rooms 9,945 2,250 12,195 6,695 *1.8 residents per unit X 95% occupancy Office Space Source: CBRE / Retail Space Source: CoStar
INVENTORY
2022 MARKET HIGHLIGHTS
PROJECTS OPENED
COMMERCIAL REAL ESTATE SALES
6 Downtown Center Business Improvement District YEAR-END 2022 MARKET REPORT Property Name Address Buyer Seller Price THEA at Metropolis* 1000 W. 8th St. Northland Greenland USA $504m SB Apartments Portfolio (5 properties) Multiple Laguna Point Properties Royalty Realty $402m 6th & Alameda Food & Produce Center 1205-1321 Wholesale St. East End Capital SunCal Companies $240m The Aliso 950 E. 3rd St. Legendary Development Brookfield Properties $155m 800 S. Hope* 800 S. Hope St. Verizon CalSTRS $130m Los Angeles Athletic Club 431 W. 7th St. Stockdale Capital Partners LAACO $44m SP One-Twenty 120 S. San Pedro St. Buck Design Brickstar Capital $26.5m Mart South* 124 E. Olympic Blvd. Amrapur Overseas Jamison Services $18m 816 Figueroa 816 S. Figueroa St. Peykar Family Trust AHA $14m 710 S. Broadway 710 S. Broadway Faramarzi Family Trust Gill Family Properties $12.2m Alameda Trade Center 1651 Bay St. Vocal Inc Vision Produce Company $11.5m Clifton’s 648-654 S. Broadway Robhana Group Andrew Meieran $9m * Sale completed in Q4
Name Neighborhood Description The Grand LA Bunker Hill 305 hotel rooms, 436 residential units, and 165K SF of commercial space SP7 Industrial District 81 units of permanent supportive housing in Skid Row Green Street Jewelry District 50K SF historic building positioned as an incubator for the cannabis industry Merritt Building Fashion District 60K SF of historic office space across from the Apple Tower Theatre Singer Building Fashion District 6 full-floor luxury residential units at 8th and Broadway 2130 Violet* Arts District Eight-story new construction with 100K SF of office space *Project opened in Q4
2022 MARKET HIGHLIGHTS
OFFICE LEASES SIGNED
FOOD AND BEVERAGE OPENINGS
Agua Viva
Asterid
Bar Clara
Basil and Cheese Café
Bike Shed Moto Co.
Bond Collective
Bossa Nova Brazilian Cuisine
Café Basque*
Civil Coffee
El Patron Cantina
Frank Coffee
*Opened/Re-opened in Q4
Gusto Green
Guzzu Bento-ya
Gyu-Kaku Japanese BBQ
Hansei
Hearts & Flame
Inka Wasi Peruvian
Jollibee
La Conde
Mandolin Taverna
Marlou DTLA
Millet Crepe
Nakara
Native Son*
Pine & Crane
Pizzeria Bianco
Polanco DTLA
Rosemary Grill
San Laurel
Sawa
Smoke City Char Bar
Te Isshoku*
White Elephant
7 Downtown Center Business Improvement District
Tenant Property Name Address Type Sq ft SPARC CMC 110 E. 9th St. New 164,000 Buchalter Wedbush Center 1000 Wilshire Blvd. Renewal 82,335 Musick, Peeler & Garrett* Bank of America Plaza 333 S. Hope St. New 52,966 Virgin Hyperloop ROW DTLA 777 S. Alameda Expansion 49,800 Jackson Lewis P.C. EY Plaza 725 S. Figueroa St. Relocation 49,508 Alston & Bird* City National 2Cal 350 S. Grand Ave. New 47,567 Revolve Clothing ROW DTLA 1318 W. 7th St. New 42,250 HOK ROW DTLA 777 Alameda St. New 40,000 Spaces Fine Arts Building 811 W. 7th St. New 38,383 Lucas Museum of Narrative Art The Bloc 700 S. Flower St. New 25,400 Frandzel Robins Bloom & Csato Wedbush Center 1000 Wilshire Blvd. Renewal 24,250 Dykema Gossett FourFortyFour South Flower 444 S. Flower St. New 21,750 AC Martin Partners Wilshire Grand Center 900 Wilshire Blvd. Renewal 21,008 Grant Thornton FourFortyFour South Flower 444 S. Flower St. New 18,500
Lease signed in Q4
*
QUARTERLY TRACKING STATS
RESIDENTIAL
The residential market has rebounded strongly after a substantial decline during the pandemic, with current rents and occupancy levels exceeding pre-pandemic record highs due to growing demand and a relative pause in new deliveries.
OFFICE
Vacancy continued to rise and rents declined slightly as uncertainty about return-to-work continued to dampen leasing activity across Southern California.
8 Downtown Center Business Improvement District YEAR-END 2022 MARKET REPORT 0% 5% 10% 15% 20% 25% $3.50 $3.55 $3.60 $3.65 $3.70 $3.75 $3.80 Q4 19 Q1 20Q2 20Q3 20 Q4 20 Q1 21Q2 21Q3 21 Q4 21 Q1 22Q2 22Q3 22 Q4 22 Vacancy Rent Office Asking Rent Per Square Foot Vacancy 80% 82% 84% 86% 88% 90% 92% 94% 96% $2,100 $2,200 $2,300 $2,400 $2,500 $2,600 $2,700 $2,800 Q4 19Q1 20Q2 20Q3 20Q4 20Q1 21Q2 21Q3 21Q4 21Q1 22Q2 22Q3 22Q4 22 Occupancy Rent Residential Asking Rent Per Unit Occupancy Q4 19 Q1 20 Q2 20 Q3 20 Q4 20 Q1 21 Q2 21 Q3 21 Q4 21 Q1 22 Q2 22 Q3 22 Q4 22 Occupancy 89% 89% 86% 85% 86% 90% 91% 93% 94% 94% 94% 94% 93% Asking Rent Per Unit $2,654 $2,594 $2,478 $2,364 $2,363 $2,463 $2,561 $2,752 $2,810 $2,839 $2,874 $2,881 $2,822 Source: CoStar
Asking Rent Per Unit Occupancy Source: CBRE
Overall Rent Per Square Foot Vacancy
Q4 19 Q1 20 Q2 20 Q3 20 Q4 20 Q1 21 Q2 21 Q3 21 Q4 21 Q1 22 Q2 22 Q3 22 Q4 22 Vacancy 15% 15% 16% 16% 17% 18% 19% 20% 20% 20% 20% 21% 21% Overall Rent Per SF $3.75 $3.75 $3.75 $3.77 $3.75 $3.73 $3.71 $3.72 $3.70 $3.71 $3.65 $3.65 $3.67
QUARTERLY TRACKING STATS
RETAIL
Retail rents and vacancy have remained remarkably stable through the pandemic, indicating that interest in urban locations like Downtown LA remains strong among most national retail chains.
Although occupancy and RevPAR remain below pre-pandemic levels, both have made significant gains in 2022 and are now only 8% below where they were in 2019.
9 Downtown Center Business Improvement District 0% 10% 20% 30% 40% 50% 60% 70% 80% 90% $0 $20 $40 $60 $80 $100 $120 $140 $160 $180 Q4 19Q1 20Q2 20Q3 20Q4 20Q1 21Q2 21Q3 21Q4 21Q1 22Q2 22Q3 22Q4 22 Occupancy YTD RevPar Hotel YTD RevPar Occupancy 3% 4% 5% 6% 7% 8% $2.50 $2.75 $3.00 $3.25 $3.50 Q4 19Q1 20Q2 20Q3 20Q4 20Q1 21Q2 21Q3 21Q4 21Q1 22Q2 22Q3 22Q4 22 Vacancy Rent Retail Average Rent Per Square Foot Vacancy Source: CoStar
Average Rent Per Square Foot Vacancy Source: CoStar
HOTEL YTD RevPar Occupancy
Q4 19 Q1 20 Q2 20 Q3 20 Q4 20 Q1 21 Q2 21 Q3 21 Q4 21 Q1 22 Q2 22 Q3 22 Q4 22 Vacancy 6% 6% 6% 6% 6% 6% 6% 6% 6% 7% 6% 7% 7% Average Rent Per SF $3.02 $3.03 $3.02 $3.01 $2.99 $2.99 $3.04 $3.09 $3.11 $3.10 $3.16 $3.20 $3.20 Q4 19 Q1 20 Q2 20 Q3 20 Q4 20 Q1 21 Q2 21 Q3 21 Q4 21 Q1 22 Q2 22 Q3 22 Q4 22 Occupancy 79% 61% 43% 40% 36% 32% 42% 49% 54% 62% 67% 68% 68% YTD RevPAR $171 $130 $83 $47 $61 $41 $65 $82 $96 $141 $153 $155 $157
VISITATION INSIGHTS
DTLA AVERAGE MONTHLY VISITS
Although COVID affected communities across the region, DTLA was uniquely impacted by stay-at-home orders. As people remained in their residential communities, trips to DTLA dropped dramatically. 2021 saw significant gains overall but was slowed by the Delta and Omicron variants. With the growth trend continuing in 2022, visits to DTLA are now near pre-pandemic levels.
YEAR-OVER-YEAR COMPARISON
Visits to Downtown LA remained fairly consistent throughout 2022, solidifying the significant gains from the prior year. While still around 10% below the pre-pandemic average of 10 million visitors per month, given the continued reduction in workplace visits, this represents a strong return to form for the non-office sectors that draw people to DTLA.
Source: Placer.ai
10 Downtown Center Business Improvement District YEAR-END 2022 MARKET REPORT
0 2,000,000 4,000,000 6,000,000 8,000,000 10,000,000 12,000,000 January February March April May June July August September October November December 2022 2021
0 2,000,000 4,000,000 6,000,000 8,000,000 10,000,000 12,000,000 1/1/193/1/195/1/197/1/199/1/1911/1/191/1/203/1/205/1/207/1/209/1/2011/1/201/1/213/1/215/1/217/1/219/1/2111/1/211/1/223/1/225/1/227/1/229/1/2211/1/22
VISITATION INSIGHTS
MONTHLY VISITS 2022 VS. 2019
While office workplace occupancy in the greater LA market has only recently reached 50%, as reported by Kastle Systems*, 2022 visitation to all workplaces in DTLA (not just offices) reached 68% of pre-pandemic levels, a 26% improvement compared to the start of the year. At the same time, overall visitor activity has almost fully recovered, which speaks to the broader appeal and diversity of Downtown’s economy.
MONTHLY WORKPLACE VISITATION
2022 saw meaningful gains in terms of workplace visitation, with the average number of visits per month in Q4 up by over 15% compared to Q4 2021.
11 Downtown Center Business Improvement District
0 5 10 15 20 0 50,000 100,000 150,000 200,000 250,000 300,000 350,000 400,000 Q4 2019Q1 2020Q2 2020Q3 2020Q4 2020Q1 2021Q2 2021Q3 2021Q4 2021Q1 2022Q2 2022Q3 2022Q4 2022 Total Workers Per Month Monthly Visits Per Worker
*Kastle Systems data is based on access control swipes at their customers’ properties in select office markets and is not a representative statistical sample 0% 10% 20% 30% 40% 50% 60% 70% 80% 90% 100% January February March April May June July August September October NovemberDecember DTLA Visitors - Placer.ai DTLA Workers - All Workplaces - Placer.ai Los Angeles Office Buildings - Kastle Systems Per Month: Q4 19 Q1 20 Q2 20 Q3 20 Q4 20 Q1 21 Q2 21 Q3 21 Q4 21 Q1 22 Q2 22 Q3 22 Q4 22 Total Workplace Visits 5.4M 4.7M 2.4M 2.8M 2.6M 2.5M 2.6M 2.8M 2.9M 3.1M 3.3M 3.3M 3.4M Workplace Visitors 348K 325K 247K 243K 227K 205K 208K 204K 209K 218K 236K 236K 242K Visits Per Worker 15.6 14.6 9.7 11.6 11.6 12.2 12.7 13.5 14.0 14.2 14.1 14.1 14.0 Source: Placer.ai Q4 19 Q1 20 Q2 20 Q3 20 Q4 20 Q1 21 Q2 21 Q3 21 Q4 21 Q1 22 Q2 22 Q3 22 Q4 22 JAN FEB MAR APR MAY JUN JUL AUG SEP OCT NOV DEC
Commercial Development
2
Featured
n Existing n Under Construction/Renovation n Proposed
As of 12/31/2022
Project
Residential Development
Existing n Under Construction/Renovation n Proposed 2 As of 12/31/2022 Featured Project
n
RESIDENTIAL
16 Downtown Center Business Improvement District YEAR-END 2022 MARKET REPORT UNDER
Project Name Address Residential Units Hotel Rooms Office Sq. Ft. Retail Sq. Ft. Estimated Completion Developer MAJOR MIXED-USE ARTS DISTRICT Alloy 520 S. Mateo St. 475 105,000 20,000 2023 Carmel Partners HISTORIC CORE Broadway Trade Center 801 S. Broadway 150 624,500 345,000 TBD Waterbridge Capital SOUTH PARK Oceanwide Plaza 11th & Figueroa 504 C 184 150,000 TBD Oceanwide Holdings
CONSTRUCTION
ARTS DISTRICT AVA Arts District 668 S. Alameda St. 475 61,000 2023 AvalonBay Communities CHINATOWN 849 N. Bunker Hill 849 N. Bunker Hill Ave. 37 2022 Bunker Heights, LLC 708 S. New Depot 708 S. New Depot St. 33 2022 ETO Doors Corp. 200 Mesnager 200 Mesnager St. 280 20,000 2024 NBP Capital FINANCIAL DISTRICT Beaudry 960 W. 7th St. 785 6,700 2023 Brookfield Properties Eighth & Figueroa 744 S. Figueroa St. 438 7,500 2023 Mitsui Fudosan HISTORIC CORE Brooks Building 644 S. Broadway 30 2,500 2022 640 S Broadway LLC The 314 Apartments 314 W. 6th St. 50 2022 West 6th & Broadway Partnership INDUSTRIAL DISTRICT Lamp Lodge 660 Stanford Ave. 82 2022 Metal Housing Corp. Weingart Tower 1A 554 S. San Pedro St. 278 2023 Weingart Center 6th Street Place 401 E. 6th St. 94 1,800 2023 Mercy Housing of California JEWELRY DISTRICT Foreman & Clark 701 S. Hill St. 125 8,500 2022 Bonnis Properties LITTLE TOKYO Ato 118 Astronaut E. S. Onizuka St. 77 2,500 2022 Etco Homes 600 E. 1st St. 600 E. 1st St. 69 14,000 2023 Boulevard Partners
17 Downtown Center Business Improvement District
Project Name Address Residential Units Hotel Rooms Office Sq. Ft. Retail Sq. Ft. Estimated Completion Developer SOUTH PARK Emerald 1340 S. Olive St. 154 10,700 2022 Jade Enterprises 1400 Fig 1400 S. Figueroa St. 106 1,400 2022 DHG Family Trust 1317 S. Hope St. 1317 S. Hope St. 38 4,000 2022 FMB Development 1317 Grand 1317 S. Grand Ave. 151 2023 Housing Diversity Corporation 1411 S. Flower St. 1411 S. Flower St. 227 2023 Housing Diversity Corporation Olympic and Hill 1000-1034 S. Hill St. 700 15,000 2025 Onni Group HOTEL FINANCIAL DISTRICT Hotel Clark 426 S. Hill St. 348 TBD Chetrit Group Trinity Hotel 851 S. Grand Ave. 183 TBD Chetrit Group HISTORIC CORE Cambria Hotel Spring St. 419 S. Spring St. 180 2023 PNK Group SOUTH PARK AC/Moxy Hotel Figueroa St. & Pico Blvd. 1,162 13,000 2023 Lightstone Group La Quinta Inn & Suites 1320 S. Flower St. 43 2023 1318 Flower, LLC OFFICE & RETAIL ARTS DISTRICT ROW DTLA 7th & Alameda 1,200,000 200,000 TBD Atlas Capital AtTraction 800-810 Traction Ave. 16 63,100 TBD 2023 LIVWRK and Kotzer CHINATOWN 843 N. Spring St. 843 N. Spring St. 122,000 7,000 2023 Redcar Properties HISTORIC CORE The Barker 722 S. Broadway 46,000 11,000 2022 Satila Studios CIVIC ARTS DISTRICT/LITTLE TOKYO Calif. Hospital Med. Cnt. expansion 1401 S. Grand Ave. 8,000 2023 Dignity Health TOTAL UNDER CONSTRUCTION 5,192 Residential Units 2,250 Hotel Rooms 2,160,000 Office Sq. Ft. 927,000 Retail Sq. Ft. TOTAL # OF PROJECTS = 33
UNDER CONSTRUCTION
PROPOSED
18 Downtown Center Business Improvement District YEAR-END 2022 MARKET REPORT
Project Name Address Residential Units Hotel Rooms Office Sq. Ft. Retail Sq. Ft. Developer MAJOR MIXED-USE ARTS DISTRICT 2110 Bay St. 2110 Bay St. 110 113,000 51,000 Bay Capital Fund 670 Mesquit St. 670 Mesquit St. 308 236 944,000 136,000 Vella Group Arts District Center 1101 E. 5th St. 129 C 113 72,500 Arts District Development, LLC 2117 E. Violet St. 2117-2143 E. Violet St. 347 187,000 22,000 Onni Group 655 S. Mesquit St. 655 S. Mesquit St. 185,000 4,325 Continuum Partners Fourth & Central 400 S. Central Ave. 949/572 C 68 411,000 101,000 Continuum Partners 2045 E. Violet St. 2045 E. Violet St. 435,000 15,500 Hines and Access Industries BUNKER HILL Angels Landing 361 S. Hill St. 252/180 C 515 72,000 Peebles Corp., Macfarlane Ptrs., Claridge Props. CIVIC CENTER Onni Times Square 100 S. Broadway 1,127 307,000 69,000 Onni Group 222 W. 2nd St. 222 W. 2nd St. 680 10,000 Tribune Real Estate Holdings FASHION DISTRICT City Market 9th & San Pedro 948 210 TBD 225,000 Peter Fleming LITTLE TOKYO Little Tokyo Galleria 333 S. Alameda St. 994 100,000 TBD SOUTH PARK Olympic Tower 813 W. Olympic Blvd. 374 C 373 33,500 65,000 Neman Real Estate Development 1600 S. Figueroa St. 1600 S. Figueroa St. 134/202 C 250 6,500 9,000 L&R Group of Companies South Park Towers 1600 S. Flower St. 250 300 13,000 Venice Hope Group, LLC
ARTS DISTRICT Industrial Street Lofts 1525 Industrial St. 344 25,000 4,000 Camden Alameda & 4th Lofts 360 S. Alameda St. 63 TBD South Alameda Development 1800 E. 7th St. 1800 E. 7th St. 122 9,500 Hillcrest Company Palmetto Colyton 527 S. Colyton St. 310 27,500 Bolour Associates 330 S. Alameda St. 330 S. Alameda St. 186 22,000 Greystar 5th & Seaton 5th & Seaton 220 44,500 WW-5th & Seaton 676 S. Mateo St. 676 S. Mateo St. 186 23,000 Maxxam Enterprises 1000 S. Mateo St. 1000 S. Mateo St. 106 120,000 Mateo Arts, LLC 234 N. Center St. 234 N. Center St. 430 8,700 Atlas Capital 4th St & Hewitt 940 E. 4th St. 93 20,000 Shoreham Capital 1340 E. 6th St. 1340 E. 6th St. 193 Suncoast Ventures
RESIDENTIAL
19 Downtown Center Business Improvement District
C = Condo ARTS DISTRICT (Cont.) 655 S. Mesquit St. 655 S. Mesquit St. 185,000 4,325 Continuum Partners 641 641 S. Imperial St. 140 7,000 7,000 Adam Lindemann BUNKER HILL LA World Trade Center 350 S. Figueroa St. 570 Jamison Residences at 333 South Hope 333 S. Hope St. 366 425 Brookfield Properties CHINATOWN Chinatown Station 924 N. Spring St. 725 51,000 Atlas Capital 720 W. Cesar E Chavez 720 W. Cesar E Chavez 299 8,000 Zion Enterprises/TA Partners 211 W. Alpine St. 211 W. Alpine St. 153 2,500 Izek Shomoff 708 N. Hill St. 708 N. Hill St. 162 5,000 Avant Development 643 N. Spring St. 643 N. Spring St. 300 149 21,000 Compagnie de Phalsbourg/Creative Space 1201 N. Broadway 1201 N. Broadway 124 8,700 Johnson Fain Buena Vista 1251 N. Spring St. 986 39,000 S&R Partners Harmony 942 N. Broadway 178 32,000 5,000 Townline and Forme Development 1435-1465 N. Main St. 1435-1465 N. Main St. 243 1457 Main Property LLC 717 Hill 717 N. Hill St. 411 17,000 TRJLA Homeboy Industries Housing 901-903 S. Main St. 157 Homeboy Industries CITY WEST Eleven Fifty Wilshire 1150 Wilshire Blvd. 140 C 9,000 PacTen Partners The Seven 1135 W. 7th St. 225 7,000 SEVEN Street Properties Ingraham Apartments 1230 W. Ingraham St. 121 SRO Housing Corporation Bixel Residences 675 S. Bixel St. 422 126 5,500 Career Lofts LA Lifan Tower 1247 W. 7th St. 306 5,500 Lifan Group 804 S. Garland Ave. 804 S. Garland Ave. 118 TBD TBD WPDTLA FASHION DISTRICT Fashion District Residences 222 E. 7th St. 452 13,500 Realm Group/Urban Offerings 1100 S. Main St. 1100 S. Main St. 379 26,000 Jade Enterprises Broadway Lofts 955 S. Broadway 163 C 6,500 Barry Shy Main Street Tower 1123-1161 S. Main St. 363 12,500 Jade Enterprises FINANCIAL DISTRICT 949 S. Hope St. 949 S. Hope St. 236 6,700 Brookfield Properties 845 S. Olive St. 845 S. Olive St. 329 5,300 Relevant Group Park Central 754 S. Hope St. 580 7,500 Mitsui Fudosan The Bloc Tower 700 S. Flower St. 466 National Real Estate A Project Name Address Residential Units Hotel Rooms Office Sq. Ft. Retail Sq. Ft. Developer
PROPOSED
20 Downtown Center Business Improvement District YEAR-END 2022 MARKET REPORT
Project Name Address Residential Units Hotel Rooms Office Sq. Ft. Retail Sq. Ft. Developer HISTORIC CORE Hill Street Lofts 920 S. Hill St. 239 C 5,600 Barry Shy SB Omega 601 S. Main St. 452 C 21,500 Barry Shy 4th & Hill - Beacon Tower 340 S. Hill St. 428 5,500 Equity Residential Spring St. Tower 525 S. Spring St. 360 25,000 Downtown Management 433 S. Main St. 433 S. Main St. 196 6,500 Main Street Tower, LLC The Hill 940 S. Hill St. 232 14,000 940 Hill LLC The Alexan 850 S. Hill St. 305 6,200 Trammell Crow Residential 216 Spring St. 216 S. Spring St. 120 2,500 David Lawrence Gray Architects INDUSTRIAL DISTRICT Weingart Tower 1B 554 S. San Pedro St. 104 Weingart Center 803 E. 5th St. 803-821 E. 5th St. 94 16,000 Coalition for Responsible Community Development 407 E. 5th St. 407 E. 5th St. 150 Relevant Group Drake Hotel 675 Kohler St. 33 David Duel 6th at Central 601 S. Central Ave. 236 12,000 Triangle Plaza LLC The Catalina 443 S. San Pedro St. 78 7,000 Statewide Acquisitions Corp 787 S. Towne Ave. 787 S. Towne Ave. 60 Towne Plaza, LLC LITTLE TOKYO 414 S. Crocker St. 414 S. Crocker St. 175 8,500 Little Tokyo Service Center SOUTH PARK Alveare 1405 S. Broadway 335 Related/Weingart Center Arris 1201 S. Grand Ave. 312 7,000 City Century Vara 1233 S. Grand Ave. 148 C 5,000 City Century 1410 S. Flower St. 1370-1418 S. Flower St. 147 6,500 Oxley Place, LLC Olympia Olympic Blvd. & Harbor Fwy. 1,367 40,000 City Century 1045 S. Olive St. 1045 S. Olive St. 794 12,500 Crescent Heights Onyx Phase 2 1301 S. Hope St. 248 30,000 Jade Enterprises 1335 S. Grand Ave. 1323-1349 S. Grand Ave. 284 6,500 M&A Gabaee 1334 S. Flower St. 1334-1348 S. Flower St. 177 2,500 The Condor The Eden 1340 S. Hill St. 233 9,000 Suncoast Hill Street, LLC 1111 S. Hill St. 1111 S. Hill St. 319 C 160 Crown South Hill, LLC 1115 S. Olive St. 1115 S. Olive St. 536 6,000 Mack Urban / AECOM 1120 S. Olive St. 1120 S. Olive St. 713 11,500 Mack Urban / AECOM 1200 S. Olive St. 1200 S. Olive St. 356 TBD Relevant Group
PROPOSED
21 Downtown Center Business Improvement District Project Name Address Residential Units Hotel Rooms Office Sq. Ft. Retail Sq. Ft. Developer HOTEL ARTS DISTRICT 400 S. Alameda St. 400 S. Alameda St. 66 Habita Arts District, LLC 2057 E. 7th St. 2057 E. 7th St. 50 1711 Lincoln, LLC Radisson RED Hotel 440 S. Hewitt St. 140 Radisson Hotel Group Rendon Hotel 2059 East 7th St. 103 16,000 Ziman/Greenshields-Ziman FASHION DISTRICT Mama Shelter 124 E. Olympic Blvd. 149 Jamison HISTORIC CORE Spring Street Hotel 631-633 S. Spring St. 170 Lizard Capital 5th and Hill 319-323 W. 5th St. 31 C 190 JMF Development SOUTH PARK Morrison Hotel 1246 S. Hope St. 136 444 15,500 Relevant Group Trical Hotel 1300 S. Figueroa St. 1,024 TBD Trical Construction Inc. 1155 S. Olive St. 1155 S. Olive St. 243 Mack Urban / AECOM Hyatt Centric 1138 S. Broadway 139 United Broadway, LLC JW Marriott LA LIVE expansion 900 W. Olympic Blvd. 861 AEG 1323-1331 S. Flower St. 1323-1331 S. Flower St. 48 132 Elliot Tishbi Cambria Hotel 920-928 James M. Wood Blvd. 247 Sun Capital & Pacific Property Partners 1219-1221 S. Hope St. 1219-1221 S. Hope St. 75 1221 S Hope St, LLC 1099 Grand 1099 S. Grand Ave. 160 AEG 1130 S. Hope 1130 S. Hope St. 112 528 Bryan Domyan OFFICE & RETAIL ARTS DISTRICT 2nd & Vignes 929 E. 2nd St. 74,000 30,600 Est4te Four Capital 405 S. Hewitt St. 405 S. Hewitt St. 255,000 15,000 Legendary Development 2159 E. Bay St. 2159 E. Bay St. 203,000 16,000 Tishman Speyer 440 Seaton St. 440 Seaton St. 50,000 Urbanlime Real Estate Hines - 2045 E. Violet 2045 E. Violet St. 450,000 17,800 Hines ADLA Campus 6th & Alameda 292,000 East End Capital 8th & Alameda Studios 2000 E. 8th St. 200,000 Atlas Capital Group 1811 Sacramento 1811 E. Sacramento St. 290,000 Skanska Alameda Crossing 1716 E. 7th St. 290,000 Prologis TOTAL PROPOSED 28,863 Residential Units 6,695 Hotel Rooms 4,594,000 Office Sq. Ft. 1,962,000 Retail Sq. Ft. TOTAL # OF PROJECTS = 111 PROPOSED
FEATURED PROJECTS Now Open
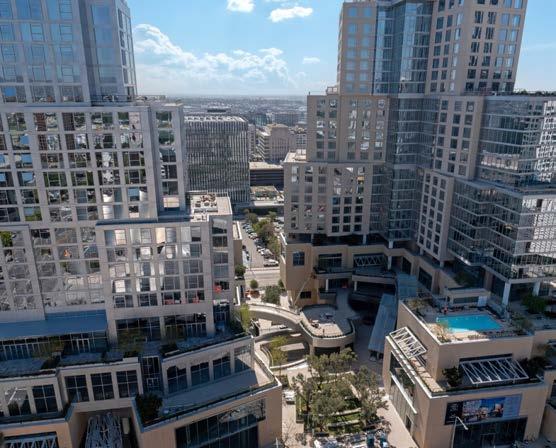
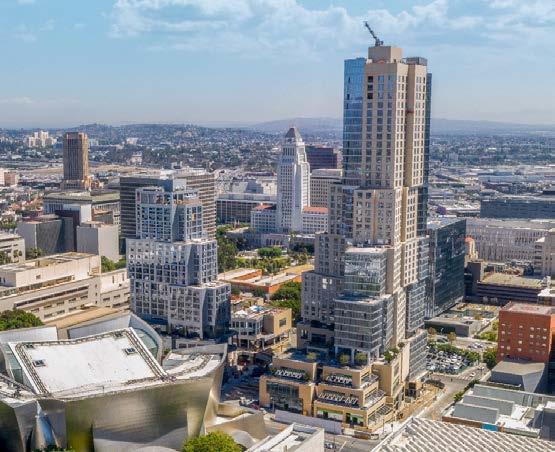
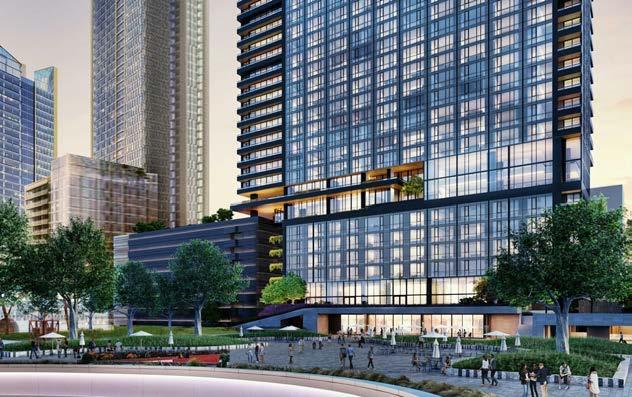
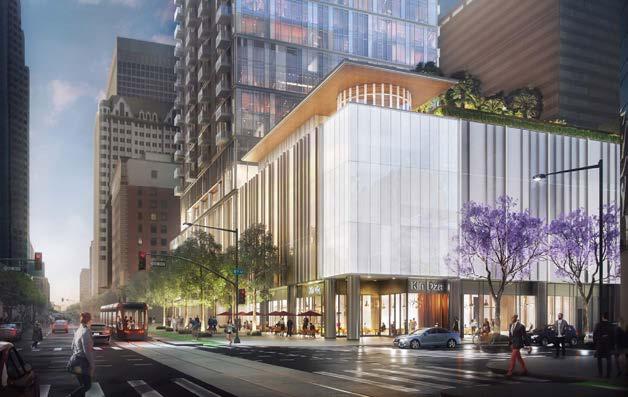
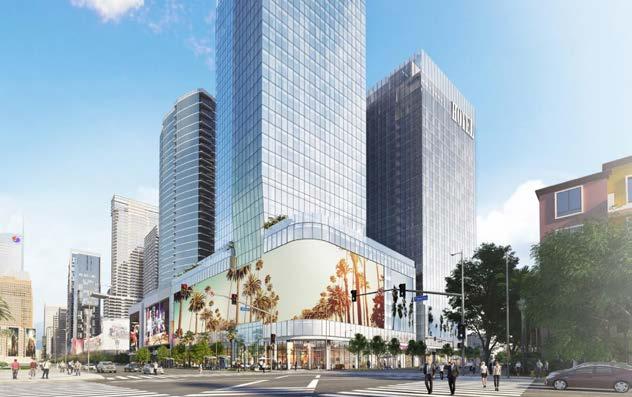
MAJOR MIXED-USE THE GRAND LA Developer:
The Related Companies
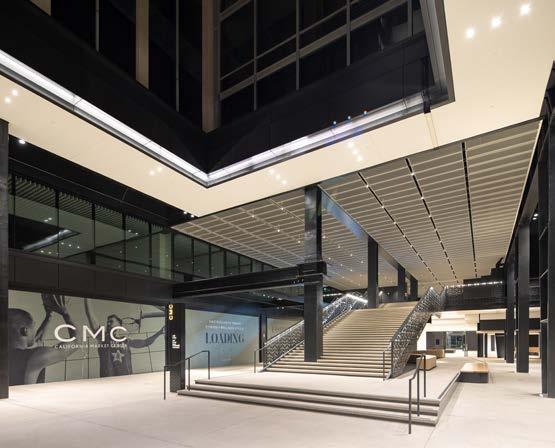
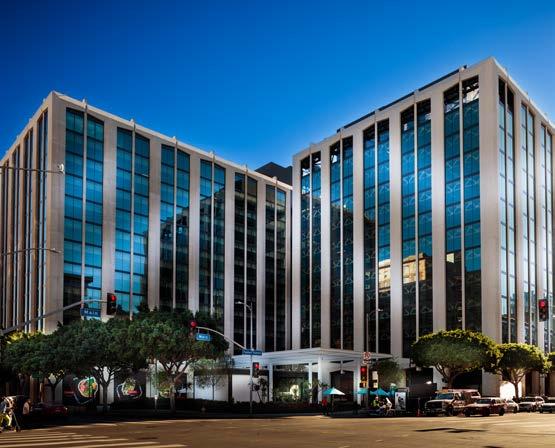
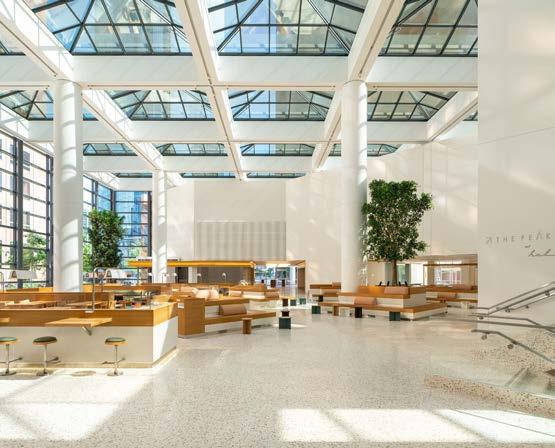
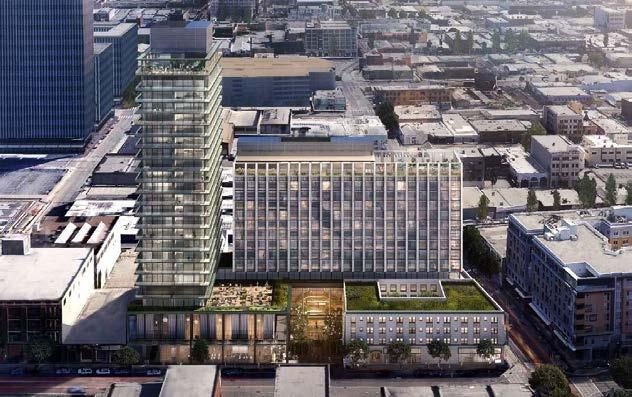
OFFICE CALIFORNIA MARKET CENTER
Developer: Brookfield Properties
Having completed its $170M renovation, this 1.8M SF property attracted the two largest recent leases in DTLA, with Adidas and SPARC each taking over 100K SF.
22 Downtown Center Business Improvement District YEAR-END 2022 MARKET REPORT
Designed by Frank Gehry this signature project on Bunker Hill officially opened in July. It features over 400 residential units, a 305-room Conrad Hotel, and over 160,000 SF of retail space.
FEATURED PROJECTS Now Open
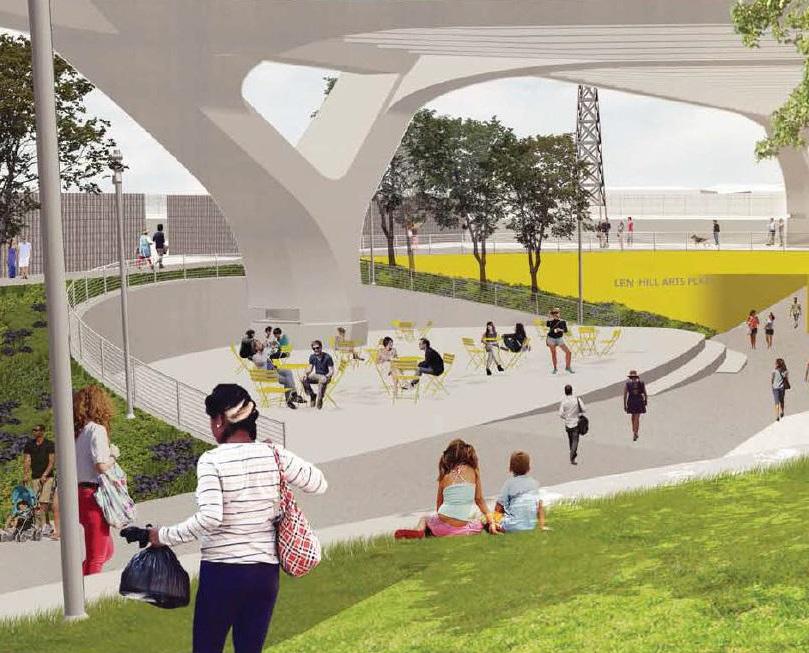
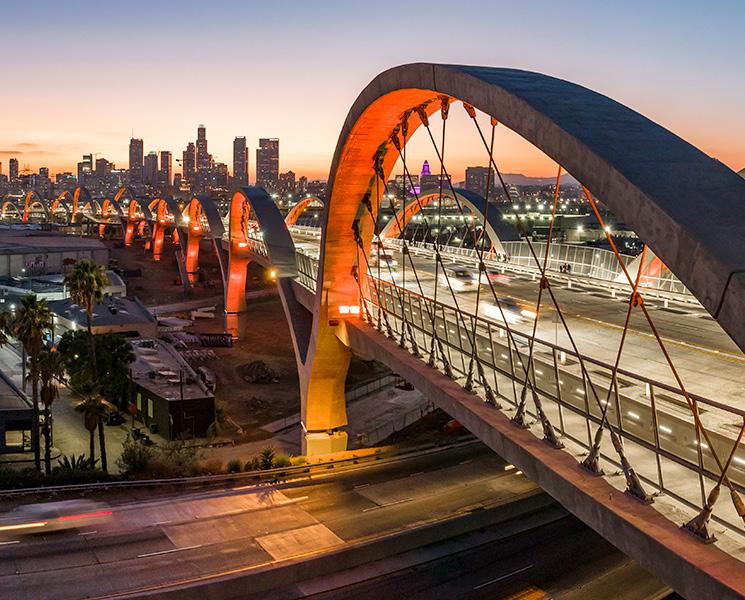
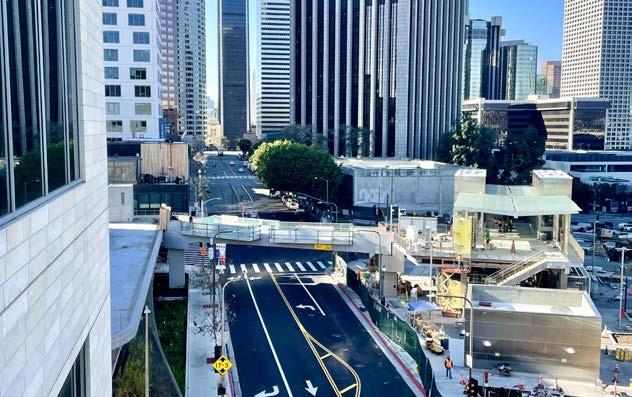
CIVIC & CULTURAL SIXTH STREET VIADUCT
Developer: City of Los Angeles
The new bridge was completed and opened in July 2022, enhancing the connection between the Arts District and historic Boyle Heights. Work is now underway on the Sixth Street PARC project under the viaduct, including the Len Hill Arts Plaza.
OFFICE
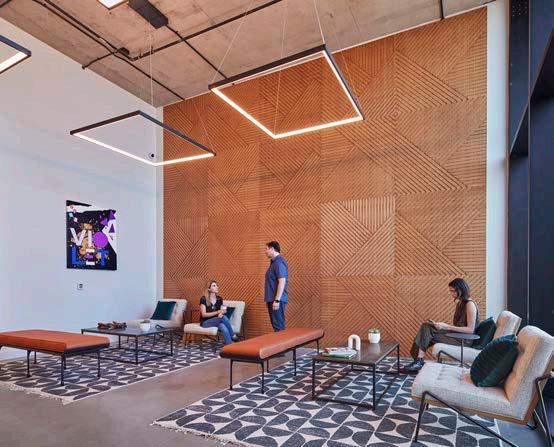
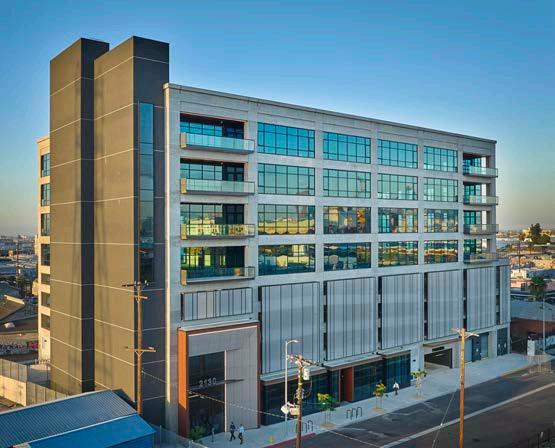
2130 VIOLET
Developer: Lowe/Related
New office construction just completed in the Arts District, rising eight stories with over 100K SF of office space and on-site parking.
23 Downtown Center Business Improvement District
FEATURED PROJECTS Now Open
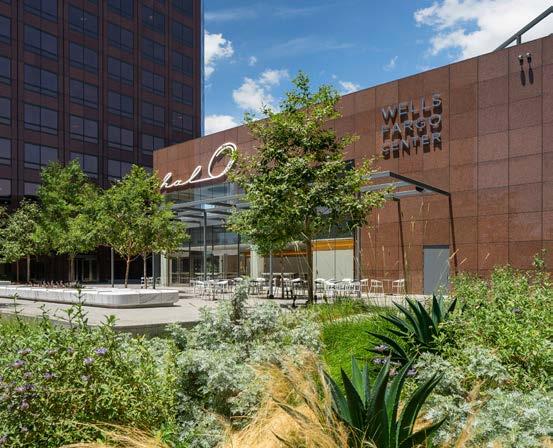
RETAIL HALO
Developer: Brookfield Properties
Next generation food hall with several prominent tenants such as Danny Boy’s Pizza and Shake Shack opened in 2021.
RETAIL APPLE TOWER THEATRE
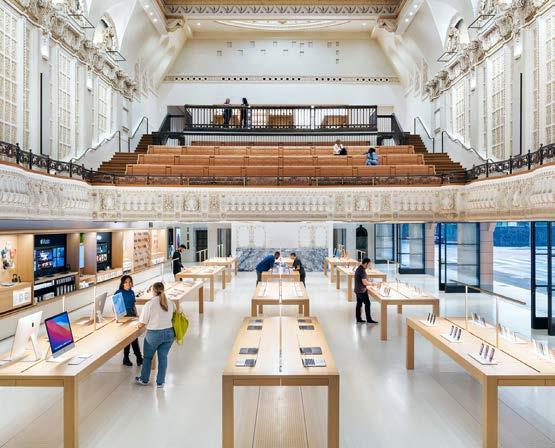
Developer: Apple
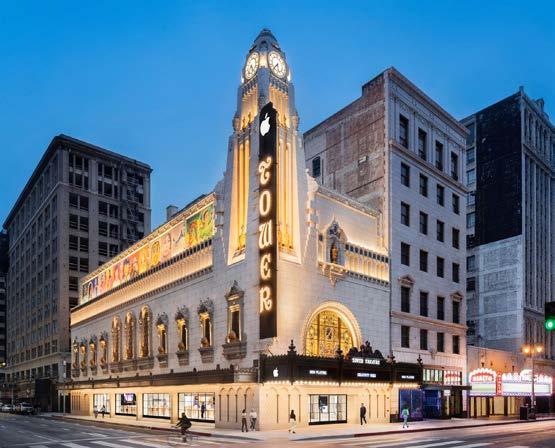
24 Downtown Center Business Improvement District YEAR-END 2022 MARKET REPORT
The highly anticipated Apple Store at the historic Tower Theater opened in late 2021, anchoring a growing shopping district on Broadway.
25 Downtown Center Business Improvement District
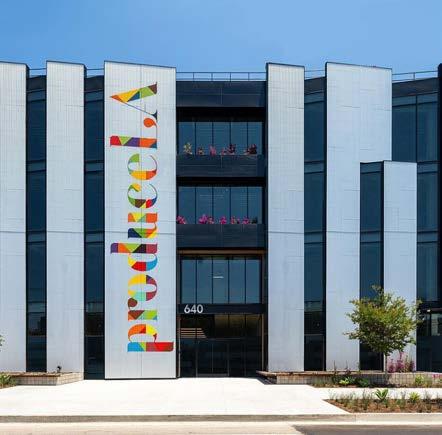
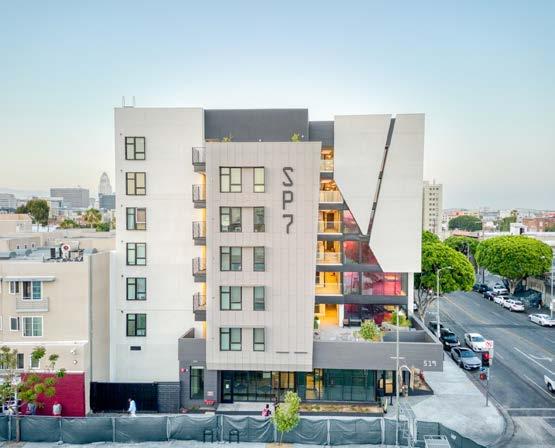
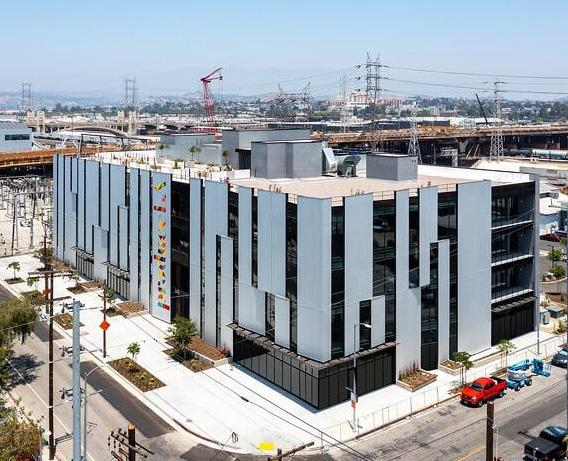
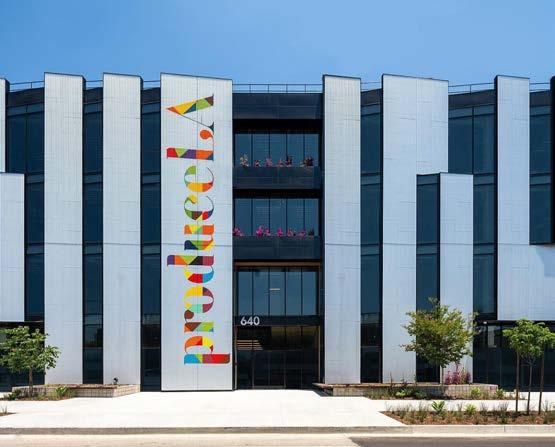
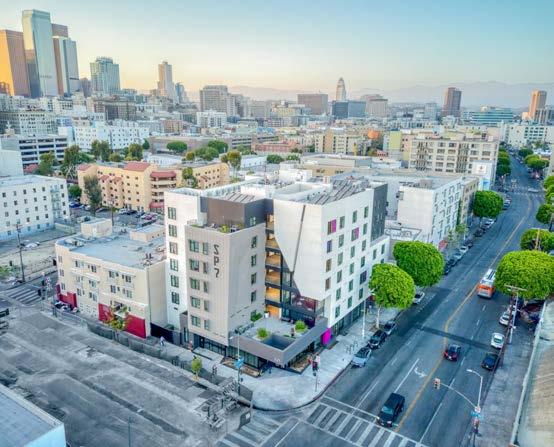
Now Open RESIDENTIAL SP7 APARTMENTS Skid Row Housing Trust 81 units of permanent supportive housing featuring outdoor gardens, laundry facilities, and designated services space. OFFICE PRODUCE LA Developer: Continuum Partners 100 K of office SF and 15 K of retail SF near 6th and Santa Fe.
FEATURED PROJECTS
FEATURED PROJECTS Under Construction
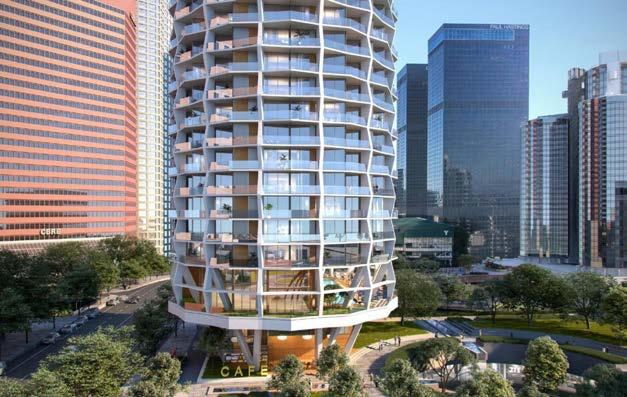
RESIDENTIAL BEAUDRY
Developer: Brookfield
Situated behind FIGat7th, this residential tower will rise to 64 stories and contain 785 residential units.
RESIDENTIAL EIGHTH & FIGUEROA
Developer: Mitsui Fudosan
41-story residential tower with 438 units developed by Japanese ownership who have held the property since the 1980s.
MAJOR MIXED-USE ALLOY
Developer: Carmel Partners
The first high-rise development in the Arts District will feature 475 apartments and over 100K SF of office space.
26 Downtown Center Business Improvement District YEAR-END 2022 MARKET REPORT
FEATURED PROJECTS Under Construction
HOTEL AC/MOXY HOTEL
Developer: Lightstone
1,162-room hotel featuring Marriott brands Moxy and AC Hotels. One of several major hotel projects in the pipeline near the LA Convention Center.
RESIDENTIAL ATO
Developer: ETCO Homes
Sales are expected to begin soon at this 77-unit condo project in Little Tokyo that is nearing completion.
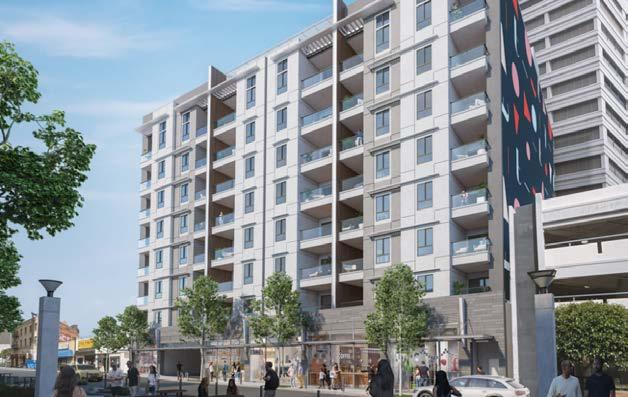
RESIDENTIAL EMERALD
Developer: Jade Enterprises
The latest from this local developer is expected to open later this year with 154 apartment units in South Park.
27 Downtown Center Business Improvement District
FEATURED PROJECTS Under Construction
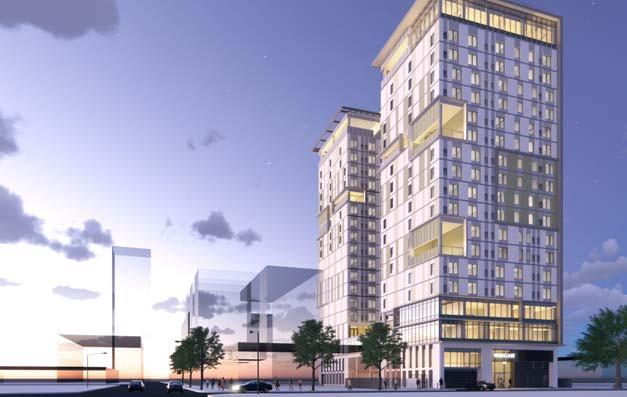
AFFORDABLE HOUSING WEINGART TOWER 1A
Developer: Weingart Center Foundation
One of the largest permanent supportive housing projects in DTLA, this 19-story development includes 278 units.
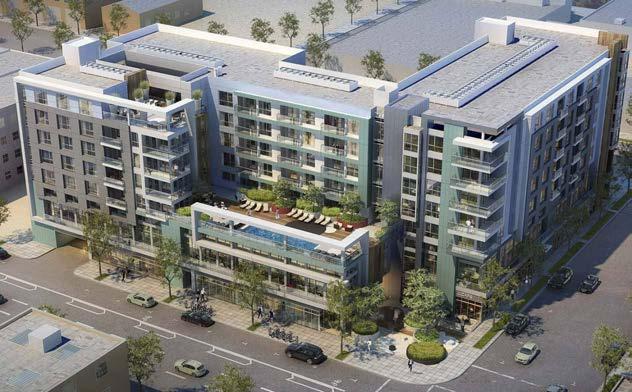
RESIDENTIAL AVA ARTS DISTRICT
Developer: AvalonBay
475 apartments over 61,000 SF of retail space across from ROW DTLA in the Arts District.
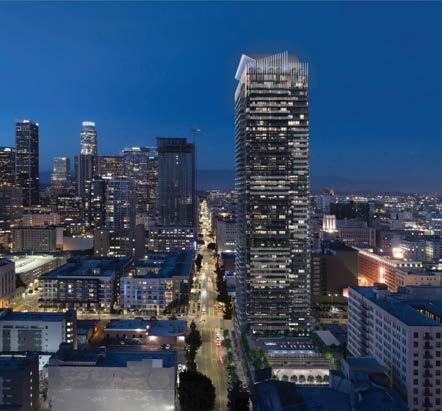
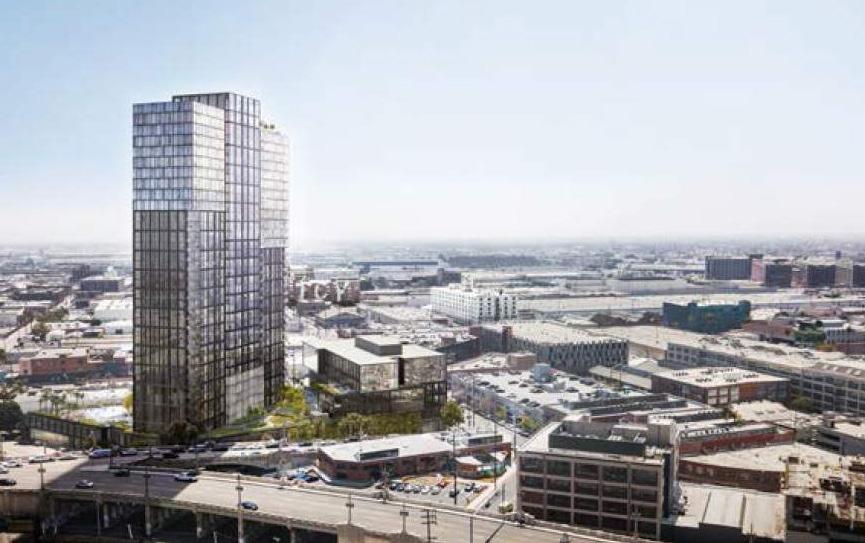
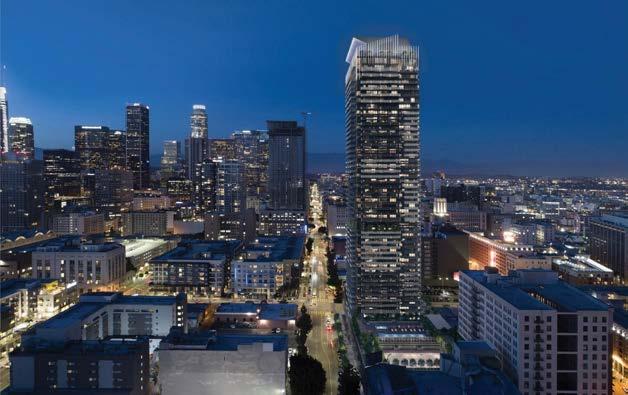
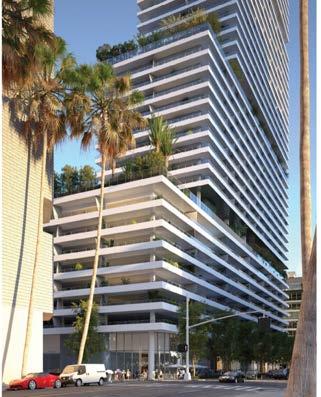
RESIDENTIAL OLYMPIC & HILL
Developer: Onni Group
At over 760 feet and 60 stories, this will be the city’s 4th tallest building and tallest residential high-rise.
28 Downtown Center Business Improvement District YEAR-END 2022 MARKET REPORT
FEATURED PROJECTS Under Construction
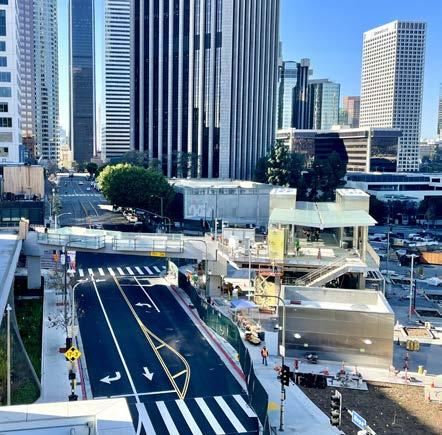
CIVIC & CULTURAL REGIONAL CONNECTOR
Developer: Metro
This 1.9-mile, $1.58 billion underground light rail extension, set to open in the coming months, will provide a one-seat ride for north/ south and east/west travel across Los Angeles County through the heart of Downtown.
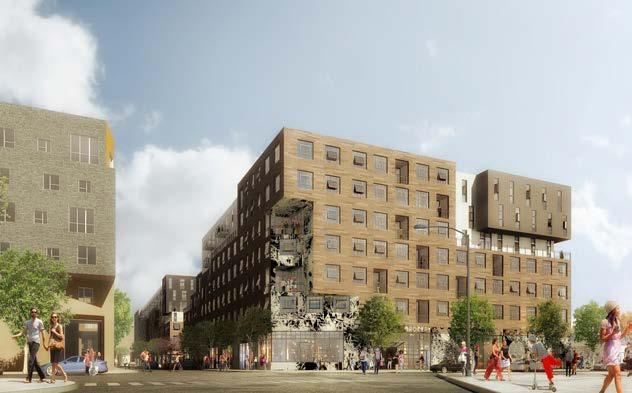
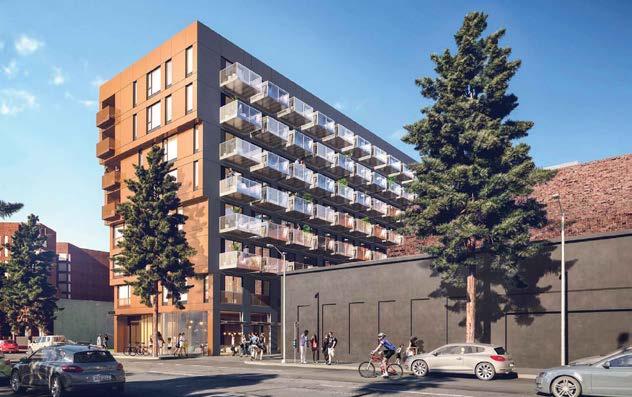
RESIDENTIAL 1317 GRAND
Developer: Housing Diversity Corporation
This project will feature 147 studio “micro-unit” apartments averaging around 325 SF with no on-site parking.
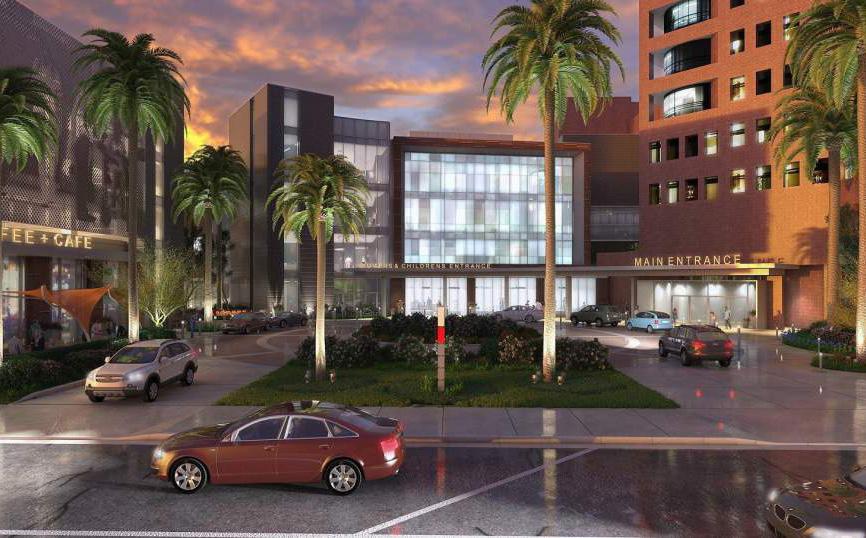
CIVIC & CULTURAL CALIFORNIA HOSPITAL MEDICAL CENTER
Developer: Dignity Health California
The hospital campus is adding a four-story, 150 K SF patient tower to expand its ER, trauma, and maternity departments.
29 Downtown Center Business Improvement District
FEATURED PROJECTS Proposed
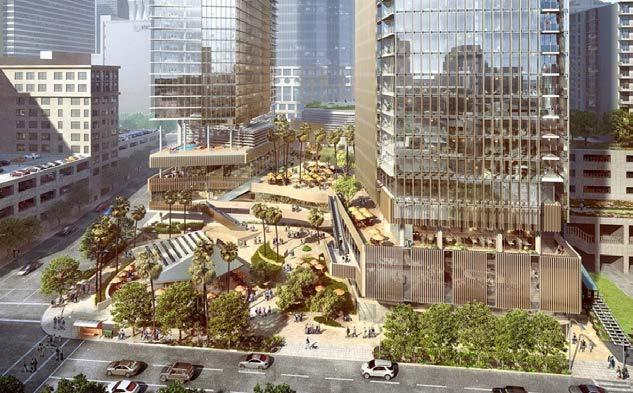
MAJOR MIXED-USE ANGELS LANDING
361 S. Hill St.
Developer: Peebles Corporation, Macfarlane Partners, Claridge Properties
Design: Handel Architects
Planned two-tower development to feature luxury hotel venues, spacious condos & apartments featuring panoramic views, and a terraced, ground-level, open-air public plaza.
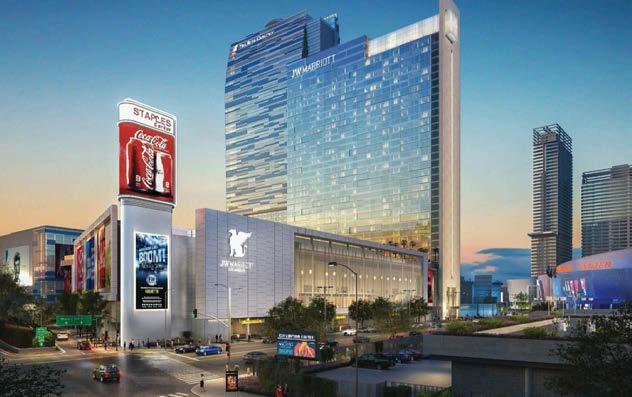
HOTEL JW MARRIOTT LA CONVENTION CENTER EXPANSION
900 W. Olympic Blvd.
Developer: AEG and Plenary Group
Design: Gensler, Populous, Olin
700,000 SF expansion of the existing hotel will add 861 new hotel rooms at LA Live.
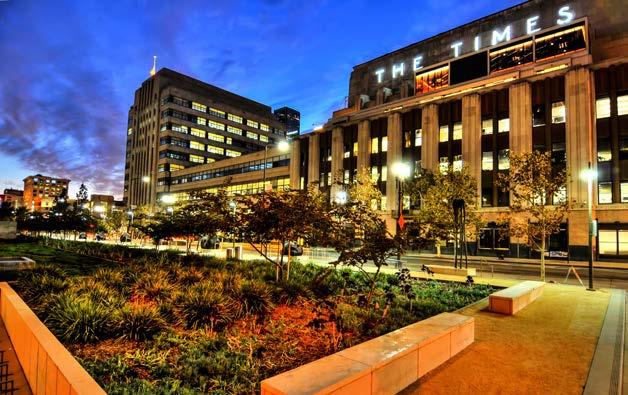
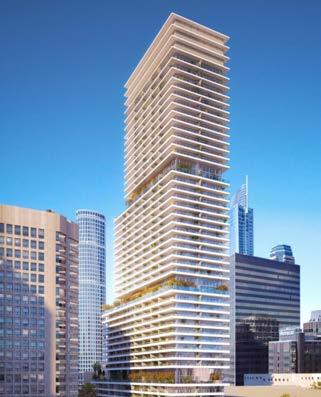
MAJOR MIXED-USE ONNI TIMES SQUARE
100 S. Broadway
Developer: Onni Group
Design: Solomon Cordwell Buenz (SCB) and CallisonRTKL (CRTKL)
Proposed high-rise towers to replace 1973 addition will include over 1,000 apartments, 70K SF of retail, and revitalization of the original 1935 building.
30 Downtown Center Business Improvement District YEAR-END 2022 MARKET REPORT
FEATURED PROJECTS Proposed
RESIDENTIAL PARK CENTRAL
754 S. Hope St.
Developer: Mitsui Fudosan
Design: Gensler
580 market-rate residential units, 7,500 SF of retail, 37K SF for a charter school.
RESIDENTIAL RESIDENCES
AT
333 SOUTH HOPE STREET
333 S. Hope St.
Developer: Brookfield Properties
Design: ARGE Architecture
Residential tower at Bank of America Plaza will include over 350 residential units in the heart of Bunker Hill.
MIXED-USE HOTEL MORRISON HOTEL
1220-1246 South Hope Street
Developer: Relevant Group Design: SHoP Architects
Proposed development would both renovate the original 1914 property and build a new 15-story tower with 444 guest rooms.
31 Downtown Center Business Improvement District
Nick Griffin, Executive Director (213) 416-7522 I ngriffin@downtownla.com
Elan Shore, Director of Economic Development
(213) 416-7518 I eshore@downtownla.com

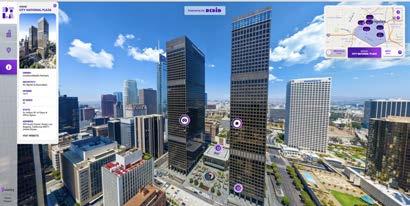
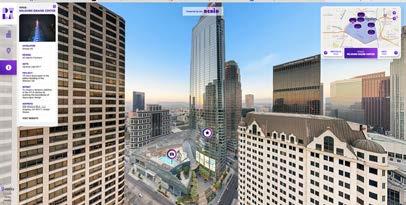
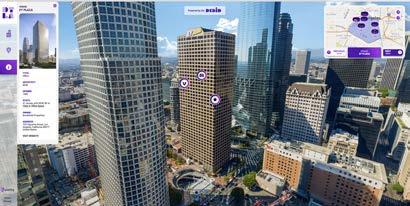
CONTACT US
SEE DOWNTOWN LA IN A NEW PERSPECTIVE For a more interactive experience, take the DTLA Virtual Tour. DOWNTOWNLA.COM / VIRTUAL SCAN
