ABOUT DTLA ALLIANCE
Founded in 1998, the DTLA Alliance has been a catalyst in Downtown Los Angeles’ transformation into a vibrant 24/7 mixed-use destination for over 25 years. A coalition of more than 2,000 property owners in the Downtown Center, the DTLA Alliance is committed to enhancing the quality of life in Downtown LA.
The mission of the Economic Development team is to ensure that DTLA remains the premier choice for office, residential, hospitality, retail, and cultural investment. We provide services to support and promote investment and development in DTLA, including:
• Market & Research Reports
• Tours & Events
• Development Consulting
• Requests for Information
• Press & Media Inquiries
Whether you need information on construction and development, insights on the DTLA market, finding a location for your business, or you just want to learn more about Downtown’s market sectors and dynamics, we are your best source for information about DTLA
To learn more about the Downtown LA and the DTLA Alliance, visit DowntownLA.com
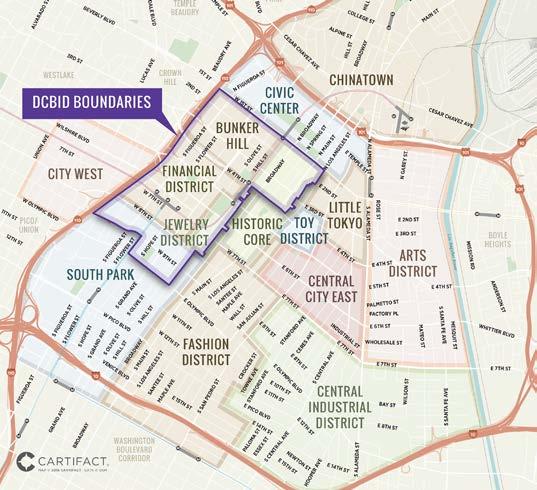

DOWNTOWN CENTER
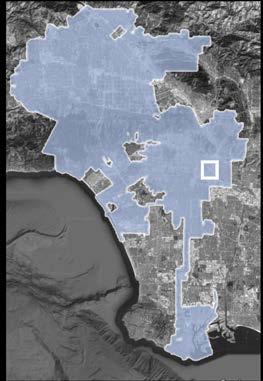
DEFINITION OF DOWNTOWN LA
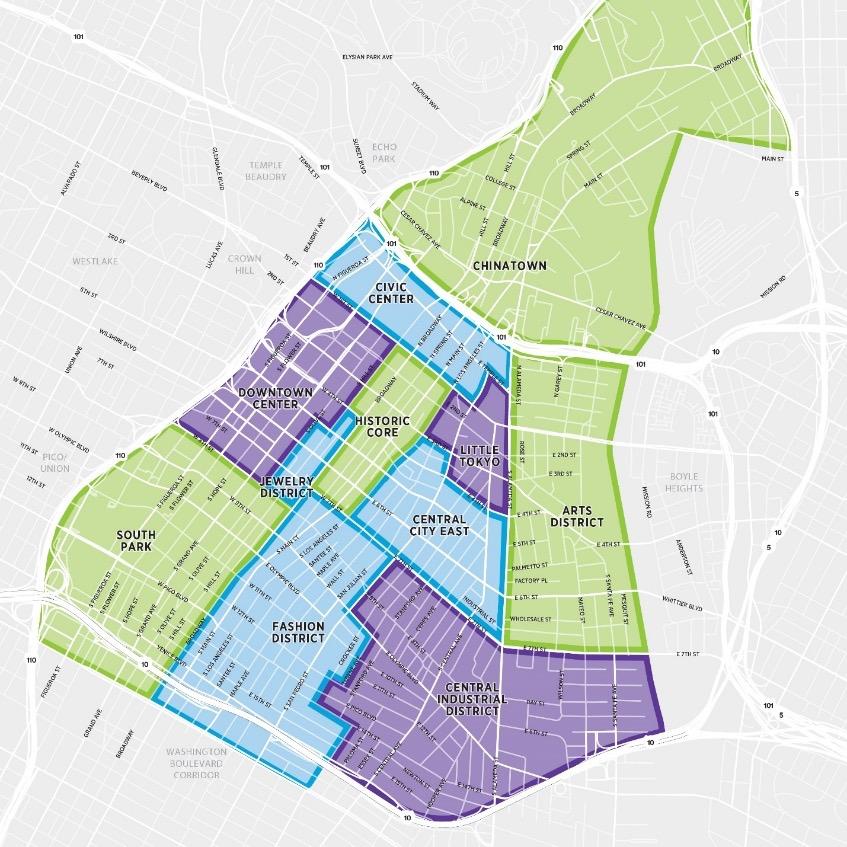
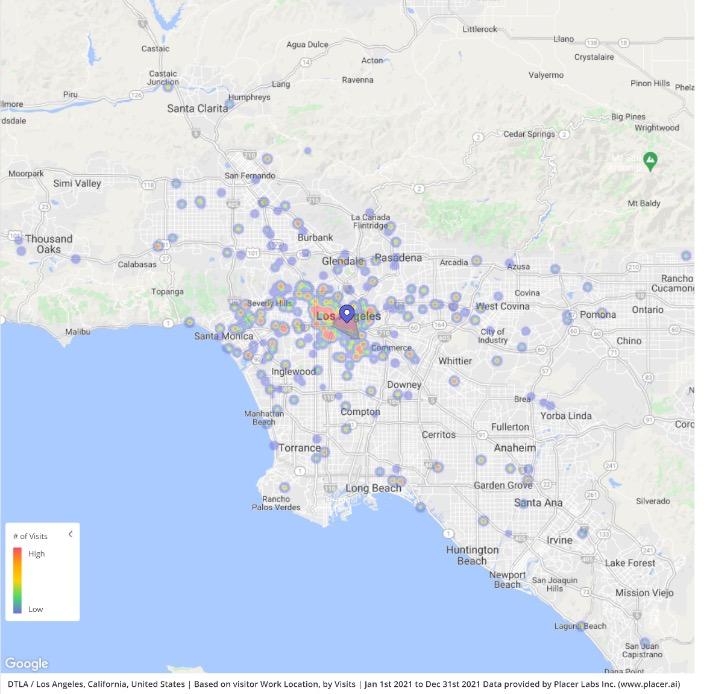
The DTLA Alliance defines Downtown Los Angeles as the area bounded by the 110, 101 and 10 freeways and the LA River, plus Chinatown, City West, and Exposition Park. The projects contained in this report are within a portion of Downtown Los Angeles, shown on the map to the left.
METHODOLOGY AND SOURCES
Renegage Marketing
The DTLA 2025 Survey was conducted in partnership with Renegage Marketing from January 27 to February 14, 2025. A 10-minute online questionnaire was completed by 1,233 respondents. The margin of error associated with this sample size is approximately 3% with a 95% confidence interval. Renegage Marketing has helped produce surveys with the DTLA Alliance for more than 10 years and is one of the partners on the Sports & Leisure Research Group’s nationwide Consumer Optimism Barometer.
Placer.ai
Placer.ai generates insights about consumer behaviors and preferences using geolocation data from mobile app usage. This technology and place-based approach allows them to produce daily data for visitors, residents, and workers that can be accessed almost immediately. Placer.ai also incorporates a range of other sources such as Experian Mosaic, a consumer lifestyle segmentation tool referenced in this report. Unless otherwise stated, all Placer.ai data in this report is based on the period of January 1, 2024 to December 31, 2024.
US Census Bureau
This report includes the most recent available data from the US Census Bureau, including census-tract level breakdowns from the 2023 American Community Survey (ACS), the 2020 Decennial Census, and 2022 Longitudinal Employer Household Database (LEHD).
State of California Employment Development Department
The Labor Market Information Division (LMID) of EDD is the prime source of high quality and timely workforce and labor market information for the State of California. Statistics in this report are based on Q1 2024 data.
Esri
Esri is a market leader in geographic information system (GIS) software, location intelligence, and mapping. Through their partnership with Data Axle, they provide business summary and business location datasets for over 13 million businesses including sales and employment information.
CoStar
CoStar is the industry leader in commercial real estate information and analytics, tracking over 135 billion square feet of commercial space at over 6.4 million commercial properties.

EXECUTIVE SUMMARY
This is the DTLA Alliance’s fourth annual Outlook & Insights Report – an update on the state of Downtown Los Angeles – combining our signature survey of Downtown residents, workers, and visitors with detailed economic and demographic data. The report paints a detailed picture of DTLA as a market – and a community – and positions it in the context of the City of Los Angeles, Southern California region, the nation, and globe.
This year’s report demonstrates both the success DTLA has had dealing with the aftereffects of the pandemic and Downtowners’ opinions about the extent of work that remains to be done.
In terms of the real estate market, the residential, hospitality, and retail sectors have not just stabilized, but regained some of their momentum. On the retail front, a wave of over 130 new F&B establishments has more than made up for pandemic-related closures. The office sector remains an outlier, continuing to lag due to the impact of remote work.
The overriding message from almost 1,200 respondents to our annual survey was one of continued enthusiasm for DTLA coupled with frustration about inadequate progress on critical concerns. Whether on general questions about Downtown’s direction or specific ones on issues like public safety, this year’s survey indicated that the pace of improvement seen last year had slowed.

Still, residents remain committed, with a significantly larger share planning to stay for 4 years or more.
Despite challenges impacting downtowns across the nation, DTLA remains vital to the LA region – not only as its primary core of commercial activity and most significant job base but also as a vibrant local community of over 90,000 residents, a dynamic global center of arts, culture and entertainment, and the hub of its regional transit system. It is also a prime destination for tourists and locals alike, with a substantial number of respondents saying they visit frequently.
Downtown’s revitalization over the past 25 years has laid the groundwork for its continued growth, and to close out 2024, the Department of City Planning adopted the long-awaited DTLA 2040 Community Plan – a blueprint for the next phase of Downtown’s evolution, paving the way for over 100,000 new residential units accommodating a potential population increase of 175,000 people.
By combining the dual vantage points of economic conditions and public sentiments, this report illuminates DTLA’s strengths as a community and a market, the challenges and opportunities it faces, and its importance to the City of Los Angeles. When LA was awarded the 2028 Olympic Games, Downtown’s renaissance as a vibrant urban center was a key factor, and when the global spotlight is on the city three years from now, DTLA will be center stage.
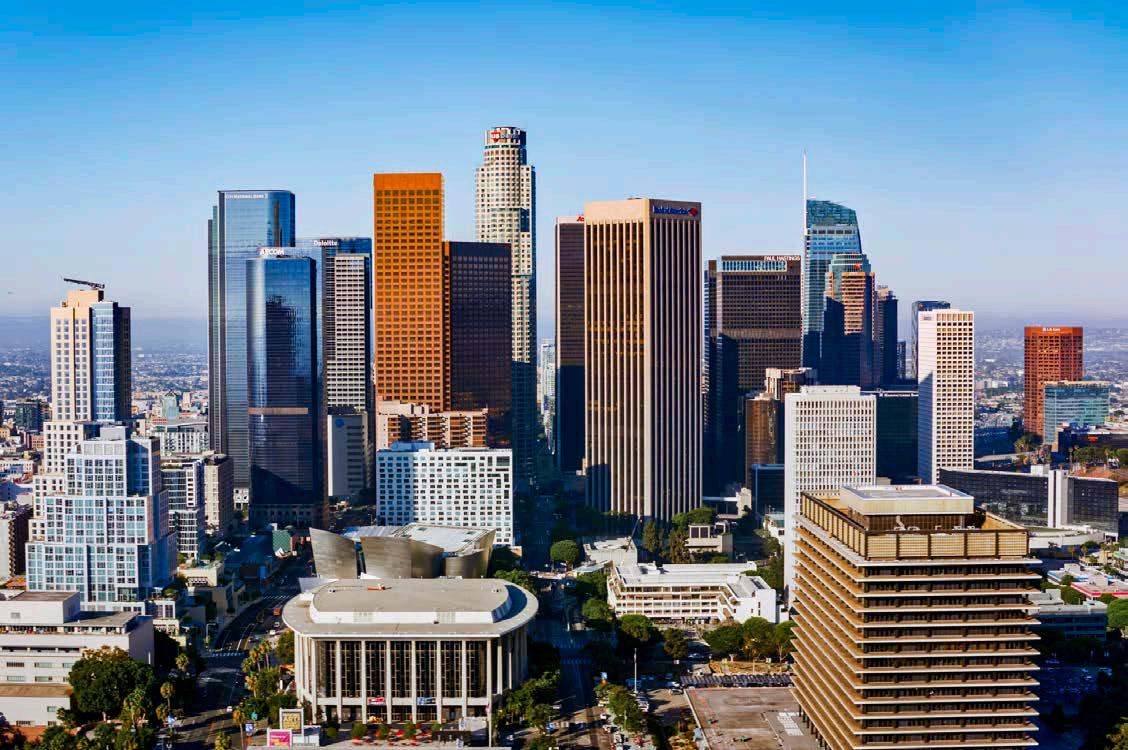
DTLA: THE HEART OF LOS ANGELES
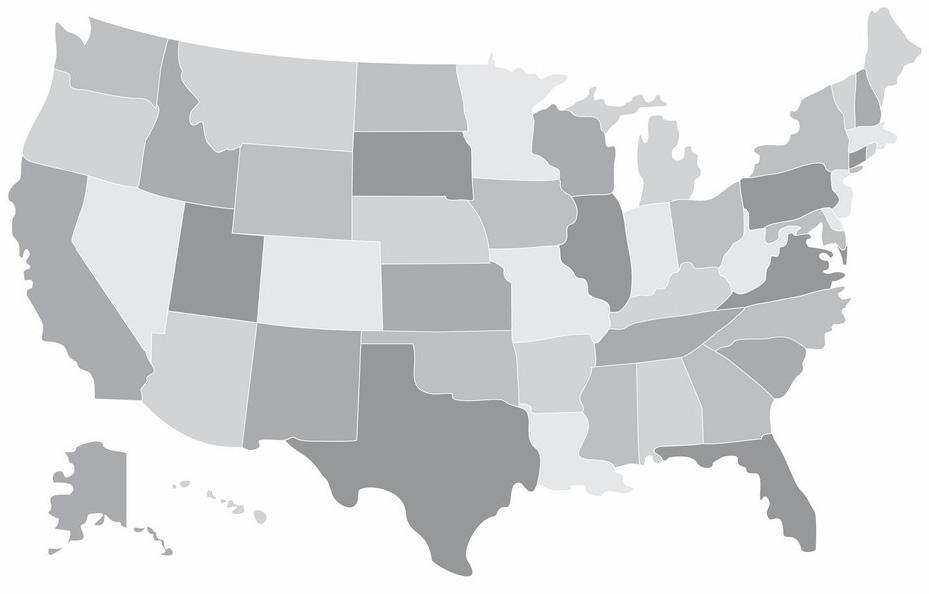
Representing just 1.4% of the total land area of the City of Los Angeles, DTLA plays an outsized role in the city’s economy. It does this with a combination of density and diversity, creating a central meeting point for all Angelenos. While it has long served as the city’s principal commercial business district, the renaissance of the past 25 years has added a vibrant residential community, a global center for arts & culture, and a retail sector that continues to add to an already impressive roster of businesses.
1.4%
DTLA Share of the City of Los Angeles Land Area
Despite representing a tiny percentage of the land area in the City of Los Angeles, DTLA plays a significant role in every sector of the local economy.

CITY OF LOS ANGELES
DTLA: THE HEART OF LOS ANGELES
31,828
New residential units since 2010
DTLA has delivered 22% of the new housing inventory in the City of LA since 2010.
21% of Citywide Jobs Talent, world-class amenities and unparalleled access to transit draw employers to DTLA.
747 Retail Businesses Per Square Mile
The density of storefronts in DTLA is a key part of its appeal to both shoppers and retailers.
VISITATION INSIGHTS
MONTHLY VISITS
After a significant recovery in 2020 and 2021, visits to DTLA have remained within a range of 8-10 million per month, which is just slightly below the average experienced prior to the pandemic. Meanwhile, although workplace visitation remains negatively impacted by a shift to hybrid work schedules, the total number of workplace visits per month has grown each year since 2021.
VISITORS:
9.1 M
Visits per month
MONTHLY WORKPLACE VISITS:
262,000 Workers
NATIONAL TRAVEL TO DTLA
13.8
Average visits per worker
In 2024, 2.7 million visitors who live more than 250 miles away stayed overnight in DTLA. The total number of visits was 12% higher than for 2023 and 40% higher than for 2021. These visitors spent an average of 2.2 days in DTLA, with 30% staying for 3 or more days. July was the most popular month with 343K trips to DTLA, which is 37% higher than the monthly average for the year.
TOP 10 DTLA TRIP ORIGINATION LOCATIONS (Number of Visitors)
Source: Placer.ai
Source: Placer.ai
DTLA 2040
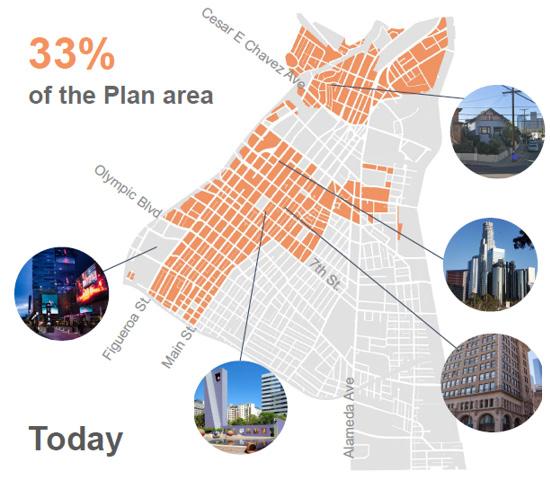
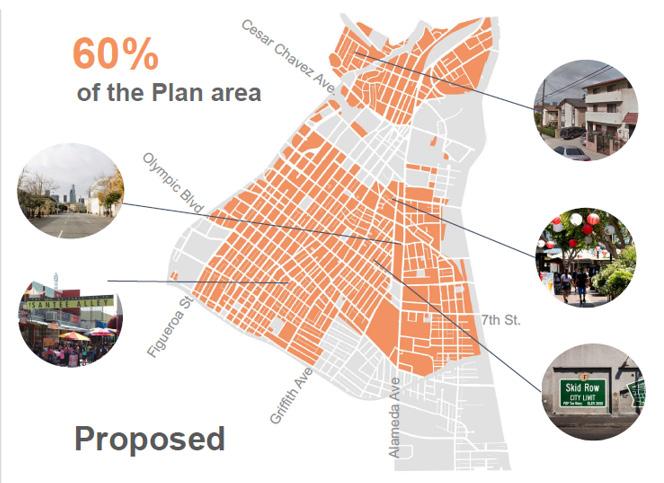
The new Downtown Community Plan, commonly known as DTLA 2040, which provides a blueprint for the next phase of residential growth, was approved in 2024. It not only increases Downtown’s overall capacity for new residential development, it includes several key provisions that will encourage increased density by providing incentives and eliminating requirements.
KEY FEATURES OF NEW COMMUNITY PLAN
KEY FEATURES OF NEW COMMUNITY PLAN
• Increase the portion of Downtown where housing can be built by-right from 33% to 60%
• Updated zoning and land use designations are more tailored to current uses
• 3-level Community Benefits Program provides density bonuses for including affordable housing, open space/community facilities, and contributing to a community benefits fund
• Elimination of parking requirements, allowing developer to assess their needs
• Expansion of adaptive reuse to include any building that is more than 25 years old
Source: LA City Planning
QUARTERLY TRACKING STATS
The residential market rebounded strongly after a short-term decline during the pandemic, with rent and occupancy returning to pre-pandemic levels. Although occupancy dipped during the first three quarters of 2023 due to delivery of over 2,000 new units, it has remained over 90% for four straight quarters.
The impact of continuing uncertainty about return-to-work was felt across the region, with vacancy rates reaching a historic high in Q2 and remaining above 30% through Q4. Meanwhile, asking rents, have shown no clear pattern, falling through Q1 2024, then rising in Q2 and Q3, before falling again in Q4.
QUARTERLY TRACKING STATS
RETAIL
Retail rents have remained remarkably stable, indicating that interest in urban locations like Downtown LA has stayed strong. Although the vacancy rate has ticked up, much of that is due to the introduction of new inventory and the recent announcement of the closure of Macy’s at The Bloc.
$3.50
$3.25
$3.00
$2.75
$2.50
Both occupancy and RevPAR made significant gains in 2022 and ticked up even further to start 2023. Since then, both have remained mostly flat, sitting roughly 10% below their pre-pandemic levels.
A PLACE TO LIVE
DTLA residents are significantly younger and more ethnically diverse than the city and region as a whole and have a slightly higher rate of postsecondary education. Although the residential population has grown by over 40% overall from 2010 to 2024, that growth has been concentrated in certain census tracts – primarily in South Park, the Historic Core, and the Arts District – where new residential development has been most heavily concentrated.
RESIDENTS
47%
Residential Population Growth from 2010 to 2023
$98,000
Average DTLA Resident Household Income
HOUSEHOLD INCOME
67% Residents with Postsecondary Education
EDUCATIONAL ATTAINMENT
Source: American Community Survey 5-Year Estimates (2019-2023)
A PLACE TO LIVE
DTLA is the “first choice” for Angelenos who want an active urban lifestyle. As such, Downtowners are much more likely to use alternative modes of transportation and tend to work closer to where they live. Because the DTLA housing market is predominantly rental and its demographics skew towards young and single, it is also more transitory than the rest of the region. At the same time, it attracts a significant share of long-term residents, as demonstrated by our survey.
36
Median age of DTLA Residents
Sources: DTLA Alliance, CoStar
COMMUTING PATTERNS
46% Walk/Bike/Transit or Work from Home
Source: American Community Survey 5-Year Estimates (2019-2023)
WALK, BIKE, AND TRANSIT SCORES
93 Downtown Average Walkability Score
Source: Walk Score (2023)
A PLACE TO WORK
Office tenants are drawn to DTLA by a range of factors including its central location in the region and access to transit and talent. As a result, Downtown is the largest employment cluster in the region, with 21% of all jobs in the City of LA located here. Moreover, the average annual wage for these jobs is 37% higher than for the City of LA and 43% higher than for LA County as a whole. Also, despite ongoing challenges in the office sector, the number of jobs in DTLA has grown by almost 10% since 2021, with wages growing by an even more impressive 23%.
48, 504
A PLACE TO WORK
RACE/ ETHNICITY
60% Workers Aged 30-54
55% Workers with Postsecondary Education
Source: Placer.ai
48% of DTLA Workers Commute Less Than 10 Miles from Their Home
A PLACE TO VISIT, SHOP
,
AND DINE
Total visitation to DTLA has returned to pre-pandemic levels and is on a growth trajectory as business and convention travel has ramped back up. DTLA visitors are a diverse group and include everyone from national and international tourists to locals coming for dinner or to serve on jury duty, and everyone in between. Locally, Downtown is one of the premier “day trip” locations due to its variety of attractions and amenities. For those coming from outside of the region, Downtown is both a destination unto itself and an ideal base from which to explore the rest of the region.
RETAIL VITALITY
Food & Beverage Businesses per Square Mile
VISITATION HEAT MAPS
Sources: Esri, Esri-Data Axle, Esri-MRI-Simmons, Esri-U.S. BLS, 2022
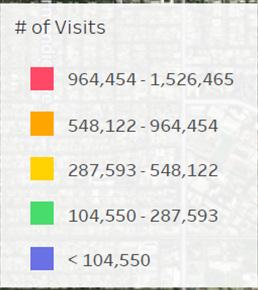
This heat map shows the most popular locations for DTLA’s 18+ million visitors in 2024. Several noteworthy areas, identified in dark yellow, had between 500K and 1M visits during the year, while the top three locations in red each saw over 1M visits.
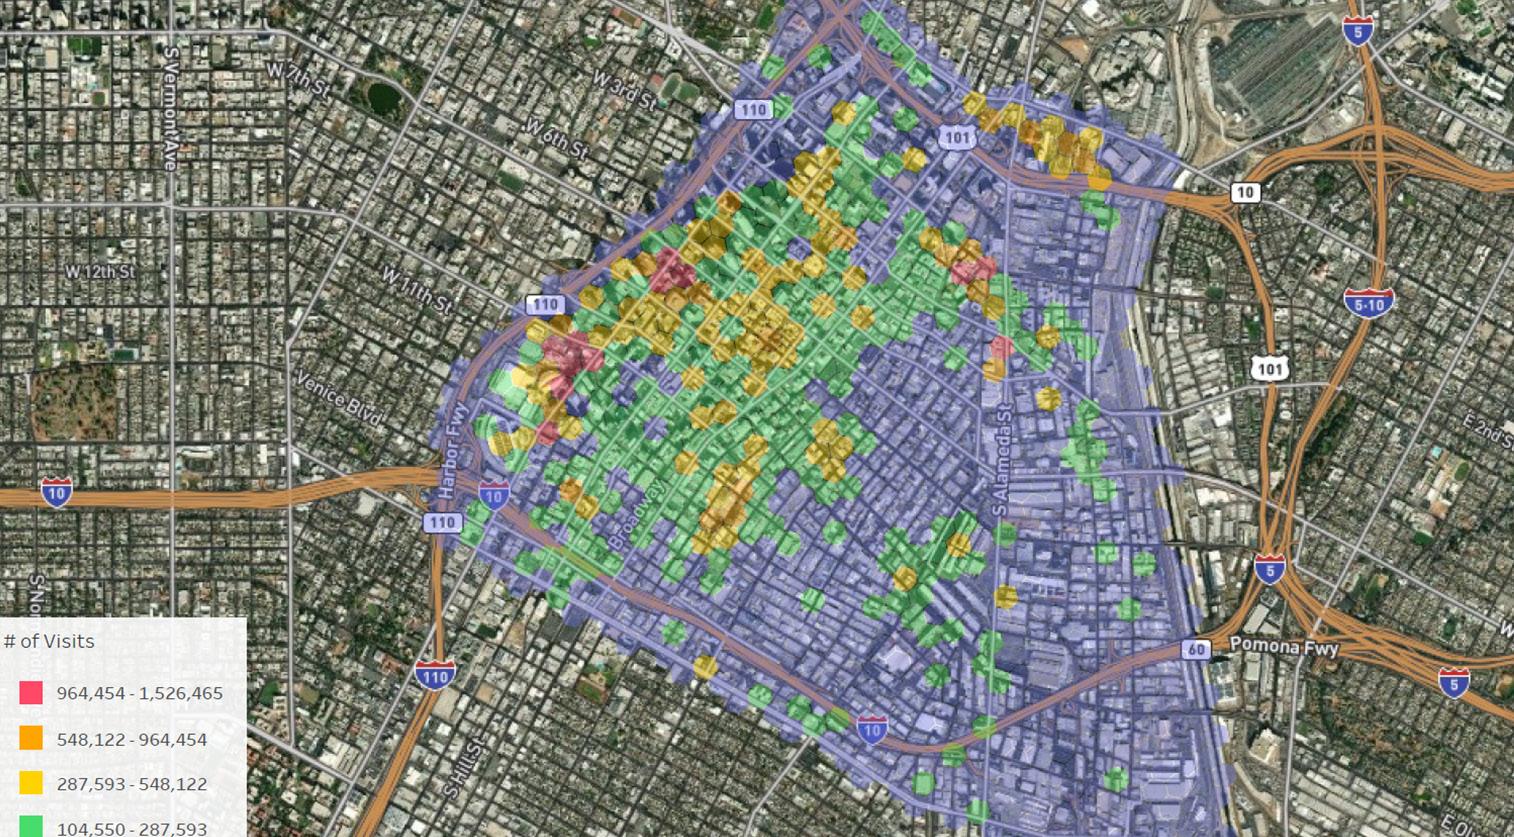
Source: Placer.ai
A PLACE TO VISIT, SHOP, AND DINE
18+ million Visitors in 2024
DTLA TOP CONSUMER SEGMENTS
Source: Placer.ai
Based on: Mosaic USA Consumer Lifestyle Segmentation by Experian
RESIDENTS
$4.8+ billion
Retail sales in 2024
WORKERS
Source: Placer.ai
“These young professionals report above average incomes topping $50,000 a year, and they seem to be thoroughly enjoying their unattached status.”
“Tend to live in multi-ethnic and multi-lingual neighborhoods, some speaking Spanish in shops and cafes, driving used American compact cars and minivans, and filling their homes with food and decorations that remind them of their roots.”
“These self-described workaholics share a desire to move up in status and they realize that every career journey starts with a first step.”
“Despite their limited budgets, these households enjoy shopping and like to experiment with styles, and they like stores that offer lots of brands.”
“Reflect the recent trend of Americans staying single longer. Most enjoy an active singles scene with plenty of nightlife, progressive values and robust leisure lives.”
Source: Experian Mosaic USA Handbook (2022)
What I love most about DTLA is the energy is that there’s always something to do! Whether it’s an art show, a rooftop party, or amazing dining, I’d love to explore it. The mix of historic architecture and modern skyscrapers gives it a unique vibe. The street art and creative community add character and make the city feel very in touch with the people and community.
The DTLA Alliance has been conducting surveys of Downtown residents, workers, and visitors since its inception in 1998. Early surveys sought to capture the rapid growth of Downtown’s residential population and its emergence as a dining and nightlife hotspot. More recently, our surveys have focused on the sentiments and behaviors of the diverse mix of people who engage with Downtown. These surveys showcased the increasing appeal of the urban experience in Los Angeles.
In our 2023 and 2024 surveys, we adjusted our focus to address the impact the pandemic was having on downtowns across the country, including questions intended to better understand the shifting realities of office work and changes to office worker engagement with Downtown. For this year’s survey and going forward, we are leaving the pandemic behind and focusing on the pace of progress towards a fully revitalized Downtown and measuring how sentiments are adapting to the ever evolving realities of urban living, working, and playing. We are also increasing our focus on the role that our organization plays in building a better DTLA for the future.
67% of survey respondents said that they love Downtown LA
44% said that they think Downtown LA is moving in the right direction but only...
DTLA 2025 SURVEY
DTLA RESIDENTS
The growth of the residential community over the past two decades has reshaped Downtown’s identity. DTLA is unique among all residential neighborhoods in the region in offering a true urban experience, which our survey indicates is the top reason people choose to live here. That is likely also why so many have stayed for as long as they have and why more than 35% hope to stay here for 6 years or more.
I love the community and I love that I know my neighbors and shop keepers. It’s truly one of few places in this big city that has character and genuine neighborhood pride.
Have lived in DTLA for 5 or more years
Plan to live in DTLA for 4 or more years
DTLA 2025 SURVEY
CHALLENGES
DTLA’s persistent post-pandemic challenges remain a major concern. While last year’s survey showed demonstrable progress from the previous year, this year’s responses suggest that progress has slowed. Nevertheless, in all four areas we asked about, a significant majority said that the situation had either improved or stayed the same.
PRIORITIES
SAFETY
As with the results on the previous page, overall safety ratings of DTLA from this year’s survey were virtually identical to last year. These results indicate that respondents broadly feel safe in DTLA during the daytime, while less than half say they feel safe at night.
RATING
DTLA 2025 SURVEY
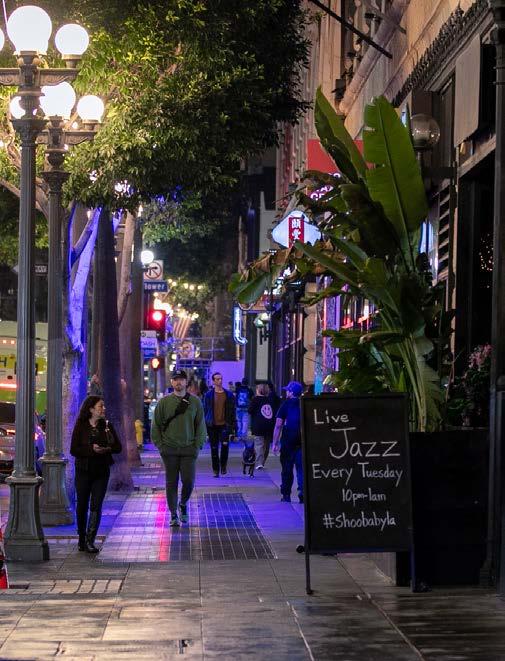
STREET LIGHTING
In November 2024, the DTLA Alliance, in partnership with Council District 14, installed café lights in trees along 7th Street between Figueroa and Hill. Improved street lighting is a valuable strategy for improving safety and the perception of safety in DTLA. As our survey results demonstrate, improved streetlighting is also a priority issue for Downtowners. Moreover, almost half of respondents indicated they had noticed improved lighting on 7th Street
49% noticed improved street lighting on 7th street
88% say it is important to have more street lighting installed in DTLA
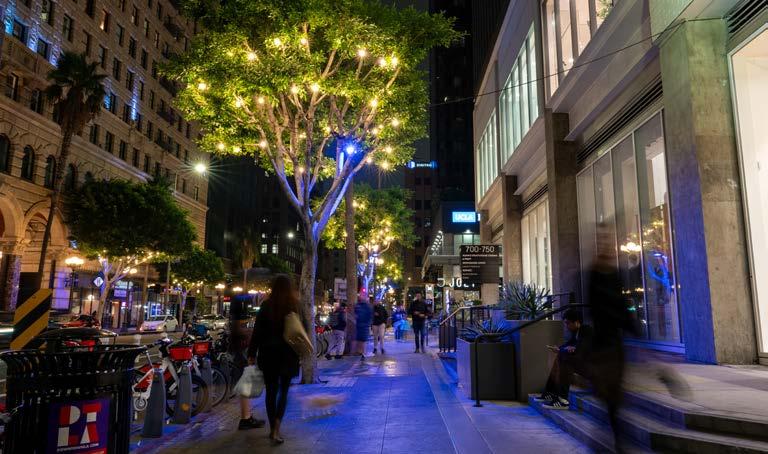
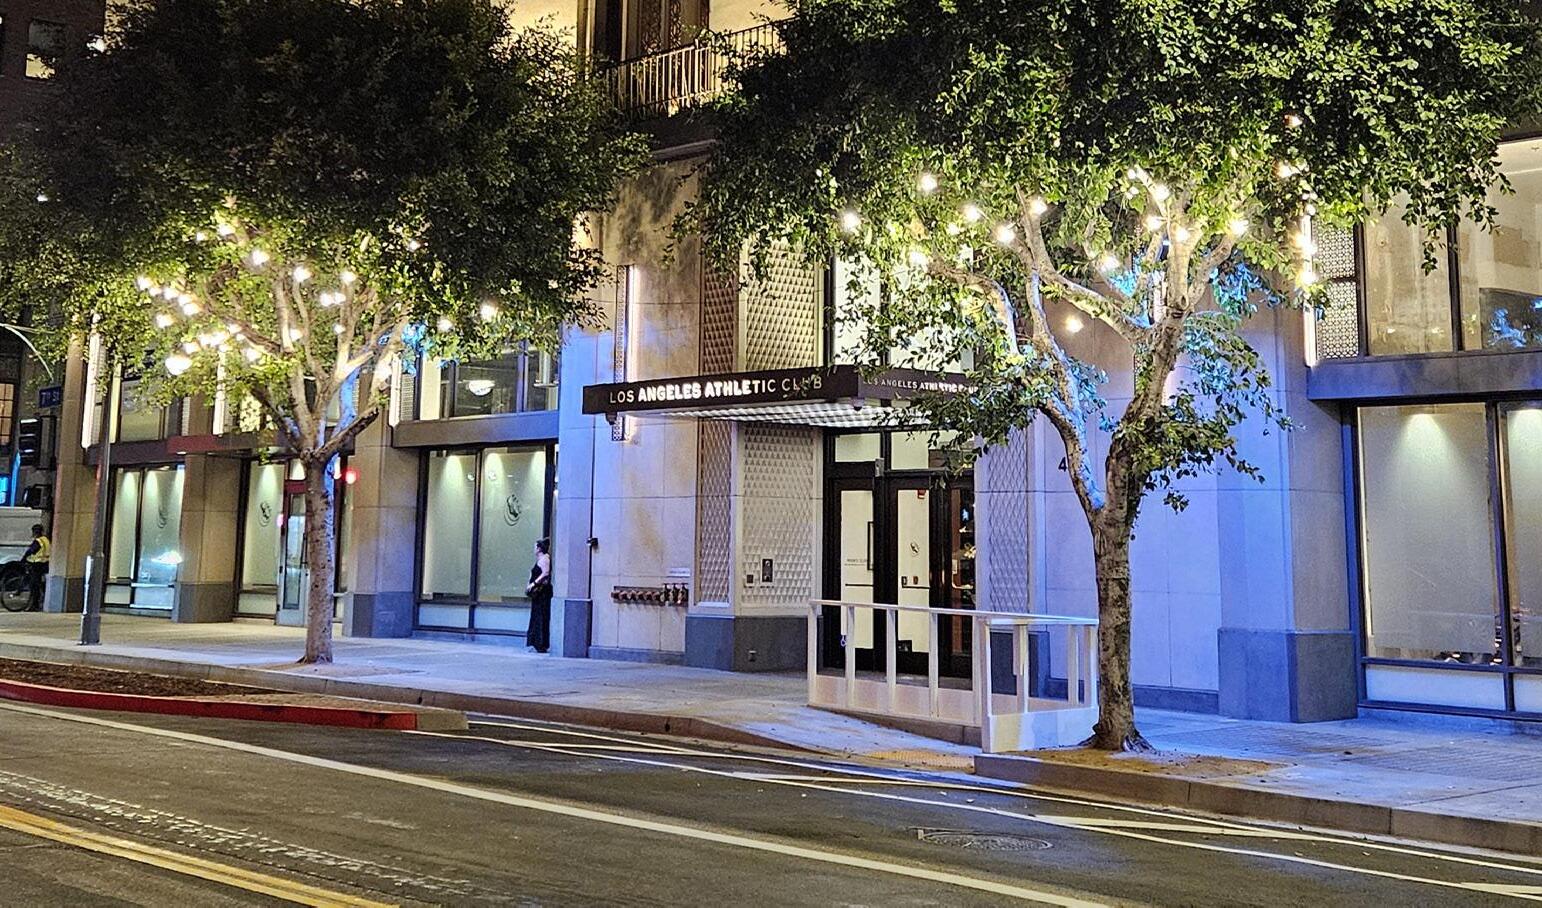
The tree lights on 7th street made a big difference.
The new lights in the trees on 7th street are wonderful.
The string lights along certain streets have made them feel much nicer to walk along.
DTLA 2025 SURVEY
RETURN TO THE OFFICE
The shifting nature of office work remains one of the crucial elements of DTLA’s recovery. This year’s survey indicates both that 100% work from home is becoming a rarity and a greater consensus is growing towards a work schedule of 3-5 days per week spent in the office. This is reflected both in terms of the actual days worked and employers’ long-term plans.
DAYS/WEEK WORKED OUTSIDE THE HOME
73% Currently work 3-5 days per week at their workplace outside the home
EMPLOYER’S LONG-TERM PLANS
81%
Employers plan for at least 50% or more in the office
DTLA 2025 SURVEY
METRO
One of DTLA’s biggest advantages is its unparalleled access to transit. As such, the state of the Metro rail system is of vital importance. While concerns about safety and cleanliness remain a priority, this year, 82% of respondents said that their experience using Metro was either improved or unchanged, while only 18% said it had declined. Comments indicate that, while improvements have been made, they have not gone far enough.
METRO EXPERIENCE
METRO EXPERIENCE
53%
Say the overall Metro experience has improved
METRO EXPERIENCE
WHAT RIDERS ARE SAYING ...
Experience has improved dramatically.
I really appreciate the increased presence of the friendly Metro Ambassadors, I think its a great program that should be expanded. I do see more LAPD on Metro but I dont know if I like that as much as the Metro Ambassadors.
Keep up the good work! Several times I was so glad there was security or ambassadors to help me. I feel a lot safer ever since Metro started enforcing fares and code of conduct. I barely see any shenanigans. Most trips I take are legitimately pleasant.
DTLA 2025 SURVEY
DTLA ATTRACTIONS
DTLA is home to some of the most popular destinations in the region. Among the most popular of these are a range of cultural and entertainment venues, dining and shopping centers, and hip and trendy neighborhoods. This combination of density and diversity of attractions is at the heart of DTLA’s appeal.
RETAIL
Survey respondents have consistently asked for more supermarkets, clothing/ apparel stores, and books/music stores. In terms of specific retailers, Trader Joe’s topped our survey as it has in previous years, with 36% of respondents desiring one in DTLA. Interestingly, no other retailer was mentioned by more than 10% of respondents. This may be because many of the retailers that have been requested in prior surveys have since opened locations here, such as Whole Foods, Sephora, and H&M.

DTLA 2025 SURVEY
ACTIVITIES
Between its world-class attractions, diverse range of shopping and dining locations, and premiere performance and event venues, respondents engaged in a wide variety of activities in DTLA. As was the case in past surveys, Downtown’s dining scene draws the most respondents, whether they live, work, or visit DTLA. Also noteworthy is that whether it is visitors or workers on their days off, the overwhelming majority of respondents indicate that they made multiple trips to DTLA in the past year.
TOP ACTIVITIES
More life in DTLA! So many new restaurants, which is so exciting.
91%
Workers visited DTLA at least once in 2024 on days they were not working
More folks visiting bars/restaurants at night, and more events that activate downtown (concerts at Pershing, the giant festival on Broadway, dodger parade, etc).
DTLA ALLIANCE
Familiar with the DTLA Alliance this year vs. 44%
Familiar with the DCBID last year
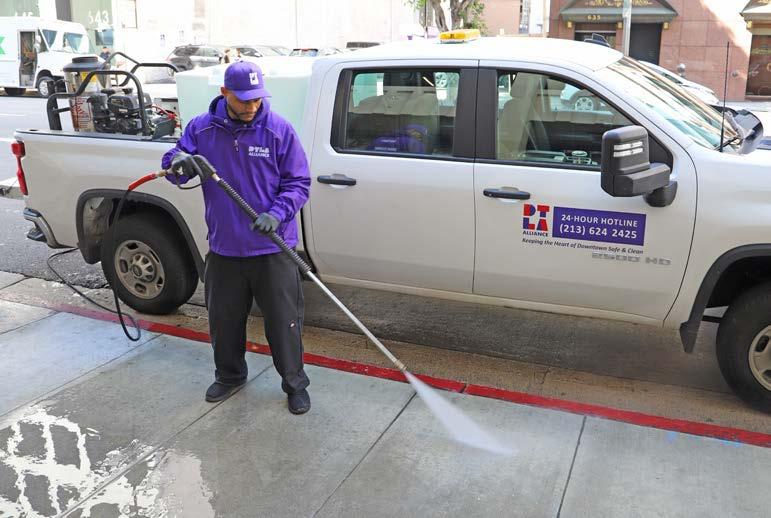
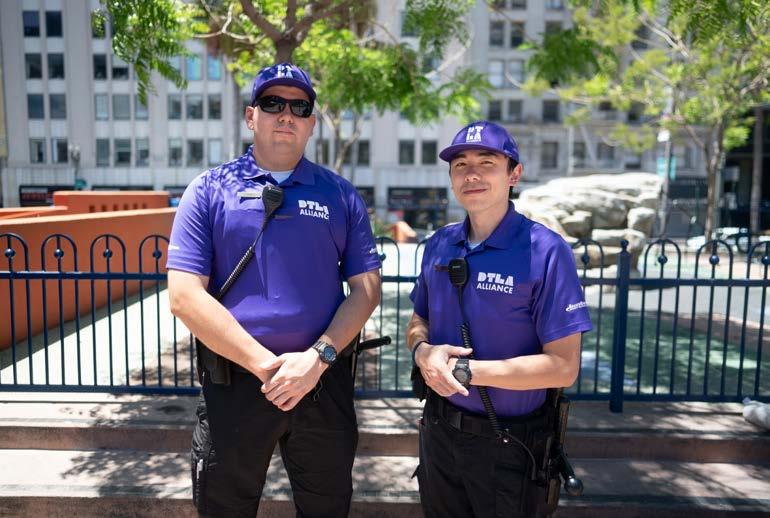
Respondents have personally engaged with DTLA Alliance Safe & Clean Services 61%
26%
Every time I like something about DTLA, I find out the DTLA Alliance is behind it.
This survey is the first one conducted under the banner of the DTLA Alliance after changing our name from Downtown Center Business Improvement District (DCBID). One of the main reasons for changing our name to the DTLA Alliance was to help raise awareness of the organization as a resource to stakeholders. As we see in our survey results this year, we achieved our goal, with awareness of the organization rising from just 44% last year under our previous name to 61% this year. In terms of the services provided by the DTLA Alliance, 2/3rds of respondents were familiar with our Safe and Clean Team (aka: Purple Patrol), while our highest ratings were for our website and social media.
DTLA ALLIANCE
DTLA
WHAT RESPONDENTS ARE SAYING ABOUT
Dispatch answers all calls within ten seconds at all times of the day. Patrol usually responds within 15 minutes. Sidewalk washdowns are done within a day. Graffiti removal is completed within a day.”
Every staff member I have interacted with (at every level) are professional, hard working and beyond compassionate. I greatly appreciate everyone’s efforts to keep DTLA safe and clean!
2 5 2 O A PLACE TO
Downtown Los Angeles is the primary hub of commercial activity for Los Angeles. It is the most significant job center in the region, a diverse collection of thriving urban neighborhoods, and a popular destination with national and global recognition.


