THE MARKET REPORT

Marching forward as the good times roll.
THE POSSIBILITIES ARE ENDLESS IN DOWNTOWN NEW ORLEANS
Q1 / 2023


Marching forward as the good times roll.
THE POSSIBILITIES ARE ENDLESS IN DOWNTOWN NEW ORLEANS
Greetings!
The Downtown Development District (DDD) is pleased to present The Market Report: Q1 2023, an overview of the economic performance of Downtown New Orleans. While macroeconomic conditions such as stagnant inflation, rising interest rates, and wavering consumer confidence continue to impact investment decisions on a national level, the DDD remains enthusiastic about the vitality of Downtown New Orleans and the investment opportunities ahead. Let me explain why.
First, for New Orleanians, the new year signals the beginning of festival season. It is our city’s great reputation and expertise at hosting large-scale events that fuel the local economy.
Once again, visitors demonstrated their love of Downtown New Orleans. During Carnival Season (January 6 – February 22), there were 1.8 million visitors, with 49% traveling more than 250 miles. These visitors powered the healthy hotel market performance, as evidenced by a 10% increase in room demand, a 10% increase in occupancy, and a 15% increase in revenue per available room, year-over-year.
Downtown New Orleans is the largest employment center in the state. Despite a minor increase in the office leasing vacancy rate to 12.7% in Q1 2023, office fundamentals remain strong as evidenced by both business expansion and new leasing activity. Notably, United Utility Services has established its new corporate headquarters in the Central Business District.
Additionally, the BioDistrict’s startup, AxoSim, announced the expansion of its laboratory space at the New Orleans BioInnovation Center. Downtown also welcomes nine new food & beverage businesses.
Finally, The Idea Village produced another outstanding New Orleans Entrepreneur Week, a convening of startups, business leaders, aspiring entrepreneurs, industry experts, and more.
While the DDD celebrates the vibrancy of Q1 2023, there is far more work to accomplish. As an organization, the DDD dedicated significant time in the prior year to strengthening partnerships with the City of New Orleans to enhance the delivery of services and programs to yield a high quality of life for the multiple
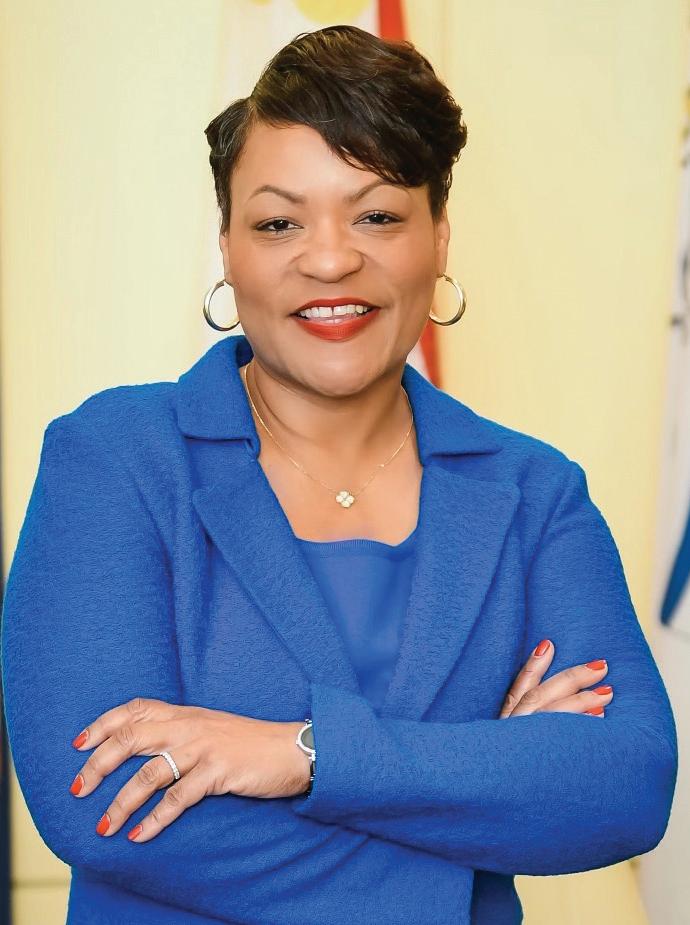
market segments we serve. We thank Mayor LaToya Cantrell and the members of the New Orleans City Council for their steadfast support of DDD’s mission.
Some key collaborative initiatives launched in Q1 2023 include the following:
Public Safety Camera Installation Program
Property Maintenance Education Program
Canal Street Merchants Association
Expanded Graffiti Removal Services
Expanded Homeless Outreach
Retail Tenant Improvement Buildout
Grant Program
I hope you will join our growing movement of public and private organizations advancing the full potential of Downtown New Orleans. Visit downtownnola.com to learn more about our programs and how you can contribute.
Thank you for investing in Downtown New Orleans!

Sincerely,
Davon Barbour President & CEO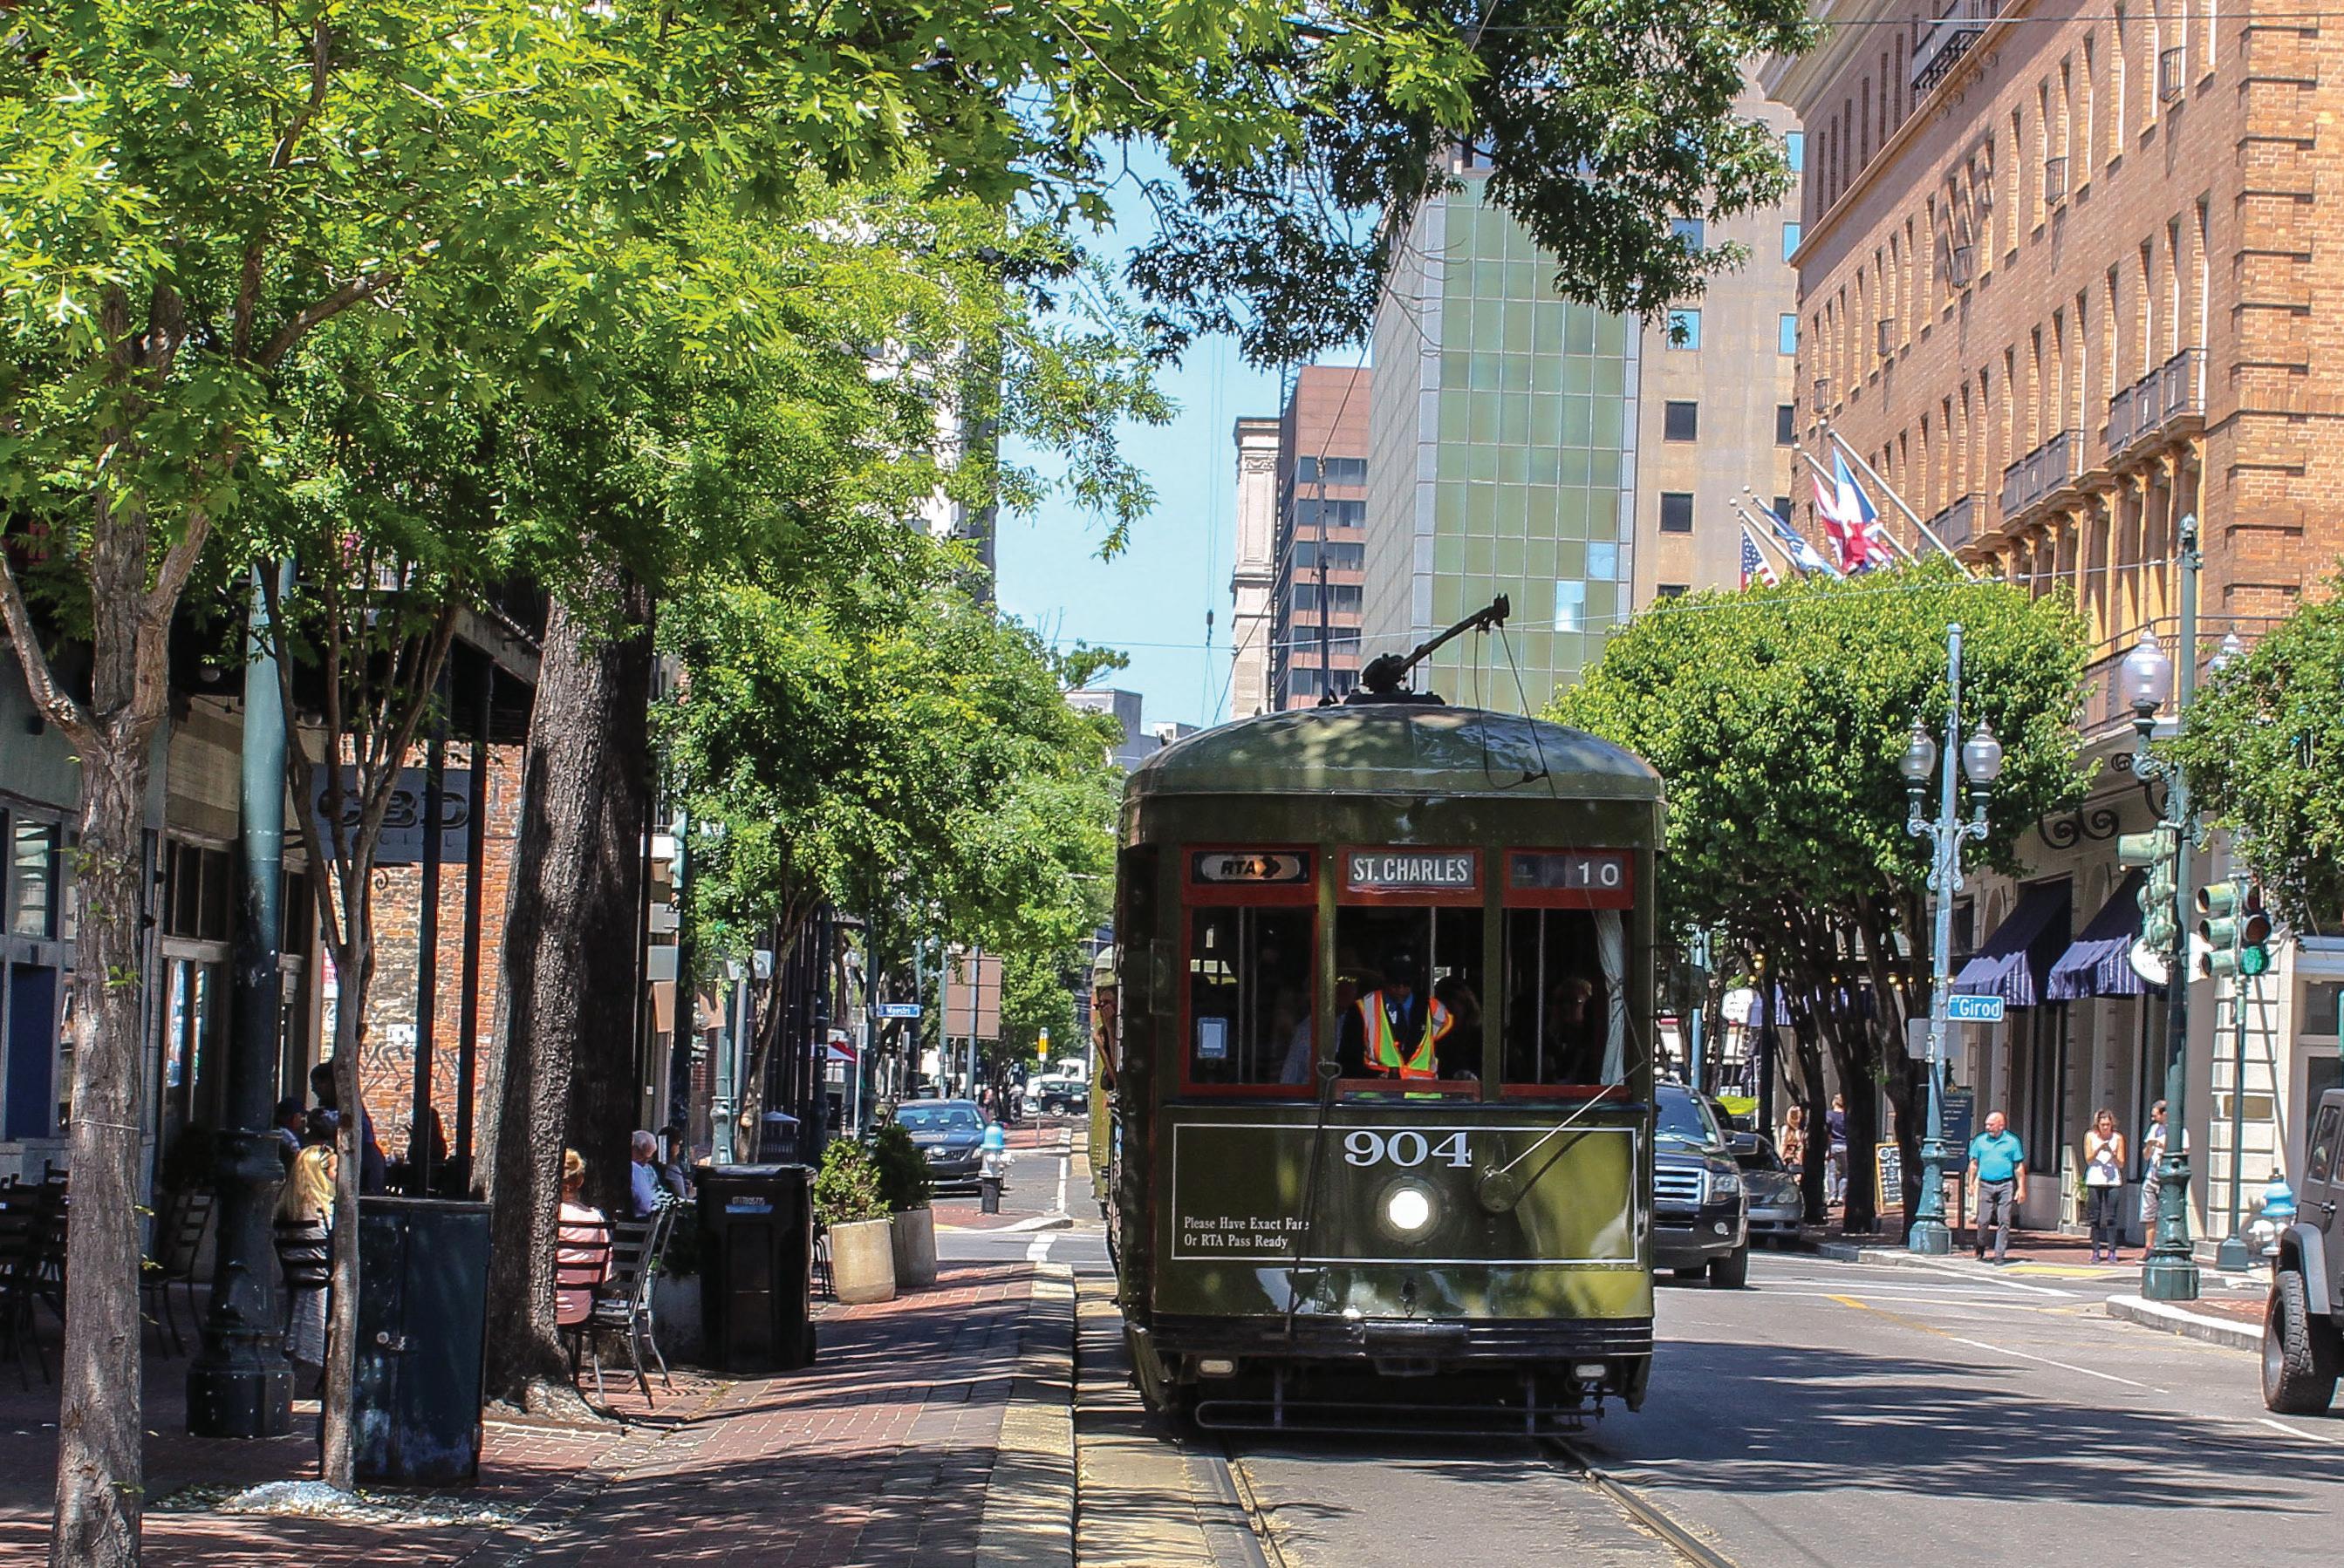
I am proud to witness the signs of progress each day from my Downtown office. My administration is pleased to continue to work alongside the Downtown Development District and celebrate our collaborative accomplishments in the first quarter of this year.
Our strengthened interdepartmental coordination has allowed us to address numerous quality-of-life issues throughout our Downtown community, such as hiring a Code Enforcement Agent and Title Researcher dedicated to Downtown, and renewing funding for the City’s Sanitation Strike Team.
I have charged the DDD to be bold and imaginative in creating a vibrant and resilient Downtown community that visitors can enjoy and that residents can take pride in, which not only attracts new businesses but also helps current businesses thrive.
Alongside the increasing number of visitors, residents and businesses coming Downtown, I hope to see you here soon!
Davon Barbour
PRESIDENT & CEO
Anthony G. Carter
DIRECTOR OF FINANCE & ADMINISTRATION
T. Trent Dang
DIRECTOR OF MARKETING & COMMUNICATIONS
Darren Harris
DIRECTOR OF ECONOMIC DEVELOPMENT
Hunter Hebert
DIRECTOR OF OPERATIONS
Alexis Kyman DIRECTOR OF PUBLIC AFFAIRS AND POLICY
Donald G. Clouse
PUBLIC SAFETY MANAGER
Tyler Correa
ECONOMIC DEVELOPMENT SPECIALIST
Ashley Mills
MARKETING & COMMUNICATIONS MANAGER
Meaghan Nguyen
ECONOMIC DEVELOPMENT SPECIALIST
John Roussell
PUBLIC SPACE OPERATIONS MANAGER
Stuart Taylor
FINANCE & ADMINISTRATION MANAGER
Francia Barradas
EXECUTIVE ASSISTANT TO PRESIDENT & CEO
Ryan Burkett
PARKS & OPEN SPACE COORDINATOR
Tempestt E. Woods
ADMINISTRATIVE ASSISTANT
Gregory Curtis
WINDSOR COURT HOTEL | CHAIR
Carla Major
DELGADO COMMUNITY COLLEGE | VICE CHAIR
Chris R. Ross
NAI/LATTER & BLUM, INC. | TREASURER
Kristi Taglauer
HOTEL PROVINCIAL NEW ORLEANS | SECRETARY
COMMISSIONERS
Coleman Adler
ADLER’S JEWELRY
Judy Y. Barrasso
BARRASSO, USDIN, KUPPERMAN FREEMAN & SARVER, LLC
William Bradshaw
GREEN COAST ENTERPRISES
Damon Burns
FINANCE NEW ORLEANS
Dr. Eric Jones
BEUERMAN MILLER FITZGERALD
Leann O. Moses
CARVER, DARDEN, KORETZKY, TESSIER, FINN, BLOSSMAN & AREAUX, LLC
Edwin Murray
LSU HEALTH NEW ORLEANS

1.8M
247K
115,000 LBS
OF LITTER PICKED UP OFF DISTRICT SIDEWALKS BY DDD CLEAN TEAM AND PARTNERING AGENCIES
APPROX.
1,560 TEMP LABOR HOURS
WERE NEEDED TO HELP KEEP THE DISTRICT CLEAN
409
CLEAN TEAM PUT IN AN
EXTRA 533 HOURS
OF OVERTIME WHILE WORKING THEIR VERY DEMANDING SCHEDULES
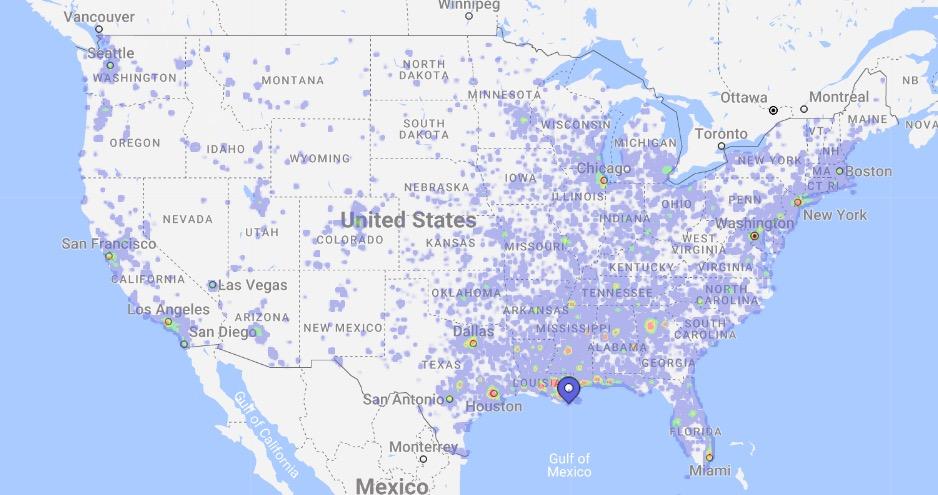
With an increase in Average Daily Rate (ADR), Revenue Per Available Room (RevPAR), and occupancy QoQ and YoY, 2023 is shaping up to be the rebound we’ve been waiting to see. According to Placer.ai, a 3rd party location analytics tool, foot traffic among Downtown’s five largest hotels, Mardi Gras 2023 showed the highest numbers since the pandemic.
When asked about occupancy rates, Darren Crumpton, the General Manager of The RitzCarlton, said that while ADR remained flat YoY, The Ritz-Carlton experienced an overall occupancy increase that in turn yielded the best Mardi Gras revenue performance on record.
In the first quarter, the New Orleans hotel market experienced a significant surge, with room demand, occupancy, and RevPAR up by 10% and 15%, respectively. This increase is indicative of the strong growth potential of the city’s hospitality industry. The rise in numbers is expected to continue with the upcoming conventions, events and conferences scheduled for the city in the next few years. Additionally, the Superbowl, slated to take place in 2025, is
expected to bring in a significant number of visitors to the city, leading to an even greater demand for hotels and other hospitality services. Overall, the future of the New Orleans hotel market looks bright, and the city is poised to continue on its upward trajectory in the hospitality industry.
Beyond Mardi Gras, the DDD will ensure that safety, sanitation, and the beautification of our commercial corridors remain a priority to our progress and potential success.

Incubate new and innovative events in the Downtown area
Create synergies amongst Downtown businesses and events
Facilitate creative placemaking and installation of lighting
Enhance cleaning of high-traffic thoroughfares
Enhance visible security and coordinate various security initiatives
DDD has partnered with the non-profit New Orleans Police and Justice Foundation (NOPJF) to expand the number of private security cameras within the DDD.
These cameras tie into the Real Time Crime Center managed by the NOPJF.
This year, Mardi Gras manifested a much needed economic boon for the city at large, as well as a boost for the bars, restaurants, hotels, and small businesses of the DDD. From January 6th to February 22nd, we welcomed 1.8 million unique visitors — a staggering number that generated increased revenue and helped reinvigorate the local marketplace.
On the season’s busiest day (February 18th)
New Orleans experienced an astounding influx of 274,000 visitors — a mix of locals and non-locals, with almost equal numbers from each group and 49% who traveled over 250 miles.
Equally as impressive, the New Orleans International Airport (MSY) deplaned 463,000 passengers in January alone. This represents a significant increase of 100,000 passengers from the previous year and evidence of the ever growing popularity of the Mardi Gras celebration, its ability to draw people from all over the country, and evidence of the growing popularity of New Orleans as a destination for travelers from all over the world.
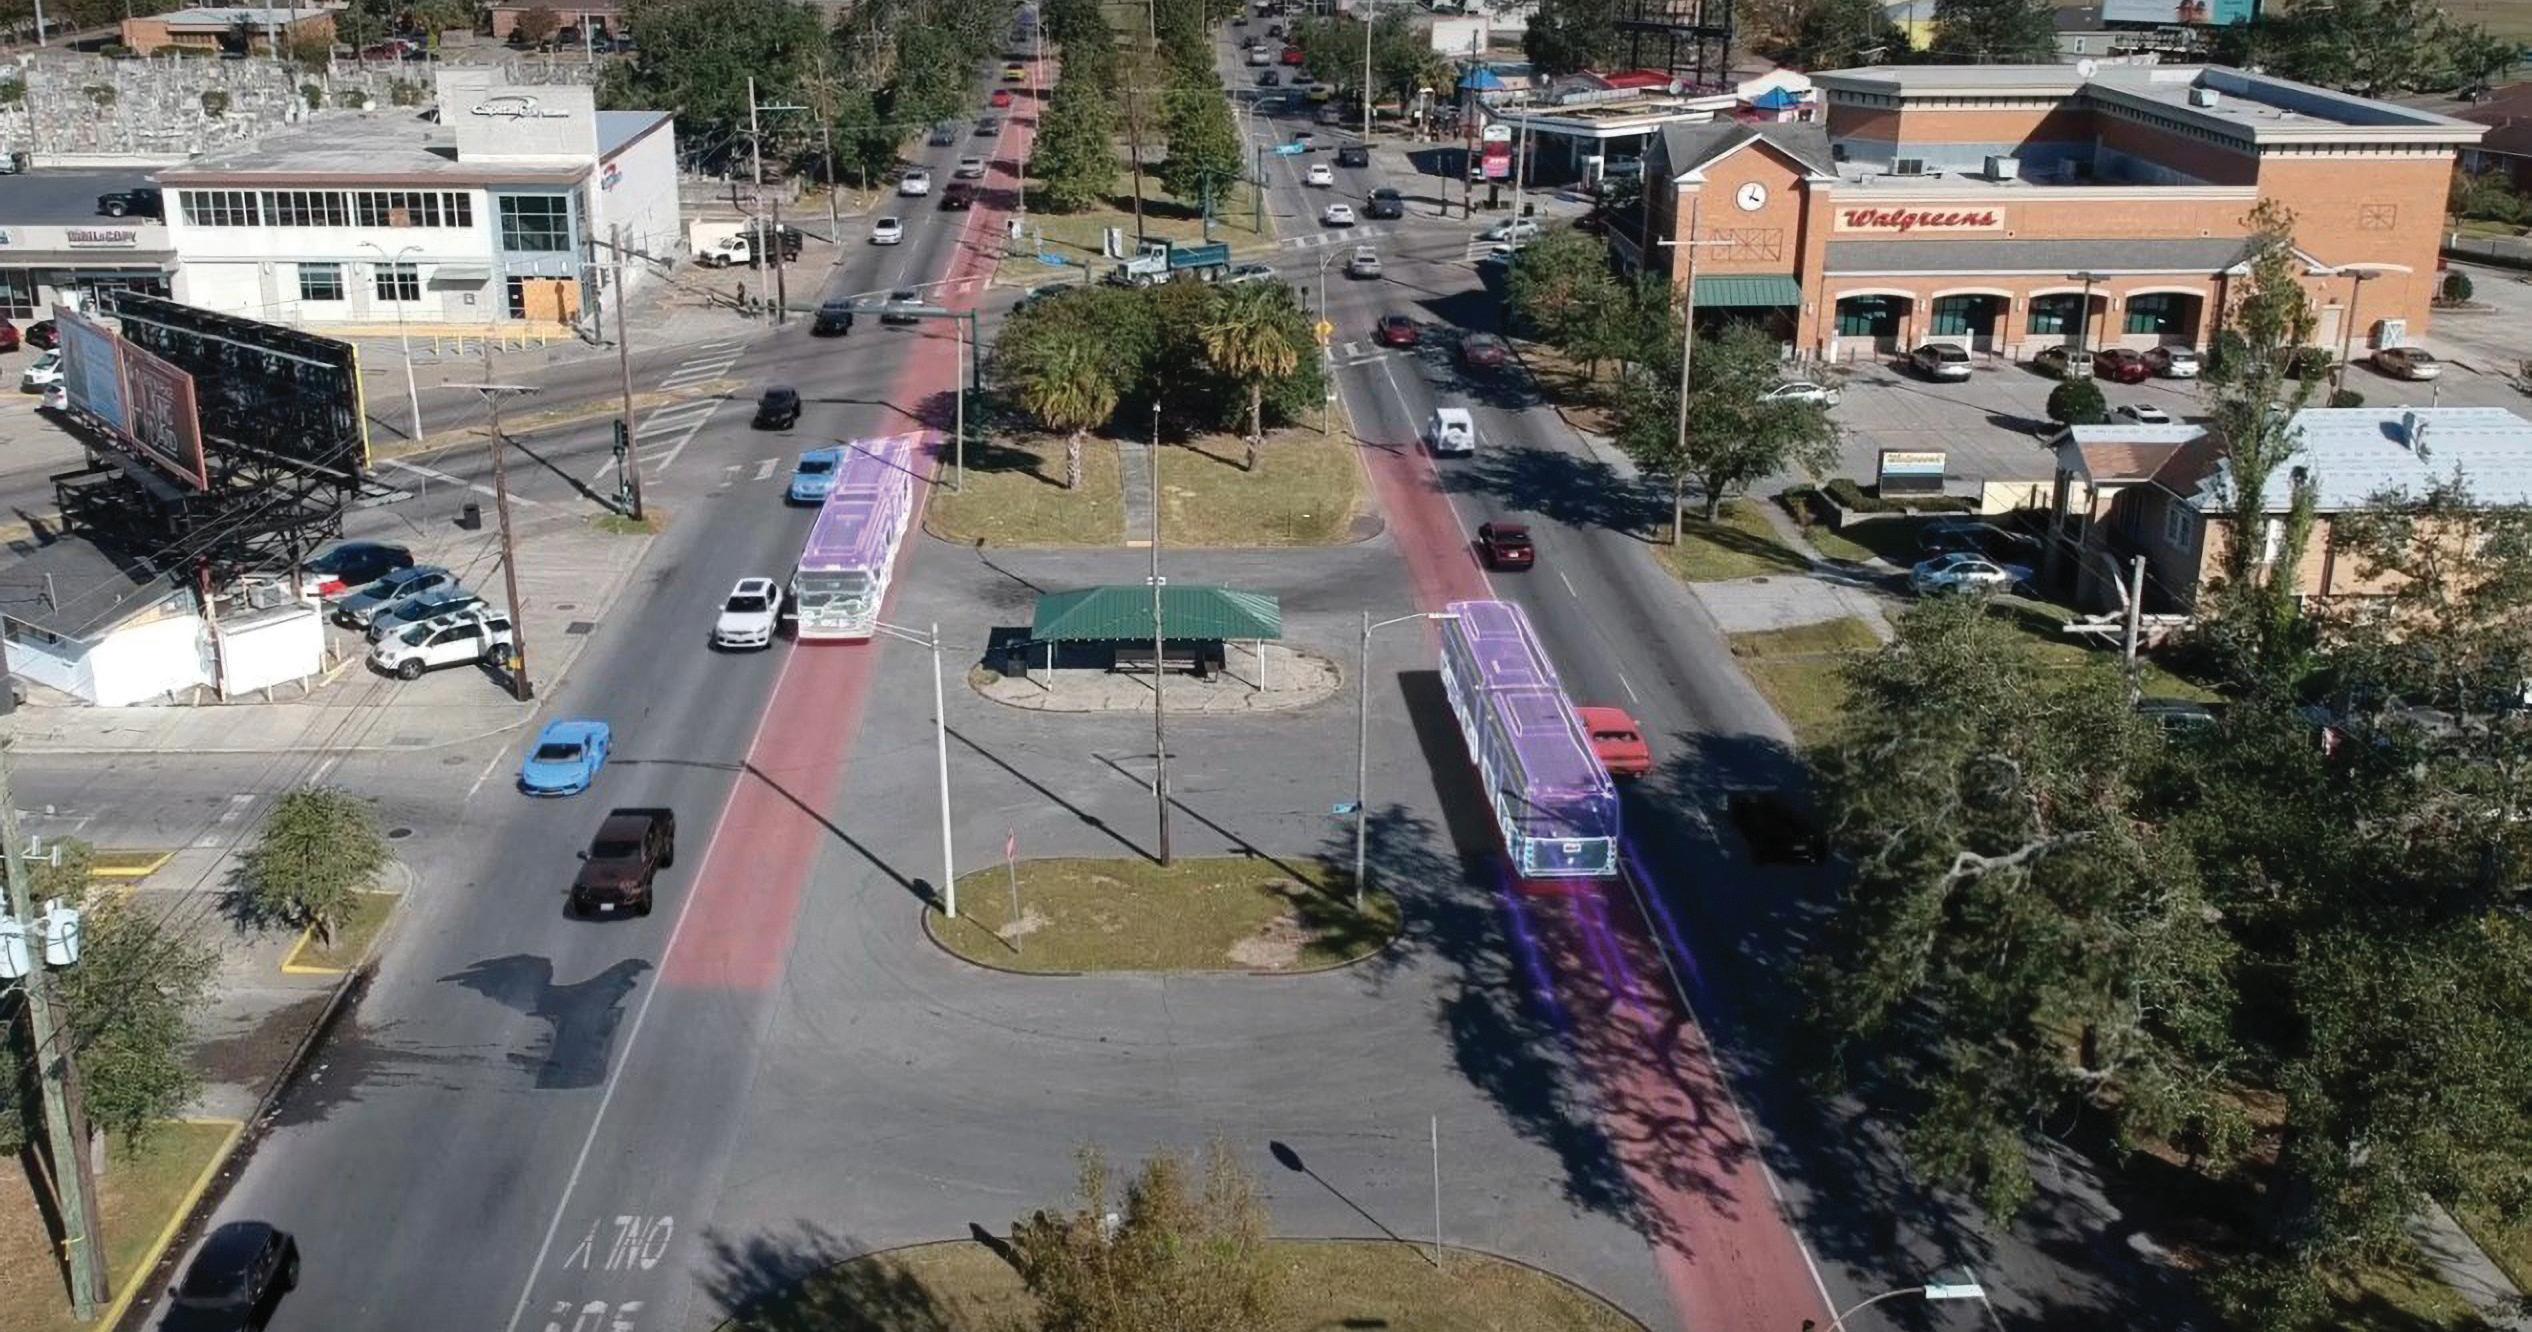
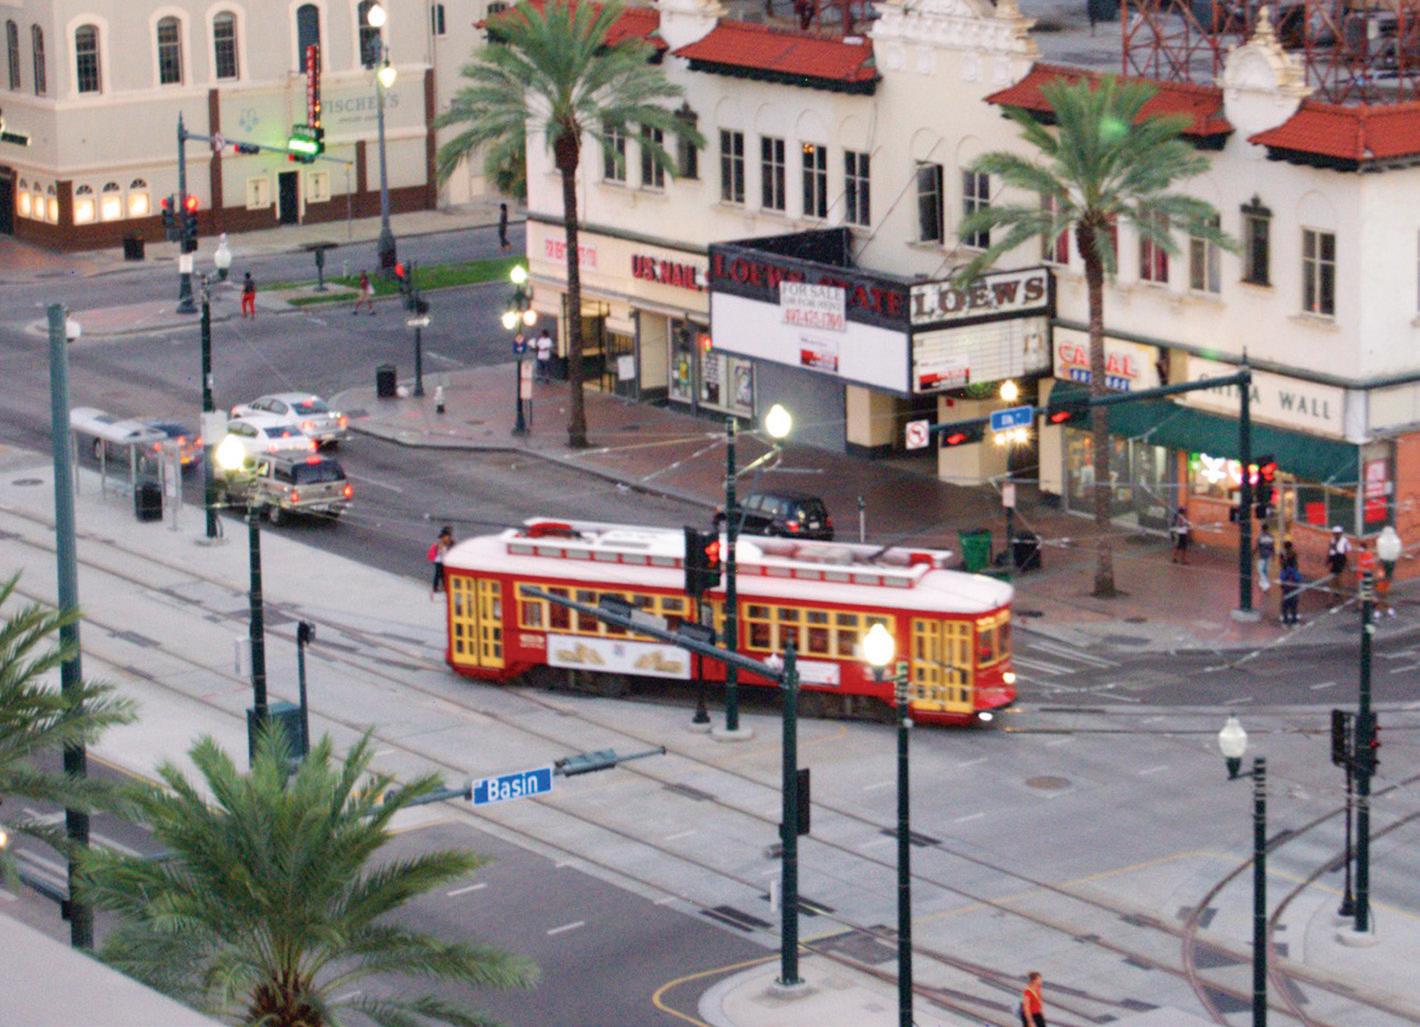
In March, the New Orleans City Council unanimously supported the Regional Transit Authority’s (RTA) Bus Rapid Transit (BRT) plans for a rapid bus line connecting New Orleans East to Algiers. They approved the general corridor for the route running from Read Boulevard, through the CBD, and over the Crescent City Connection. With City Council approval, the RTA plans to request federal funding for half of the costs to the U.S. Department of Transportation.
BRT service will operate like rail service but utilize buses to keep costs down and will enable them to begin providing the service more quickly to the region’s residents. Over 70,000 people live along the proposed corridor, with over 18,000 regularly depending on public transit. In addition to providing enhanced public transit options, the project will also include beautification along the corridors, which can result in renewed investment all along the transit corridor, attracting businesses, residential development, and other neighborhood amenities.
29% STREETCAR AND BUS RIDER TRIPS ORIGINATE IN THE CBD
Source: RTA
16,692
AVERAGE PELICAN GAME ATTENDANCE FOR THE 2023 SEASON
Source: ESPN

6TH LARGEST CRUISE PORT TERMINAL IN THE US
Source: Port NOLA
“The Port of New Orleans said it set a passenger record in March 2023 for oceangoing and river cruises, topping pre-pandemic levels with 155,225 passenger movements and 39 cruise vessel calls for the month. The port’s previous monthly high was set in February 2020 — notably, right before the beginning of the pandemic — with 154,409 passenger movements and 31 vessel calls. The port said it had been on track to meet a record 1.4 million passenger movements in 2020. Now, it’s on pace to welcome a record number of annual passengers in fiscal year 2023.”
— NOLA.COM
Enhace safety measures
Support Regional Transit Authority infrastructure
Expand sidewalk repair efforts and enforcement
The DDD has entered into a Cooperative Endeavor Agreement with the City of New Orleans to fund the employment of a Code Enforcement Agent and Title Inspector dedicated to Downtown. Reporting to the City’s Director of Code Enforcement, the the new Code Enforcement personnel will primarily focus on qualityof-life issues such as sidewalk maintenance to enhance pedestrian mobility. Citizens wanting to learn more about maintaining code violations can go to: downtownnola.com/codeenforcement.
Source: Placer.ai
Given higher interest rates and downtrending demand, growth within the multi-family market remained slow and unchanged from last quarter.
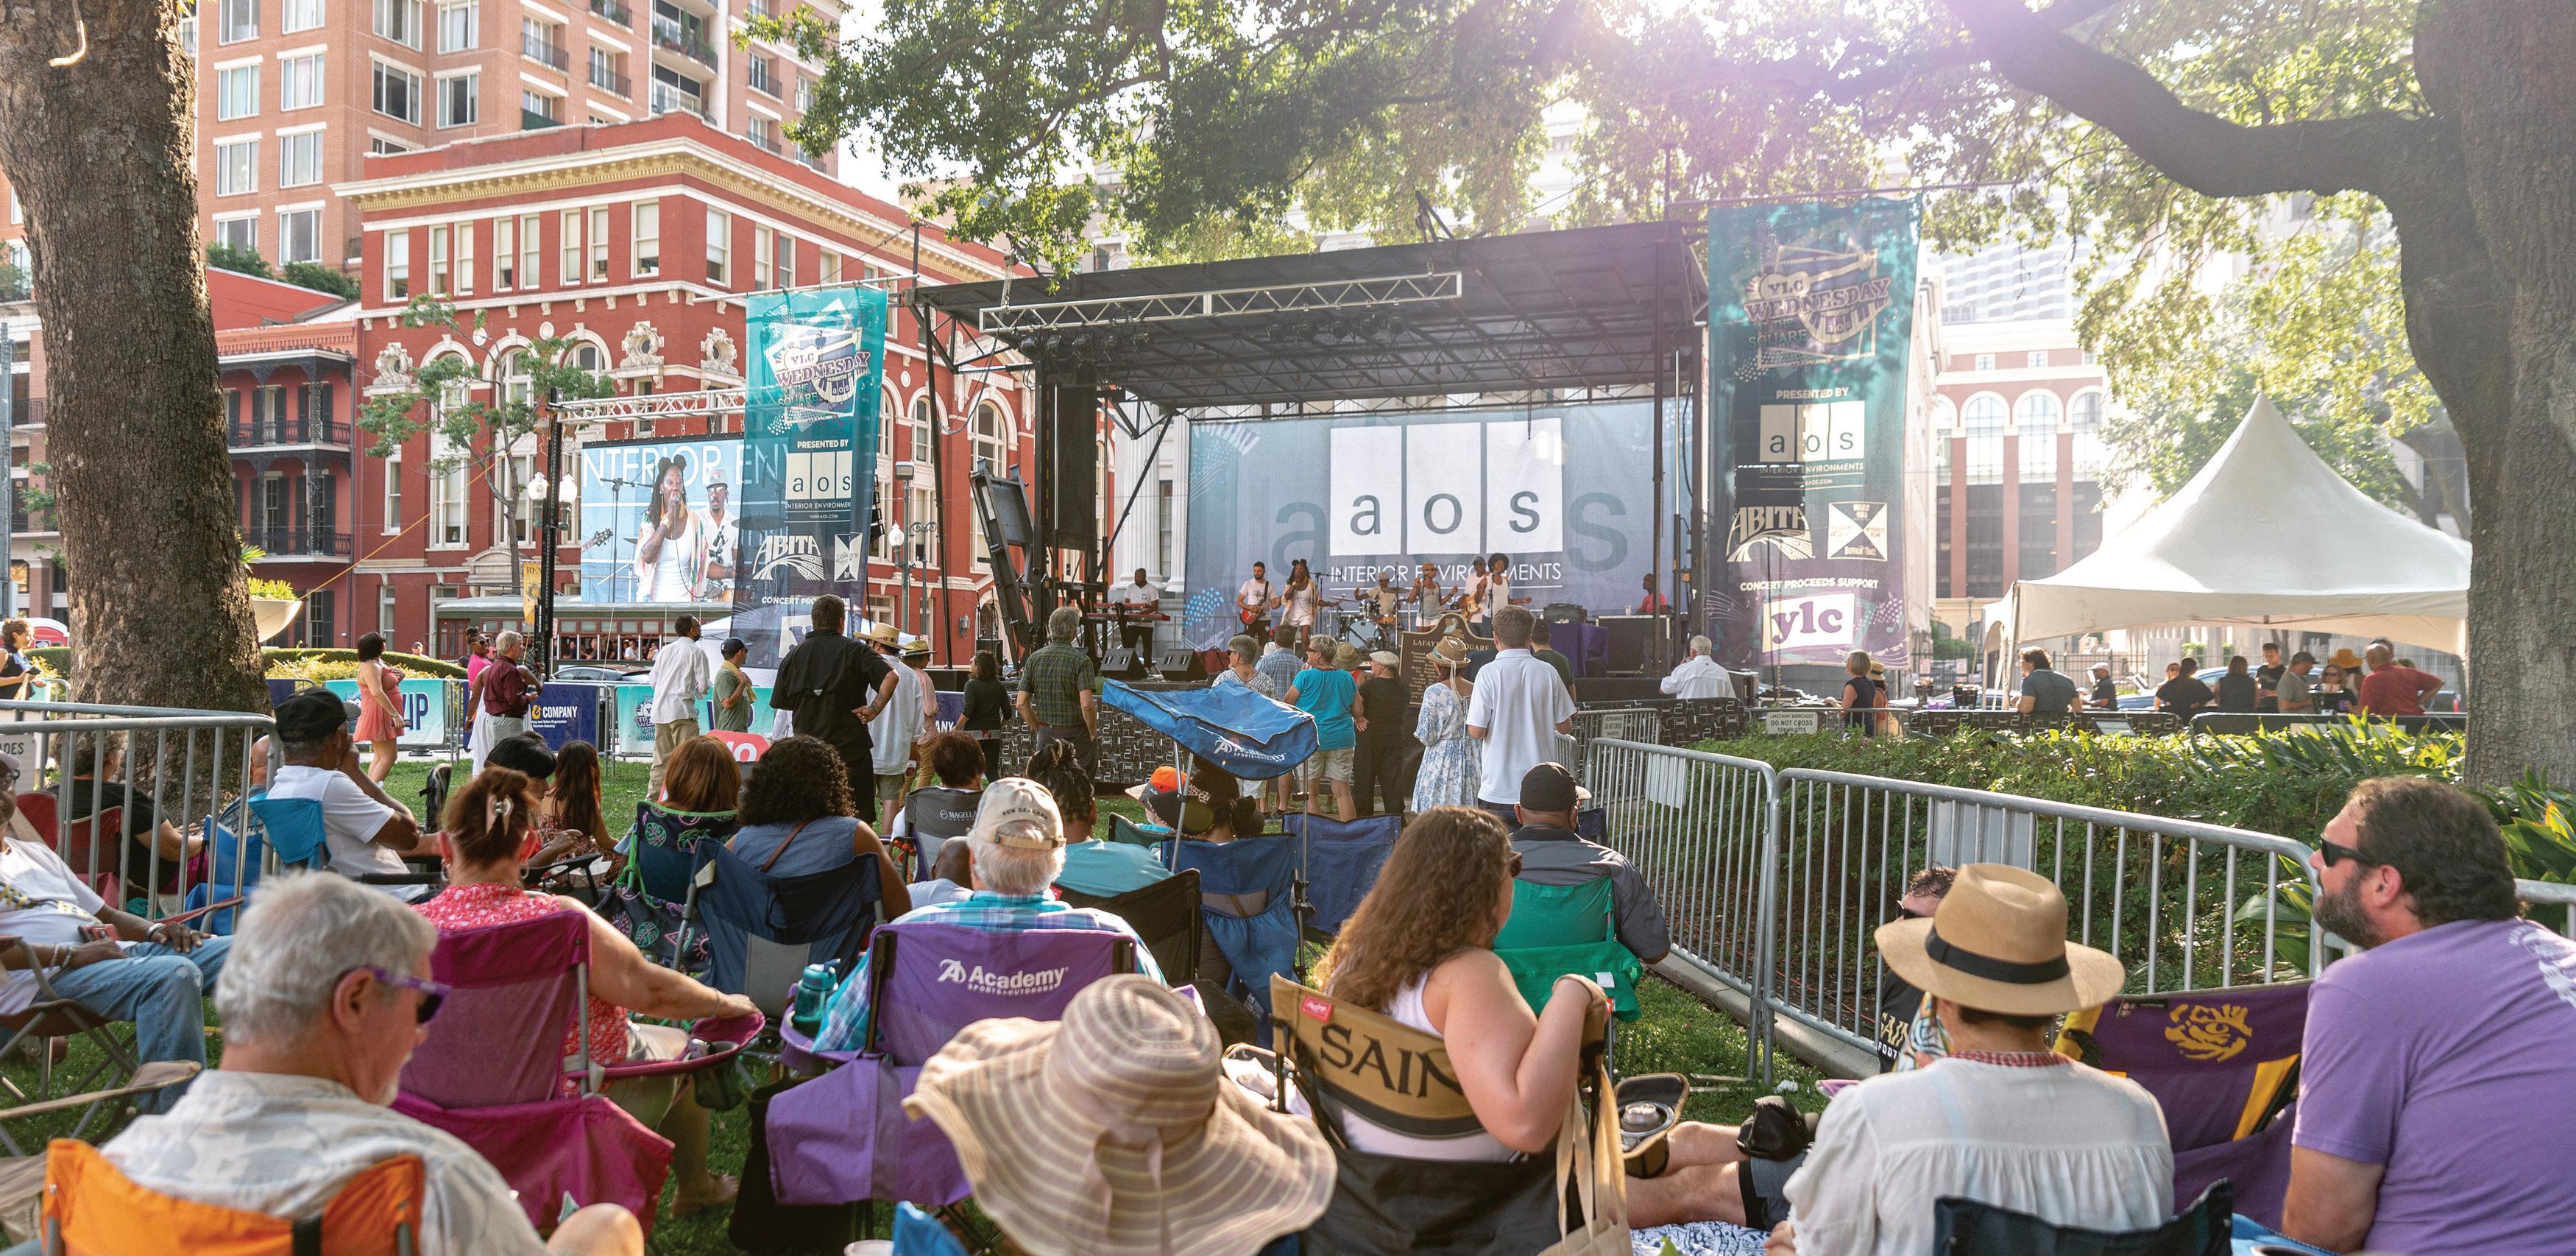
To get a better grasp on the market in New Orleans, we spoke with a more than 30-year veteran in the space, Larry Schedler, who gave some insight into the multi-family market. He stated that public-private partnerships will drive investment in Downtown, and when the pot is sweetened by historical tax credits, opportunity zone financing, and attractive spacemaking, Downtown New Orleans can obtain that “neighborhood” feel that draws people to a region. He cited the return of Wednesday at the Square as one of the big draws for him as a Downtown business owner to stick around after getting off work in the evening.
Recently listed for sale, Plaza Tower (1001 Howard) and Hancock Whitney Building (228
St Charles) present intriguing prospects for Opportunity Zone adaptive reuse with significant interest in both properties.
The latest data on the New Orleans multifamily market reveals a positive trend in both occupancy rates and the average sale price per unit. According to the data, the occupancy rate has increased quarter-over-quarter, indicating a strong demand for multifamily properties in the area. Additionally, the average sale price per unit has also increased over the same period, which suggests a healthy market with rising property values. These findings are especially noteworthy given the challenges posed by the ongoing pandemic, which have impacted real estate markets across the country. Despite these challenges, the New Orleans multifamily market is showing resilience and appears to be on a path towards sustained growth.
Promote and support adaptive re-use of underutilized buildings
Accelerate Canal Street Upper Floors Redevelopment Strategy
Develop new financial programs to accelerate opportunities for mixed income and affordable housing
Activate open space and parks programs (music,
Joining downtowns across the country, DDD advocates for the passage of the Revitalizing Downtowns Act, which would create a 20% tax credit for expenses to convert office buildings to residential, commercial, or mixed-use properties. Qualifying residential conversion would be required to incorporate affordable housing.
The DDD is defined by four boundaries: Claiborne to the Mississippi River and Iberville to the Pontchartrain Expressway. Within these boundaries, we can examine population characteristics of our district such as age, income, and other demographics.
As the DDD draws visitors and workers from areas beyond its boundaries, it is necessary to provide stakeholders with trade area analysis. This helps determine the potential demand for development opportunities that guide decisions about the types of business, services, and design that best serve Downtown New Orleans.
• NEW ORLEANS ENTREPRENEUR WEEK (3/27-4/1) - 338K
• WEDNESDAY AT THE SQUARE (3 WEDNESDAYS IN Q1) - 250K VISITORS
• DOWNTOWN IRISH CLUB PARADE (3/17) - 124K VISITORS
• ITALIAN-AMERICAN SAINT JOSEPH’S PARADE (3/25) - 131K VISITORS

Single Race Other
The challenges with Downtown office vacancies reflects a national trend for which few cities have remedies.
But there are bright spots as in the case of Stirling Properties, LLC, the owner of the Pan American Life Center at 601 Poydras. The newly renovated Class A office building was reimagined with open concepts that feature alternative style spec spaces to entice workers to want to come back to the office, even if just partially.
“The logistics of getting to the office are a challenge with people that are used to working from home, so we have to remove the red tape and provide these individuals with incentives to come spend time in the office” - Grady Brame | Executive Vice President / Partner of Stirling Properties, LLC
As Brame also noted, their offices in Baton Rouge, Covington, and Lafayette have been a bit more successful due in part to proximity to suburban locations, open and free parking, and ease of access.
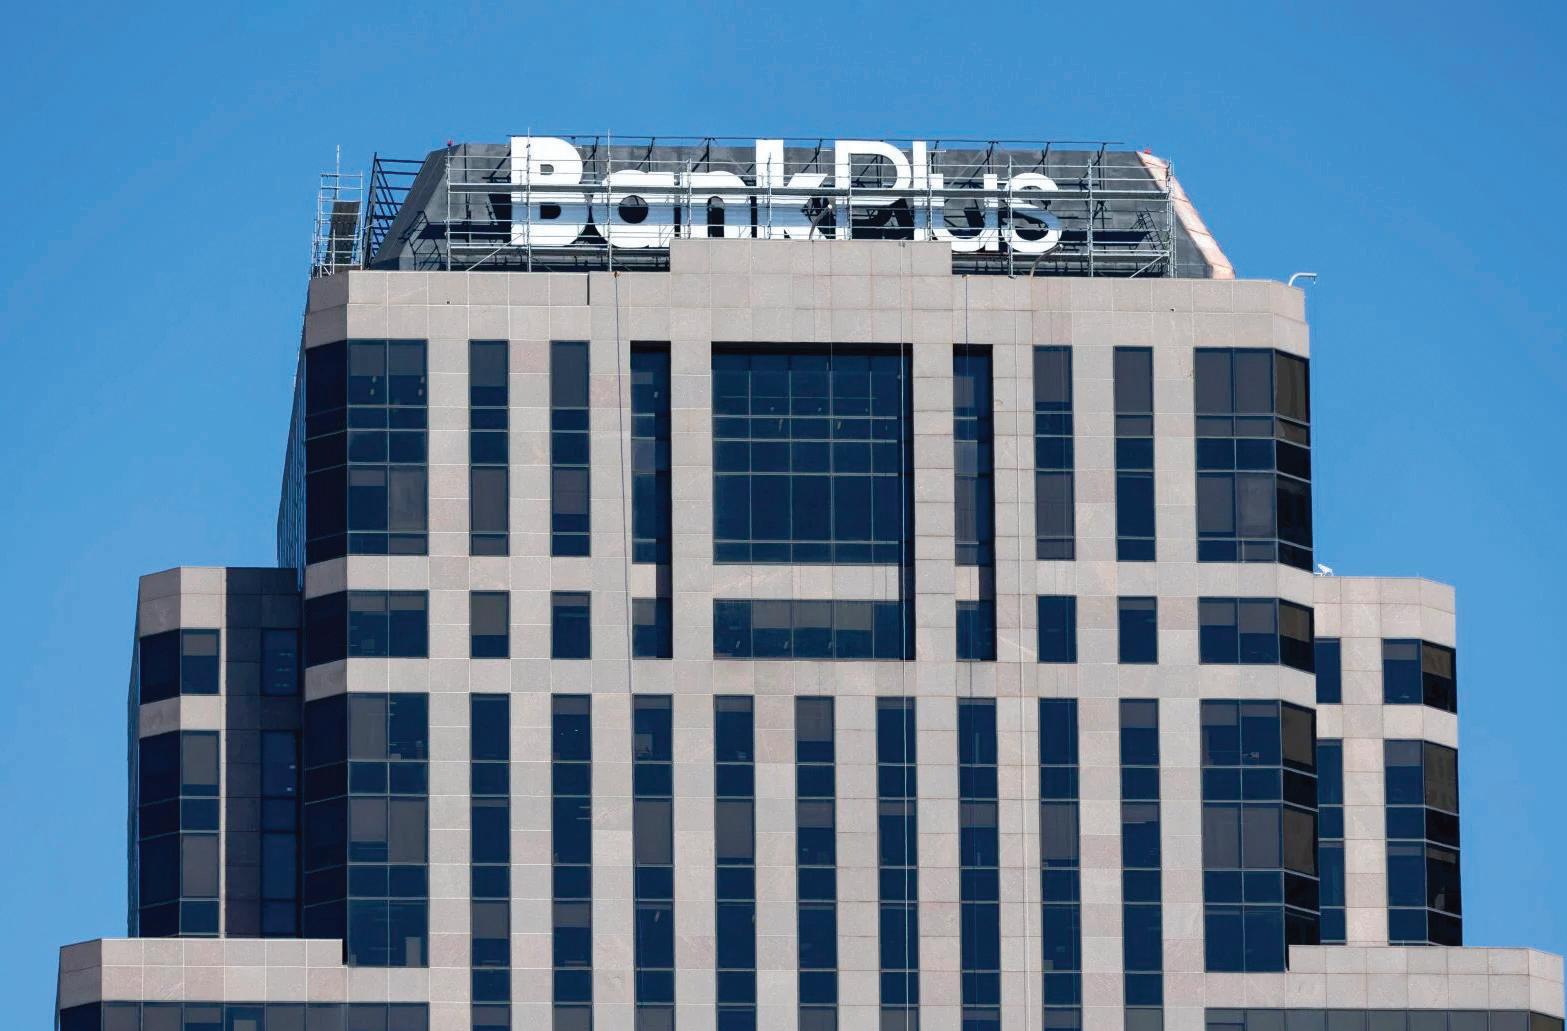
The Downtown New Orleans building at 909 Poydras Street was renamed Bank Plus Tower on Monday, January 23, 2023. BankPlus secured the naming rights after acquiring FB&T and acquiring the ground floor branch and 17th floor office space.
Notable office openings in Q1 include Grace Hebert Curtis Architects, who moved into 601 Poydras St to accommodate their growing company. Big Fish Gaming expanded their new talent hub, now located at The Shop coworking space in the Contemporary Art Center at 900 Camp St. United Utility moved into over 10,000 square feet of office space at 909 Poydras St to establish their national headquarters in New Orleans.
Arts, Entertainment & Recreation
Accommodation
Food Services & Drinking Places
Public Administration
Educational Services
Administrative & Support / Waste Management & Remediation
Real Estate, Rental and Leasing
Finance
Retai
Other
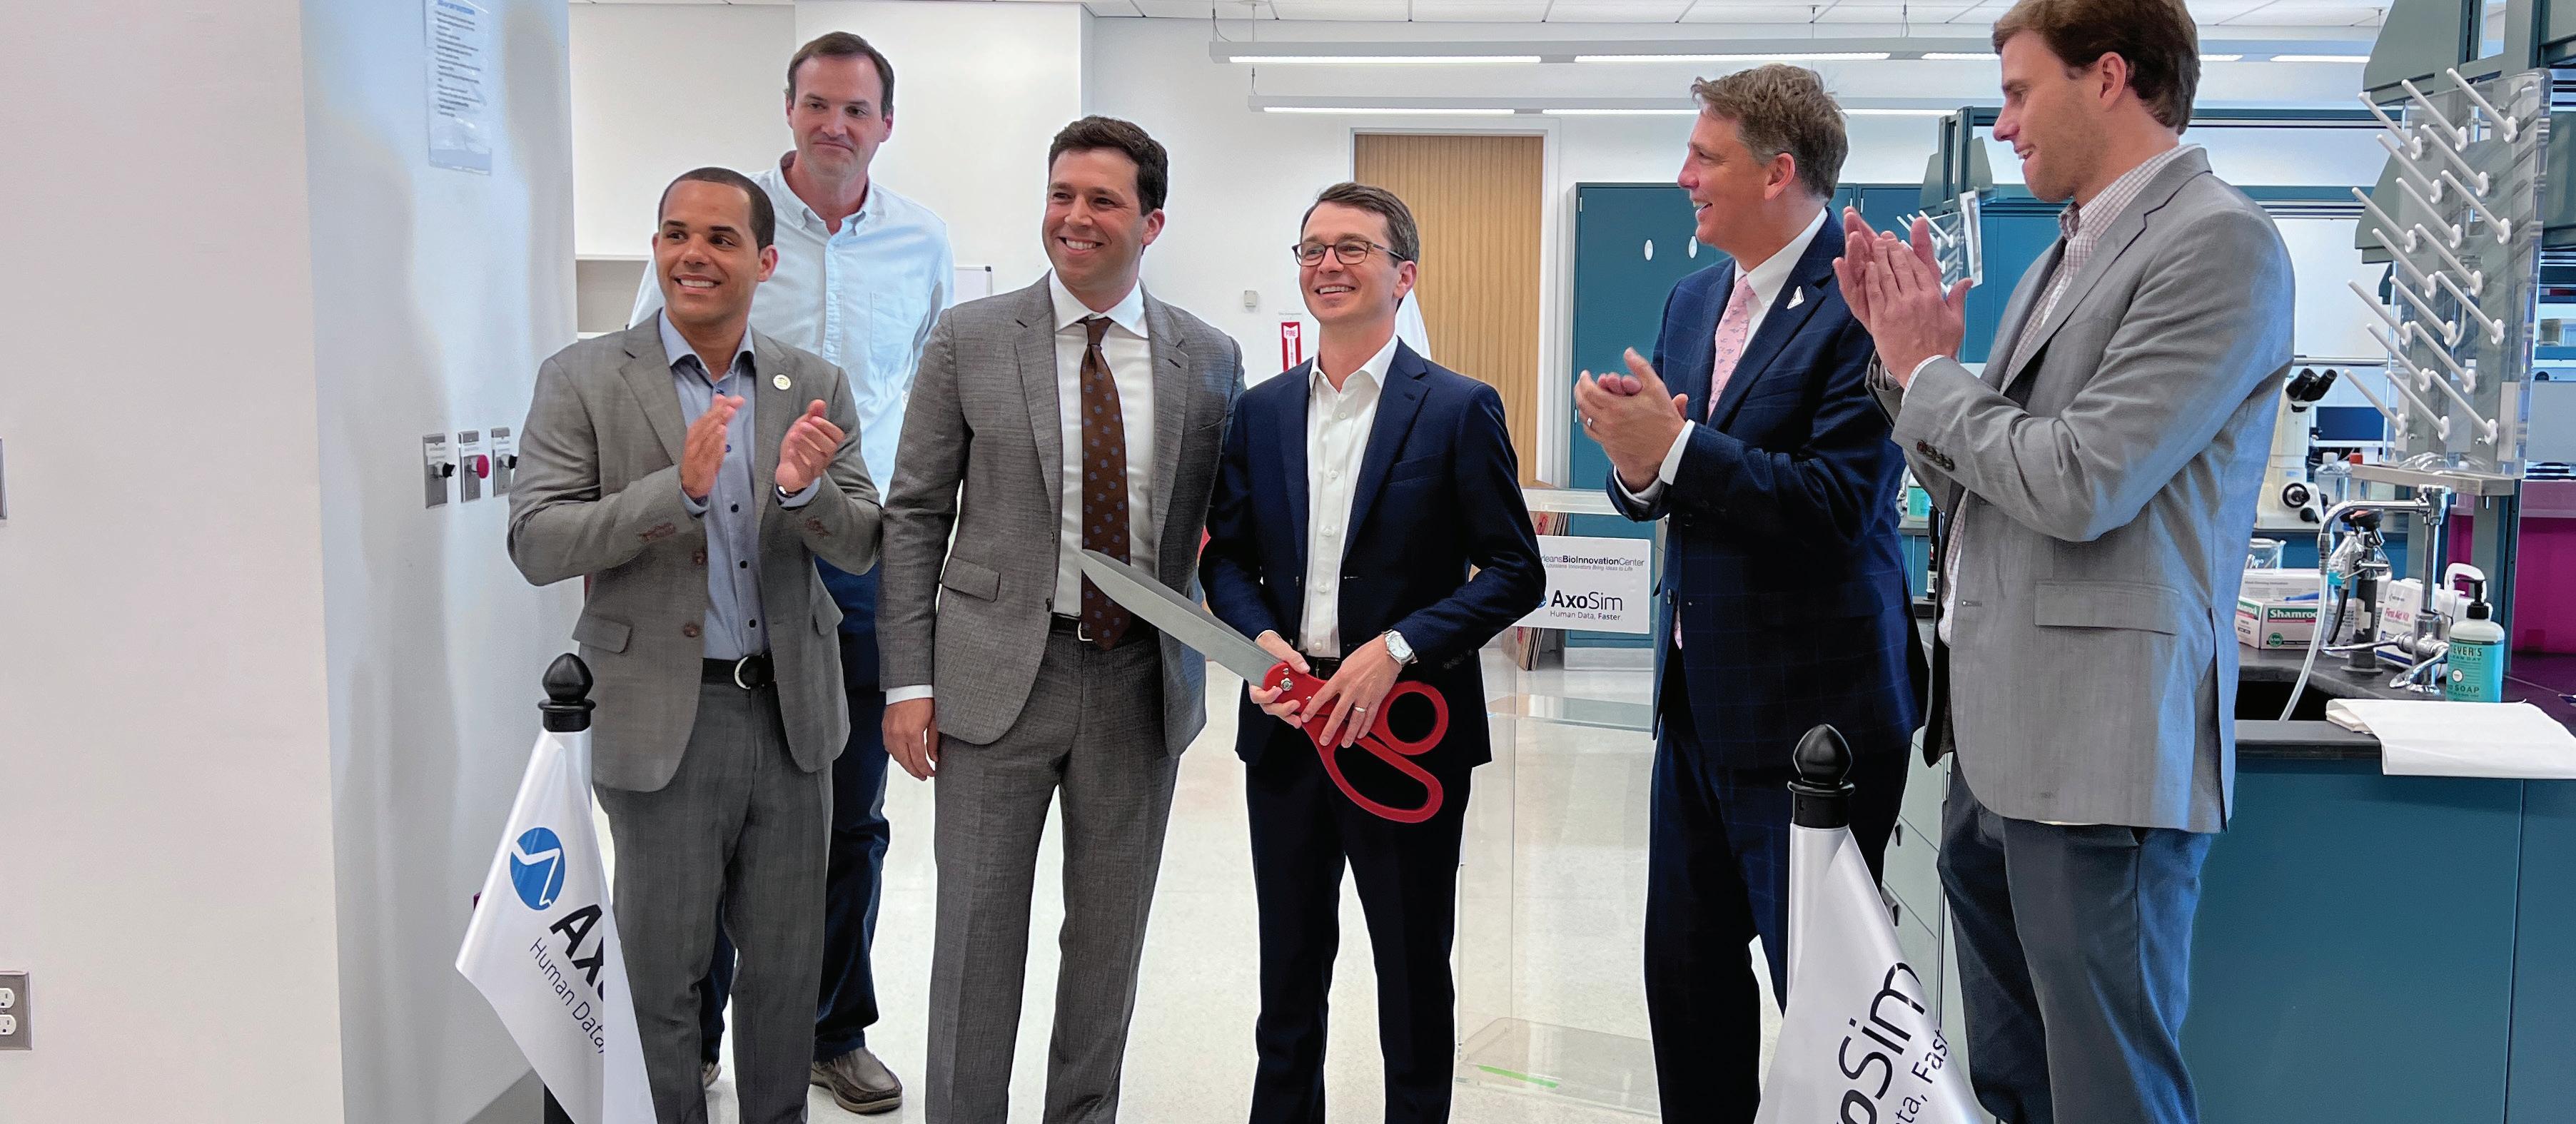
“When our most promising startups raise private capital and grow locally, it moves our community one step closer to building a sustainable life science entrepreneurship ecosystem. In turn, this creates more high-paying specialized jobs in the region, keeping our brightest students and recruiting the best biotech and business talent to New Orleans.”
Increase business retention visits
Explore the reuse of commercial space to fit new work environments
Expand public space programming
Launch Downtown stormwater mitigation upgrades
Foster partnerships to increase industry diversity
The Economic Development team continues to reach out to Class A and Class B office managers to foster a healthy feedback loop
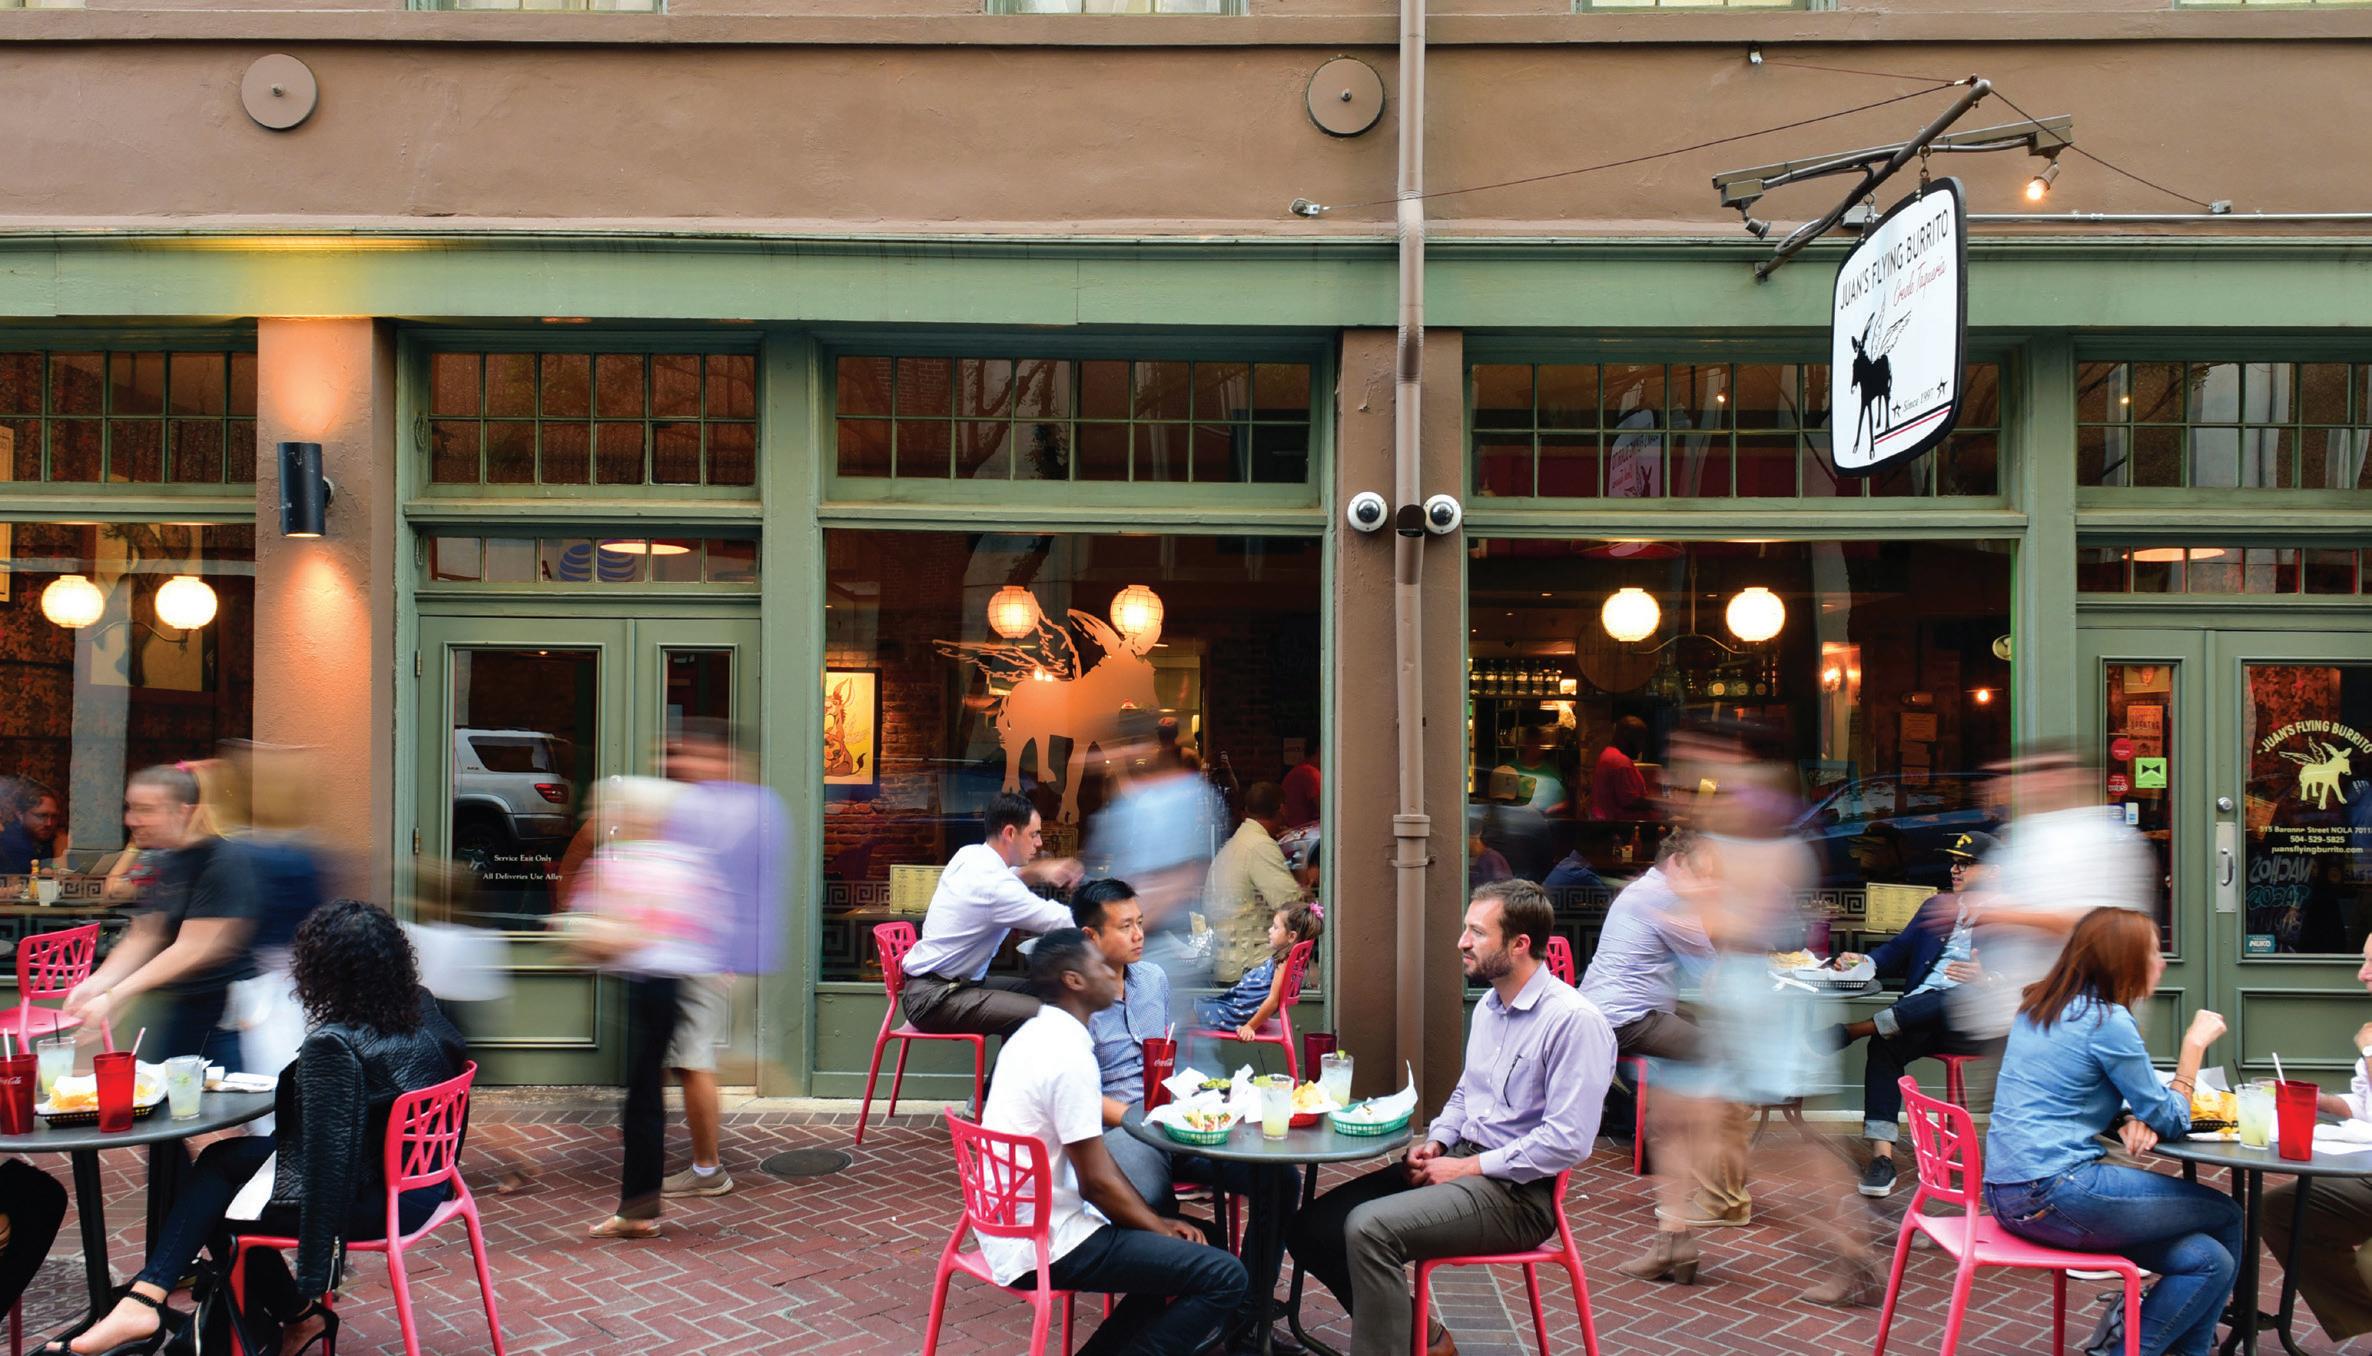
The retail market in New Orleans reports a 14.6% vacancy rate, an increase from 10.3% the year prior. It’s worth noting that rents have increased 13.45%, reflecting national trends. Retail chains saw a minor increase in foot traffic during the 2022 Q4 holiday season. However, this trend has leveled out in the current quarter, leading to an approximate 69% “retail chain recovery rate” from Covid-19 in both Q1 2022 and Q1 2023.
A diversity of DDD retailers have fully recovered to prepandemic levels, such as fitness-based retailers and leisurebased retailers with others such as shops, service, and dining recovering at slower rates.
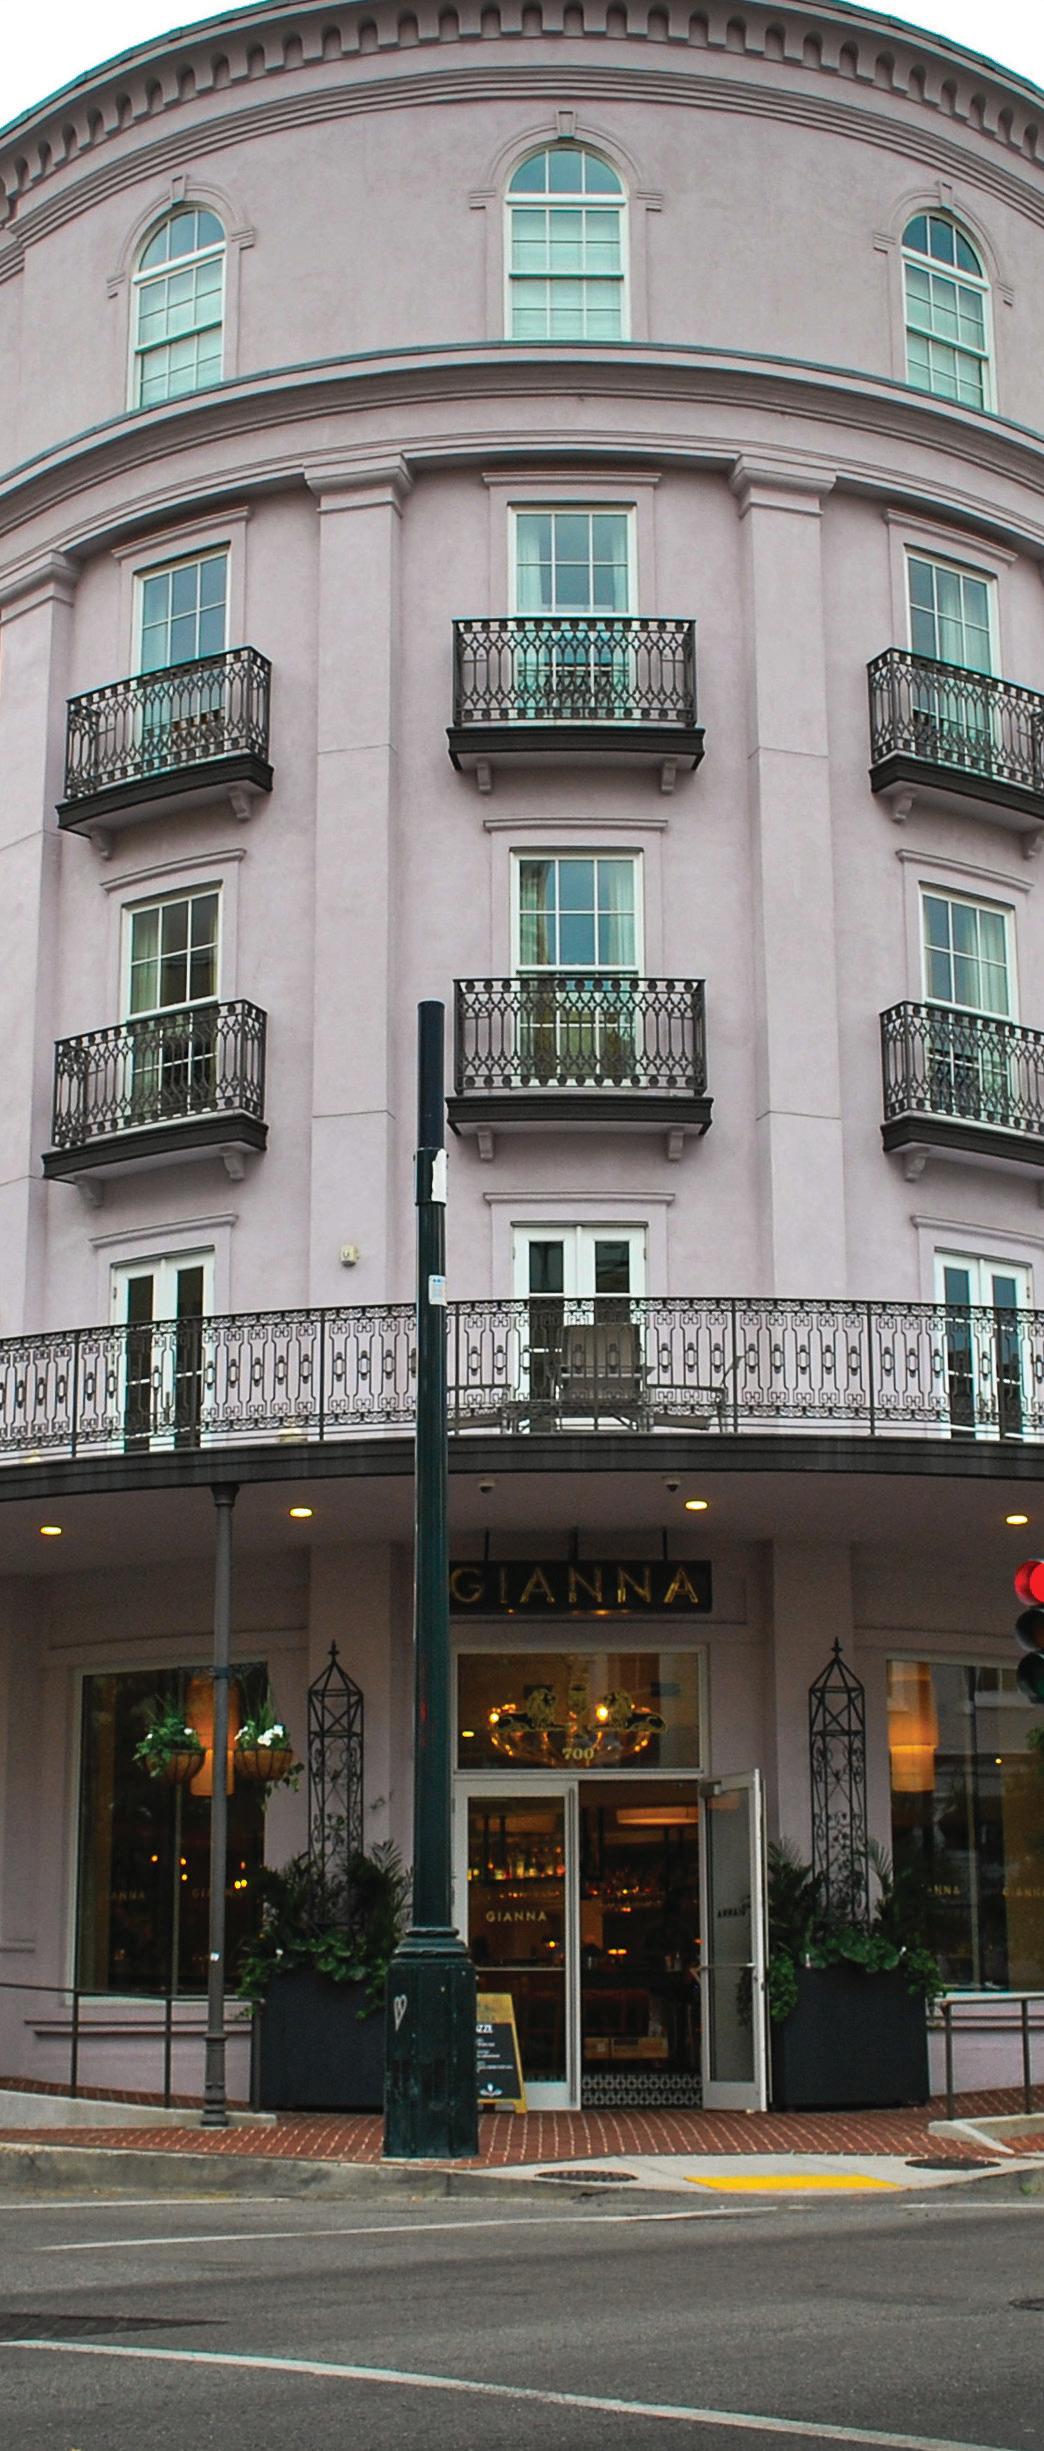
In fact, Q1 2023 saw the opening of a food hall at Caesars New Orleans featuring culinary concepts from Celebrity Chefs Bobby Flay, Cake Boss Buddy Valastro and New Orleans’ Nina Compton, five restaurants, two bar/lounges, two personal service establishments, and a coffee lounge just in time for carnival season.
Source:
Source:
Nostalgia NOLA, 125 Camp St King, 521 Tchoupitoulas St
Harrahs Food Hall- Bobby’s Burgers, PizzaCake, Nina’s Creole Cottage, 8 Canal St
Swoop’s NOLA, 916 Lafayette
Brewery Saint X, 1100 Girod St. Ste 101
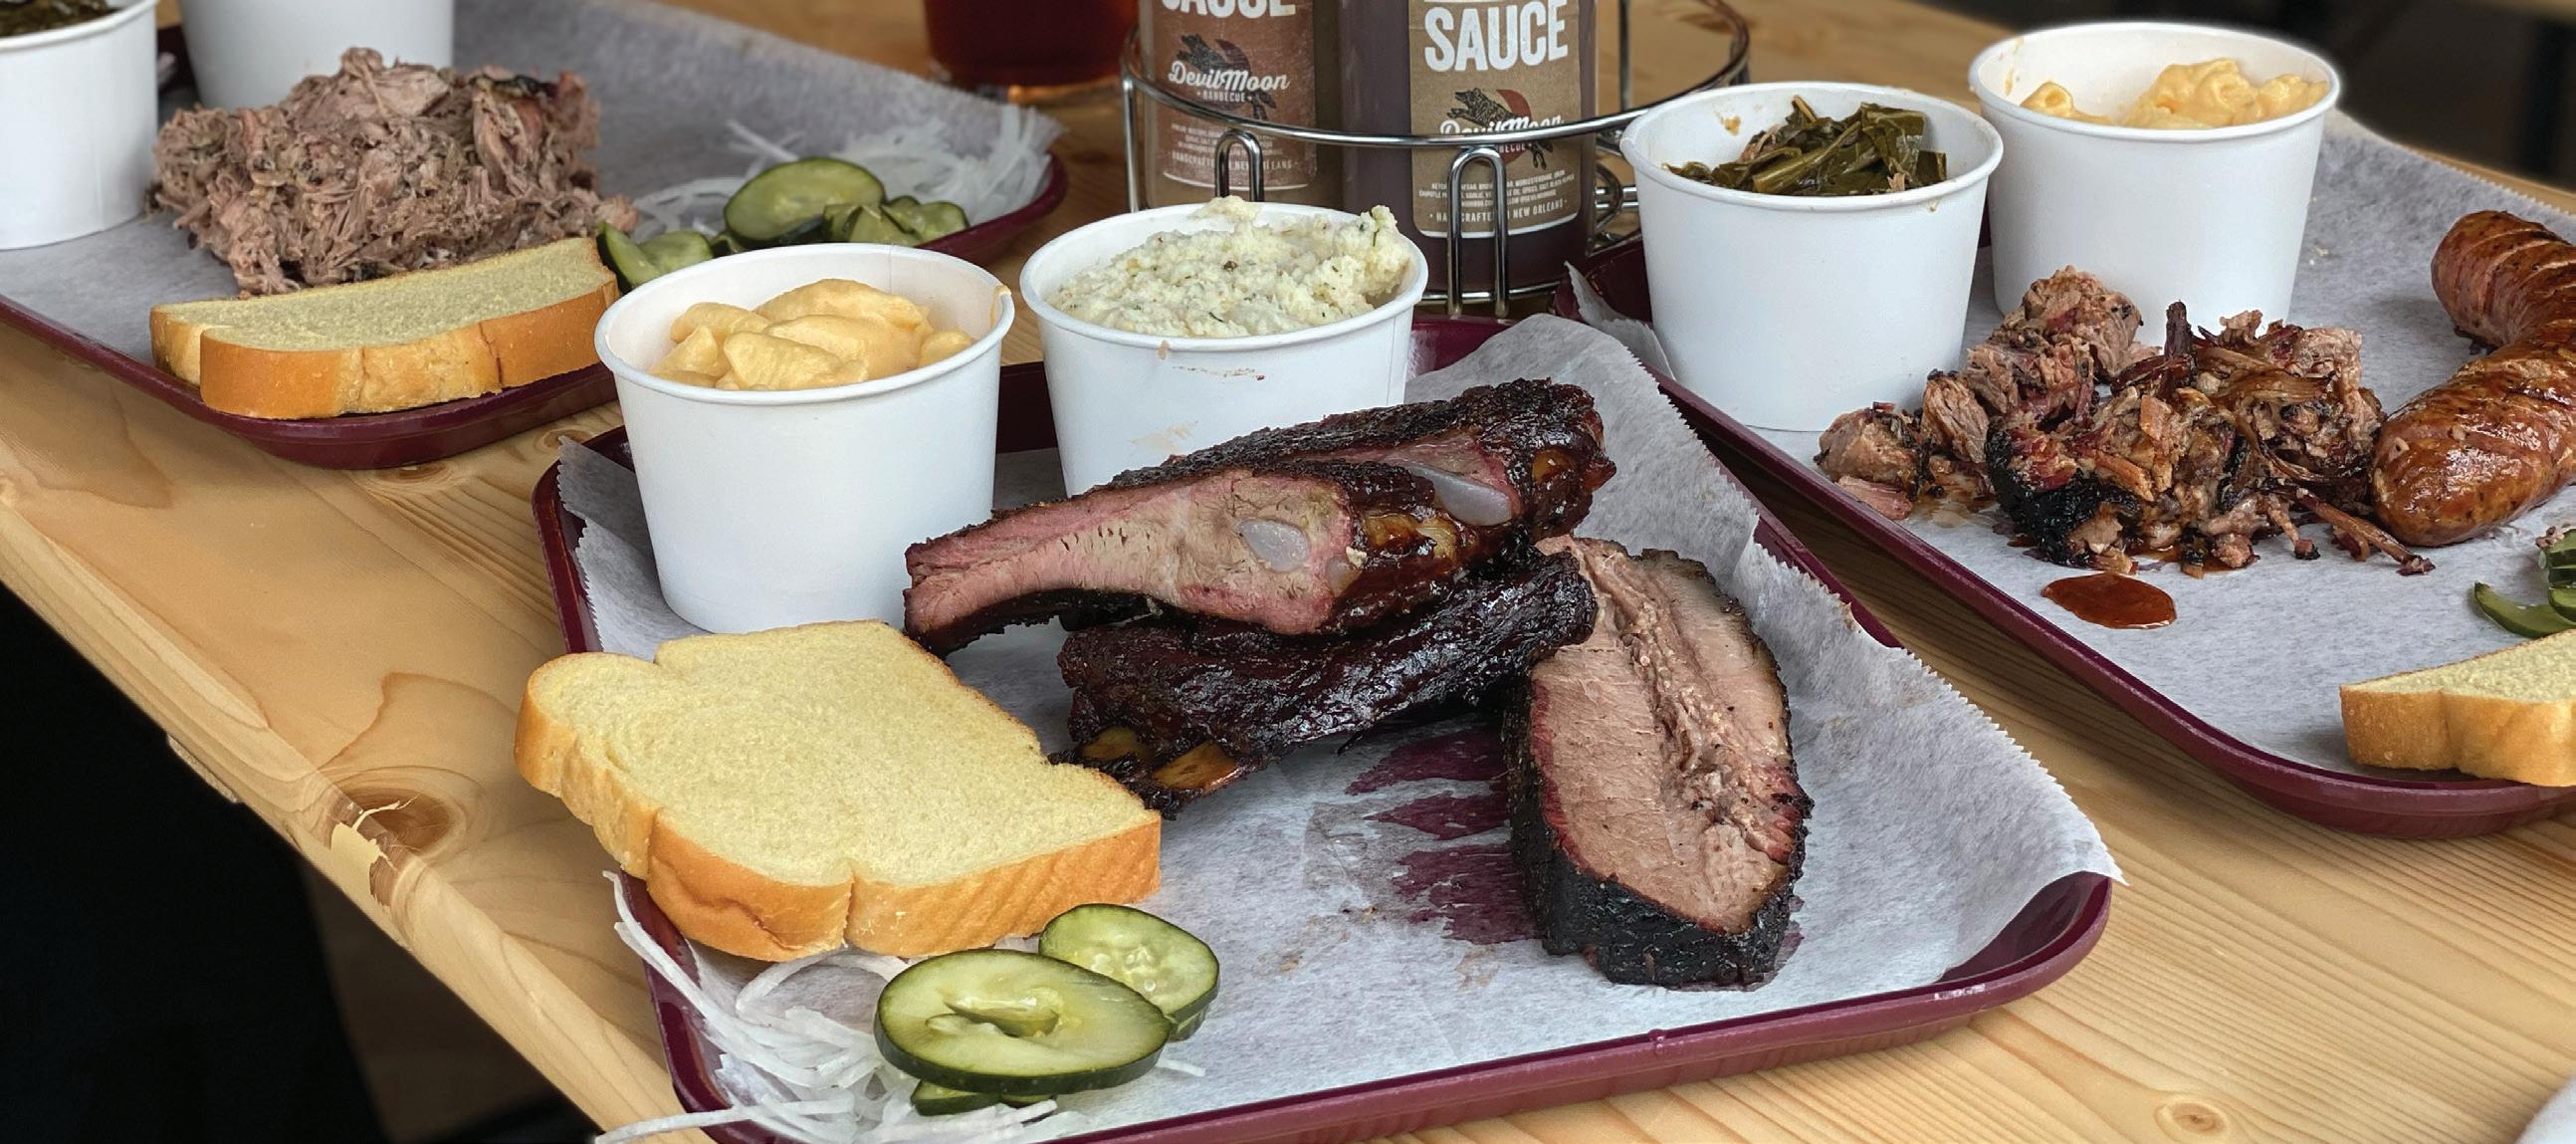
Devil Moon BBQ, 1188 Girod Street
Hype Haus Fitnesss, 730 S Rampart St
Namaste NOLA, 201 Baronne St
Chapter IV, 1301 Gravier St
Dahla, 611 O’Keefe Ave
Caesars New Orleans
Rubenstein Hotel
714 Canal Renovation
The Mayfair
420 Julia St
Vintage Rock Club / Copper Vine Expansion
306, 308 and 310 S. Rampart
Kimpton Hotel Fontenot Expansion Charity Hospital
129 Camp Street
All-Suites Hotel
Moxy Hotel
330 Baronne St
739 Convention Center Blvd
NOLA AC Hotel
611 Commerce St
955 Howard Ave
222 Loyola Ave
The National World War II Museum Inc Expansion
United Fruit Building
Hotel Perle
Lucy’s Expansion
204 St Charles Ave
934 Canal Street
516 Natchez
PRIMARY SOURCE
Downtown Development District New Orleans
SECONDARY SOURCES
HOTEL & TOURISM
DDD anyalsis of Costar Costar
New Orleans Permit Department
rggc.com
NEIGHBORHOOD MOBILITY
Louis Armstrong International Airport
DDD Analysis of Placer.ai
Placer.ai
Regional Transit Authority
WVUE/NOLA Weekend
MULTIFAMILY
CoStar
New Orleans Permit Department
MapDash, Mapdash & 2021 ACS 5-Year Estimates Data
OFFICE
CoStar
MapDash
RETAIL
CoStar
MapDash
New Orleans City Business, neworleanscitybusiness.com
The DDD would like to thank all of the following for their help and support in putting together our quarterly report.
Darren Crumpton: General Manager, The Ritz-Carlton
Larry Schedler: Larry G Schedler & Associates, Inc.
Grady Brame: Stirling Properties, Inc.
Gaines Seaman: Stirling Properties, Inc.
John Woodard: Stirling Properties, Inc.
The Times-Picayune, Nola.com Photo
City of New Orleans Department of Safety & Permits: Permit Data
Idea Village: Photos
Young Leadership Council: Photo
Ryan Gootee General Contractors: Photo
Regional Transit Authority: Data
WVUE/NOLA Weekend: Photo

Created by the Louisiana Legislature in 1974 (LA Rev Stat § 33:2740.3) as the nation’s first assessment-based Business Improvement District, The Downtown Development District of the City of New Orleans (DDD) provides enhanced economic development and public space services to Downtown New Orleans. It accomplishes its mission through initiatives such as employing dedicated City Planners to assist Downtown property and business owners, administering multiple grant programs, employing 25 Public Service Rangers and 30 Clean Team sanitation workers, and providing significant funding for outreach to the homeless, additional New Orleans Police Department patrols, and armed private security throughout its District. The DDD services the area bounded by Iberville Street, the Pontchartrain Expressway, Claiborne Avenue, and the Mississippi River.
The DDD is funded by a property tax millage of 17.12 which is assessed on each property within the district. The DDD’s lifespan was initially given a 10-year period and on December 8, 1979, a successful citywide referendum did several things for the DDD. It authorized the DDD to raise its property tax rate to as much as 22.9 mills (a privilege the DDD has never exercised); it gave the DDD the authority to sell up to $7.5 million in bonds for use in capital improvement projects; it extended the DDD’s lifespan for an additional 25 years to December 31, 2005; and it provided for a future election in which voters could extend the DDD for an additional 25 years beyond 2005. An election was held on April 7, 2001, with 60% voting in favor and the DDD’s lifespan was extended through 2030.