


CALCULATING
The International Downtown Association is the premier association of urban place managers who are shaping and activating dynamic downtown districts. Founded in 1954, IDA represents an industry of more than 2,500 place management organizations that employ 100,000 people throughout North America. Through its network of diverse practitioners, its rich body of knowledge, and its unique capacity to nurture community-building partnerships, IDA provides tools, intelligence and strategies for creating healthy and dynamic centers that anchor the wellbeing of towns, cities and regions of the world. IDA members are downtown champions who bring urban centers to life. For more information on IDA, visit downtown.org
IDA Board Chair: Kate Borders, LPM, President, University Circle Inc.
IDA President & CEO: David T. Downey, CAE, Assoc. AIA, IOM
The IDA Research Committee is composed of industry experts who help IDA align strategic goals and top issues to produce high-quality research products informing both IDA members and the place management industry. Chaired and led by IDA Board members, the Research Committee advances the work set forth in the IDA research agenda by publishing best practices and case studies on top issues facing urban districts, establishing data standards to calculate the value of center cities, and furthering industry benchmarking.
IDA Director of Research: Cathy Lin, AICP
IDA Research Manager: Clay Daneker
International Downtown Association 1275 K Street NW, Suite 1000 Washington, DC 20005
202.393.6801
downtown.org
© 2024 International Downtown Association, All Rights Reserved. No part of this publication may be reproduced or transmitted in any form—print, electronic, or otherwise—without the express written permission of IDA.
IDA would like to thank the following individuals for their efforts on the 2024 edition of this project:
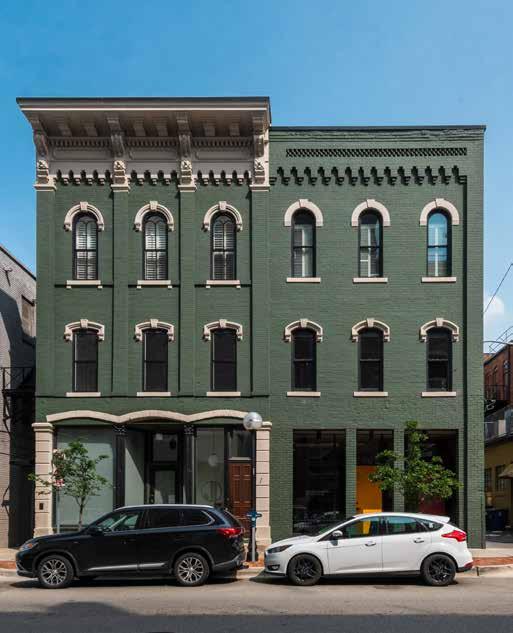
Chicago Loop
Michael Edwards
Ariella Gibson
Alek Jaunzemis
Jad Salloum
Colorado Springs
Susan Edmondson
Chelsea Gondeck
Austin Wilson-Bradley
Dallas
Jennifer Scripps
Scott Goldstein
Doug Prude
Evan Sheets
Nikia Summerlin
Amy Tharp
Hartford
Jordan Polon
Tim Moore
New Orleans
Davon Barbour
Tyler Correa
Meaghan Nguyen
Rene Pastorek
University Circle
Kate Borders
Matt Provolt
Cameron Roberts
Elise Yablonsky


Strong downtowns are at the heart of any successful city or region. Their density brings people, firms, and ideas together in ways that grow the economy, create new opportunities, and form the basis of a community identity. As urbanist Richard Florida describes, “downtowns today are not just places to live, work and shop: They are the very best places for people and businesses to connect to each other. In big metros and small, downtowns occupy the most central locations and have the highest concentrations of spaces where people can come together.”
Downtowns spent decades orienting themselves around an office commuter population, however the continuing prevalence of hybrid and remote work makes it unlikely that those workers will ever return in the same numbers. In a post-COVID-19 world, downtowns everywhere will doubtless remain a critical part of their cities ecosystems, but they will need to adapt and change – as they have done before.
This study has found that many downtowns were already experiencing rapid residential growth in the 2000s and 2010s, with the median downtown growing by 24% in population from 2010 to 2022 as the plethora of amenities on offer in
downtowns generated renewed interest in urban living. The COVID-19 pandemic only heightened interest in walkable and mixed-use environments with ample public spaces, and it is altogether likely that trend of downtown population growth will continue as downtowns continue to adapt towards being well-rounded live-work-play communities rather than just central business districts; Downtowns Rebound: The Data Driven Path to Recovery found the median downtown population is 11% above pre-pandemic levels as of 2023.1 While the coming years will bring many changes to downtowns across the country, their resilience and strength positions them to maintain their importance and continue leading the growth of their cities and regions.
Despite a relatively small share of a city’s overall geography, a downtown delivers significant economic and community benefits across both the city and region. Downtown serves as the epicenter of commerce, capital investment, diversity, public discourse, socialization, knowledge, and innovation. In short, the proximity and density that downtown and center cities create are the engines which drive the city around them to thrive.

Building on IDA’s unique industry-wide perspective and expertise, this study quantifies the value of U.S. downtowns and center cities across more than 150 metrics organized under five core value principles, with a focus on how downtowns contribute to the city and region around them. The Value of U.S. Downtowns and Center Cities study is a partnership between IDA and local urban place management organization (UPMO).
The Value of U.S. Downtowns and Center Cities research articulates the inherent value a downtown provides to the greater city, highlighting a district’s contributions based upon 150+ key data points in the principles of Economy, Inclusion, Vibrancy, Identity and Resilience. Our most recent data showed that study downtowns outpaced their cities in residential growth between 2000 and 2022, growing an average of 54% against the citywide average of 13%.
The primary project goals are to:
Provide a common set of metrics to communicate the value of downtown.
Expand the range of arguments UPMOs* can make to their stakeholders using publicly available data.
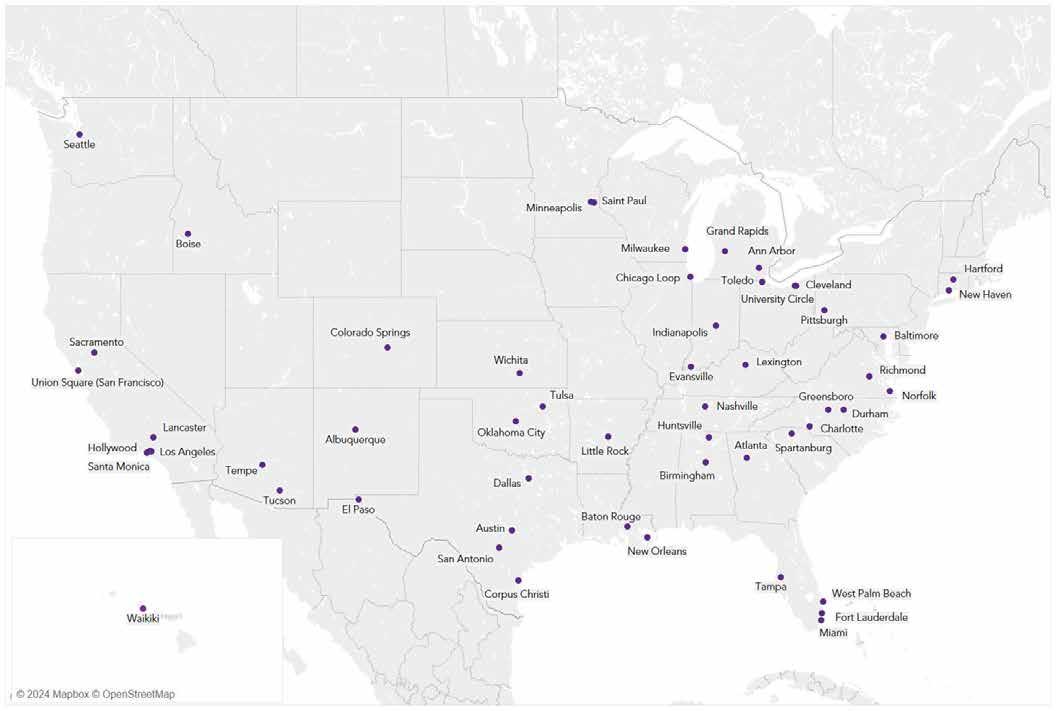
IDA began this research in 2017, working with Stantec’s Urban Places group and the first cohort of 13 UPMOs to develop a methodology for compiling and evaluating data from those 13 downtowns. In 2024, our analysis has expanded to include 54 downtowns and center cities across the U.S.
IDA and our UPMO partners work together to collect more than 150 individual metrics for the most recent year and over the past decade and three geographic levels (study area, city, and MSA/county). In addition, for employment data we collect three different jobs totals (primary, all jobs, and all private) for all years between 2002 and 2021 to show more nuanced employment trends over time. The demographic and jobs data included in the study is now beginning to extend beyond the COVID-19 pandemic, but some real estate, tax, and assessment data include 2023 and 2024 figures.
*Refer to the Appendix for the full methodology and list of metrics used in the study.
The place management industry brings the public and private sectors together to create vital, healthy, thriving cities for everyone — from residents to workers to tourists to business owners. We are downtown champions who bring city centers to life.
Since 1970, property and business owners in cities throughout the U.S. and other countries have realized that revitalizing and sustaining vibrant city centers and neighborhood districts requires special attention beyond the services city administrations could provide alone. These private-sector owners came together, with funding from the property and business owners, to form nonprofit management associations which deliver key services and activities within the boundaries of their districts. These place management organizations are often called Business Improvement Districts (BIDs), Business Improvement Areas (BIAs), Partnerships and Alliances.
Downtowns and center cities are valuable due to their roles as economic anchors for their regions. As traditional centers of commerce, transportation, education, and government, downtowns and center cities frequently serve as hubs of industry and revenue generators, despite their only making up a small fraction of the city’s or region’s land area. Downtowns support high percentages of jobs across many different industries and skill levels. Because of a relatively high density of economic activity, investment in the center city provides a greater return per dollar for both public and private sectors than investments elsewhere.
As the literal and figurative heart of their cities, downtowns represent and welcome residents, employees, and visitors from all walks of life. Residents of strong downtowns often come from a wide range of racial, socioeconomic, cultural, and educational backgrounds, and from across all ages. This diversity ensures that as an inclusive place, downtown has a broad appeal to all users and a strong social fabric. Downtowns provide access to all to opportunity, essential services, culture, recreation, entertainment and civic activities.
The ability of vibrant places to attract visitors and new residents, as well as a regionwide consumer base, creates value. Vibrancy means the buzz of activity and excitement that comes with high-quality experiential offerings like breweries, restaurants, theatres, or outdoor events. Many unique regional cultural institutions, businesses, centers of innovation, public spaces and activities are located downtown. As the cultural center of their cities, downtowns typically attract a large share of citywide visitors and account for a large share of citywide hotels and hotel rooms.
Downtowns and center cities often serve as iconic symbols of their cities, creating a strong sense of place that enhances local pride. The authentic cultural offerings in downtown enhance its character, heritage, and beauty, and create an environment that other parts of the city can’t easily replicate. Combining community history and personal memory, a downtown’s cultural value plays a central role in preserving and promoting regional identity. Downtowns and center cities serve as places for regional residents to come together, participate in civic life, and celebrate their region, which in turn promotes tourism and civic society.
Downtowns and center cities play a crucial role in building stability, sustainability, and prosperity for the city and region. Their diversity, concentration of economic activity, and density of services better equip them to adapt to economic and social shocks than more homogenous communities. They can play a key role in advancing regional resilience, particularly in the wake of economic and environmental shocks, which often disproportionately affect less economically and socially dynamic areas.


A city’s strength and prosperity depend on a strong downtown and center city, which serve as centers of culture, knowledge, and innovation. The performance of districts and center cities strengthens an entire region’s economic productivity, inclusion, vibrancy, identity, and resilience.
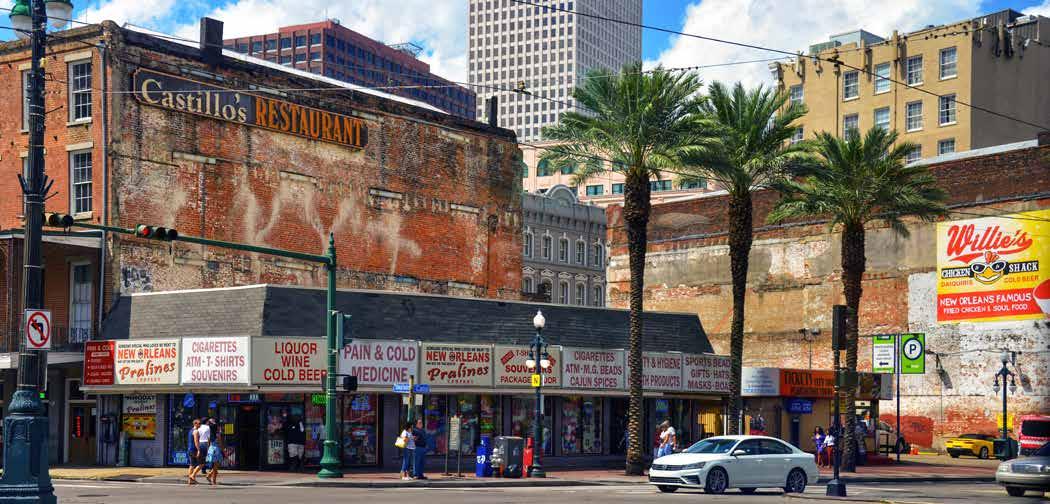
New Orleans contributes immense value throughout the region as one of the South's major economic engines. At the heart of this influence is its downtown, which, despite occupying less than 1% of the city's total land, delivers an outsized impact. As of 2021, the most recent data available, the area was home to 44,765 primary employees, accounting for more than a quarter of all jobs in the city. Additionally, downtown New Orleans houses over half of the city’s office spaces, underscoring its critical role in driving the local economy. This compact yet dynamic area is not only a cornerstone of New Orleans’ economic landscape but also a vital contributor to the broader regional economy, highlighting its essential influence and the significant role it plays in sustaining the city's overall economic vitality.
New Orleans is a global tourism hotspot, and downtown is no exception. With more than 22,000 hotel rooms spread across 115 hotels, its hospitality inventory ranks second only to Waikiki, Honolulu, Hawaii, in IDA’s Value of U.S. Downtowns and Center Cities study. It is also a sought-after destination for foodies and shoppers alike, with retail sales that reach $519 million per square mile, nearly 14 times the average sales density across the city-parish. Downtown’s appeal is amplified by the multiple large-scale events it hosts throughout the year, including annual celebrations like Mardi Gras and the Essence Festival of Culture and concerts and sporting events that take place at its historic theaters and two arenas.
In 2023, downtown New Orleans welcomed nearly 19,000 visitors each day on average. Although this is 25% below the 2019 peak of 9.1 million visitors, numbers have steadily climbed since the pandemic-era low point of 4.1 million in 2020, indicating a strong recovery. Underscoring the impact of downtown tourism on the region, the area generates an impressive 35% of the city’s sales tax revenue and 8.5% of the appraised property value, and 13% of taxable property value.
Downtown Development
District of New Orleans
CITY
New Orleans, LA
This means that a typical piece of downtown land is valued at more than ten times that of similar land elsewhere in Orleans Parish.
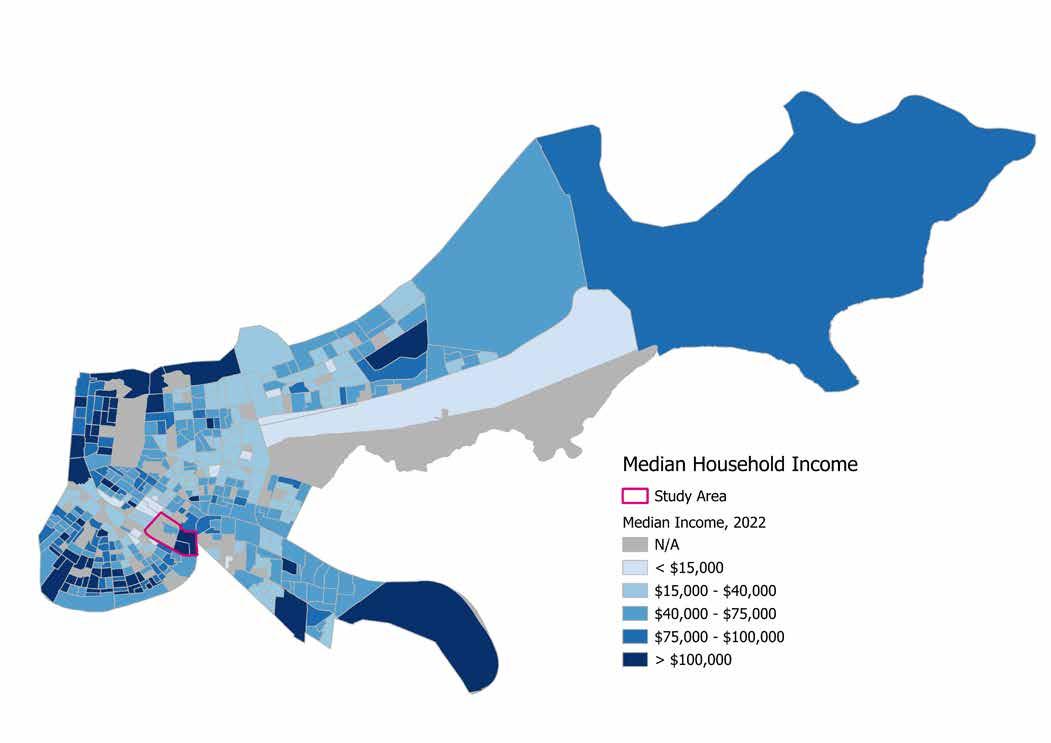
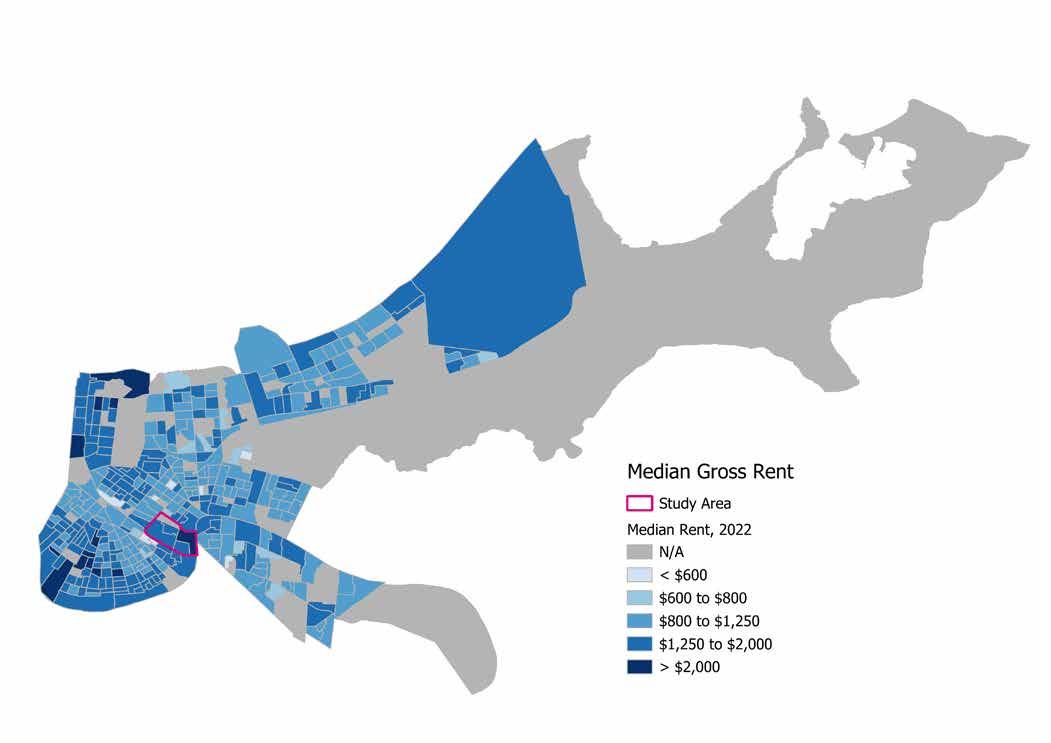
Downtown New Orleans has roughly 3,900 residents, which makes up just 1% of the city's total. However, the area has seen significant growth, experiencing a nearly 50% increase in population since 2000, even as the broader city and surrounding region have faced challenges. Despite this, the pace of growth has slowed in recent years, with only a 2.6% increase from 2018 to 2022, according to the most recent Census data. One possible factor: high visitation demand has led to small apartment buildings being converted into short-term rentals, limiting the housing supply. Demand for downtown living remains undiminished, and consequently, downtown rents are significantly higher than those in the rest of the city, with the average rent reaching $1,962 per unit in 2023.
The high cost of living is a significant concern, especially since most downtown residents are renters. This has a limiting effect on the area’s diversity, with 43% of downtown households earning over $100,000, a stark contrast to the city average of 27%. Since 2010, downtown has seen an increase of more than 1,300 households, nearly 800 of which earn over $100,000, accounting for almost 60% of the growth.
Simultaneously, the number of households earning $15,000 or less has risen by over 400, due in part to the presence of many Low-Income Housing Tax Credit (LIHTC) developments downtown. Currently, 26% of downtown households have incomes below $15,000, compared to 19% citywide. This indicates that downtown is experiencing growth among both the highest and lowest earners, but perhaps missing out on opportunities to attract middle-income earners.
Downtown New Orleans is also far less racially diverse than the rest of the city. According to the American Community Survey, 60% of downtown residents identify as White, nearly double the 31% share across the city. However, in an encouraging sign, downtown New Orleans has seen an increase in racial diversity over time.
Since 2010, the number of Black or African American residents has more than doubled. Additionally, the Asian and Pacific Islander population has more than tripled, and the Hispanic or Latino population has nearly quadrupled, although these residents still represent small shares of the total population.
New Orleans is no stranger to economic and environmental shocks and stresses, which have played a significant role in downtown’s evolution over the years. Nearly two decades since Hurricane Katrina devastated the city, downtown has never fully regained the roughly 60,000 jobs it had prior to 2005. The COVID-19 pandemic further stunted the city’s recovery, with a pronounced impact on the accommodation and food service industry, historically the largest downtown employer. In 2019, this
Source: American Community Survey 5-Year Estimates (2013-2022)
Source: LEHD On the Map (2006–2021)
Using data collected for the Value of U.S. Downtowns and Center Cities study, we identified three tiers of districts, defined by their stage of development. We divided the study districts into established, growing, and emerging tiers based on the citywide significance of downtown population and jobs, density of residents and jobs within the district, assessed value per square mile, the rate of population growth from 2000 to 2022, and the rate of job growth from 2002 to 2021. This analysis specifically compares downtown to downtown, rather than city to city.
New Orleans stands out as a truly unique downtown that defies easy classification. Downtown New Orleans is the largest employment center in the state of Louisiana, and in categories such as employment density and share of citywide jobs, it matches more closely with established tier downtowns. In other categories, such as population density, share of citywide residents, and property values, downtown New Orleans has lower numbers that make it a clearer fit as an emerging tier downtown. For the purposes of this study, we have chosen to place downtown New Orleans among the emerging tier of downtowns.
Emerging districts like downtown New Orleans typically have a low proportion of citywide significance in terms of jobs and population (as a group they average 2% of overall population and 17% of jobs) and have lower densities. Emerging downtowns don’t yet have the high citywide significance in jobs and residents found in other downtowns, and they have relatively lower densities. That also means that they have substantial potential; typically, property value per square mile remains low relative to other urban places, allowing developers to see greater returns on their investments. Similarly, lower rents can make these downtowns attractive to small businesses and creators/makers.
Please view the Summary section of this report for data comparing downtown New Orleans to its peers within the emerging tier. For the full set of cities by tier, accompanying data points, and methodology, refer to the Value of U.S. Downtowns and Center Cities compendium, which is available on the IDA website, downtown.org
Emerging Downtowns
• Albuquerque
• Baton Rouge
• Birmingham
• Cleveland
• Colorado Springs
• Corpus Christi
• El Paso
• Evansville
• Grand Rapids
• Hollywood
• Lancaster
• Little Rock
• New Orleans
• Norfolk
• Oklahoma City
sector employed almost 14,000 people, but by 2021, that number had fallen by 53%, dropping it from the dominant downtown industry to the third largest. Despite these challenges, downtown New Orleans is showing remarkable resilience and recovery signs. Plans for 600,000 square feet of new office space are underway, and the local convention and visitors bureau, New Orleans & Co., expects strong years in 2024 and 2025. Additionally, annual visitation numbers are steadily increasing, indicating a robust rebound for the downtown area.
• San Antonio
• Tampa
• Toledo
• Tucson
• Tulsa
• University Circle
• Waikiki
• Wichita
The central role that downtown New Orleans occupies in the region’s economy highlights the significance of entities like the Downtown Development District (DDD) of New Orleans in fostering and maintaining a robust local economy. Created by the Louisiana Legislature in 1974 as the nation’s first assessment-based business improvement district (BID), the DDD provides enhanced services in economic development, cleaning, and safety. The DDD is governed by an 11-member Board of Commissioners who represent a cross-section of the diverse downtown community.
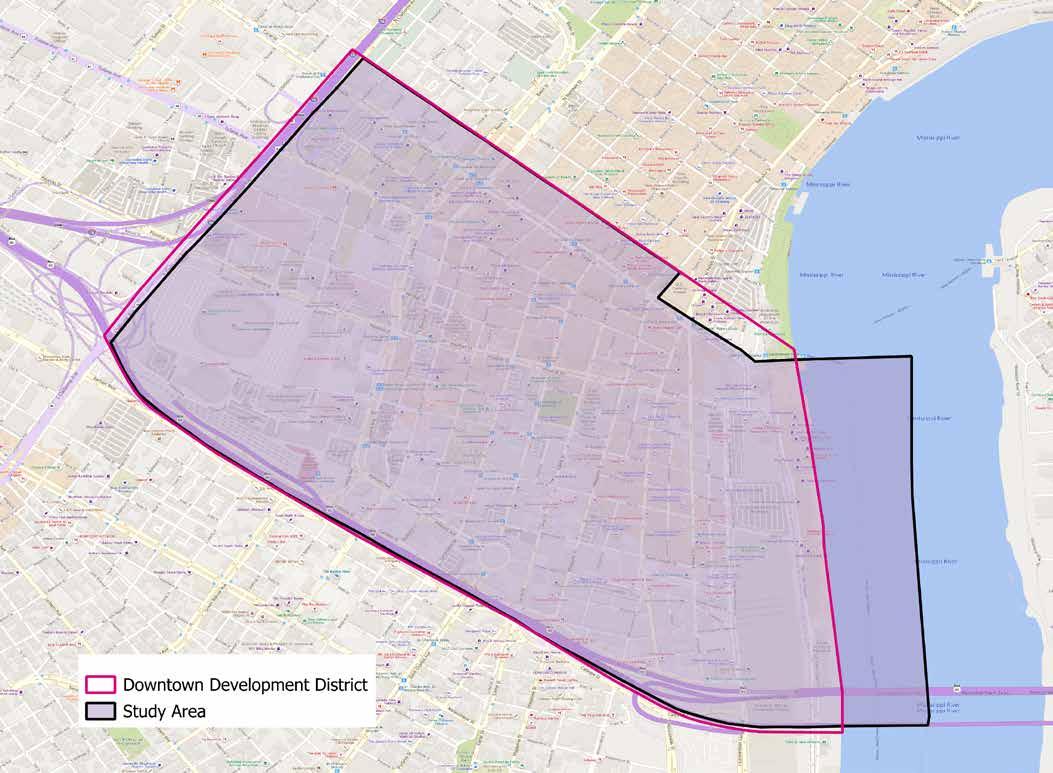
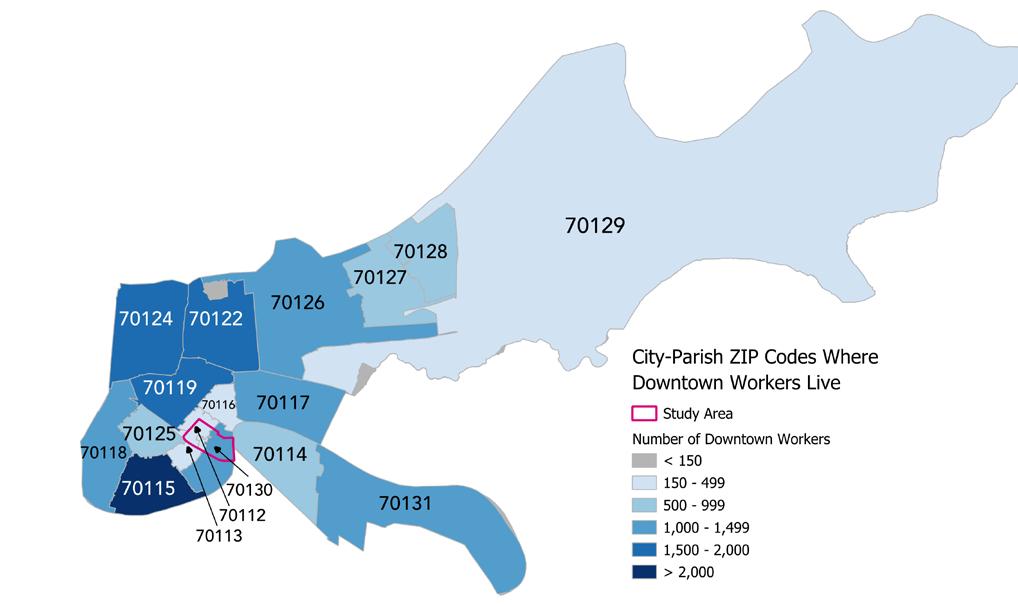
IDA worked closely with the DDD to align the study area with Census block group boundaries which closely align with the DDD boundary while not including the French Quarter – a separate neighborhood in its own right. This facilitates the easy incorporation of publicly available data from a variety of sources while matching the boundary to hard edges such as roads, water, natural features, or highways as much as possible.
For this analysis, the study area is roughly bounded by I-10, Route 90, the Mississippi River, and Iberville Street. This boundary captures the boundaries of the DDD nearly perfectly, with the exception of a few blocks along Canal Street on the riverside end of the study area that were not included in the census geography boundaries. In this report, “the city” refers to the city of New Orleans, and regional figures correspond to the New Orleans-Metairie Metropolitan Statistical Area.
Downtowns make up a small share of their city’s land area but have substantial economic importance. While downtowns and center cities constitute a small share of citywide land area, there’s no understating their regional economic importance.
As traditional centers of commerce, transportation, education, and government, downtowns serve as economic anchors for their cities and regions. Thanks to highly concentrated economic activity, investment in the center city yields a high level of return per dollar. Urban centers across the U.S. were the first areas to recover from the Great Recession, and although the continued recovery from the COVID-19 pandemic has raised many questions about the future, prior analysis of the role of downtowns and center cities highlights their unique ability to absorb and recover from economic shocks and stresses.
With more than a quarter of the city’s jobs located within the study area, there is no doubting the significant impact of downtown New Orleans on the local economy. The area’s more than 44,765 primary jobs, as of 2021, are densely packed within an area comprising less than 1% of the Crescent City’s total land area.
The employment landscape in downtown New Orleans has seen major fluctuations over the past two decades. Prior to 2005, the area concentrated approximately 60,000 primary jobs, a worker’s only or best paying job. However, the devastation wrought by Hurricane Katrina caused a dramatic 31% drop in employment over the course of the following year, reducing the number of primary employees to just over 42,000 by 2006. Following this setback, downtown New Orleans experienced a steady recovery, reaching 57,509 primary employees by 2019.
The COVID-19 pandemic dealt yet another blow. Between 2019 and 2022, downtown New Orleans experienced another 22% reduction in jobs. Despite these challenges, office workers have largely returned, with an estimated 88% recovery in headcount according to the Downtown Development District’s data, which is more current than the Census data available for analysis in this report. Due to hybrid work models, these workers are spending less time downtown, leading to about 70% office occupancy on an average workday. However, according to foot traffic data
Benefits of Economy: Economic Output, Economic Impact, Investment, Creativity, Innovation, Visitation, Spending, Density, Sustainability, Tax Revenue, Scale, Commerce, Opportunity
from Placer.ai, a location analytics company, downtown continues to see the number of employees approaching 2019 levels. As of May 2024, the city of New Orleans has the highest return to office rate of any U.S. city at 92%.
The accommodation and food services sector, which has historically been by far the largest sector, has played a pivotal role in downtown’s post-pandemic recovery. The University of New Orleans estimates that the region added 5,000 jobs in this sector between December 2021 and December 2023, the plurality of which were in Orleans Parish. With more than half of the parish’s hotels located in downtown’s 1.4 square miles, it can be assumed that a majority of these gains have been realized downtown. However, as of 2021 — the most recent year when Census data is available — this sector accounted for 6,554 downtown jobs, which represents an astonishing 53% reduction from 2019 levels. In another encouraging sign, visitation to downtown New Orleans, which drives the accommodation and food services sector, is trending up significantly, with 25 new hotels opening in the area since 2022.
Other key industries in downtown New Orleans include health care and social assistance, as well as professional, scientific, and technical services. With its 7,854 jobs, the health care and social assistance sector has experienced significant growth, increasing by 20% between 2013 and 2021. This growth is supported by major institutions like
Louisiana State University’s and Tulane University’s Schools of Medicine. To further bolster this sector, the New Orleans City Council has recently approved a tax increment financing district to support BioDistrict New Orleans, the official designation for this biosciences district within downtown, aiming to attract private investment and develop a cohesive strategy for the area's numerous institutions. Meanwhile, the professional, scientific, and technical services sector, encompassing a wide range of white-collar professions such as architecture, engineering, legal services, accounting, and marketing, has remained stable over the years, consistently maintaining around 8,000 jobs since 2002, with 7,609 jobs currently downtown.
Together, these two industries contribute to the knowledge industry, which encompasses sectors that rely on a highly trained workforce and extensive use of technology. Among other knowledge industry sectors, the information sector stands out with remarkable growth, expanding by more than 150% in
the past decade. Despite being a relatively small part of the overall employment landscape, this rapid expansion has helped position downtown New Orleans as a regional leader in the industry. Currently, 33% of the region's jobs in the information sector are concentrated downtown, highlighting its significance and potential for future development.
A strong entrepreneurial environment that supports both small and large businesses in all industries is critical to a thriving downtown. While small businesses account for almost half of U.S. economic activity, larger and wellestablished firms provide stability and opportunity, to both their employees and to the downtowns they call home.
Employment at private businesses in downtown New Orleans tends to be slightly more concentrated in larger and older firms compared to the rest of the city. Specifically, 68% of downtown employment is at businesses with more than 250 employees, in contrast to 58% citywide. Conversely, small businesses with fewer than 20 employees account for 11% of downtown jobs, compared to 16% across the city. Additionally, 87% of downtown jobs are found in businesses over 11 years old, which is only slightly higher than the citywide rate of 82%, indicating a strong presence of wellestablished firms both in the downtown area and throughout the city.
Despite this orientation towards larger and older companies, the startup environment in downtown New Orleans is thriving. The presence of 16 incubator and co-working spaces provides flexible and supportive environments for new enterprises to establish and grow. These spaces contribute to a dynamic and innovative business climate, fostering the development of new ideas and ventures in downtown New Orleans.
$15K OR LESS $15K TO $40K $40K OR MORE

Downtowns typically concentrate the densest development and highest property values in their region. This trend plays out in downtown New Orleans, which not only holds a significant portion of the city and region's total jobs but also concentrates much of the area's high-quality, high-paying employment. Nearly two-thirds (65%) of downtown jobs offer salaries over $40,000 per year, compared to just over half of the jobs citywide and regionally. This density of well-paying positions is notable, with one-third of all jobs in New Orleans paying over $40,000 located within downtown's 1.4 square miles. This makes downtown a critical hub for lucrative employment opportunities.
The real estate landscape of downtown New Orleans further underscores its economic importance. Downtown is home to 14 of the city’s 21 Class A office buildings and 57% of all office space, representing a substantial concentration of both employment capacity and real estate value. Looking forward, downtown's commercial real estate shows promising signs of retaining its long-term value. According to Placer data, New Orleans has been a leader in the return-to-office movement citywide. Although the vacancy rate for downtown office space has risen from an all-time low of 7.2% in 2020 to 13%, it remains comparable to the average vacancy rate of 12.1% throughout the 2010s. Moreover, at least 600,000 square feet of office space is currently in development for downtown, indicating sustained investor confidence in this prime location.
The significant concentration of valuable real estate in downtown makes it a cornerstone of city-parish revenues. Despite comprising less than 1% of the city's land area, downtown generates an impressive 35% of sales tax revenue and 8.5% of the appraised property value. This means that a typical piece of downtown land is valued at more than ten times that of similar land elsewhere in Orleans Parish. The downtown’s share of taxable property value is even higher, at 13%, when excluding non-profit and state-owned properties. Additionally, with more than half of the city’s 216 hotels and nearly three-quarters of the city's 30,787 hotel rooms situated downtown, it is likely that downtown contributes the majority of the city-parish's hotel tax revenue, further solidifying its economic impact.
Downtowns and center cities invite and welcome all residents, employees, and visitors by providing access to jobs, housing, essential services, culture, recreation, entertainment, and participation in civic activities. Ensuring an inclusive business environment is central to the mission of the Downtown Development District. As one example, the organization’s The Future of Downtown New Orleans economic development strategy, published in 2024, encourages increased participation of disadvantaged business enterprises (DBEs) by providing resources, training, and networking opportunities to enhance their competitiveness for downtown projects — both public and private.
Benefits of Inclusion: Equity, Affordability, Civic Participation, Civic Purpose, Culture, Mobility, Accessibility, Tradition, Heritage, Services, Opportunity, Workforce Diversity
Despite the city of New Orleans being home to a population that is majority Black, downtown has a predominantly White population. According to the American Community Survey, 60% of downtown residents identify as White, compared to 31% across the city. However, downtown New Orleans has seen a rapid increase in racial diversity over time. Since 2010, the number of Black or African American residents has more than doubled. Additionally, though they still represent small shares of the total population, the number of Asian and Pacific Islander residents has more than tripled, and the Hispanic/ Latino population has nearly quadrupled.
In terms of employment, the racial composition of downtown New Orleans' workforce more closely mirrors that of the city as a whole. While a slightly larger share of downtown workers identify as White than the citywide workforce, the difference is less pronounced; 61% of downtown workers are White Alone compared to 56% citywide. This similarity in workforce demographics highlights a more balanced representation in the downtown employment sector, reflecting broader citywide trends.

Source: LEHD On the Map (2021)
Source: American Community Survey 5-Year Estimates (2018–2022)
Not Hispanic or Latino Hispanic or Latino
Source: LEHD On the Map (2021)
50-64-year-olds comprise the largest age group in downtown New Orleans, making up over one-third of the study area residents. Often referred to as “empty nesters,” this demographic is highly valued in downtown areas due to their typically high disposable incomes. This represents a significant shift from 2010, when 25-34 year-olds were the dominant age group in downtown. Since then, all population growth in downtown has come from those over 35, with younger age groups below 34 remaining flat in numbers.
Source: American Community Survey 5-Year Estimates (2013–2022)
Leading this growth, the 50-64-year-old age group has more than tripled in total residents downtown, and increased in share from 19% of residents in 2011 to 36% in 2022. In stark contrast, the under-18 and 18-24-year-old age groups remain small parts of the downtown population, together comprising just 7% of the study area population compared to almost 30% of the city's overall population. This demographic shift highlights the growing appeal of downtown living for older adults and the challenges in attracting and retaining younger residents.
Source: American Community Survey 5-Year Estimates (2018–2022)
Downtown New Orleans is home to a significantly higher median household income than both the city and the region. Notably, 43% of downtown households have incomes exceeding $100,000, which is substantially higher than the city average of 27%. Conversely, 26% of downtown households have incomes below $15,000, compared to 19% citywide. This bifurcation may be influenced by the prevalence of luxury housing developments attracting higher-income residents. Since 2010, downtown has seen an increase of more than 1,300 households, with nearly 800 of these earning over $100,000. High-income households thus account for almost 60% of the growth. Simultaneously, the number of households earning $15,000 or less has also risen by over 400, likely due to the presence of several LIHTC developments downtown.
Correspondingly, educational attainment among downtown residents is notably high, with nearly two-thirds possessing a bachelor’s or advanced degree. This contrasts sharply with the citywide rate of 40% and the regional rate of 33%. Furthermore, only 21% of downtown residents have a high school diploma or less, compared to 33% of citywide
residents and 38% of regional residents. These figures suggest that downtown New Orleans attracts a highly educated population, contributing to the area's overall economic and social vibrancy.
In terms of employment, downtown jobs require somewhat higher educational qualifications, though the disparity is not as pronounced as the income differences might suggest. Jobs in downtown New Orleans are fairly evenly distributed by educational attainment, indicating broad accessibility of downtown employment. Approximately 36% of downtown workers have a high school education, slightly lower than the 41% citywide rate. Meanwhile, 33% of downtown workers hold a Bachelor’s degree or higher, compared to 29% of workers citywide. This distribution reflects the inclusive nature of downtown employment opportunities, catering to a diverse range of educational backgrounds.
$15,000 to $40,000
$40,000 to $75,000
$75,000 to $100,000
More than $100,000
Source: American Community Survey 5-Year Estimates (2018–2022)
Source: American Community Survey 5-Year Estimates (2018–2022)
Source: Center for Neighborhood Technology (2020)
Downtowns are generally more expensive places to live. Yet, their density of housing, concentration of jobs, and access to public transportation can help offset the high costs of housing, making living downtown advantageous when factoring in the diversity of transportation options. This trend isn’t necessarily observed in downtown New Orleans, where median households spend slightly more when factoring in the combined costs of housing and transportation.
Rents in downtown New Orleans are significantly higher than those across the rest of the city and region. Only a few places in the parish of Orleans have median rents comparable to those found downtown. This trend is concerning, particularly as rents continue to rise rapidly and most downtown residents are renters. According to the Downtown Development District’s data from 2023, the average rent in downtown is $1,962 per unit, highlighting the steep cost of living in this area.
A major factor driving these rent increases is the growth in the hospitality market. Many smaller multi-family buildings are being converted into boutique hotels and short-term rentals to meet the substantial demand from visitors wishing to stay downtown. This trend reduces the availability of longterm rental housing, further pushing up rents and making it increasingly difficult for local residents to afford to live in downtown New Orleans. Still, the density and proximity of destinations of interest, coupled with greater transit availability, help to ease the high costs of housing downtown by increasing accessibility.
Source: American Community Survey 5-Year Estimates (2018–2022) Median Household Income
Source: American Community Survey 5-Year Estimates (2009–2013, 2018–2022)
Median Household Rent
Source: American Community Survey 5-Year Estimates (2018–2022)
Source: American Community Survey 5-Year Estimates (2009–2013, 2018–2022)
Due to their expansive base of users, center cities can support a variety of unique retail, infrastructural, and institutional uses that offer cross-cutting benefits to the region.
Downtowns and center cities typically form the regional epicenter of culture, innovation, community, and commerce. Downtowns flourish due to density, diversity, identity, and use. An engaging downtown “creates the critical mass of activity that supports retail and restaurants, brings people together in social settings, makes streets feel safe, and encourages people to live and work downtown because of the extensive amenities.”1 This is further amplified by a high concentration of restaurants, concerts, outdoor events, plazas, parks, and festivals.
Benefits of Vibrancy: Density, Creativity, Innovation, Investment, Spending, Fun, Utilization, Brand, Variety, Infrastructure, Celebration
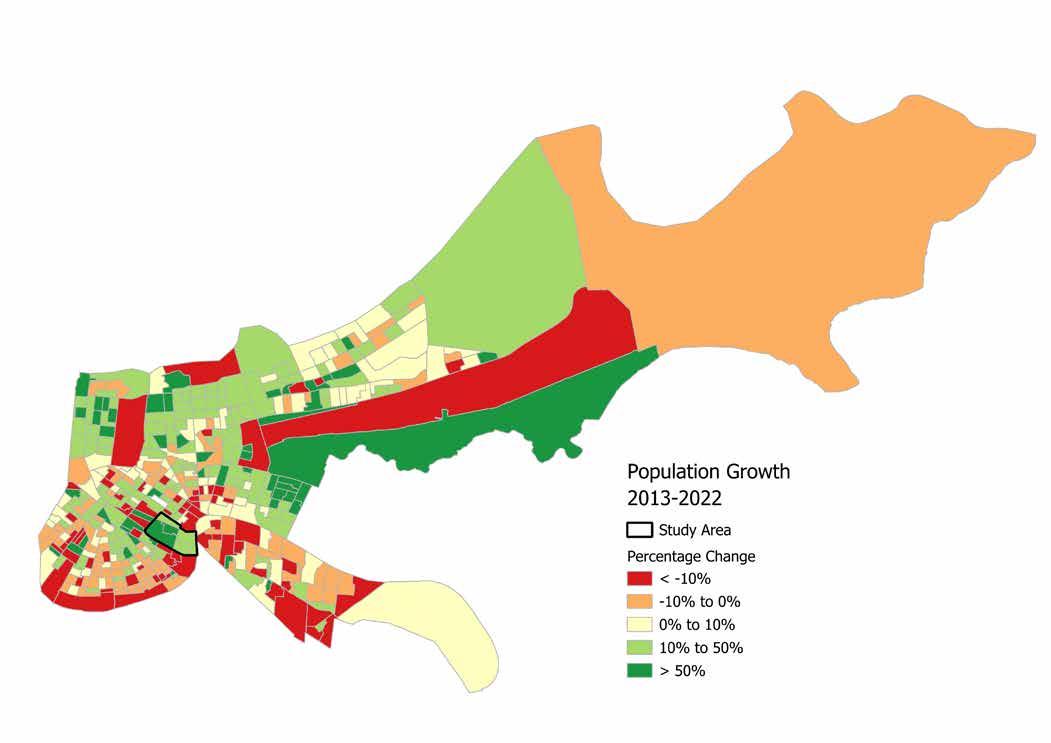
Residential growth signals a fast-changing and vibrant downtown, one that not only has a working population in the daytime but also activities and people around throughout the day and night. In New Orleans, population levels as of 2022 still lag behind those recorded in the 2000 Census. While the broader city and surrounding region have struggled the most, downtown New Orleans has experienced a notable surge in residents, boasting a nearly 50% increase compared to the year 2000. This uptick in population underscores the resilience and appeal of the downtown area, which has become a beacon of revitalization amidst the broader city's challenges.
However, the pace of this growth has decelerated in recent years, with only a 2.6% increase in the downtown population from 2018 to 2022, the most recent year for which Census Bureau data is available. Despite this slowdown, downtown still contrasts sharply with the overall city, which has seen a population decline, and the region, where numbers have remained stagnant. A significant factor behind the tempered growth rate is the robust hospitality market, which has created a strong headwind on residential expansion by converting many residential buildings into hotels.
Nonetheless, the addition of 681 residential units either under construction or in planning stages promises renewed acceleration in population growth for downtown New Orleans in the near future.
Population Change 2013–2022
Source: American Community Survey 5-Year Estimates (2013–2022)
A downtown’s retail environment acts as the heart of the community and is a key reason for residents, workers, and visitors to come downtown. Among participants in IDA’s study, downtown New Orleans stands out as a vibrant hub for food, beverage, and retail trade businesses, boasting an impressive density of 397 such establishments per square mile. This concentration is significantly higher than the citywide average, reinforcing downtown’s reputation as one of the premier cultural and culinary destinations in the United States.
The economic vitality of downtown is further evidenced by its robust retail sales, which amount to $519 million per square mile. This figure is nearly 14 times higher than the average sales density across the city-parish, highlighting the area's role as a major commercial center. Key commercial corridors such as Canal Street, which separates the Central Business District from the French Quarter, and areas like the Warehouse and Arts District are home to scores of restaurants, bars, and shops, creating a bustling and dynamic atmosphere that attracts both locals and tourists.
This ongoing strength and recovery in the downtown retail sector is also reflected in the high rental rates for retail spaces. Downtown retail rents are two-thirds higher than the city-wide average, a clear indicator of the strong demand for storefront space in New Orleans' heart. Within downtown, converted warehouses meet modern commercial buildings, making the area a sought-after location for businesses of all sizes.
TOTAL RETAIL AND FOOD & BEVERAGE BUSINESSES
3,997 486
24 352
RETAIL AND FOOD & BEVERAGE BUSINESSES PER SQUARE MILE $6.48B $717M
TOTAL RETAIL AND FOOD & BEVERAGE SALES
RETAIL TRADE AND FOOD & BEVERAGE SALES PER SQUARE MILE $38M $519M
Source: ESRI Business Analyst Online (2023), City of New Orleans (2023)
RETAIL RENT ($/SF/YEAR)
RETAIL SF UNDER CONSTRUCTION OR PLANNED
Source: CoStar (2024), City of New Orleans (2024)
$21.78 –
Downtowns often serve their cities as centers of culture and recreation. Few downtowns can match the visitor appeal of downtown New Orleans, one of the most iconic urban tourism destinations in the United States. Boasting more than 22,000 hotel rooms, it is second in IDA’s study only to Waikiki, Honolulu, Hawaii, which has 23,349 hotel rooms. These rooms are spread across 115 hotels, the highest number in any study downtown, including many smaller boutique hotels that add to the unique charm and diversity of accommodations available. Even events hosted outside the study area positively affect downtown, as visitors often choose to stay in the abundant hotel rooms located here.
The extensive hospitality market gives downtown New Orleans the capacity to host multiple large events simultaneously, making it an ideal location for quintessential New Orleans festivities like Mardi Gras and the Essence Festival of Culture. National events, such as the Super Bowl

and NCAA Final Four, have helped place New Orleans on the map as a premier sports city. Meanwhile, two professional sports teams, the NFL’s New Orleans Saints and the NBA’s New Orleans Pelicans, call downtown home, bringing regular influxes of fans and activity. Additionally, the Ernest N. Morial Convention Center, one of the largest in the country, helps to attract the more than 1,000 conventions that take place downtown annually. Collectively, these events draw over 800,000 people and further solidify downtown New Orleans as a vibrant, multifaceted destination for both cultural and professional gatherings.
In 2023, downtown New Orleans attracted 6.9 million visitors according to Placer data. While this is still 25% below the 2019 figure of 9.1 million visitors, the numbers have been steadily climbing since the 2020 low point of 4.1 million visitors. This trend indicates that downtown visitation is poised to be stronger than ever in the coming years. Projections for 2024 and 2025 suggest banner years for the convention center as trade shows and other major events planned in 2021 and 2022 come to fruition. In response to this growing demand, the Ernest N. Morial Convention Center has announced plans for a new 1,000-room hotel across the street from its complex.2 Additionally, 25 new hospitality properties have opened downtown since 2022, further increasing the area's capacity to accommodate visitors. These developments signify a robust recovery and a promising future for downtown New Orleans as a top-tier destination for tourists and event-goers alike.
8
VENUES WITH LIVE ENTERTAINMENT TOTAL THEATRES
4 GYMS AND FITNESS STUDIOS ANNUAL FESTIVALS/ PARADES
6 70+ TOTAL CONVENTIONS
1,000+
Source: New Orleans DDD (2024), New Orleans & Co (2024)
Downtowns and center cities preserve the heritage of a place, provide a common point of physical connection for regional residents, and contribute positively to the brand of the regions they anchor.
Downtowns are “iconic and powerful symbols for a city and often contain the most iconic landmarks, distinctive features, and unique neighborhoods. Given that most downtowns represent one of the oldest neighborhoods citywide, they offer rare insights into their city’s past, present, and future.”3 The authentic cultural offerings in downtown enhance its character, heritage, and beauty, and create a unique sense of place not easily replicated in other parts of the city.
Benefits of Identity: Brand, Visitation, Heritage, Tradition, Memory, Celebration, Fun, Utilization, Culture
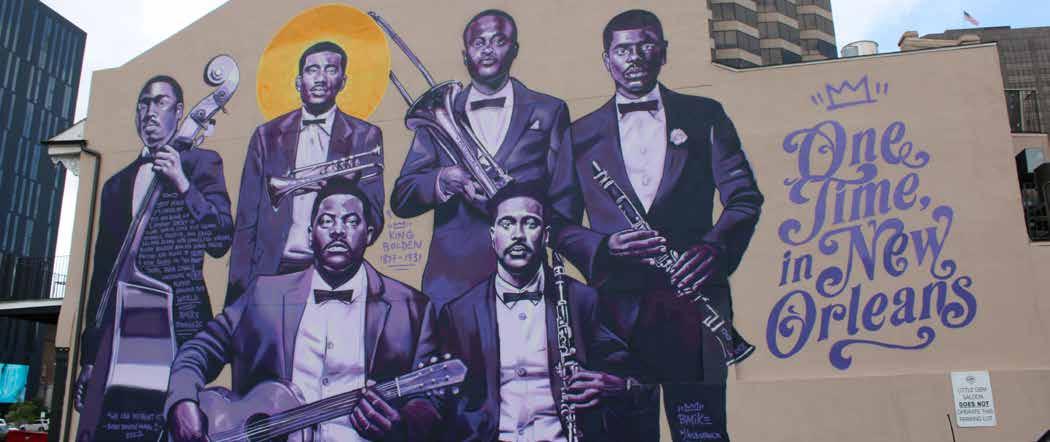
Few places can rival the distinctive identity of downtown New Orleans. Originally established in the 1800s as "The American Sector,” downtown developed and evolved as New Orleans was gaining prominence as an influential port city, offering a contrast to the older parts of the city. Its streets and structures embody the same familiar style of architecture, a unique blend not strictly French but largely influenced by American design. Yet, the vibe of the area is
INSTAGRAM FOLLOWERS
31.5K X (FKA TWITTER) FOLLOWERS
8.9K
4.9K LINKEDIN FOLLOWERS
17.2K FACEBOOK FOLLOWERS
decidedly different. By day, business people shuffle in and out of high-rise buildings while doctors and researchers tackle some of the world’s most pressing medical challenges. At night, revelers seek refuge in upscale bars and restaurants before heading off to catch a concert or sporting event at one of the area’s many historic theaters or downtown arenas.
Downtown is divided into four subdistricts, each possessing its own unique identity. Buzzing with the energy of commercial activity and business innovation, the Central Business District anchors the center of downtown with its modern high-rises and bustling offices. Towards uptown, the Warehouse and Arts District is unmistakably hip, with converted industrial spaces housing contemporary art galleries, trendy lofts, and renowned restaurants. Just towards the lake from here, the Sports and Entertainment District pulses with excitement, home to the Superdome and Smoothie King Center, where fans gather for major sporting events and concerts. And finally, at the outer edge of Downtown, the BioDistrict is a hub of cuttingedge healthcare and research, with state-of-the-art medical facilities and institutions driving advancements in medicine and biotechnology.
Internationally, downtown New Orleans is on the map. The city’s culture is on full display throughout the year through signature events like Mardi Gras and the Essence Festival of Culture, which infuse downtown streets with energy and life. During the famous New Orleans Jazz & Heritage Festival, which happens on the grounds of the nearby fairgrounds, attendees often stay and attend aftershows downtown,
adding to the neighborhood's ‘round-the-clock atmosphere. Thanks to major events like the Super Bowl and the NCAA Final Four, downtown consistently punches above its weight, enticing visitors with more than enough things to do without ever having to set foot outside its boundaries.
One of downtown’s most distinctive features is its historic urban character. An enduring symbol of the city’s commitment to its history is the Saint Charles Avenue streetcar line, the oldest continuously operated streetcar line in the world. Today’s streetcar system is affordable and accessible, providing a lifeline for both residents and tourists. It’s also expanding, ensuring that the district remains wellconnected and easy to navigate. That’s important, given that downtown is expanding, too. Dozens of historic buildings have been carefully renovated in recent years, making room for the millions of annual visitors to the city. This blend of historic preservation and modern convenience makes downtown a dynamic place to live, work, and visit.
4
DESIGNATED HISTORIC DISTRICTS
Source: New Orleans DDD (2024)
In downtown, you can find a reflection of the identity of New Orleans itself — a place where history and modern life seamlessly coexist. Whether it’s the allure of its unique architecture, the excitement of its festivals and events, or the ease of its transportation, downtown New Orleans embodies the spirit and diversity of a city synonymous with culture. This combination of cultural richness, historic significance, and contemporary vibrancy ensures that downtown remains a vital and beloved part of New Orleans, offering an experience that is both deeply rooted in tradition, yet everevolving. TOTAL MUSEUMS
2
9 PROFESSIONAL SPORTS TEAMS
At its broadest, resilience means a place’s ability to withstand shocks and stresses. Thanks to their diversity and density of resources and services, center cities and their residents can better absorb economic, social, and environmental shocks and stresses than other parts of a city. Diversity and economic vitality equip downtowns and center cities to adapt to economic and social challenges better than more homogenous communities. Similarly, density better positions downtowns and center cities to make investments needed to hedge against and bounce back from increasingly frequent environmental shocks and stresses.
Benefits of Resilience: Health, Equity, Sustainability, Accessibility, Mobility, Durability of Services, Density, Diversity, Affordability, Civic Participation, Opportunity, Scale, Infrastructure
RESIDENTS UNDER THE POVERTY THRESHOLD 5% 19% 18%
RESIDENTS NEAR BUT NOT IN POVERTY 4% 9% 7%
HOUSEHOLDS WITHOUT A COMPUTER 8% 11% 8%
HOUSEHOLDS WITHOUT INTERNET ACCESS
Source: American Community Survey 5-Year Estimates (2018–2022)
Economic Resilience
Economic resilience is the ability of a downtown to withstand adverse economic conditions, such as the COVID-19 pandemic, by having a mix of factors essential to continual long-term success. Bringing together a mix of industries with a talented workforce makes downtown both a competitive and economically resilient environment.
The impact of Hurricane Katrina on New Orleans, including its downtown area, was immense. Over the course of a single year between 2005 and 2006, downtown jobs plummeted by 31%, a significant decline, yet less severe than the city’s overall job decline of nearly 40%. Despite this setback, downtown jobs were on a steady climb from 2006 to 2019. However, the COVID-19 pandemic dealt a significant blow to this progress, particularly affecting the accommodation and food service industry, historically the largest downtown employer.
Despite these challenges, downtown New Orleans is demonstrating remarkable resilience and signs of recovery. Plans for 600,000 square feet of new office space are underway, and the group travel industry is expected to see strong years in 2024 and 2025. Additionally, annual visitation numbers have been steadily increasing, indicating a robust rebound for the downtown area. While downtown New Orleans shares similar levels of poverty with the city and region, it has fewer residents who are near but not in poverty. This suggests that downtown is equally vulnerable to economic shocks compared to other neighborhoods in New Orleans.
Downtowns act as hubs for social resilience. Their dense nature gives a diverse mix of residents and employees access to a multitude of community resources in a small area. With ten parks and natural areas and multiple medical, educational, and cultural institutions located within its borders, downtown New Orleans offers an abundance of amenities that support both community well-being and social cohesion.
Crime rates are a leading indicator of social resilience, as they significantly impact the trust and cohesion within communities. This is especially pertinent to urban place management organizations like the Downtown Development District (DDD) of New Orleans, which strive to maintain clean and safe environments. However, the COVID-19 pandemic and sometimes exaggerated media portrayals have amplified negative perceptions of crime in North American downtown areas. Traditional crime statistic methodologies often misrepresent these neighborhoods by only considering resident populations, ignoring the unique composition of large numbers of visitors and workers alongside residents that distinguishes downtowns.

Downtown New Orleans exemplifies this phenomenon. When factoring in the large numbers of workers and visitors as part of the area’s population into New Orleans Police Department crime data for downtown, the downtown crime rate stands at 2,753 incidents per 100,000 people in 2023, less than half the city-wide rate of 5,755 per 100,000. This positions downtown as one of the safest neighborhoods in the city. Such statistics reveal the importance of considering the full scope of downtown populations to accurately assess safety and social resilience. Moreover, organizations like the DDD play a crucial role in enhancing safety and maintaining the trust and cohesion necessary for a resilient community.
Health metrics also provide insight into community resilience. In downtown New Orleans, 96% of residents have some form of healthcare coverage, indicating widespread community resilience to health shocks. Additionally, downtown residents are highly likely to engage in physically active hobbies, with 85% reporting leisure-time physical activity compared to 75% of all city residents. Digital access further enhances resilience, with 96% of households having a computer and 92% having home internet connections, which proved critical during the COVID-19 pandemic when many aspects of daily life moved online.
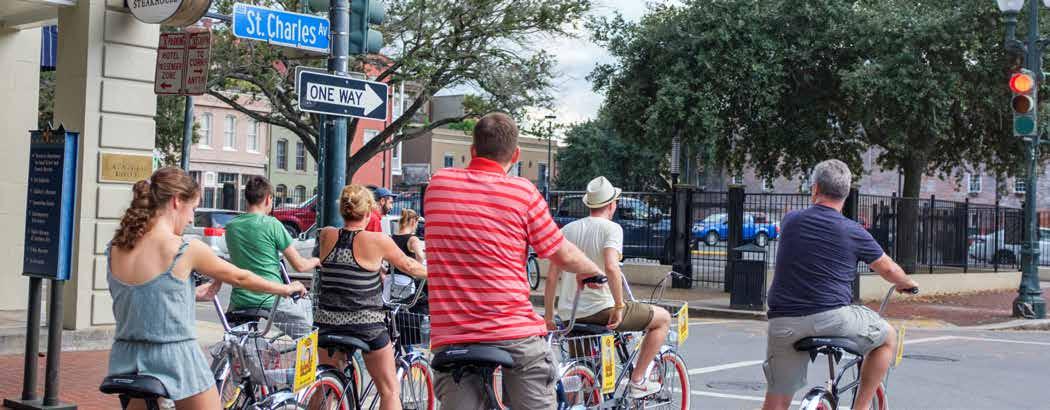
A downtown’s environmental resilience plays a major role in assuring long-term sustainability in its region. Living downtown encourages individuals to make environmentally friendly choices, significantly reducing their carbon footprint. For example, typical downtown households in New Orleans generate just 3.2 tonnes of greenhouse gas emissions per year, less than half the citywide average of 6.7 tonnes. This reduction can largely be attributed to the ease of navigating downtown New Orleans without relying on a car. The area features 108 transit stops, including the iconic Saint Charles Streetcar line. Additionally, downtown New Orleans boasts impressive Walk and Bike scores of 96 and 90, respectively, underscoring its strong walkability and bike-friendliness.
The high walkability and concentration of employment opportunities in downtown New Orleans have led to a significant portion of residents choosing to walk to work. As of 2022, 41% of downtown residents commute on foot, a substantial increase from 22% in 2010. This shift highlights the impact of organizations like the Downtown Development District and initiatives such as the Lafitte Greenway, a trail for pedestrians and cyclists extending from Louis Armstrong Park to Bayou St. John. The trend towards walking and biking not only reduces greenhouse gas emissions but also contributes to the overall health and well-being of the community, reinforcing the downtown area's role in fostering environmental resilience and sustainability.
LEED BUILDINGS
ELECTRIC CAR CHARGING POINTS
ACRES OF OPEN SPACE
ANNUAL GHG EMISSIONS PER HOUSEHOLD
12
7
12.7
3.2
BIKESHARE STATIONS
Source: New Orleans DDD (2024), City of New Orleans (2024), Blue Bikes New Orleans (2024)
Commute Mode Share
Source: Walk Score (2024)
The Value of U.S. Downtowns and Center Cities study categorizes American districts into three development stages: established, growing, and emerging . These tiers are determined by various metrics, including population and job density, growth rate, and assessed land value per square mile. Though it is the largest employment center in the state of Louisiana, and in categories such as employment density and share of citywide jobs, aligns more closely with established tier downtowns, downtown New Orleans does not yet have the population density, share of citywide residents, and property values to match. Therefore, for the purposes of this analysis, downtown New Orleans ranks in the emerging tier.
Downtown New Orleans plays a pivotal role in the economy of the city — and, indeed, the entire South. Despite occupying less than 1% of the city's total land, this compact area was home to 44,765 primary employees in 2021, representing 28% of all jobs in the city for a share that’s significantly higher than the average emerging downtown. Downtown New Orleans also hosts more than half of the city’s office spaces, underscoring its importance in driving the local economy.
A global destination for tourism, downtown New Orleans features more than 22,000 hotel rooms across 115 hotels, ranking second only to Waikiki, Honolulu, Hawaii. It attracts foodies and shoppers, generating retail sales of $519 million per square mile, nearly 14 times the city-parish average. It also hosts major events — from annual celebrations like Mardi Gras and the Essence Festival of Culture to concerts and sporting events — which draw large crowds downtown. Downtown has continued a strong post-pandemic tourism recovery, from a low of 4.1 million visitors in 2020 to 6.9 million visitors in 2023. Downtown tourism significantly impacts the region, contributing 35% of sales tax revenue and 8.5% of appraised property value, with downtown land valued at over ten times that of similar land elsewhere in Orleans Parish.
Despite its economic significance, downtown has a small residential population of 3,882, just 1% of the city's total. Consequently, it has a density of residents per acre that is less than half that of a typical emerging downtown.
ALBUQUERQUE
BATON ROUGE
BIRMINGHAM
CLEVELAND
COLORADO SPRINGS
CORPUS CHRISTI
EL PASO
EVANSVILLE
GRAND RAPIDS
HOLLYWOOD
LANCASTER
LITTLE ROCK
NEW ORLEANS
NORFOLK
OKLAHOMA CITY
SAN ANTONIO
MARKET VALUE PER SQUARE MILE
PERCENT OF CITYWIDE ASSESSED REVENUE
CITYWIDE POPULATION
CITYWIDE 25-34 LIVING IN DISTRICT
RESIDENTS WITH A BACHELOR’S DEGREE OR HIGHER
However, in an encouraging sign, downtown New Orleans has experienced nearly 50% growth since 2000, compared to a 28% growth in emerging downtowns. More recently, Census data shows a slower growth rate of 2.6% from 2018 to 2022, possibly due to the high demand for short-term rentals for visitors, which has limited the availability of housing. Consequently, downtown rents are significantly higher, averaging $1,962 per unit in 2023. The high cost of living is a concern, with 43% of downtown households earning over $100,000, contrasting with the citywide average of 27%. At approximately $75,000, the median household income is more than $30,000 higher than in typical emerging downtowns.
BIKE SCORE
81 49 TRANSIT SCORE DOWNTOWN
Downtown New Orleans is less racially diverse than the rest of the city, with 60% of its residents identifying as White, nearly double the city's 31%. Still, downtown is about as diverse as the typical emerging downtown as measured by the Diversity Index, which measures the likelihood of two randomly selected residents having different racial or ethnic backgrounds. Racial diversity has increased since 2010, with the number of Black or African American residents more than doubling, and significant increases in Asian, Pacific Islander, and Hispanic or Latino populations. These groups, although still small in number, represent a positive trend towards greater diversity in the downtown area.
87 70
HOTELS
HOTEL ROOMS
Note:
DOWNTOWN
115
22,399
14 3,116
Economic and environmental challenges have shaped downtown New Orleans over the years. Post-Hurricane Katrina, downtown has not fully regained the approximately 60,000 jobs it had prior to 2005. The COVID-19 pandemic further impacted the city's recovery, especially in the accommodation and food service industry. In 2019, this sector employed 13,936 people, but by 2021, it had dropped by 53% to 6,554 employees, falling from the top to the third largest downtown employer. Despite these setbacks, downtown New Orleans shows resilience with plans for new office spaces and strong expectations for the group travel industry in 2024 and 2025, indicating a robust recovery.
Considering these advantages, downtown New Orleans is poised for continued success in future years as an emerging downtown. Its heavy tourism presence and its significant share of citywide jobs will help ensure that it maintains a strong foothold as a key cultural and economic hub.

APPENDICES
PROJECT
METHODOLOGY
PRINCIPLES AND BENEFITS
DATA SOURCES
SELECTED
STUDY
DEFINITIONS
ADDITIONAL IDA SOURCES
BIBLIOGRAPHY

In 2017, IDA launched the Value of U.S. Downtowns and Center Cities study. IDA staff and the IDA Research Committee worked with the initial group of 13 downtown organizations, Stantec’s Urban Places as a project advisor, and HR&A as an external consultant to develop the valuation methodology and metrics. Since 2017, IDA has added over 40 more downtowns or urban districts to the study database, and worked with their respective urban place management organizations (UPMOs) to collect local data, obtain data from agencies in their cities, and combine these metrics with publicly available statistics on demographics, economy, and housing. Data collected included publicly available census fi gures (population, demographics, employment, transportation), downtown economic performance, municipal fi nances, capital projects, GIS data, and the local qualitative context. The 54 total downtowns and urban districts studied to date represent diverse geographic regions and have relatively comparable levels of complexity and relationships to their respective cities and regions.
Guiding questions for this project included:
• What is the economic case for downtowns? What stands out about land values, taxes, or city investments?
• How do downtowns strengthen their regions?
• Can we standardize metrics to calculate the value of a downtown?
• How can downtowns measure their authentic, cultural and historical heritage?
• How does the diversity of a downtown make it inclusive, inviting, and accessible for all?
• What inherent characteristics of downtown make it an anchor of the city and region?
• Due to its mix of land-uses, diversity of jobs, and density, is downtown more socially, economically, and environmentally resilient than the rest of the city and region?
The project measured the performance of U.S. downtowns using metrics developed collaboratively and organized under five principles that contribute to a valuable urban center. This study:
• Provides a framework of principles and metrics to guide data collection for evaluating the value of downtowns and center cities.
• Standardizes key metrics for evaluating the economic, social, cultural and environmental impacts of American downtowns.
• Develops an industry-wide model for calculating the economic value of downtowns, creating a replicable methodology for continued data collection.
• Provides individual analysis and performance benchmarks for participating downtowns in this standardized framework, including supplemental qualitative analysis.
• Empowers and continues to support IDA members’ economic and community development efforts through comparative analysis.
While this study aims to provide a comprehensive quantification of the value of downtowns, there are still several limitations to our approach. Not all local sources consistently collect the same data, or collects it in the same way, which hinders our ability to make comparisons between downtowns. In some cases, the data we ask for simply does not exist or has not been collected on the relatively small scale of census tracts or downtown sub-area. This makes it challenging to rely on local data for analysis and can result in some missing pieces in our narrative. Our most recent data also comes predominantly from the 2022 American Community Survey (ACS), the 2021 Longitudinal Employer-Household Dynamics (LEHD) On the Map tool, and ESRI Business Analyst. Due to the lag in data availability,
some metrics may not align with more recent data from local downtown, municipal, or proprietary sources. This will be especially true in coming years as the recovery in employment following the COVID-19 pandemic will not be fully observed in our data sources for a few years.
Finally, citywide context plays a large role in the analysis. Significant variance in overall city size (from Hartford’s 18 square miles to Oklahoma City’s 606) can skew comparisons of the proportion of citywide jobs or population in different districts. However, since downtowns operate within the context of their city, understanding the proportion of jobs, residents, and other metrics as a percentage of their cities still provides an important perspective on a downtown’s contribution to its city and region.
Downtowns have differing strengths: some function as employment anchors, some as tourist hubs, and some as neighborhood centers. Some are all three. We distilled the factors for measuring the value from attributes common to all downtowns regardless of their specific characteristics. These included fun, diversity, density, creativity, size, economic output, mobility, brand, investment, resiliency, health, sustainability, affordability, fiscal impact and accessibility.
This project began with a Principles and Metrics Workshop held in 2017 with representatives of UPMOs from the 13 pilot downtowns. The workshop focused on developing value principles that collectively capture a downtown’s multiple functions and qualities, and its contributions to the city and region. Through this discussion, the participants grouped the value principles into five categories, which provided the basis for determining benchmarking metrics.
Downtown advocates tailor their arguments to the interests of different audiences. For instance, within the economy argument, the figure for sales tax revenue generated downtown would have resonance for government officials but likely wouldn’t hold much interest for visitors and workers. For these audiences, a UPMO might assemble data showing the types of retail available downtown, whether the offerings meet user needs, and how fully residents, workers, and visitors use these retail establishments. The study team sought arguments that would appeal to multiple audiences and worked to identify metrics that could support multiple value statements. The workshop identified these value statements:


1. Downtowns are typically the economic engines of their regions due to a density of jobs, suppliers, customers, professional clusters, goods, and services.
2. Downtowns offer convenient access to outlying markets of residents, customers, suppliers, and peers thanks to past and ongoing investment in transportation infrastructure.
3. Downtowns provide a concentration of culture, recreation, and entertainment.
4. Downtowns offer choices for people with different levels of disposable income and lifestyle preferences.
5. Because of their density and diversity, downtowns encourage agglomeration, collaboration, and innovation.
6. Downtowns are central to the brand of the cities and regions they anchor.
7. Downtowns can be more economically and socially resilient than their broader regions.
8. Downtown resources and urban form support healthy lifestyles.
9. Downtowns’ density translates into relatively low percapita rates of natural resource consumption.
10. Relatively high rates of fiscal revenue generation and efficient consumption of public resources mean that downtowns yield a high return on public investment.
To meet the goal of providing metrics that allow comparisons across jurisdictions, we made sure necessary comparison data was available for every (or almost every) downtown, city, and region. Data would ideally be:
1. Readily available to most downtown management organizations (and ideally public).
2. Replicable (enabling year-to-year comparisons), and
3. Scalable across jurisdictions, allowing for benchmarking and regional comparisons.
Specifically, we were reliably able to obtain metrics like population, employment, or assessed value – less reliably obtaining downtown visitors, hotel tax revenue. For this reason, our comparisons across jurisdictions focus on those more commonly available metrics.
We expect most downtowns to rely on similar sources of proprietary data, but participating downtowns may prefer one choice over another when obtaining similar data on metrics like commercial real estate (e.g. Colliers vs CBRE). To the extent possible, instructions provide that data sources remain consistent across geographic scales (downtown, city, region) and consistent over time for longitudinal analysis.
Metrics and comparisons are analyzed to develop value statements of the downtown or district. Three types of data fully illustrate each argument:
1. Absolute facts provide quantitative context and a feel for the scale of the characteristic being used to make the argument.
For example, under economy, a UPMO might want to make the argument that a thriving financial services sector plays a critical role in the city’s economy. The number of financial services jobs, the share of the city’s financial services jobs located downtown, and number/ list of large financial services companies headquartered downtown will help make the case that downtown has great importance to that sector and therefore the city.
2. Indicators measure an argument at a secondary level by focusing on inputs or outputs and may reflect the subject geography or serve as benchmarks for comparison to peer downtowns or case studies of best practices.

At this level, a UPMO could argue that their financial services sector is healthy and thriving. Comparisons to the growth of this industry sector in other downtowns, or concentration of financial services jobs relative to other downtowns would highlight the strength of their downtown’s appeal to the financial services sector.
3. Qualitative assessments inject anecdotal context and color into an argument.
For this level, the UPMO could include news reports of new financial services companies choosing to place offices downtown. An interview with a company executive on why they chose to locate downtown would also be a powerful anecdote on downtown’s appeal.
Together, these different types of information allow IDA and the UPMO to communicate downtown’s unique value to the city.

This study developed a definition of the commercial downtown that moved beyond the boundaries of a development authority or a business improvement district. For one thing, geographic parameters vary across data sources and may not align with a UPMO’s jurisdiction.
Urban place management organizations vary widely in terms of their geographic definition. To make boundaries replicable and comparable across data sources, the study team recommended aligning each downtown with commonly used census boundaries. In most cases this meant using census tracts, the smallest permanent subdivisions that receive annual data updates under the American Community Survey. They make ideal geographic identifiers, since new data is released regularly, and tract boundaries are only adjusted once every 10 years.
Employing census tracts may not accurately reflect the value of every downtown. In some cases, census block groups more accurately captured the downtown boundaries. Though the Census Bureau subdivides or combines block groups with each decennial census, block groups also receive annual data updates and are compatible with most data sources. We looked to the 2012 publication, The Value of Canadian Downtowns, for effective criteria:
1. The downtown boundary had to include the city’s financial core.
2. The downtown study area had to include diverse urban elements and land uses.
3. Where possible, we sought hard boundaries such as major streets, train tracks, or geographic features like rivers.
4. An overarching consideration was that data compiled align with selected downtown study areas.
Each downtown provided IDA with the geography selection for its downtown, which IDA then worked to refi ne, given local conditions and UPMO needs. Customized shapefi les or census tracts defi ned the downtown boundaries. For city and regional boundaries, IDA worked with the downtown management organization to confi rm the accuracy of the respective censusdesignated place or MSA.
Both IDA and the local partner spend the fi rst phase of the project collecting data for the study. IDA collects data primarily from national databases (see Appendix 3 for data sources), and the local partner works with its data partners to obtain other locally-specifi c data. In instances where local data was not available, we allowed substitution or approximation for some metrics if clearly noted and explained.
After compiling the data, all the information is entered into an IDA database for analysis. Data is organized by metric, year, and geography for each district. This specialized tool also tabulates numerous ratios, percentages, changes, and comparisons used to inform the report. As an example, after plugging in employment and land area data the tool can calculate the following:
• Percent of citywide and regional jobs
• Percent of citywide and regional land area
• Percent total job growth between specifi ed years
• Percent job growth between specifi ed years broken out by industry
• Average jobs per square mile
• Percent of employment in knowledge industries
• Percent of citywide and regional knowledge jobs located downtown
• Share of employment by race
• Share of employment by age
• Share of workers living and working within the selected area
This analysis is applied across all years collected and all applicable geographies to inform trends over time and within larger contexts. The fl ow chart of inputs, calculations, and arguments demonstrates how we go from raw data to making arguments in the report. Research staff also use their expertise and knowledge of downtowns to highlight key trends and draw connections between local insights and the trends in the data.

• Total land area
• Number of jobs
• Jobs per mi² downtown vs. city (dividing jobs by total land area)
• Growth in jobs over time (comparing past totals to the current year)
• Percentage of city jobs (dividing downtown jobs by city jobs)
Based on the data collected for this study, we identifi ed three tiers of downtowns, defi ned by stage of development. We divided the 49 downtowns that have participated to date into “established”, “growing” and “emerging” tiers. Downtown fi gures were compared to study-wide medians on three themes:
• Density
o Jobs per square mile
o Residents per square mile
o Assessed value per square mile
• Signifi cance to city
o Percentage of citywide jobs
o Percentage of citywide residents
• Long-term growth
o Percent growth in jobs (2002–2021)
o Percent growth in population (2000–2022)
“As the economic engine of the city, downtown has a density of jobs nearly three times the city average, a rate of job growth twice the city average, and nearly 40 percent of total city jobs.”
Established – These downtowns have high proportions of their cities’ jobs and residents, are dense and highly valuable to their cities.
Growing – These downtowns have not yet hit a critical level of density and citywide signifi cance but are showing progress towards that critical mass. This group includes both larger downtowns with lower growth rates, and smaller downtowns with exceptional growth rates.
Emerging – These downtowns are a mixture of different sizes and growth rates, and are generally lower-density downtowns that have a low proportion of citywide signifi cance on jobs and residents. Because growth rates are examined 2000 to current, many downtowns that struggled during the recession had a harder time demonstrating signifi cant growth over the longer term despite encouraging growth in recent years.
The compendium report The Value of U.S. Downtowns and Center Cities: Third Edition has additional data on the performance of emerging, growing, and established tiers of downtowns.
ECONOMY: Within their regions, downtowns have substantial economic importance.
Downtowns and center cities are valuable due to their roles as economic anchors for their regions. As traditional centers of commerce, transportation, education, and government, downtowns and center cities frequently serve as hubs of industry and revenue generators despite only making up a small fraction of the land area. Downtowns support high percentages of jobs across many different industries and skill levels. Because of their relatively high density of economic activity, investment in the center city provides a greater return per dollar for both public and private sectors.

Illustrative metrics collected for comparison:
• Annual private investment
• Annual public investment
• Assessed value
• Average office vacancy rate
• Average Class A office rent
• Average Class B office rent
• Average Class C office rent
• Employment (primary jobs)
o By two-digit NAICS employment sectors
o By earnings
o By residence
o By demographics
• Hotel tax
• Income tax
• Incubator and co-working spaces
• Invested in construction projects
• Number of approved building permits
• Number of Fortune 1000 headquarters
• Office inventory
• Office space under construction
• Office square footage in pipeline (to be completed in three years)
• Property tax
• Parking tax
• Sales tax
INCLUSION: Downtowns invite and welcome all residents of the region (as well as visitors from elsewhere) by providing access to opportunity, essential services, culture, recreation, entertainment, and participation in civic activities.
As the literal and figurative heart of the city, downtowns welcome residents, employees, and visitors from all walks of life. Residents of strong downtowns often come from a wide range of racial, socioeconomic, cultural, and educational backgrounds, across all ages. This diversity ensures that as an inclusive place, it has a broad appeal to all users and a strong social fabric. Downtowns provide access to all to opportunity, essential services, culture, recreation, entertainment and civic activities.

Illustrative metrics collected for comparison:
• Average residential vacancy rate
• Demographics
• Diversity Index
• Employment diversity
• Foreign-born residents
• Homeless residents
• House value for owner-occupied housing units
• Households by income
• Median gross rent
• Median home price
• Median household income
• Rent-burdened residents
• Resident population
• Resident population by age
• Resident population by highest educational attainment
• Resident population by race and ethnicity
• Residential inventory
• Residential units in pipeline
• Residential units under construction
• Subsidized housing units
• Zillow median rental listing price by number of bedrooms
• Zillow median rental listing price per square foot by number of bedrooms
VIBRANCY: Thanks to a wide base of users, downtowns and center cities can support a variety of retail, infrastructure, and institutional uses that offer broad benefits to the region.
The ability of vibrant places to attract visitors and new residents, as well as a regionwide consumer base creates value. Vibrancy is the buzz of activity and excitement that comes with high-quality experiential offerings like breweries, restaurants, theatres, or outdoor events within a downtown creates an attraction and buzz. As the cultural center of their cities, downtowns typically attract a large share of citywide visitors and are the location of a large share of citywide hotels and hotel rooms. An engaging downtown “creates the critical mass of activity that supports retail and restaurants, brings people together in social settings, makes streets feel safe, and encourages people to live and work downtown because of the extensive amenities.”1

Illustrative metrics collected for comparison:
• Annual festivals/parades
• Average hotel occupancy rate
• Average retail rent
• Average retail vacancy rate
• Average visitor length of stay
• Convention centers
• Gyms and fitness studios
• Hotel rooms
• Hotels
• Outdoor events permitted by city
• Population
• Retail businesses (retail trade and food & drink)
• Retail Market Potential Index (ESRI MPI)
• Retail sales (retail trade and food & drink)
• Retail space in pipeline
• Retail space inventory
• Retail space under construction
• Theatres
• Venues with live entertainment
• Visitation by origin
• Visitors
IDENTITY: Downtowns preserve the heritage of a place, provide a common point of physical connection for regional residents, and contribute positively to the brand of the regions they represent.
Downtowns and center cities are often iconic symbols of their cities, and this strong sense of place enhances local pride. The authentic cultural offerings in downtown enhance its character, heritage, and beauty, and create an environment that is not easily replicable in other parts of the city. Combining community history and personal memory, a downtown’s cultural value plays a central role in preserving and promoting the region’s identity. Downtowns and center cities serve as places for regional residents to come together, participate in civic life, and celebrate their region, which in turn promotes tourism and civic society. Downtown preserves heritage, connects regional residents, and contributes positively to the regional brand.
Downtowns are “iconic and powerful symbols for a city and often contain the most iconic landmarks, distinctive features, and unique neighborhoods. Given that most downtowns were one of the oldest neighborhoods citywide, they offer rare insights into their city’s past, present and future.”2

Illustrative metrics collected for comparison:
• Convention attendees
• Conventions
• Farmers markets
• Libraries
• Locally designated historic districts
• Locally designated historic structures
• Media mentions
• Museums
• National Register of Historic Places districts
• National Register of Historic Places structures
• Number of followers on Facebook
• Number of followers on Twitter
• Number of posts with Instagram hashtag
• Parks and natural areas
• Playgrounds
• Plazas/squares/amphitheater or other public outdoor gathering spaces
• Postsecondary institutions
• Postsecondary students
• Primary and secondary schools (public and private)
• Public art installations
• Public pools
• Recreation and community centers, both public and private (e.g., YMCA)
• Religious institutions
• Sports stadiums
• Sports teams
RESILIENCE: Because of their diversity and density of resources and services, downtowns and their inhabitants can better absorb economic, social, and environmental, shocks and stresses.
As key centers of economy and culture, being resilient to city, regional, or even national shocks is highly important for ensuring stability, sustainability, and prosperity. Because of the diversity and density of resources and services, center cities and their inhabitants can better absorb economic, social, and environmental shocks and stresses than their surrounding cities and regions. The diversity and economic strengths of strong downtowns and center cities equip them to adapt to economic and social shocks better than more homogenous communities. Consequently, they can play a key role in advancing regional resilience, particularly in the wake of economic and environmental shocks that disproportionately affect less economically and socially dynamic areas.
Illustrative metrics collected for comparison:
• Acreage of open space
• Annual greenhouse gas emissions per household
• Average life expectancy
• Average property crime rate
• Average violent crime rate
• Bike Score
• Bike share stations
• Community gardens
• Commute mode for workers 16 and over
• Commute time for workers 16 and over
• Docked bikes
• Dockless bikes
• Electric car charging points
• Housing and Transportation Index
• LEED-certified buildings
• Miles of bike lanes
• No leisure-time physical activity among adults aged > 18
• Resident population in poverty
• Scooters
• Solid waste generation
• Transit Score
• Transit stops (including rail and bus)
• Unemployment rate
• Walk Score
NATIONAL DATA SOURCES FOR THE VALUE OF U.S. DOWNTOWNS AND CENTER CITIES
Source
ESRI Data Available
Demographic, Housing, Detailed Establishments, market potential, and Consumer Spending
Social Explorer
American FactFinder
LEHD On The Map
Demographic, Housing, Crime, Health
Demographic, Housing, Crime, Health, Employment, Economy
Labor: workers and firms
Pricing
Proprietary
Proprietary
Geographic Limitations
None; allows for drawing of custom geographies; selection of subgeographies down to census tracts
Allows for selection of subgeographies down to the census block group level
Allows for selection of subgeographies down to the census block group level
None; allows for drawing of custom geographies; selection of subgeographies down to census block group level
Most Recent Data Vintage in the Study
2017 to 2023 by data set (Annual Updates)
2022 (Annual Updates)
2022 (Annual Updates)
2021 (Annual Updates)
Center for Neighborhood Technology
National Register of Historic Places
Centers for Disease Control and Prevention
FBI National IncidentBased Reporting System
Geolounge
Zillow
Housing affordability, Sustainability, Income
Historic structures and districts
Life expectancy, physical inactivity and other health data
Crime Rates
Map of Fortune 1000 companies
Housing and rental costs
Allows for selection and exporting at as small as the block group level
2019 (Updates Unscheduled)
2024 (Annual Updates)
2021 (Annual Updates)
2022 (Annual Updates)
None
The smallest geographies are arbitrarily designated “neighborhoods” some of which line up with the study areas while others do not or do not exist. In these cases, we got as close as we could with a zip code
2022 (Unscheduled Updates)
April to June Annually (Monthly Updates)
Assessed value
Assessed value is the dollar value assigned to a property to measure applicable taxes. This fi gure is an aggregate for all property within the study area, or for the closest match to the study area for which data is available.
Acreage of open space
This fi gure is the total acreage of designated public spaces like parks or plazas; it does not include vacant lots.
Census block group
A block group is a statistical division of a census tract, generally defi ned to contain between 600 and 3,000 people, which is used to present data and control block numbering in the decennial census.
Census tract
A census tract is a small, relatively permanent statistical subdivision of a county or equivalent entity, updated by local participants prior to each decennial census.
Creative jobs
The study uses the NAICS industry sector of Arts, Entertainment, and Recreation to count creative jobs.
Development pipeline
Development pipelines include projects and developments very recently completed, currently under construction, and planned projects anticipated to be completed within the next three years.
Diversity Index
The Diversity Index is a measurement of the likelihood that any two randomly selected individuals will be of a different race or ethnicity. The closer to 100, the more likely they will be different, indicating diversity.
Employment
The study uses the LEHD on the Map tool to count “primary jobs.” Primary jobs differ from total jobs by designating the highest-wage job as the “Primary” one if an individual holds more than one job. This fi gure may not accurately refl ect less traditional types of employment like gig workers or small startups.
Event venue
Event venues include venues that are typically used for public events such as conferences, conventions, concerts, etc. (public access) As this metric is locally collected, it is somewhat subjective as the downtown has the fi nal say on, for example, if there is a local venue that is more private, but that is part of the fabric of the event community, that would be included.
Farmers markets
The number of farmers markets is a count of both permanent and seasonal farmers markets.
Greenhouse gas emissions
The Center for Neighborhood Technology’s Housing and Transportation Index includes an estimate of CO2 per household within a given area.
Housing and Transportation Index
The Housing and Transportation Index is a tool that measures how much the average household spends on housing and transportation relative to income. This fi gure demonstrates how urban places often have higher base rents, but much lower transportation costs. This index is produced by Center for Neighborhood Technology.
Knowledge jobs
Knowledge jobs consist of jobs in the NAICS industry sectors of: Information; Finance and Insurance; Real Estate and Rental and Leasing; Professional, Scientifi c, and Technical Services; Management of Companies and Enterprises; Health Care and Social Assistance.
Market Potential Index
ESRI Market Potential Index measures the likelihood of residents in a set area to spend money on specifi ed categories of goods and services, indexed to a national average. Values below 100 indicate a below average demand from residents in the area, and above 100 an above average demand.
Media mentions
This study sometimes utilizes independent sources to add nuance to the data. Forbes’ list of top 100 metro areas to start a new business is an example of this type of source. Another example might be a travel blog praising restaurants or entertainment options within the downtown. While not always quantitative sources, these media mentions add color and perspective to the report.
Middle-class
This study defi nes middle-class as 67% to 200% of area median income. This range was calculated for each downtown based on the median income of the region.
Millennial
This study defi nes residents between the ages of 18 and 34 as millennials.
No leisure-time physical activity
Presented as a percentage, no leisure-time physical activity is the share of residents within the geography who have not engaged in physical activity in their spare time within the past month from the time surveyed.
Private investment
Private investment is defi ned as the amount money from private sources is being invested in development. This fi gure is sometimes replaced by a sum of the largest development projects within the study area.
Public art installations
Public art installations counted can be owned by either public or private entities, be temporary or permanent installations, but are easily accessible by the general public.
Public investment
Public capital investment is open for defi nition by the specifi c downtowns but should generally include municipal, state, and federal investment in capital projects downtown (i.e. open space, infrastructure). If only a specifi c bucket of public investment is available for measurement (i.e. municipal public investment), this can be measured and footnoted in the profi les in lieu of capturing the entire amount.
Rent-burdened
Households paying more than 30% of their income to rent are considered rent-burdened.
Retail demand
Retail demand is a measure of the total spending potential of an area’s population, as determined by residential population and household income characteristics. 3
Retail sales
Retail sales is a measure of the total sales by businesses within the observed geography. All estimates of market supply are in nominal terms and are derived from receipts (net of sales taxes, refunds, and returns) of businesses that are primarily engaged in the retailing of merchandise. Excise taxes paid by the retailer or the remuneration of services are also included, for example, installation and delivery charges that are incidental to the transaction. 4
Sales to non-residents is a calculated estimate using the retail demand and sales fi gures to determine how much of downtown’s retail sales are to people who do not live within the downtown. Simply put, retail sales – resident retail demand = sales to non-residents.
Sports teams
The number of professional teams within the geography. This fi gure does not include college teams.
IDA’s Vitality Index, powered by Stantec (2019): The IDA Vitality Index, powered by Stantec, is an interactive, online tool to benchmark the vitality of downtowns across the U.S. The Vitality Index reflects the pioneering IDA research in The Value of U.S. Downtowns and City Centers, and measures vitality through three principles identified in the VODT study: economy, inclusion, and vibrancy. Through these three principles, and five core indicators in each principle, the Vitality Index aims to capture the pulse of the downtown and enable urban place managers to objectively quantify and benchmark their district’s performance metrics among peer cities. The index utilizes a benchmarking system to understand how each of three vitality principles contribute to an overall combined score, calculated by comparing each metric to the national average. Most valuable, the index serves as a baseline and provides insights for the strategic evolution of a community.
Quantifying the Value of Canadian Downtowns: A Research Toolkit (2016): This toolkit represents a groundbreaking effort to provide a common set of data and processes that will help Canadian place management organizations, such as BIAs/BIDs, establish and sustain evaluation and compare progress among downtowns. While geared toward Canadian downtowns, the toolkit has value for urban districts outside of Canada looking to move toward data standardization and best practices. In the toolkit, organizations will find directions and insights on collecting, organizing, storing, and presenting downtown-specific data to make the case for continued investment and support. The toolkit includes instructions and rationale for the choice of data metrics, and it recommends core, trend and pulse metrics. The kit organizes the core indicators around the principles of visibility (unique identity, brand, definition); vision (leadership, planning, collaboration); prosperity (economic data); livability (residential and uses); and strategy (types and values of public investment). The core indicators are population density (downtown/city); job density (downtown/city); number of new commercial, residential, and mixed-use buildings; current value assessment of downtown properties (commercial, residential, institutional); capital
investment (downtown/city); transportation modal split; number of large-format grocery stores; amount invested in parks and public realm; and number of annual cultural events and festivals.
The Value of Investing in Canadian Downtowns (2013): This study provides an extensive portrait of the contributions made by downtown areas across Canada, highlighting innovative approaches to revitalization and efforts being applied across the nation. It builds on an initial study phase, completed in 2012, that examined ten of those downtowns, and tracks population, population density, job density and average block size of the downtown core and the municipality. The study organized data under visibility, vision, prosperity, livability and strategy.
Defining Downtowns–Downtown Rebirth: This policy paper represents the culmination of a year-long effort by IDA and partners to develop an effective way of quantifying how many people and work in and around 231 job centers in 150 American cities. Without standard geographic definitions for downtowns and downtown residential neighborhoods, previous research relied on overly simplified boundaries that didn’t capture the idiosyncratic shapes of urban employment nodes and thus failed to capitalize fully on existing federal data. For the first time, Downtown Rebirth suggests a way both to define and quantify downtown workforce and population numbers and document how these employment hubs and live-work environments are changing.
The Value of U.S. Downtowns & Center Cities study expands on the efforts of IDA’s “Downtown Rebirth: Documenting the Live-Work Dynamic in 21st Century Cities” study, which provided guidelines for selecting downtown boundaries. This study uses these recommendations to define downtown beyond the boundaries of a district management organization using a definition of downtown commonly understood by those in that community. For a small sample of downtowns in this study, IDA also expands upon and updates the data from the Downtown Rebirth report.
Section One
1 Downtowns Rebound: The Data Driven Path to Recovery. Philadelphia, PA: Center City District, 2023.
REFERENCES
Section Two
1 International Downtown Association (2016). Activating Public Space Council. Activating Public Spaces: A Guidebook for Urban Districts, p.9.
2 Ernest N. Morial New Orleans Exhibition Hall Authority Takes Steps to Develop a Headquarters Hotel. MCNCO.Com. https://mccno.com/ernest-n-morial-new-orleans-exhibition-hall-authority-takes-steps-to-develop-a-headquarters-hotel/
3 Kitsinger, Andy (September 2013). “A Healthy Downtown is Key to a Strong Community.” Planners Web: Downtowns & Main Streets. Retrieved June 20, 2020 from http://plannersweb.com/2013/09/healthy-downtown-key-strong-community/
1 International Downtown Association. Activating Public Space: A Guidebook for Urban Districts. 2016 IDA Top Issues Councils Report. 2016, p.19.
2 Kitsinger, Andy. “A Healthy Downtown is Key to a Strong Community,” Planners Web: Downtowns & Main Streets. 2013, http://plannersweb.com/2013/09/healthy-downtown-key-strong-community/
3 Methodology Statement: 2017 Esri Retail MarketPlace. (2019, June). Retrieved from https://downloads.esri.com/esri_content_doc/dbl/us/J9675-US_Retail_Marketplace_2017_in_2019_geography.pdf
4 Methodology Statement: 2017 Esri Retail MarketPlace. (2019, June). Retrieved from https://downloads.esri.com/esri_content_doc/dbl/us/J9675-US_Retail_Marketplace_2017_in_2019_geography.pdf
Cover
Downtown Dallas, Inc. (2020). Changing Perspectives Block Party. Dallas, TX
Adam Alexander. (2021). Walkers along water. Chicago, IL
Page 4
Howen, Bob. (2017). La Antorcha de la Amistad. San Antonio, TX.
Page 6
Downtown Cleveland Alliance. (2018). Guardians of Transportation. Cleveland, OH.
Page 8
City of Albuquerque. (2021). Albuquerque skyline. Albuquerque, NM.
Section 2
Shutterstock.com. New Orleans, LA
Page 46
Downtown Grand Rapids, Inc. (2017). Public Park. Grand Rapids, MI.
Page 47
Ann Arbor Downtown Development Authority. (2018). Store fronts. Ann Arbor, MI.
Page 48
BLVD Association. (2017). Lancaster Museum of Art and History. Lancaster, CA.
Page 49
Downtown Tempe Authority. (2014). Mill Ave—Woman standing in front of bike mural. Tempe, AZ.
Page 50
Downtown Tucson Partnership. (2017). All Souls Event on Streetcar. Tucson, AZ.
Page 51
Charlotte Center City Partners. (2017). 7th Street Public Market. Charlotte, NC.
Page 52
Downtown Huntsville, Inc. (2019). People having a picnic. Huntsville, AL.
Page 54
CVB, Ian Curcio. (2018). AC Hotel at night. Spartanburg, SC.
Page 55
Downtown Greensboro, Inc. (2018). Bike riders. Greensboro, NC.
Page 56
Downtown Indy, Inc. (2018). Highland Park. Indianapolis, IN.
Page 57
El Paso Downtown Management District. (2018). Skateboarder. El Paso, TX.
Page 58
Downtown Cleveland Alliance. (2018). Downtown bike share Cleveland, OH.