16
Downtown Ithaca Annual Report 2021
downtownithaca.com
COMMUNICATIONS 2 0 2 1 - 2 0 2 2
D
O
W
F A L L / W I N T E R
N
T
O
W
2 0 2 2
N
D
ITHACA G
U
I
D
E
&
M
A
SOCIAL MEDIA INSIGHTS
S P R I N G / S U M M E R
O
W
N
T
O
W
17
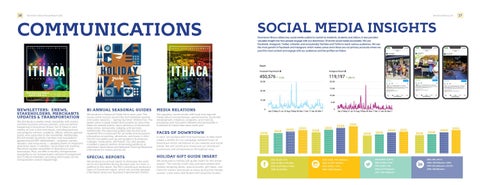
Downtown Ithaca utilizes key social media outlets to market to residents, students and visitors. It also provides valuable insight into how people engage with our downtown. Of all the social media accessible, We use Facebook, Instagram, Twitter, LinkedIn, and occasionally YouTube and TicTok to reach various audiences. We see the most growth in Facebook and Instagram, which makes sense since these are our primary accounts where we post the most content and engage with our audiences and the profiles we follow.
N
ITHACA G
P
U
I
D
E
&
M
A
P
DOWNTOWN
ITHACA DOWNTOWN
ITHACA
MAKING BUSINESS SAFE FOR ALL D
I
N
I
N
G
•
S
H
O
P
P
I
N
G
•
E
V
E
N
T
S
NEWSLETTERS: ENEWS, STAKEHOLDERS, MERCHANTS UPDATES & TRANSPORTATION We distribute a weekly email newsletter with events, member business announcements, and promotions happening in Downtown Ithaca. Our E-News is sent weekly to over 5,000 individuals, including business and property owners, residents, offices, and the general public who subscribe to the newsletter. Additionally, the DIA emails Quarterly member mail newsletters geared toward BID stakeholders —property owners, retailers, and restaurants — updating them on important downtown news. In addition, we provide a bi-monthly Merchant Update newsletter to downtown’s 200+ businesses. Plus, we offer a monthly transportation newsletter to our transportation demand management (GO ITHACA) members, providing information on the transportation world’s happenings.
D
I
N
I
N
G
•
S
H
O
P
P
I
N
G
•
E
V
E
N
T
S
BI-ANNUAL SEASONAL GUIDES
MEDIA RELATIONS
We produce a Seasonal Guide twice each year. The issues come out just around the turn between warmer and cooler seasons — Spring/Summer, Winter/Fall. The guide varies in page length and contains an area map, dates for special events, and a directory of downtown retail stores, restaurants, lodging, and services. Additionally, the seasonal guides help tourists and residents find a restaurant for all tastes and occasions, information on parking, attractions, and more. In 2021, the DIA circulated over 35,000 guides to businesses, colleges, restaurants, and hotels. Our 2021 guides included a special section showcasing products at downtown retail stores and featured Covid-19 Response information for visitors and locals.
We regularly communicate with local and regional media about our businesses, special events, economic development, initiatives, programs, and more by producing over 100 press releases and participate in hundreds of media interviews each year.
FACES OF DOWNTOWN In 2021, we worked with nine businesses to help them create a profile for our campaign dubbed Faces of Downtown which we feature on our website and social media. We will continue to showcase our downtown businesses and entrepreneurs throughout 2022.
SPECIAL REPORTS
HOLIDAY GIFT GUIDE INSERT
We produce our annual report to showcase the work we’ve accomplished during the past year. For 2022, in addition to this report, the DIA is planning to produce a State of Downtown report, which will provide detailed information about our Business Improvement District.
We produced a holiday gift guide insert for the winter season. This holiday insert was jammed packed with holiday shopping deals, special events, gift ideas, and more for visitors and locals to enjoy during the holiday season. 2,500 were distributed with Seasonal Guides.
2018 LIKES LIKES LIKES LIKES LIKES LIKES LIKES
2019 LIKES LIKES LIKES LIKES LIKES LIKES LIKES LIKES
2020 LIKES LIKES LIKES LIKES LIKES LIKES LIKES LIKES
2021 LIKES LIKES LIKES LIKES LIKES LIKES LIKES LIKES LIKES
2018
FOLLOWERS FOLLOWERS FOLLOWERS FOLLOWERS FOLLOWERS FOLLOWERS FOLLOWERS FOLLOWERS FOLLOWERS FOLLOWERS FOLLOWERS FOLLOWERS
2019 FOLLOWERS FOLLOWERS FOLLOWERS FOLLOWERS FOLLOWERS FOLLOWERS FOLLOWERS FOLLOWERS FOLLOWERS FOLLOWERS FOLLOWERS FOLLOWERS
2020 FOLLOWERS FOLLOWERS FOLLOWERS FOLLOWERS FOLLOWERS FOLLOWERS FOLLOWERS FOLLOWERS FOLLOWERS FOLLOWERS FOLLOWERS FOLLOWERS FOLLOWERS
2021 FOLLOWERS FOLLOWERS FOLLOWERS FOLLOWERS FOLLOWERS FOLLOWERS FOLLOWERS FOLLOWERS FOLLOWERS FOLLOWERS FOLLOWERS FOLLOWERS FOLLOWERS FOLLOWERS
FOLLOWERS FOLLOWERS FOLLOWERS FOLLOWERS FOLLOWERS FOLLOWERS FOLLOWERS FOLLOWERS FOLLOWERS FOLLOWERS FOLLOWERS FOLLOWERS FOLLOWERS FOLLOWERS FOLLOWERS FOLLOWERS FOLLOWERS FOLLOWERS
2018
FOLLOWERS FOLLOWERS FOLLOWERS FOLLOWERS FOLLOWERS FOLLOWERS FOLLOWERS FOLLOWERS FOLLOWERS FOLLOWERS FOLLOWERS FOLLOWERS
2019
FOLLOWERS FOLLOWERS FOLLOWERS FOLLOWERS FOLLOWERS FOLLOWERS FOLLOWERS FOLLOWERS FOLLOWERS FOLLOWERS FOLLOWERS FOLLOWERS FOLLOWERS FOLLOWERS FOLLOWERS FOLLOWERS FOLLOWERS FOLLOWERS
2020
FOLLOWERS FOLLOWERS FOLLOWERS FOLLOWERS FOLLOWERS FOLLOWERS FOLLOWERS FOLLOWERS FOLLOWERS FOLLOWERS FOLLOWERS FOLLOWERS FOLLOWERS FOLLOWERS
2021
FOLLOWERS FOLLOWERS FOLLOWERS FOLLOWERS FOLLOWERS FOLLOWERS FOLLOWERS FOLLOWERS FOLLOWERS FOLLOWERS FOLLOWERS FOLLOWERS FOLLOWERS FOLLOWERS FOLLOWERS FOLLOWERS FOLLOWERS FOLLOWERS
2018
FOLLOWERS FOLLOWERS FOLLOWERS FOLLOWERS FOLLOWERS FOLLOWERS FOLLOWERS FOLLOWERS FOLLOWERS FOLLOWERS FOLLOWERS FOLLOWERS
2019
FOLLOWERS FOLLOWERS FOLLOWERS FOLLOWERS FOLLOWERS FOLLOWERS FOLLOWERS FOLLOWERS FOLLOWERS FOLLOWERS FOLLOWERS FOLLOWERS FOLLOWERS FOLLOWERS FOLLOWERS FOLLOWERS FOLLOWERS FOLLOWERS
2020
FOLLOWERS FOLLOWERS FOLLOWERS FOLLOWERS FOLLOWERS FOLLOWERS FOLLOWERS FOLLOWERS FOLLOWERS FOLLOWERS FOLLOWERS FOLLOWERS FOLLOWERS FOLLOWERS
2021
2021: 22,326 +2 %
2021: 11,730 +9% followers
2021 8,880 +0.84%
2021: 306 +39.72
2020: 21,966 +1.6% likes
2020: 10,791 +19.92% |
2020: 8,806 +3.6%
2020: 259 followers +28%
2019: 21,619 likes | +4.8%
2019: 8,998 | + 19%
2019: 8,502 + 3%
2019: 202 followers +20.2%
2018: 20,632 likes
2018: 7,582 followers
2018: 8,273 followers
2018: 168 followers
2017: 7,907 followers


