Population
Downtown
Real


Population
Downtown
Real
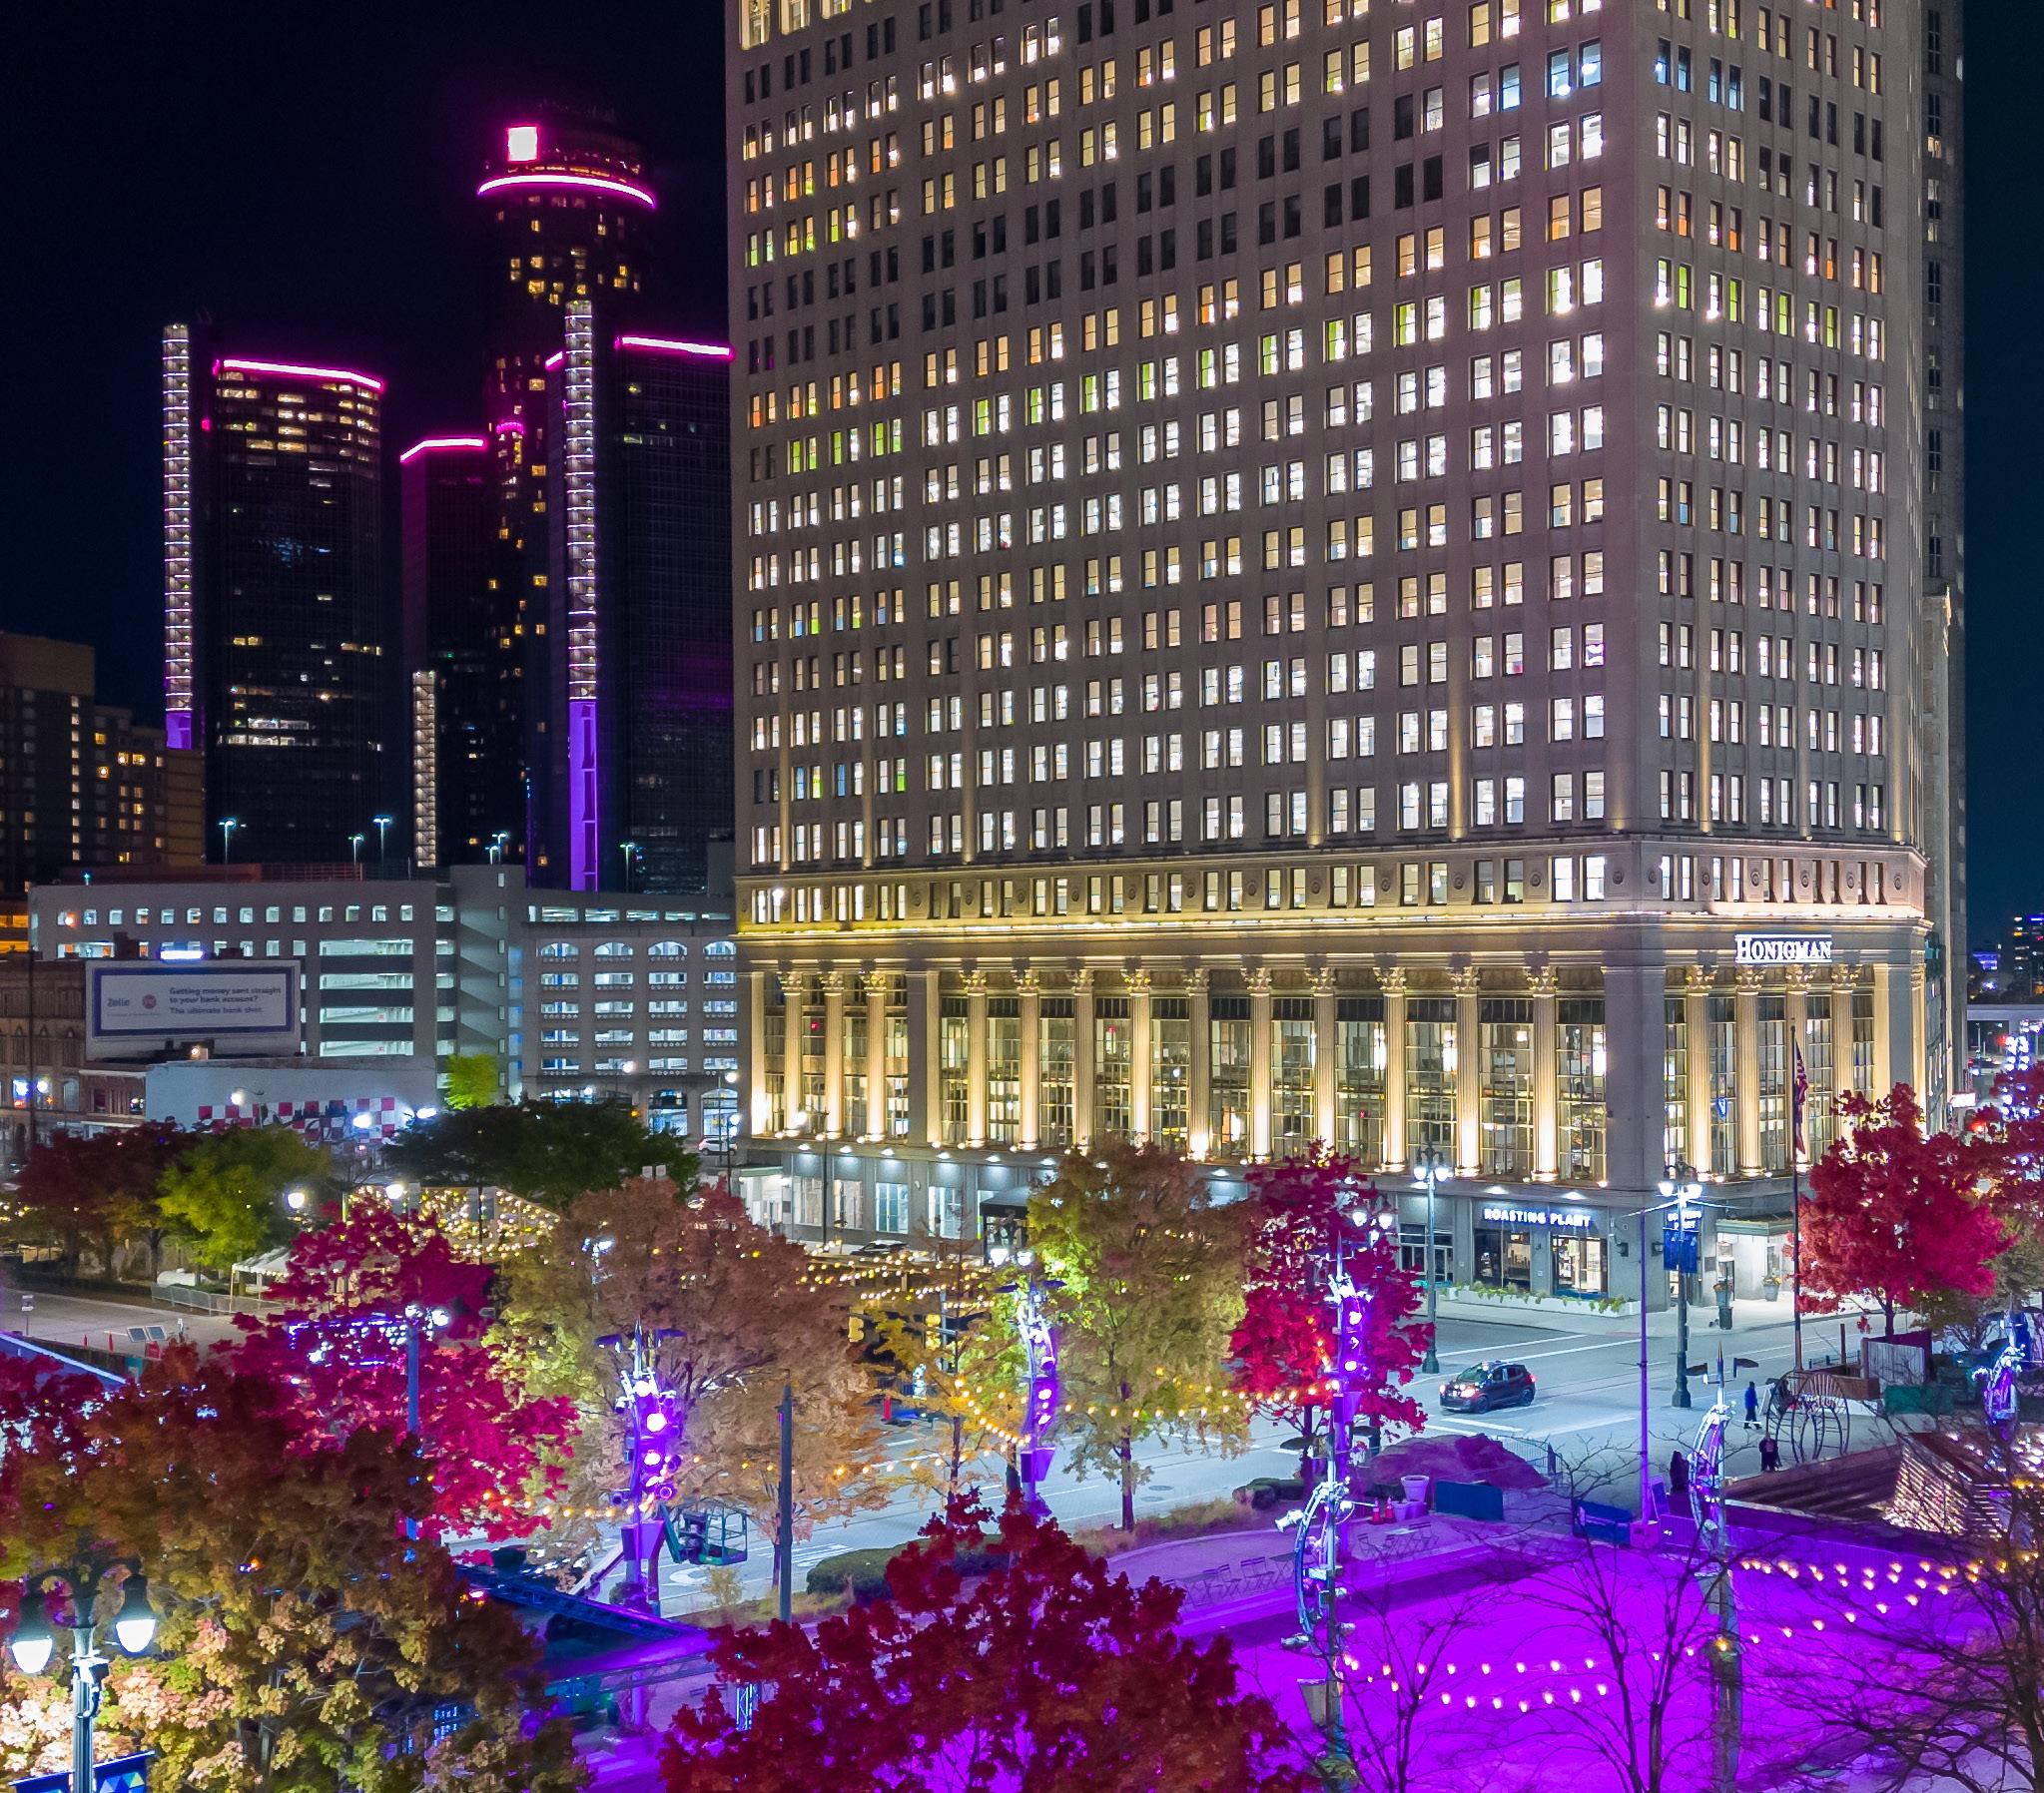
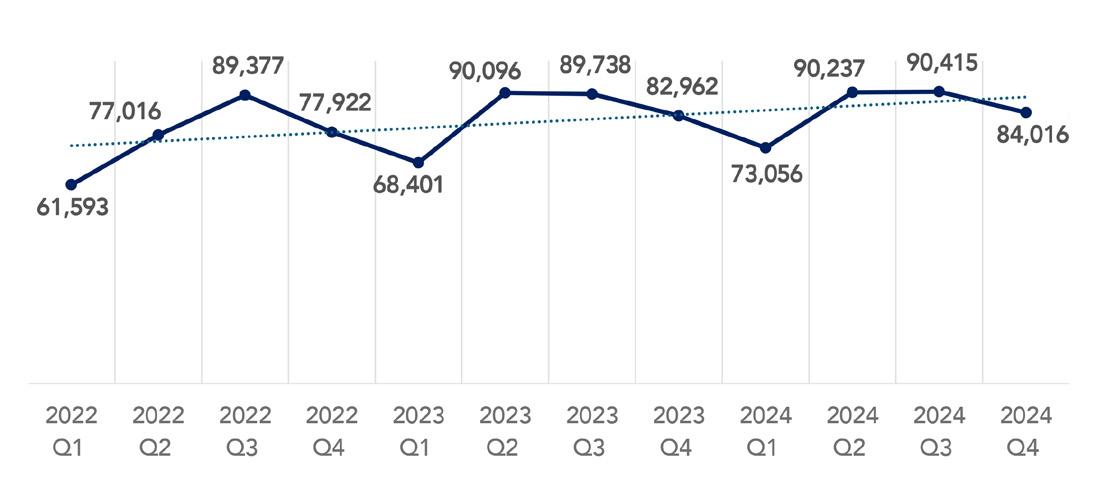
In 2024, Downtown Detroit recorded 6.3 million visits, averaging 84,446 daily. A July 13 event drew a peak of 239,033 visits. Q4 visits rose 1.2% from 2023, with major events like the Thanksgiving Parade and Lions game boosting attendance. Since 2021, daily visits have grown 35%.
Visitor traffic peaks in warmer months, largely driven by Downtown parks and the more than 2,000 free programs curated by the DDP. While Q1’s lower numbers reflect seasonal impacts, late-year declines were offset by The Rink at Campus Martius Park presented by Visit Detroit, DDP’s Annual Tree Lighting presented by DTE Foundation, and other holiday events, which indicates sustained attraction to Downtown.
Total of Visitors: Notable Events
Source: Placer.ai, compiled by Downtown Detroit Partnership.
6.3 M
Visitors (2024)
84,446
Avg.
visits (2024)
239,033
In 2024, Downtown Detroit’s average asking rent remained stable at $2.29 per sq. ft., despite a substantial new luxury apartment inventory. Apartments within the Downtown Detroit Business Improvement Zone averaged $1,844 monthly for a one-bedroom unit (738 sq. ft.). Q4 2024 saw a notable vacancy rate of 25.1%.
Stable rental prices reflect steady overall demand. However, high vacancy rates, largely driven by recent luxury developments, could put downward pressure on prices for newer units. Given that only 34% of residents earn above $100,000 annually—the income required to comfortably afford current Downtown rents—new projects might need to strategically adjust pricing or offer incentives. Broader market adjustments remain uncertain due to Downtown’s concentration of higher-income households.
Total
In 2024, the average Downtown Detroit rent ($1,844/month) represented 30.5% of regional median household income. Single-person households, comprising 76% of Downtown residents, face affordability pressures – not being able to comfortably rent a one-bedroom apartment without cost burden.
Current rental prices outpace affordability thresholds for median-income residents, particularly singles. While Downtown remains attractive to highincome individuals, affordability remains a challenge for the majority of those seeking housing in the Downtown —especially single-person households. To support a more inclusive residential base, future developments can benefit from diversifying unit types and exploring pricing strategies that align more closely with Downtown’s evolving demographic profile.
Downtown Residents
Estimated Affordable Rent (Houshold Median Income)
$1,222 per month
Estimated Affordable Rent (Individual Median Income) $1,115 per month
34% of the downtown population earns more than $100,000 annually
Detroit Region Residents (MSA)
Estimated Affordable Rent (Houshold Median Income) $1,270 per month
Estimated Affordable Rent (Individual Median Income) $768 per month
Source: U.S. Census, American Community Survey, 2023 5-yr
37% of the regional population earns more than $100,000 annually
Earning over $100K annually is necessary to avoid cost burden when renting a one-bedroom and one bathroom apartment in Downtown Detroit today.
13%
Percent of income spent on transportation (Center for Neighborhood Technology, 2025)
45%
Percent of households spending more than 30% of income on rent
(ACS, compiled by Downtown Detroit Partnership)
$1,844
Monthly rent cost (CoStar Group 2025)
$22,128
Average annual rent Downtown (CoStar Group 2025)
30.5%
Ratio of regional median income to rent (ACS, compiled by Downtown Detroit Partnership)
Annual Facts
Downtown Detroit has 562 residential units under construction, including major projects like The Residences @ 150 Bagley (148 units) and Henry Street Apartments (170 units), adding to 5,903 existing units.
Active development shows investor confidence, though high vacancy (25.1%) signals potential short-term occupancy challenges.
Upcoming Residential Projects
Source: Downtown Detroit Partnership. February, 2025.
5,903
Total Existing Units
562

Annual Facts
Downtown Detroit is home to 70,611 primary jobs, representing 4% of the region’s total employment within just 0.03% of its land area. This job density highlights Downtown’s critical economic role, underscoring the importance of maintaining a balanced, accessible ecosystem to support ongoing business attraction and worker retention in the area.
Total Primary Jobs
1.7M Primary Jobs
3,892.30 SQ Miles Region (Detroit MSA) Primary Jobs
4% of primary jobs in the region (Detroit MSA)
1.2 SQ Miles Downtown Detroit 0.03% Downtown
70,611
Source: U.S. Census Bureau. (2016-2021). LEHD Origin-Destination Employment Statistics. Detroit MSA: Detroit-Warren-Dearborn Metropolitan Statistical Area


Quarterly Information
27 New business establishments in 2024
2,169 60
Total Businesses (ESRI, 2025) Sidewalk Level Retail Businesses (DDP, 2024)
• Chaos Burger
• Charminar Biryani
• Chipotle Mexican Grill
• Dunkin Donuts
• Easy Peasy
• Fixins Soul Kitchen
• Gilly’s Clubhouse
• Kamper’s Rooftop Bar
• Mati Taverna Bar
• Noorjahan
• Nuevo Seoul
• Parlay Detroit
• Post Bar
• Presley’s Kitchen Detroit
• Rosa Cafe + Market
• Soraya
• Sugah Please Breakfast Brunch Bar
• The Lone Goat
• The Social Brews
• The Vinyl Society
• Vollmers Bar
• 3 KINGS Sports Cards and Collectibles
• Culture Detroit
• Ferosh The Label
• Rifai Detroit
• Savage x Fenty Food and Beverage Goods and Services Retail
Source: Downtown Detroit Partnership. February, 2025.
In 2024, Downtown Detroit added 27 new establishments, predominantly in dining, retail, and personal services. Annual household spending reflects strong local demand in dining ($3,450 per household), entertainment ($3,092), and apparel ($2,122).
Continued business openings align closely with Downtown resident spending habits, suggesting targeted opportunities for businesses in food, retail, and leisure services. This momentum is also supported by broader efforts to foster a business-friendly environment, including increased support for small enterprises, reduced barriers to entry, and improvements to parks and public spaces.
Annual Household Spending
2024 Consumer Spending MEALS AT RESTAURANTS $3,339 APPAREL AND SERVICES $7,192,311 Total $2,122 Average FOOD AT HOME $20,295,330 Total $5,987 Average ENTERTAINMENT/ RECREATION $10,482,635 Total $3,092 Average FOOD AWAY FROM HOME $11,698,145 Total $3,450 Average FOOD & DRINK ON TRIPS $599
Note: Consumer spending shows the amount spent on a variety of goods and services by households that reside in the
Downtown Detroit’s population increased by 20.5% between 2011 and 2023, predominantly attracting younger residents (ages 20-34) and single-person households (76%). Most residents are male (63%), and while the median household income ($69,813) slightly trails the regional average ($72,574), per capita incomes are higher due to fewer family households. Notably, population primarily consists of Black/ African American (44%) and White (39%) residents, indicating a significant presence of both groups.
Downtown’s growing racial and demographic diversity creates new opportunities for businesses to offer more inclusive cultural experiences, products, and services. As the area continues attracting younger, career-driven residents, aligning amenities and housing options with their needs will be key to sustaining economic momentum and long-term resilience. $63,716
$69,813
Source: U.S. Census, American Community Survey, 2023 5-yr Avg.

Downtown Detroit features high-quality urban living, with strong walkability (Walk Score: 76 out of 100), extensive green spaces (37 acres), and award-winning public amenities such as Campus Martius Park, voted #1 Public Square by USA Today’s 10Best for three years in a row. The park’s central location provides convenient access to workplaces, transit, and entertainment options, serving 70,611 workers and 6,668 residents—a worker-to-resident ratio of 10.6.
The availability of attractive public spaces, walkability, and convenient transit enhances Downtown’s residential appeal and contributes to the local economic vibrancy. Maintaining this balanced mix of urban amenities, workplaces, and entertainment options is crucial for continued growth, ensuring Downtown remains attractive for both living and working.
Source: Downtown Detroit Partnership. February, 2025.
76/100
Downtown Detroit Walk Score
37
Acres of Parkland
In the BIZ – funded by the BIZ assessment
Total Trash (BIZ) in tons
Graffiti removed (BIZ)
Patron Assists (BIZ)
70,611 Workers
Hours Worked (BIZ)-- More than 90% by Detroiters
Scooter Removal from Walkway (BIZ)
Dog Park (# of times cleaned)
Total Trash (Contracts/Events) in tons
6,668 Residents
Graffiti removed (Contracts)
Patron Assists (Contracts)
Total Hours Worked (Events)
TOTAL (BIZ + Contracts + Events)
Scooter Removal (Contracts)
10.6 Ratio
Connecting People, Places, and Parks
1000 WOODWARD AVE SUITE 380