Sk y C an dy
A visit to the universe we cannot see


Magellan’s Ghost, to paraphrase Winston Churchill, is a riddle wrapped in a mystery inside an enigma. Between 2005 and 2017 a small group of nine experienced amateur astronomers have reported a band of visually faint emission which begins at the base of the LMC, parallels the long axis of Chameleon, brightens somewhat as it nears Apus, and finally fades from view in Triangulum Australe. It is variously described as a ‘broad, even band of emission,’ ‘a stripe 3° to 4° wide,’ ‘a cometary tail streaming from the LMC,’ ‘as wide as the LMC itself,’ ‘about as bright as the the Zodiacal light 50° above the horizon,’ and ‘resembles an elongated form of the gegenschein.’
Yet despite all the avid sky gazers who reside in the southern hemisphere, plus visitors from the north, no one else has mentioned it. Historically, it has been imaged only twice: once in 1955 and again in 2010. The two references to the emission in the historical literature are vague at best. Only one professional astronomer has reported seeing the emission. It has been ignored by the larger professional community. There is no mention of it in the literature.
The various observations can be summarised as a broad swath with a surface brightness about 24 – 25 MPSAS that extends about 30° from the leading edge of the LMC in Mensa as far as Apus. All the observations were made in exceptionally dark, non light-polluted seeing conditions in remote locations in the Chilean Andes, Namibia, the Karoo of South Africa, and the Outback in Australia. At the observers’ latitudes the Large Magellanic Cloud at meridian is 45° to 55° elevation during the darkest hours of the night. The observers commonly report that they able to see the Chameleon Dark Clouds and the Dark Doodad filament in Musca without optical aid.
The emission has not been much pursued by amateur astro-imagers. Only a handful of images show it at all. It is simply too big and too faint. If it does appear in an image, it is usually taken as noise to be processed out of the view. The three images recorded by Colin Robson specifically for this report suggest a structure of three clumpy soft-edged patches about 3° to 4° each on the long axis, beginning in the LMC southeastern quadrant. It passes through Mensa, briefly fades under the central part of Chameleon, brightens a bit in Apus, and finally vanishes into Triangulum Australe.
The described morphology of the patches differs from the filamentary, striated Galactic cirrus (GC) that pervades the region. The numerous Galactic cirrus patches in the Chameleon/Apus/ Octans region seldom exceed a surface brightness of <26.5 MPSAS, while the emission observers report is ±24.5 MPSAS.
A literature search was conducted to discover whether the LMC–SMC self-interactions or the ongoing Magellanic interaction with the Galactic disc might explain the observed emission. The results were nil. The phenomenon observers report is too big and too bright to be associated with any disturbance of Magellanic matter by ram pressure or tidal forces.
In sum, we have a series of observations of an optical structure which cannot be traced definitely to a probable cause, situated in a region whose complexity provides multiple false leads.
But since we are on the subject of false leads, here is the most piquant clue of all: 357 years ago Johannes Bayer’s 1661 Uranometria was the first star map to depict his freshly invented asterisms to put a human stamp on the starry sky. For the first time ever, we knew of Tucana, Ara, Grus, Pavo, Apus, Musca, Chameleon.
Look carefully at Bayer’s map on the next page. You just might see the first Galactic clue ever recorded by humankind: Apus’s feathery tail wafts beneath Chameleon before fading into what is now Mensa. It is actually a fair approximation of where Magellan’s Ghost lies in that part of the sky today. Bayer could not have possibly seen Magellan’s Ghost. Yet there it is, in plain sight, the smoking gun on the table so astutely noticed by Sherlock Bayer. Is Apus’s tail a clue? Or false lead?
The Churchillian riddle is this: Have nine observers with credible histories been collectively seized with averted imagination? Are all the other observers simply not paying attention? Are observing conditions simply not good enough elsewhere?
The mystery is this: What are we seeing?
And now the enigma. What astrophysical phenomenon could cause such a spatially huge structure to shine just brightly enough to be seen with the human eye?
Let’s find out.
=Douglas Bullis, Nightfall, Deep-Sky Observers Section of the Astronomical Society of South Africa (ASSA)
• Dave Riddle
• Timo Karhula
• Brian Skiff
• Hisayoshi Kato
• Chris Beere
• Dana De Zoysa
• Robin Hegenbarth
• Colin Robson
This Sky Candy series of monographs explores the beauty to be found in a very abstruse subject — astrophysics — but intentionally avoids losing our way amid its mathematics so we can focus on its beauty. We explore a visual terrain of images and charts that until now have been known mainly to astrophysicists — well-known objects displayed in the ninety-nine percent of the electromagnetic spectrum that our eyes cannot see. Traditional optical band images appear as well, to provide familiar reference points.
Visual astronomy is limited to a tiny portion of the electromagnetic spectrum, 380 to 700 nm. At times it is the least informative of the many spectral bands that astrophysics studies.
As recently as seventy years ago we had little idea what the other ninety-nine percent actually looked like. Now astronomers can record and translate it into images anyone can understand.
In this first monograph we introduce astrophysics as an art form. Each article combines the research of multiple professional publications. Join them in appreciating the beauty of nature as seen through the eyes of science.
Magellanic mystery tour – 1
Early reports in the literature – 10
Riddle in a mystery wrapped in an enigma – 18
The serendipitous neighbourhood of the Galactic cirrus – 20
The expedition took us longer than we expected, but here we are – 31
All because of a lingering glance – 35
About the weblinks in this issue
This work contains numerous web links to articles and videos sourced from the astronomical literature. These web links are reproduced in CYAN on pages with a dark field. Traditional links on a white background appear in the traditional blue.
First edition published April 2024 Atelier Books LLC
PostNet 18 P. Bag X1672
Grahamstown / Makhanda Eastern Cape 6140 South Africa
email: atelierbooks@gmail.com https://issuu.com/douglasbullis
The right of Douglas Bullis to be identified as the author of this work has been asserted in accordance with the Copyright, Design, and Patent Act of 1988.
All images in this publication are Copyright © 2024 by their respective creators. Text without a byline was written by Douglas Bullis.


Johann Bayer’s 1661 Uranometria invented twelve new constellations in the southern hemisphere sky unknown to ancient Greece and Rome. His Chart 49 plotted Phoenix, Tucana, Grus, Pavo, Hydrus, Apus, Tri. Australe, Crux, Chameleon, Volans, Dorado. At the risk of cartosphemy, the LMC and SMC are identified, and the approx. position of Magellan’s Ghost has been outlined with a blue swatch.
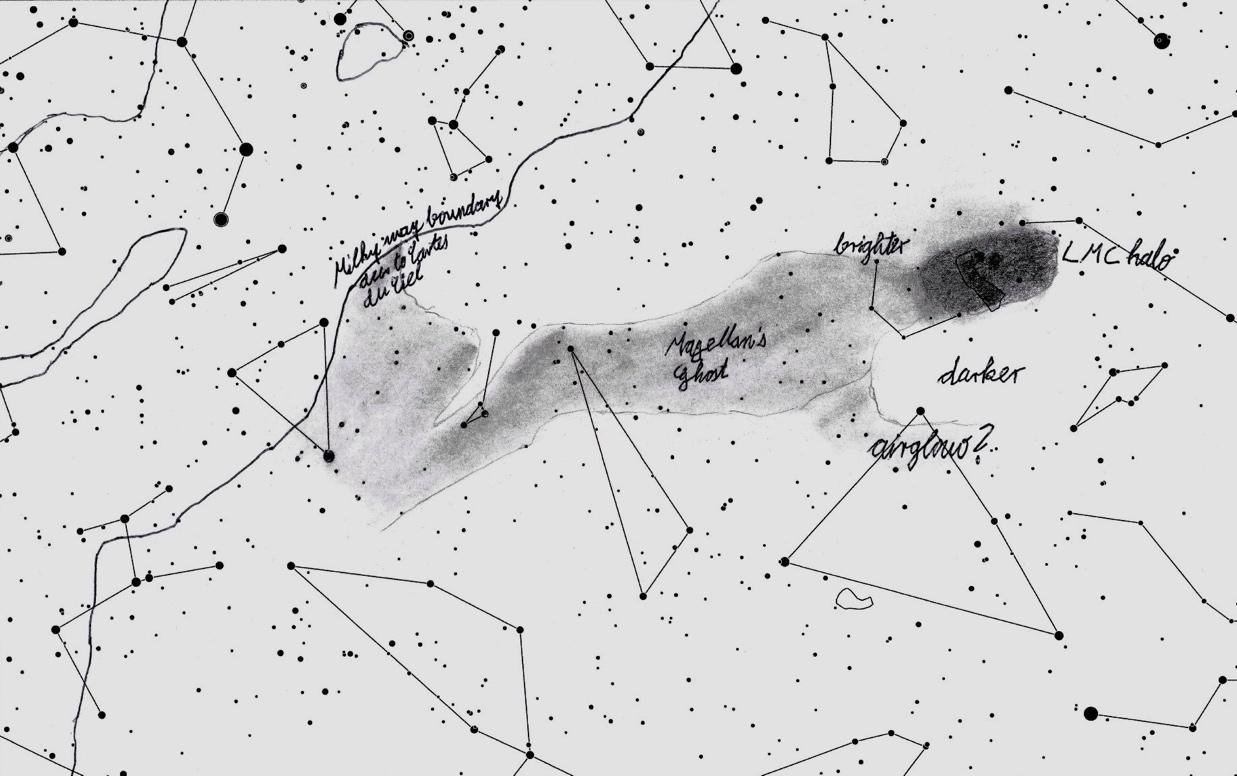
LMC SMC Fig. 1: Magellan’s Ghost as seen and drawn by Robin Hegenbarth 17 Feb 2018 @ Weltevrede
Fig & Guest Farm, 33°16'20" S, 21°46'09" E, 456 m amsl, NELM 7.3 mag.
Fig. 1: Magellan’s Ghost as seen and drawn by Robin Hegenbarth 17 Feb 2018 @ Weltevrede
Fig & Guest Farm, 33°16'20" S, 21°46'09" E, 456 m amsl, NELM 7.3 mag.
Sporadic reports in the literature as far back as Pannekoek 1928 mention a faint, inexplicable “ghost streamer” in the southern skies, seemingly associated with the Large Magellanic Cloud. The emission appeared about the same surface brightness as the faint ends of the Zodiacal light, the gegenschein, or the Sculptor Dwarf galaxy in a six-inch telescope.
This report details the original observations, analyses the possible causes, and gives the phenomenon a name: Magellan’s Ghost.
Three reports in the professional literature between 1928 and 1957 vaguely refer to a faint emission in the region but did not examine it further.
All nine reports from the astronomy enthusiast community were written by experienced visual observers starting in 1989. Detailed observer reports were published sporadically between 2005 and 2018. All observers mention serendipitous first sightings in which the Ghost appeared as a band of light bright enough to be noticed at first glance and without optical aid, but only in the darkest skies.
The professional astronomer Brian Skiff, who recently retired from Lowell Observatory near Flagstaff, Arizona USA, discussed the emission in a Yahoo Amastro post in 2011. Skiff reported that he first noticed the emission at Las Campanas in the Chilean Andes in 1989, and had noted it several times since.
Given the large number of enthusiastic stargazers who live under Southern skies but have never reported the emission, it seems odd that only visitors from Europe and the USA somehow manage to see what the locals routinely miss. Only one observer who has reported the Ghost actually lives in the Southern hemisphere, Douglas Bullis in South Africa.
One northern observer, Timo Karhula of Sweden, is fortunate enough to own a family holiday home in a remote small town in the Western Outback of Australia. He has logged the Ghost numerous time over the years.
Astronomy enthusiasts who visit southern skies for the stargazing typically lodge in one of the Southern Hemisphere’s astronomy-specific guest farms, e.g., Hakos Farm or Tivoli Guest Farm in Namibia. These establishments are located in exceptionally dark locales far from humanoriginated lights. These professionally managed guest ranches offer the sophisticated deep-sky astrophotographer/observer sophisticated pro-am
telescopes, cameras, and tracking mounts. Theirs is a deep-sky clientele. Few astrophotographers desire to image 30° fields or extended sub-MV 25 objects.
If it seems odd that so few experienced observers have not seen the Magellan’s Ghost emission, there are several plausible explanations:
• Skies must be nearly SQM 22.00 dark, utterly cloudless, with very low humidity.
• Most observers agree that the minimum naked-eye visible magnitude is 7.2. Few skies on earth are that dark. In the southern hemisphere this means the Chilean Andes, Namibia, the Karoo region of South Africa, and several locales in Australia.
• Light pollution must be essentially zero, which requires high-altitude and remote observing sites. All observers agree that skyglow and even relatively modest urban light domes distract from observing the emission.
• Observers must be alert enough to stop, look, and ask,"Is that faint streak a real phenomenon or an illusion caused by the proximity of the LMC to the Galactic disc and the dearth of bright stars in the area?" In skies conducive to seeing the Ghost, the Milky Way is so bright it casts a shadow of one’s hand held a forearm’s length above a white telescope tube.
• At roughly 3° wide and 30° long (Fig. 1), the Ghost is so extended and clumpy that no one really suspects the various bits to be associated. It's easy to shrug off something that's improbable in the first place. How many observers come across a 30-degree long comet tail without a comet attached?
The first to see and describe this mysterious Ghost in a public forum was the amateur astronomer David Riddle. On 4 June 2005 he reported,
I recorded three separate observations of the “LMC Filament” in my notebook. The Filament is a surprisingly easy naked-eye object. After making an adjustment for the different locations of the Filament and the Zodiacal Band, I judged both to be of about equal brightness. To my eye, the combination of the Large Magellanic Cloud and the LMC Filament makes one of the more bizarre sights in the entire sky — the LMC + Filament appears as a brilliant cometic coma with a ghostly "tail" about 30° long reaching towards the Milky Way. This "deep-sky comet" is certainly an unusual combination of galactic and extragalactic objects!
The nature of the filament remained a puzzle until I had a few evenings of extraordinary atmospheric transparency to look closely and carefully at the object. Using my 70 mm Pronto refractor with a 31 mm Nagler and a pair of excellent 8 x 42 Swarovski binoculars, I concluded the filament was not a massed groups of faint stars or an unusually elongated absorption hole. The Chameleon I and II molecular clouds were easily seen with the unaided eye as distinctly distant on these evenings, so I'm fairly confident that dark nebulae do not play a role in defining the filament.
I noted that the filament "touched" the LMC. But the part of the filament closest to the Magellanic Cloud also might be part of a halo surrounding (and belonging to) the LMC, or the LMC bow shock. The other end near Beta Apodis, HD 149324 blended into the Milky Way. The brightest part of the filament lies in the vicinity of Eta Octantis (HD 96124).
After making my notes, I turned to the MegaStar program and my nebulae "atlas" to see if the observed stars really lined up with the catalogued nebulae. I was delighted to see that my observations and the Megastar charts matched up very well.
I've concluded that the “LMC Filament" is most likely a low surface brightness extended reflection nebula. It does indeed seem possible that a 30 degree long nebular complex runs from the LMC to the Milky Way. Nothing else seems to explain its visibility, faint though it is, so well.
\Dave Riddle, reporting in Amastro in June 2005
Reply on same thread by Brian Skiff, Lowell Observatory, 4 June 2005:
Very interesting if this is indeed the case. I guess I'm surprised since my impression of it was that it was very uniform in brightness, much like the zodiacal band (as you describe) between the gegenschein and the more conical part of the zodiacal light. At least I'm glad I haven't been imagining it!
\Brian
Dave Riddle responded the next day:
Brian:
You certainly weren't imagining this thing! An unintended test of the Filament's visibility happened one night while I walking to my room from the Sossusvlei Mountain Lodge observatory. A quick look skyward before calling it quits for the night revealed the filament before I had time to orient myself to the sky and before the familiar constellation patterns fell into place. No "wishful seeing" here – the filament was visible at a glance.
\Dave Riddle
The most important points in these posts are (a) the immediate obviousness of the object; (b) its relatively uniform structure, brightness, and size; and (c) Dave Riddle’s correct guess that the object was Galactic cirrus made somehow brighter than the normal 26.5–28.0 MPSAS surface brightness of Galactic cirrus in the S. equatorial polar region.
Thus the question raised by these initial sightings is, “How does the background cirrus become illuminated to 24–25 MPSAS to be visible to the unaided eye?”
astronomical twilight and kept that value all night long (more or less). All of
Four years later, Dave Riddle recalled his early sightings of the emission on the Yahoo Amateur Astronomy Mailing List Amastro:
The "bridge" that runs from the Milky Way to the LMC is, in my opinion, one of the most spectacular naked-eye objects in the heavens. Resembling a deepsky comet with the LMC as the coma and a faint tail stretching in the direction of Triangulum Australe. I made few notes on this object when I was in Namibia a few years ago:
On two different evenings, I noted the object to be a little brighter in the area of Eta Octantis (the approximate position of the extended reflection nebula GN 13.23.0.01). The bridge was difficult to trace any closer to the Milky Way than the area of Beta, Gamma and Delta Apodis due to the faint extensions of the Galaxy. I thought this low surface brightness filament to be about as bright as the Zodiacal Band (in other words, not all that hard to see if the sky is dark).
I am pretty confident that this thing is composed of galactic cirrus clouds. It can be demonstrated that a number of obscure bright nebulosities (from the Atlas of Galactic Nebulae) compose the filament.
Brian Skiff
I saw it 20 years ago from Chile [1989]. . . it is about as bright as the zodiacal band on either side of the gegenschein, and makes a bee-line from the LMC toward the galactic center. If you trace this on a wide-field sky chart, you'll see that it goes right over the south celestial pole then merges with the Milky Way somewhere in the vicinity of alpha TrA. Its texture is very smooth, not unlike the zodiacal band. From Las Campanas on those February/March evenings, with the LMC on the meridian at dusk, it was obvious as a band heading straight down to the horizon. By morning at around 12h sidereal time, it was better placed — the LMC setting in the southwest, and the merge-point well
up in the southeast. It might be worth noting that patchy strands of the Milky Way connect (almost) the LMC to the galactic plane from the direction of the False Cross (delta Vel/IC 2391 area). That was described by de Vaucouleurs back in the 1950s when he was at Mount Stromlo. This feature is rather patchy, and is clearly just extended Milky Way star clouds.
In another undated post in that same thread came from the Swedish astronomer Timo Karhula, visiting Australia at the time:
I and two prominent Finnish amateur astronomers [Iiro Sairanen and Esko Luukkonen] had the privilege to visit and stay in a distant farm in the Outback, Western Australia. The nearest town worth mentioning was 130 km away. The skies were overwhelming! Both SQM meters showed 22.08 and 22.09. Limiting magnitude naked eye was between 7.6 and 7.9. When Omega Centauri rose, I could see 1000s of stars in its outskirts with only 25x100 binoculars.
The Gegenschein in eastern Taurus could be seen just sitting next to the Milky Way. The zodiacal band was bright and went from horizon to horizon. I found a bridge of light connecting the Large Magellanic Cloud with the Milky Way. It was a rather faint lane of light, as wide as LMC and about as faint as the zodiacal band on both sides of the Gegenschein
I asked Brian Skiff about the material between LMC and Milky Way. Brian confirmed my observation about this light between LMC and the Norma Cloud.
A few posts later in the same thread Timo Karhula elaborated on his Australia observation:
This light-bridge was not that particularly difficult to spot in these conditions. After midnight it was pointing more or less south. It looked like a waterfall tumbling from LMC. Later in the night, this feature had turned clock-wise so I was sure it was a real thing.
 Fig. 2: Large-field mosaic imaged by Hisayoshi Kato 2010. The original image has been rotated 180° and processed to emphasise the green band. First published in the Australian amateur forum IceInSpace 12 Apr 2010 in post by IIS forum member Bert Van Donkelaar. For a technical discussion of the processing that produced this image, see here.Hisayoshi Kato’s other images are located here and here
Our SQM-L and another SQM was about 22.0 right after the end of my galaxy challenges were successful with 25x100 binoculars. These were the Sculptor Dwarf, Fornax Dwarf, and IC 1613 in Cetus. All of these were definitive sightings and their sizes and orientations corresponded very well with Uranometria.
Brian Skiff informed me on December 19, 2009, that he had once seen an image of the LMC bridge taken with a "parking lot" fish-eye lens at Las Campanas, Chile:
"Greetings Timo. The bridge from the LMC toward the galactic center that you describe is just what I saw on both of my trips to Las Campanas in Chile. It basically extends straight south from the LMC to the south celestial pole, then follows a great-circle approximately to the Norma starcloud (or, alpha TrA, as you say) — it runs into the Milky Way, so you lose it much like the zodiacal band close to the Milky Way. I, too, have wondered why it is not mentioned anywhere that I know of. I remember once seeing an image taken at CTIO using what they called the "parking lot camera", a wide-field lens + CCD. This image showed the feature, but I do not know where to find that image again.” \Timo
The visibility of Galactic cirrus to the unaided eye has been an occasional topic on the popular amateur astronomy forums Cloudy Nights and IceInSpace. The subject was first raised in 2005 when the American enthusiast Steve Mandel compiled his The Unexplored Nebula Project. When descriptions of a large, bright band of mysterious light seemingly emanating from the LMC first appeared in 2010, interest in barely visible extended objects acquired fresh energy, e.g. Cloudy Nights 26 Dec 2009; Cloudy Nights 27 May 2011, IceInSpace (Australia) 11 Nov 2010; this thread links to the only three images of the Ghost prior to new images made for this study by Australian astrophotographer Colin Robson in 2018.
With our unaided eyes, we noted how the light band reached from the LMC, went due south, passed the south celestial pole and continued along a great circle towards the Norma star cloud in the Milky Way. The materia bridge was nearly as wide as LMC itself and more than 40° long. In surface brightness it was comparable to the faintest part of the zodiacal band and maybe half of the gegenschein’s. In the beginning of the night, it reminded me of a waterfall that disappeared into the airglow near the horizon. Later in the night, this phenomenon had rotated clock-wise around the south celestial pole which proved that this was indeed an astronomical feature that followed the earth’s rotation. The materia bridge disappeared in Triangulum Australe, near its alpha star, Atria. It is most remarkable that nobody (as far as I know) has taken photographs of the light bridge! It is neither visible on Axel Mellinger’s panorama of the Milky Way which reaches the surface brightness level of about 24 magnitudes per square arc-second. This phenomenon should not be confused with the Magellanic Stream. which is only visible in radio wavelengths and streams in opposite direction from the SMC to the outskirts of the constellation Andromeda. One theory is that the observed light bridge is the combined light from millions of faint stars or gas that Milky Way has stripped from our satellite galaxy due to tidal effects at an earlier close passage. The light might also originate from intergalactic cirrus like the clouds that can be seen near M81 in extremely deep photographic exposures. Spectroscopic analyses of the light should settle this matter. Curiously enough, the southern celestial pole is involved in a faint band of light while the northern pole, near Polaris, is the starting point of a dark lane in the Milky Way. I suspect a sky capable of showing stars to magnitude 7.5 or has a darkness of about SQM 21.9 is necessary to show the light bridge between the LMC and the Norma Star Cloud. Has anyone on this forum seen the bridge of light? It would be very strange if nothing more is known of this naked-eye feature!
I recently saw another glimpse of the LMC "light bridge” — on TV! It was in a nature program from the Atacama desert. On a time-lapse sequence showing the Chilean observatories in the foreground, the Magellanic Clouds were revolving around the south celestial pole (SCP). From the LMC, I could faintly see the "light bridge" going towards the Milky Way in Triangulum Australe / Norma. This was apparently shot with a b/w CCD-camera and a very wide field or a fish-eye lens.*
Editor: The time-lapse video Karhula cites was apparently extracted from the Las Campanas “Parking Lot” webcam. This was an all-sky video camera installed so anyone with the web link could see what was in the Chilean night sky at the moment. The camera operated only at night. On page 7 above, Brian Skiff mentions to the same image Karhula describes.
Report by Timo Karhula posted on amastro 5 Feb 2016
I observed at two sites east of Geraldton, W.A. One site is about 50 km due east; the sky darkness on different nights were ± SQM-L 21.8, with one night at 21.9. The second site is another 50 further eastward, where the skies were SQM-L >22.0. The solar counterglow of the Gegenschein was located between M44 in Cancer and Leo. It was easily seen, somewhat elliptical in shape, and about 15–20 degrees in height. I could discern the zodiacal band stretching out in both directions from the Gegenschein. The zodiacal band to the right (east) was harder to follow because the bright planets Jupiter, Mars, and Saturn dominated the view.
The LMC ‘bridge of light’ [called ‘Magellan’s Ghost’ in this paper =ed.] stretches from the SE quadrant of the LMC all the way to Triangulum Australe. Since I already knew from prior observations what the feature looks like, it was not that difficult to spot. It was a 40-degree long band of faint light that was best seen when LMC was at the same altitude as or above the south celestial pole.
The contributions to the background light due south were: Upward to the left is the black sky. Below/to the right is the bright Milky Way, black sky, "LMC-bridge", black sky and below it the airglow. The best contrast is the black sky between the LMC band of light and the Milky Way and then it gets darker again on the other side.
My observation occurred at Elandsberg Cottage, Tankwa Karoo National Park (32°10'25" S, 19°58'31" E, 594 m amsl) on March 9/10, 2016, 8:40 pm to 12:30 am local time, unaided eyes only. The naked eye limiting magnitude of 7.6 was confirmed with a selection of non-variable stars in the constellation of Volans near zenith and the Tycho-2 star catalogue. I observed a band as wide as the Large Magellanic Cloud that started at the SE base of the Large Magellanic Cloud, initially leading towards the constellation of Musca. Before reaching Musca it curved downwards towards Alpha Triangulum Australis. The region at which it curved downwards was approximately where the star Alpha Chameleontis is located. The band that I saw was approximately as faint as the faintest parts of the zodiacal band (which was visible almost across the sky except for the parts that crossed the Milky Way and the brightest parts of the natural airglow). I can definitely say that this band was brighter than the patches of night sky between the Magellanic clouds and between the LMC and Canopus. The feature rotated clockwise around the celestial pole during the night. I could not see this feature when limiting magnitudes
As of April 2018 the complete list of sightings is as follows:
Anton Pannekoek (uncertain), 1926–28 Java, Indonesia
Sergey Gaposchkin, (uncertain), 1956 Mt Stromlo, Australia
Brian Skiff, 1989 & 1993 Las Campanas Observatory, Chile
David Riddle, 2005 Sossusvlei, Namibia
Timo Karhula, 2009 Nangerwalla, Western Australia
Iiro Sairanen, 2009 Nangerwalla, Western Australia
Esko Luukkonen, 2009 Nangerwalla, Western Australia
Chris Beere, 2011 Tivoli Farm, Namibia
Douglas Bullis, 2013–2018 Weltevreden Farm, South Africa
Robin Hegenbarth, 2016, Tankwa Karoo & 2018 Weltevrede Farm, South Africa
My first sighting of this feature in December 2012 was a brief glimpse of an ephemeral overbrightening that resembled a cometary tail emanating downward from the LMC toward the S quadrant of Chameleon. It was about half the brightness of the Gegenschein at the time. The brightening gave the impression of a bow wake trailing behind the LMC rather like the streamer behind the nucleus of a faint comet.
I didn’t notice the emission again till January the next year, on a clearer-thanaverage night (average is ± mag 7.5 visually). Again I initially detected it serendipitously about 11:00 pm, It was bright enough in averted vision to trace as a comet-like streamer from the E side of the LMC all the way over to Apus, where it dissolved into the Galactic glow. At the time I hadn’t read any of the amateur forum posts about it, so I mentioned it on Cloudy Nights. Timo Karhula responded immediately describing his own observations. This brought me to scan the area more frequently and log the results. Like many observations, having once seen it, the sighting became easier, given relatively similar conditions. I have observed the emission several times every year thereafter. The emission fades briefly below the vee of Mensa’s brightest stars. It reappears as two slightly luminous overdensities about 2° SE of the α and θ Chameleontis star pair. These two patches are the most luminous of the lot — a term used advisedly because the visual impact is something faint superimposed on top of something fainter. These two emission blobs are ~3° in on their longest axes and have a flat luminosity distribution. Visually they do not appear as mottled and irregular a photo images suggest. They fade into star-poor fields in the SW and NE quadrants.
These emissions are so ephemeral that they cannot be seen when the limiting visible magnitude falls below 7.0. Two criteria that can be used to corroborate the emission visibility are (a) the Chameleon Dark Clouds I and II are visible in roughly their shapes as seen in photographs; and (b) the Dark Doodad is visible in averted about 40% of the time.

Fig. 3: This image shows the subtleties of the emission patches as described by Douglas Bullis in S. Africa 2012–2016. They appear to be a large continuous band of emission (as drawn in the image above) overlain by an optically thin extinction patch running approx. normal to the emission. In the field they are less distinct than in this image.
Source: 2010 image by Hisayoshi Kato using an apo-EL-Nikkor 21mm at F5.6N and EOS 5Dmk2-sp2 by Seo san on EM-200 Temma 2 Jr. autoguided with FSQ-106ED, Hiro-design off-axis guider. Exposure: 3 times x 26 minutes, 1 x 15 min, 4 x 4min, 4 x 1 minute at ISO 1,600.
In a 9 April 2011 post on amastro, an Amateur Astronomy Mailing List, Brian Skiff of the Lowell Observatory suggested the following tips for astrophotographers interested in imaging the then-unnamed Magellan's Ghost:
A couple of points to mention in regard to picking it up both visually and photographically. The best time for viewing is at around sidereal time 12h, when the LMC is over in the west and the galactic center is rising in the east. Look along the line between the two, which goes beneath the Milky Way.
For imagers:
1) It is worth emphasising that the feature is very large, and of low (but not especially low) surface brightness, about like that of the zodiacal band on either side of the Gegenschein. Thus the camera lens should be stopped down to avoid vignetting.
2) In addition, imagers are fond of processing their results to "flatten out" such large scale features --- obviously you will miss it if you apply any cosmetic processing of this sort: turn off that button in your software!
3) Another point is to use a filter or do whatever is necessary to avoid picking up the night-airglow pattern; if the detector is sensitive in the far-red, this could swamp the "light bridge". The goal would be to record only in the visual (or blue/green/ yellow) range of wavelengths, excluding H-alpha and redder.

This image was acquired and minimally processed in 2018 specifically for this report by the Australian astrophotographer Colin Robson.
 Fig. 5: Drawing of the 3rd quadrant of the Milky Way, Anton Pannekoek, 1928. Annotations by present author for orientation.
The first person to record an emission feature near the LMC may have been Anton Pannekoek in Annalen v/d Boschha Sterrenwacht 1928, observing from Lambang, Java (Indonesia). At only –7.7° S, the Chameleon–Apus region rises to only about 27° at meridian. Given what we know about the observability of the Magellanic Ghost today, Pannekoek is unlikely to have seen it. He did make some notes of the region, though. German Ghost observer Robin Hegenbarth (Fig. 1) translated the two paragraphs of the Pannekoek 1928 study which may refer to visual observations shown the blue boxes in the reproduction of his page (r):
§22: “A wide, diffuse light flux emerges between nu and theta Car, from l-q Car, with a triangular tip towards omega Car. From there, it continues toward alphalamda Mus. A very faint light band extends towards alpha-gamma - delta Cha, which is separated from the glow in Volans by a band that runs from beta Car downwards. The light band nu-omega Car - alpha-lambda Mus surrounds a darker patch that includes the dark bay lambda Cen - z Car. A faint light band between lambda Cen and theta Car dissects this patch. Above this, there is a dark lane from theta 1/2 [?] z Car towards delta, epsilon Cru towards lambda Cen, which merges into lambda 1/4 [?] 65 Cen and sends a branch via z Car upwards. Below this light stream there is a dark band or a bunch of dark patches below lambda Cen towards lambda Mus, 1/3 [?] theta Car and south east of theta Car. There is a dark space between gamma TrA 1/2 [?] delta Mus. Below this dark space, there is a faint, wide band from gamma-alpha TrA towards beta-gammaalpha Apus that can perhaps be traced to gamma-delta Cha.”
§U.A. 22: “The lower boundary of this light stream runs along G Car, gamma Cha, beta and alpha Aps and 3 degrees South of alpha TrA. Around gamma, delta Mus this light is slightly brighter. Between gamma, delta, alpha, and beta Mus there is a faint and dark band that merges into this boundary light and ends above delta Mus. A faint, semi-circular, convex light arc runs towards South from gamma to alpha TrA. Between these stars it is darker."

The Ghost feature was first imaged in May 1955 when Gérard de Vaucouleurs produced a large-scale mosaic of the Magellanics. He erroneously concluded that a filament of Galactic cirrus was part of the LMC’s spiral arm structure. He interpreted a slender emission (labeled “Galactic cirrus filament” on the annotated version of his chart to the right) as a spiral arm of the LMC:
The most interesting formation revealed by the long exposures is the anomalous spiral arm or filament stretching north-eastwards from near 4h 45m , –73°, where it emerges from the main spiral pattern [of the LMC], to about 3h 25m , –55°, where it reaches the edge of field 3. Apart from some irregularities (e.g., near 4h , –70° ), perhaps due to foreground obscuration, its course is regular and its width decreases continuously from about 2° near its origin to less than 1° near its tip. It presents on the Ektar plates a smooth, nebulous appearance and is not marked in the star counts to m = 14; its luminosity estimated at about 25 to 26 mag/sec2 in its middle section, tangent to k Reticuli, must therefore be due to stars fainter than M = –4.7. The lack of bright supergiants contrasts with their abundance in the inner regular arms. The projected length of not less than 20° = 15 kpc indicates the gigantic scale of this formation which is tentatively interpreted as the antigalactic arm or counter-tidal filament in the gravitational interaction between the Large Cloud.” (de Vaucouleurs 1954b)
The erroneous interpretation of the filament as a spiral arm of the LMC is understandable given the knowledge of the time. The LMC was suspected to be a perturbed barred spiral. Galactic cirrus as we know it would not be identified for another seven years, by Beverly Lynds (see p.15 below). Not until Nidever 2008 would it become clear that a large amount of gas and dust is being ejected from the SE quadrant of the LMC, which presently streams across the SW arc towards the LMC to form a second stellar bridge between the LMC and SMC.

Fig 6: Annotated image from de Vaucouleurs, Studies of the Magellanic Clouds, Astronomical Journal, 60 #1227, May 1955.

Fig. 7: de Vaucouleurs prepared this map based on his examination of the Aero Ektar plates he made, supplemented with the early POSS plates taken in the early 1950s. The bulbous structure SW of the LMC disc may correspond with the emission overdensity labelled as Clump 1 in this study.
In the mid 1960s the indefatigable Paul Hodge wrote a number of papers related to the LMC and the Magellanic System in general. One of them, The Large Magellanic Cloud by Hodge and Frances W. Wright, was a formidable image-rich text intended to aggregate all the known information about the LMC. Published by the Smithsonian Press (Washington DC) in 1967 it comprised 108 pages and 166 plates, 82 in yellow (to mag 17.0) and 84 in blue (to mag 17.5) at a plate scale of 16 arcsec/mm. It was reviewed by Sydney van den Bergh in RASC Vol. 61 No. 5, who admired it so much he took a copy on his next visit to Cerro Tololo. Finding a physical copy may be difficult: it is not available even in the Smithsonian ADS database.
Fig. 8: The SMC and LMC are at a heliocentric distances of ~60 kpc and ~50 kpc, respectively, and are separated by ~18.9 kpc. The tilt of the two galaxies with respect to each other means that the opposite sides of their disks illuminate each other. Source: Barger et al 2013 Fig 15.

It appears that the first person to mention a previously undetected emission feature near the LMC was the Russian born astronomer Sergey Gaposchkin in his article Visual Brightness and Form of the Magellanic Clouds in The Irish Astronomical Journal, 1958 p.4–6. His sketch can be found here, but it is inconclusive what exactly his image reveals, and whether it coincides with the observations reported here. Gaposchkin wrote:
The L.M.C. resembles visually an S-shape pattern in which the upper end is less curved than the lower. The bar, or the main trunk of the Cloud, is directed practically straight towards gamma Volantis which is the apex of the Kite constellation above Beta Carinae. The very faintly delineated shades on the periphery of our pattern around gamma Volantis may well be of spurious nature. In the projection the Milky Way is not far from the LMC; the gaseous smoke of the Galaxy rising along a broad lane from the sun towards Carina can protrude high up and surreptitiously link the Galaxy with the Cloud. Another such visual linkage may be perceived starting from Gamma Velorum, irregularly sprawling under Canopus and joining the Cloud about Beta and Delta Doradus; and a third begins under the Cloud and reaches the Milky Way at Corona Australis [sic*] after passing the South Pole.
Fig 9: Sergey Gaposchkin’s drawing of the LMC is available online only in this rather crude reproduction taken from a microfiche image in the library of the Armagh Observatory in Northern Ireland. The annotations are by this author.
* Gaposhkin meant Triangulum Australis.

In 1975–76 Allan Sandage of the Palomar Observatory undertook a deep-sky survey of the N galactic polar circle using the 1.2 m (48”) Schmidt camera. His goal was to find distant galaxy clusters that would extend the Hubble diagram. But unexpected faint diffuse emissions turned up in high equatorial latitudes near the M81 – M82 galaxy group. Sandage traced them to Dark Nebula No. 1778 in Beverly Lynds’ Catalogue of Dark Nebulae (NRAO/ApJ 1962) which was located at l = 359° b = +37°. Lynds catalogued and described 1,806 obscuration zones in her 1965 Observations of High-Latitude Dark Nebulae (PASP Abstracts 1965, p.134).
Over time Lynds’ 1965 “dark nebulae” came to be more narrowly defined as Galactic Cirrus or Integrated Flux Nebulae since many of them exhibited extended red emission at very low energy levels. Her original 1962 entry for Nebula #1778 cited “l = 358.85, b = 36.92, RA = 15 37.2, Dec = –7 0, AREA = 0.86, OPACITY = 3.” She went on to analyse #1778 more thoroughly:
The dark nebula No.1778 in the Catalogue of Dark Nebulae is located at l = 359° and lies 37° above the galactic plane. On the Palomar Sky Survey prints the nebulosity appears to be faintly luminous. A low-dispersion spectrum of this nebulosity was obtained by W. Livingston and C. R. Lynds using an image intensifier tube and the Kitt Peak 36-inch reflector. It covered the wavelength range of 4000–7000 Â. No emission lines were detected other than those of the night sky, but a 10-minute exposure of the nebula showed a stronger continuum than a 20-minute spectrum of a nonluminous comparison field. Therefore it is concluded that the nebula is of the reflection type.
In order to get a quantitative measure of the brightness of the nebula, photoelectric observations were made with the Kitt Peak 36-inch telescope, U, Bf , V filters, and a diaphragm 13 mm in diameter, which corresponds to 3.7 minutes of arc. Seven runs across the nebula were made by turning off the drive and allowing the nebula to drift across the field of view. The nebula appears to be of relatively uniform surface brightness; V = 11.9 in the 3'7 diaphragm, or 23.3 mag./arcsec2. The Β–V color index of the nebula is about +1.5, and it was essentially undetectable through the ultraviolet filter.
An estimate of the absorption in the nebula was obtained by making star counts on the blue Palomar print. Very rough magnitudes were found by using the Lick Observatory 20-inch astrograph photograph of the region.
This photograph has a limiting magnitude of 19, as compared to 21 for the Palomar print. In addition, the short exposure on the Lick photograph defines stars of 15th magnitude, and first order spectra show up for stars of 11th magnitude. It was then necessary to interpolate between these magnitudes. The Wolf diagram of counts in a neighboring clear area and the nebula indicate an absorption of about 2.5 to 3 magnitudes and a distance of not more than about 100 parsecs.
The nebula subtends an angle of about 1/3° which corresponds to a linear diameter of 0.6 parsec at a distance of 100 parsecs. The radius of 60,000 a.u. would make the object similar to Bok's "Larger Globules” with a particle density of about 2 x 10²² gm/cm–3 and mass of about 0.2 M☉.
From its situation, the nebula appears to be an extension of the ScorpiusOphiuchus complex of dark nebulae. However there appears to be no star so located as to account for the measured surface brightness of the nebula.
In another of astronomy’s many belated ahead-of-their-time predictions, Sandage anticipated the need for an all-sky extinction survey, which had to wait two decades before Schlegel & Finkbeiner 1998 took up the baton:
Two of the new high-latitude nebulosities (at b = +40° and b = –50°) are reflection nebulae. This requires the presence of high-latitude dust, and a source of illumination. Calculations of surface brightness set out in Sec. Ill suggest that the illuminating source is the integrated light from the galactic plane. The argument is carried if the galactic plane is, in fact, the source of illumination, then the presence of dust in any high-latitude field must produce reflection nebulosities, and further that the value of the surface brightness permits calculation of the optical extinction through the halo in that direction.
Sandage estimated the surface brightness of the dust clumps in his images at ±27 MPSAS based on their approx. distance as 100 parsec and particle density of 10-3 cm-3. He had insufficient information to project the total numbers of Cirrus patches but he suspect them to be considerable because of their numbers in his very limited sample. In Section V, “Consequences” of his paper, he suggested that magnetic fields could produce the clouds’ striated shapes:
Special plates taken in continuum radiation show the regions to be reflection nebulae. Calculations suggest that the source of the illumination at these high latitudes is the flux of the total galactic plane. [ Italics added for emphasis.] This flux at any height h above the plane is equivalent to MV = 6.73 visual magnitudes, independent of h. If the same grains that scatter the galactic light also cause the extinction ∆m of the background objects in the line of sight, then a relation exists between observed surface brightness and ∆m.
The question where the dust comes from is of interest. There is much prior evidence for matter in high galactic latitudes, principally from the polarization map of Mathewson and Ford (1970) and from the work by Heiles and collaborators of the HI column densities for [b] > 10° (Heiles 1974 [1 (*PDF is 555 pages*), 2, 3, 4]. From their correlations of galaxy counts, HI column densities, polarization vectors, and the well-known nonthermal radio loops, it is clear that dust must be present in the same region as the neutral hydrogen, the magnetic fields, and the relativistic electrons of the synchrotron loops.
Heiles (1976b) has also presented evidence that the HI loops are expanding, and he suggests supernovae explosions for their origin. Hence, there may be a natural way via these events for dust to reach the high latitudes from the plane. The heights are probably modest. We suppose that the order of distance to the reflection nebulae studied here is ~100 pc. If the proportionality between dust density and HI column density is the same at high latitudes as in the plane, then regions of high NHI should be regions of strong reflection nebulosities. Our two areas discussed here are consistent with this view because for both directions (/ = 187°, b = –50°; / = 140°, b = +40°) the neutral hydrogen maps show great HI density.
 Fig. 10: Sandage 1976 high-contrast print from the original Palomar Sky Survey showing field centred on Eridanus 3h l 2m , –6° 00 m (/
Sandage correctly surmised that the size of the observed nebulae in his report meant they could not be illuminated by a single or a few stars:
In this section we ask whether the integrated light of the galactic plane is sufficient to produce the observed surface brightness of the nebulosities, as previously suggested by van den Bergh (1966).
By this account, Sydney van den Bergh was therefore the first to relate the idea that the aggregate luminosity of the Galactic plane itself could illuminate an object placed at a shallow angle between an earthly observer and the object.

Fig. 11: Geometry of the illumination point P by the galactic plane and the subsequent scattering of the incident flux toward the observer off-scale to the right. Source, Sandage, Astronomical Journal v.81 #11, Nov. 1976.
Why do we call Galactic polar-region dust “cirrus”? The professional community conveys mixed messages. Some papers refer to “Galactic cirrus”; others employ the more accurate term "integrated light of the Galactic plane" originally coined by Sydney van den Bergh. “Integrated flux” is the more accurate description because it defines dust clouds in terms of photons originating in the stellar activity of the disc plane, not in the dust itself.
Depending on the size and location of the dust cloud, the orientation of its constituent particles, their albedo, and the incoming incidence angle of the arriving light, photons from anywhere in the Galactic disc might reflect off a filamentary strand of cirrus in the celestial polar regions. Few incoming photons actually qualify on all counts, but those are numerous enough to raise an extended cloud of them to unaided-eye visibility.
The specific term "Integrated Flux Nebula” was coined by the American amateur astronomer Steve Mandel in the mid 2000s. He was unaware that Allan Sandage had explained that term 1976, but Mr. Mandel’s phrase is now commonly used.
Prof. Adolf Witt of the Univ. of Toledo (OH) USA has clarified how the “Galactic cirrus” term entered the picture:
Alan Sandage (1976) already discussed and explained such nebulosities, and their extent became fully known to the astronomical community from the infrared all-sky maps produced by the IRAS satellite in the mid-1980s. It was then that the term “infrared cirrus” was coined, which was not a good choice because the cirrus can be observed at optical wavelengths as well, as Sandage and [Steve] Mandel, among others, had shown.” (pvt. communication Apr 2018)
Mr. Mandel may not have originated the terminology of the emission, but her certainly did discover that Galactic cirrus has a reddish or “mauve” hue that would not be the case if their surface brightness was strictly the result of reflection. Mr. Mandel used various filters to determine that their faint red glow was not from Hα singly ionised hydrogen emission.
Magellan’s “Ghost” is not the first time the Magellanics have been steeped in mystery. To paraphrase Churchill, for three centuries these bright nocturnal clouds were a mariner’s apparition sometimes seen, sometimes not, depending on the state of the sea and the air (to say nothing of the mariner).
Good mystery novels start with a smoking gun. Sometimes it is in plain sight, as with Sherlock Holmes’s Adventures of the ’Gloria Scott’. Other times the smoke is as elusive as a 3:00 a.m. transfer of large amounts of cash from a numbered account in the Caymans to a numbered account in Macau.
Luckily for astronomers, our mysteries are legal and nobody gets hurt. We can see the objects, though not always as clearly as we’d like. The mystery is how and why they got there.
As smoking guns go, the late 15th century Italian historian Peter Martyr d’Anghiera, found a good one, though he didn’t know it at the time. In a series of letters and reports that were published from 1511 to 1530 in his chronicle of Spain’s explorations in the Americas titled De orbe novo ("On the New World”) he made a passing reference to two glowing objects which appeared from May through July in the Southern night sky from the island that Columbus named La Española (Hispaniola today). He called them nubes, or “clouds”.
Three decades later, Antonio Pigafetta sailed with Ferdinand Magellan on his circumnavigation of the world in 1519–1522. He logged the objects as “nuvem”. The rather more credulous deck hands thought the Clouds were the spirits of Jesus and the Good Thief winging their way heavenward. At the clouds’ present rate of motion around the Galactic disc, there will be plenty of time for the Good Thief to repent before he gets there.
A century and a half later Johann Bayer's 1603 Uranometria showed them without labels in the 49th and 51st chart of his Synopsis coeli inferioris austrina ("Overview of the southern hemisphere”). A later 1661 re-edition of his Uranometria labeled them nubecula major and nubecula minor. Nicolas-Louis de Lacaille’s 1756 star map referred to them as le Grand Nuage and le Petit Nuage. Eventually the clouds came to be associated with Magellan, even though he was not the discoverer. Some historians aver that his name should not be used at all, given his record of enslavement and mayhem. We retain the nomenclature here pending an International Astronomical Union decision.
One night in 1784 the usually reserved William Herschel exclaimed to his sister Caroline recording his observations on the ground below, ‘Hier ist wahrhaftig ein Loch im Himmel!’, or ‘Here is truly a hole in the heavens!’. She dutifully recorded it, even including the exclamation mark.
Herschel had glimpsed one of the dark nebulae in the Ophiuchus Nebular Complex. He reported the discovery the following year in Philosophical Transactions Series I 75:2135, 1785. For the next century until astrophotography arrived following the work of E. E. Barnard, astronomers were undecided whether these dark objects were true voids or simply regions that had few stars. Hardly anyone suspected they might be bright nebulae that didn’t shine. Astronomers didn’t know why stars shone in the first place. It was a little like stamp collectors buying pricey little pieces of paper to dote lovingly on the glue side.
Systematic surveys of the distribution of dark nebulae were undertaken by relatively few early astronomers. The most extensive was Lundmark and Melotte (1926), based on the 1903–04 Franklin-Adams charts. Their map listed 1500 objects, most of which were in the higher galactic latitudes. Barnard’s Catalogue of 349 Dark Objects in the Sky (Univ. of Chicago Press, 1927) listed objects that he identified using his own photographs. His is still considered one of the landmark photo atlases and is highly desired in the antiquarian collector’s world. The physical data of Barnard’s 349 objects are accessible here.
In 1960 J. Sh. Khavtassi of the Ambastumani Astrophysical Observatory in Georgia, USSR published an atlas of galactic dark nebulae based on the 1934 photo atlases of Ross and Calvert and Heyden’s 1952 plates. This was listed as a supplement to Khavtassi’s 1955 catalogue of dark nebulae 20° above and below the galactic equator. In 1962 Beverly Lynds updated these earlier catalogs with her own Catalogue of Dark Nebulae. She produced an 1,806entry compilation by meticulously examining POSS-1 plates acquired with the Palomar 48-inch Schmidt camera and entering the data — on IBM computer punch cards!

The need for image plates covering 15° x 15° fields corrected for the blue end of the optical range went beyond the capabilities of equipment at the time. That shortcoming inspired the development of both new equipment and new ways to use it. In response, serendipity waved its magic wand over Yorke, England in 1870 and gave the world Dennis R. Taylor. This young man in his early twenties was blocked from higher education because of his working-class origins. In 1892 he went to work for Thos. Cooke & Sons as a trainee barely out of school. He found that he had a gift for optical design. He was equally skilled at business sense. In five years he was chairman of the company.
The parameters for the Franklin-Adams survey were formidable given the limitations of optical design at the time. The long-focus f/15 traditional achromat doublet obliged long, ponderous optical tubes, which in turn demanded massive mounts. They were wholly inadequate for the 15° x 15° plates demanded by the Franklin-Adams Atlas. Dennis Taylor pushed his creativity to its limits and came up with a 6-inch design with the unheard-of speed of f/4.5. The design took a totally original approach: three separate glass elements separated by wide air gaps. The success of the design evolved into the landmark Cooke Triplet lens design which set the standard for astronomical (and personal snapshot camera) imaging until after World War II. Some Nikon macro lenses still used the design as recently as the 1990s.
With the 1927 publication of E. E. Barnard’s Catalogue of 349 Dark Objects astronomers began to classify distinct cloud types. Amorphous lumpy blobs with sharp density gradients were visually distinct from linear streaks, but when examined spectroscopically they often seemed to be composed of much the same atomic and molecular hydrogen, plus varying ratios of elements heavier than helium. Over the years spectroscopists discovered the signatures of carbon monoxide (CO), hydroxyl (OH), cyanogen (CN), ammonia (NH3), formaldehyde (CH2O), and other carbon-based molecules. Collectively they are termed polycyclic aromatic hydrocarbons or PAHs. Molecular spectroscopy became more sophisticated until by the 1960s it was a significant science.
A major step forward came from outside astronomy when Hannes Alfvén developed the principles of magnetohydrodynamics (MHD) in the 1960s. Alfvén first coined the word in 1942 and received the Nobel Prize for his work in 1970. The basic concept was straightforward — fluid dynamics and electromagnetism interact reciprocally in an electrically conductive medium.
About that same time metal-oxide semiconductor (MOS) technology devised ingenious new ways to compress millions of slide rules, compasses, protractors, and drafting tables onto a wafer the size of a match head. Then a pinhead. Today a pinpoint.
MHD lofted into space along with gravimeters and particle counters as soon as politicians got over gloating over how big their bleeping spheres were. The electromagnetic spectrum dramatically broadened across the 1970s and 1980s as space-based platforms ventured into the realm of x-ray and gamma energies on one end, and the millimetre to sub-micron realms on the other. Because interstellar dust is readily detected in the micron band, astronomers realised these tiny smoke-sized molecular aggregates were too complex and important to be dismissed as a mere nuisance. One of the most far-reaching properties was that an aggregate of molecules with electric dipoles (the sequence of an atom’s positive and negative charges within a molecule’s structure) would act as the magnetic dipole moment of the entire particle. The particle would orient itself perpendicular to magnetic field lines.

Fig. 13: Most cosmic dust particles are between a few molecules to 0.1 µm in size. Larger particles such as this one are conglomerates of many small ones. Most dust originates in the cool atmospheres of asymptotic giant branch stars (AGB) during a brief evolutionary swan song called Third Dredge-Up. The star is highly unstable at this point. Deep convection to bring vast quantities of carbon and oxygen up from the hot but inert core. In the cool stellar atmosphere it coagulates into tiny particles and is expelled into space as cosmic soot. Grains observed in IR and UV include graphite, polycyclic aromatic hydrocarbons (PAHs), silicates, carbonates, and sulphides. Some grains are needle-shaped; some are dense cores covered with ice mantles; still others are fractal fluff balls. Above is one of the particles gathered during the Stardust satellite mission to trap dust in silica gel for return to Earth.
Fig. 14: Nearly all interstellar dust particles acquire a magnetic dipole moment as simple molecules accrete onto their surfaces over time. A magnetic moment (µ) measures the tendency of a molecule or atom to align itself with any magnetic field around it. The magnetic dipole resembles a tiny bar magnet with north and south poles (hence “dipoles”). Its potential or susceptibility to align with an external magnetic field depends on the aggregate dipole moment of all the molecules adhering to it. Examples of the dipole moments of molecules commonly found frozen onto dust grains are:
Hydroxyl HO µ=1.66 Debye
Water H2O µ=1.8546 D
Nitrosyl hydride HNO µ=1.62 D
Ammonia H3N µ=1.4718 D
Nitric oxide NO µ=0.15872 D
Hydrogen cyanide CHN µ=2.985 D
Formaldehyde CH2O µ=2.332 D
Carbon monoxide CO µ=0.10980 D


Fig. 16–17: While dark molecular clouds are present nearly everywhere in a dusty spiral, they are most easily spotted in the celestial polar regions around Ursa Minor and Octans. Typically they present as a blend of a dusky mauve-red (caused by the UV–dust–HII reaction fluorescing in the 540 nm to 950 nm bands; and blue luminescence (BL) from low-angle forescatter reflection off dust grains between the light source and the observer. If an IFN dust patch is thermally excited by nearby stars it is called Extended Red Emission (ERE), or simply warm dust. ERE spectra typically exhibit absorption lines from carbon-rich compounds and polycyclic aromatic hydrocarbons (PAHs).
Until the mid 2010s the standard picture of star cluster evolution was that ambient magnetic fields present in nearly every galaxy act as the primary stabilising pressure against thermal and ionisation turbulence shocks that gas and stars bequeath to galactic discs. Magnetic pressure shields gas bodies against dispersion while it simultaneously constrains the tendency of those gas bodies to collapse. Over time, magnetic resistance and turbulence insistence wear each other down until gas clouds can free-fall into cores dense enough for stars to light up. The stars then proceed to live dismayingly messy lives. Gas makes stars, stars make dust. Magnetic fields obligingly feed them all.
For many years astronomers thought that magnetic forces inhibited thermal and ionic turbulence on time scales of about 10 Myr through ambipolar diffusion (1, 2, 3) in which neutral particles slowly bleed out of an ionised cloud. This picture shifted focus when certain properties predicted to occur in real clouds could not be detected in them. For example, star formation regulated by ambipolar diffusion predicted a higher mass-to-flux ratio in a cloud’s molecular hydrogen core than in the cloud’s atomic hydrogen envelopes.
When this was not observed in real clouds despite many careful screenings, an alternative theory proposed that huge molecular clouds collapsed globally — all over and all at once. Stars would form very quickly (100,000 to – 500,000 years) until the hottest of the stars produced enough UV ionising radiation to quench further star formation by blowing the unused gas away. UV is the most powerful of several forces at work in the overall process of stellar feedback. Another feedback component is high-velocity gas ejection from hot stars, such as Wolf-Rayet bubbles (see Fig 21 on p. 28). Still another was cosmic rays.
The catastrophic collapse theory had its problems. It predicted a small number of very hot and massive star clusters but fewer low-mass clusters. The sky begged to differ — many more small clusters than large clusters are produced during the typical molecular cloud’s 50-million-year star-making cycle. (1, 2, 3.)
Another theory was then proposed that the sound speed (Mach number) in a gas cloud regulates star formation. In this view, turbulence plays a crucial dual role. On large scales, turbulent kinetic energy stabilises clouds and inhibits rapid collapse. On local scales the size of a cluster, supersonic shock
waves regulate the pace and mass of star formation. This results in a multifree-fall scenario in which many shock waves infall from many directions. These self-dampen to subsonic velocity over a system-wide crossing time.
An inverse effect occurs in the interacting expansion shocks of a Wolf-Rayet nebula. Multiple sequential eruptions erupt in a reverse multi-free-fall expansion. A series of supersonic ejection threads merge into a shock field that resembles a thick bubble (Fig. 21).
While we usually think of shock waves as coming one at a time from supersonic jet airplanes or the blast wave from a terrestrial detonation, stellar ejecta clouds merge large numbers of shocks over time into an expansion bubble. This simulation shows multiple ejection from a model galaxy disc.

Fig. 18: The M51 Whirlpool Galaxy is often studied to compare its system-wide magnetic field with the local-scale arm and interarm gas dynamics. Star formation in the disc violently disturbs the spiral arm’s overall ßfield. The magnetic field of the arms is disturbed by thermal and sonic shock fronts. Conversely, the large-scale field is little disturbed because it is coupled to the overall disc’s weakly compressed diffuse, warm gas. These effects are termed bimodal magnetic field structure.
Most Galactic cirrus is characterised by filaments and threads produced by magneto-acoustc star formation processes as molecular clouds infall toward star clusters. But what produces the structure of ejected natal gas? Why do we see so many filamentary dust clouds so high in the Galactic disc yet so many amorphous clouds near the disc?
There is a veritable cottage industry of astrophysical studies of star cluster formation, but few indeed are the astronomers devoting their careers to what happens to the leftovers. Astronomy is hardly alone in its paeans to the chandeliers of glitter to the neglect of the dust on the furniture. What upscale fashion magazine lavishes full-page features on a couturier’s crumpled remnants? The swatches are no less beauteous, they’re just in the wrong place. The same can be said for filaments in Galactic cirrus.
There are commonalities between pre-collapse molecular clouds and post-cluster molecular debris. For one, both pre- and post-cluster natal gas lies within a large spiral arm with an ambient ß-field circling with the disc’s rotation. For another, pre- and post-cluster filaments do not move very far laterally or longitudinally within the spiral arm. Hence dust clouds endure similar torque stresses throughout the entire gas-to-cluster, cluster-to-gas cycle.
During a cluster’s formation epoch, supercritical forces of magnetic confinement and supersonic shocks weaken each other until their parent gas cloud becomes critical enough that gravitational collapse can initiate a star cluster. In most cases a number of

clusters form sequentially within a filament of molecular gas — a process aptly-named “beads-on-a-string formation”. (1, 2, 3, 4, 5, 6, 7, 8.) However, our interest here is what processes are at work on the other end of the cycle. What converts a star cluster’s expelled gas and dust down in the Galactic disc into the cirrus-like filaments that we see ±100 pc above the disc?
The magnetic, kinetic, and chemical properties at work during the supercritical-to-subcritical transition are generalised forces that exist in the spiral arms of any disc galaxy. They interact with each other to transform gas clouds into star clusters. But do those forces — magnetic fields, turbulence, and in particular protostellar jets — work the other way?
Protostellar jets have recently come to be seen as the lead actor who enters the stage once a star cluster has formed.
Given the ubiquity of poloidal and toroidal magnetic fields associated with stars embedded in a Galactic ß-field being subjected to spiral disc torques, is there a common thread, so to speak, that operates analogously to the gas expansion when magnetic and turbulent forces interacted during compression?
Fig. 19: Beads-on-a=string star formation in magnetically confined gaseous filaments.
Source: Beuther et al. 2015.
Several models have been advanced to explain the various features of Galactic cirrus. An early model was based on shock compression from stellar feedback, supernovae, and turbulence (1, 2, 3, 4). However, the model did not explain a common property in molecular clouds: filament size, shape, density, and distribution.
In 2011 the Herschel telescope provided data that surprised everyone: filaments, no matter where they were, were a uniform ±0.1 pc wide. The Herschel data suggested two mechanisms that might form Galactic cirrus:
• The first was gravitational contraction controlled by the ß-field (1, 2, 3.). This interpretation derived from observations of the Taurus molecular cloud complex and the Pipe Nebula which revealed an ordered largescale magnetic field characterised by elongated condensations perpendicular to the large-scale field. Star formation was initiated when gas gravitationally ordered along the field lines. If the gas mass-to-magnetic-flux ratio approach the critical density for the conditions of a particular filament, star formation would begin in that filament. This mechanism was comparatively slow because the gas condensations in the filaments were only moderately supersonic. Star formation rate was moderated by magnetic field pressure rather than turbulence pressure. The clusters were characterised (and therefore could be identified) by the small average masses of their stars and that only about 1% or less of the magnetically critical gas actually turned into stars during the limited free-fall time.
• The second was Anisotropic sub-Alfvénic turbulence (SAT). This view held that turbulent pressure tends to channel gas distribution along the field lines, producing filaments aligned with the ß-field. The competition between gravitational and turbulent pressures in a medium dominated by ß-fields will elongate the cloud either parallel or perpendicular to the ßfields while reaching equilibrium.

Fig. 20: Accretion flows from sub-filaments
onto main filament, a common pattern comprising a typical ridge structure dominating a network of infalling sub-filaments. Source: (l) Sugitani 2011 & Kirk 2013; (r) Herschel HOBYS 3-color image from Hennemann, Motte et al. 2012.When the Herschel data placed a numerical value on the dimensions of filamentary structures, astronomers likened them to the striations of waverefracted light. The caustics of light refracted through a wavering medium as seen at the bottom of a swimming pool resemble the refraction of light passing through moving gas clumps.
The caustics analogy gets more germane the more deeply we look into its optical aberrations. The Galactic medium is affected by four primary massenergy exchanges, some of which tend to shape as others tend to shred:
• Gravitation
• Turbulence
• Magnetic fields
• High-velocity outflows along polar jets
Introducing outflow from stellar jets to the standard mix of gravity, turbulence, and magnetic fields opened a new chapter in interstellar medium dynamics: the role of Mach number. Jet velocities are measured by their ℳ function (sound speed). The velocity of a disturbance moving through gas or a magnetic field is mediated by the local ℳ function in any given region of interest, such as our Magellan’s Ghost. The ℳ function is not simply a propagation velocity, it is how that velocity affects its surroundings. On Earth Mach 1 or ℳ1 is the time it takes for a pressure wave to propagate a distance of 1 km. In space it is the crossing time between one wavecrest and the next across a given parcel of interstellar space. A value for ℳ 1 commonly accepted for the thin regions of galaxy haloes where the average density is NH = 10-3 cm3 is ℳ 1 = 200 m s-1, or 720 km hr-1. (See box on next page.) In a warm dusty disc region like that surrounding Earth, ℳ 1 is often taken to be 10 km s-1.
Particle densities and therefore sound velocities reach far higher numbers during star formation; 104 gm cm-3 is commonly accepted as the critical
density at which gravitational free-fall can no longer be resisted and star formation can begin.
Space is not a tidy place. Gas densities can vary dramatically even in the relatively low-shear corotation* zone surrounding Earth and the lofty removes of Magellan’s Ghost. The most common molecular environments in a disc galaxy are:
Molecular Clouds: ρ 104 atom/cm-3, T = ±10 K
Cold Neutral Medium: ρ ∼ 20 atom/cm-3, T= ± 100 K, scale height 150 pc
Warm Neutral Medium: ρ ∼ 0.5 atom/cm-3, T = ± 104 K, scale height 400 pc
Warm Ionised Medium: ρ 0.5 atom/cm-3 T = ± 8000K
Nearly all young stars are formed in the Galaxy’s 100 light year thick disc plane, yet its very old stars can be found several hundred light years above or below the plane. Magellan’s Ghost clouds are 240 pc away from us, but their actual vertical distance above the Galactic plane varies between 82 and 130 pc. (Our Sun was born in the disc plane but now resides 60 light years above it.)
The typical turbulent pressure of disc gas at the radius of the Sun is ±10 times the thermal pressure, much of it due to supernovae. The interplay between supernovae shocks and the local gas phase leads to feedback processes that form molecular cloud complexes and subsequent star
* The Solar System lies within the Galaxy’s co-rotation zone. Spiral galaxies rotate differentially because they are not rigid objects. The circular speed of the individual stars around the centre is not the same speed as the spiral waves, which rotate in the same direction but at about half the velocity, depending on distance from the centre. The zone where the stellar rotation and spiral rotation speeds are the same is called the corotation circle. Our Sun is slightly inside the Milky Way’s corotation radius, which is 1.06 times further out from the Galactic centre than the Sun. The Magellan’s Ghost cirrus clouds also lie in or very near the corotation circle.They are relatively little disturbed by the disc’s shear torques. In a sense, Earth and Magellan’s Ghost bask in a privileged zone, relatively free of the twists and turns that make spiral arms beautiful to look at but beastly to live in.
Disc heating affects dust particles much the same way it affects gas. Adiabatic heating expands gas and dust analogously to cosmic expansion, in which space itself expands and everything inside expands with it. Individual dust particles are so minute as to be near nullities amid the array of forces pervading galaxy discs. One quadrillion cosmic motes packed into a volume smaller than a match head requires the entire earth to move a gram scale from 0 to 1. As the disc thermalises from stellar activity it expands adiabatically in a manner analogous to the cosmic expansion of space itself. A modest supply of new particles arrives via HVAC infall and the thin wind of pristine gas along cosmic filaments. Much of the infall gas ends up in the halo; little makes it to the disc itself (1, 2, 3, 4). Cosmic infall is estimated to provide about 25% of our Galaxy’s replenishment requirement at current rates.
A good example of the effects of long-term disc heating is the location of star clusters older than 6 Gyr. NGC 188, NGC 6491, and M67 lie high in the thin disc’s version of the stratosphere, where there is little shear or wind to disrupt them. Only Collinder 261 in Musca lies near the plane, but its longevity is due to the good luck of having been born in the corotation circle like the Sun and our Magellan’s Ghost clouds.
Galactic cirrus clouds are dipole-coherent as well as self-bound. Their dipolar moments align with the ambient 0.5 µG magnetic ß-field generated by the dynamo activity in spiral arms. In a random volume large enough to contain 10 to 20 dust clouds — the approx. number of clouds that may be part of the Magellan’s Ghost emission complex — the spiral arm ß-field acts on the entire group of clouds to slowly align their dipole moments.
Carbonaceous dust has a very low albedo; it is nearly black at optical wavelengths; it is an absorber/emitter. Several other forces may also affect Galactic cirrus’s appearance and location today:
• Radiation trapping capacity of the dust particles themselves (1, 2).
• Disc heating from spiral arm wave dynamics (1, 2, 3).
• ß-field flow tangential to spiral arm rotation (1, 2, 3) variables (1, 2 (lower left), 3, 4).
• Gravitational perturbation from molecular clouds (1, 2, 3).
• High-velocity ejection bubbles from Wolf-Rayet stars and luminous blue variables
• Cosmic rays. The observed energy density of 1.5 eV cm 3 of relativistic particles in the vicinity of the Earth is comparable with energy densities of superbubbles from supernovae and nuclear cluster starbursts, e.g., NGC 3603 (1), Westerlund 1, and Westerlund 2. (1, 2, 3).
The speed of sound in “empty” space Mach 1 or ℳ1 in space is the time it takes for a pressure wave to propagate past a given point. It is also taken to be the crossing time of a star cluster, the time it takes to go from one side across the middle to the opposite side. Sound speed is derived through the Ideal Gas Law:

Assuming that a given parcel of interstellar space is heated uniformly by the CMB, it will have a temperature of 2.73 K. The interstellar medium comprises protons and neutral hydrogen atoms at a density of about 1 atom cm-3. In the equation above γ=5/3, and m=1.66×10 27 kg, hence the
ℳ 1 vsound is 192 m s 1
In reality few places in space are that cold or precisely that density. The interstellar medium varies from 10 K deep in molecular clouds to 107 K in the intergalactic medium. The inferred values for temperatures in the nearby interplanetary medium, for example, is >104 K. The cosmic intercluster medium is 107 to 108 K. Astronomers estimate that ℳ1 in the gas medium of the South Polar Circle at the ≈ 400 light year altitude of Magellan Ghost to be on the order of 10 km s-1.
Sound speed plays a crucial role in many astrophysical processes. For example, if the sound crossing time for a gas cloud exceeds the gravitational free fall time (time for a gravity-driven disturbance to propagate), pressure is unable to resist gravitational collapse and the cloud will infall to a denser cloud, and if conditions are right, a star.
The striated appearance of polar Galactic cirrus originates in the mix of solenoidal and compressive forcing that produce the 0.1 pc flux tubes. Only a small percentage of any given giant molecular cloud actually forms stars. A certain portion of excess gas is ejected back into the local medium during the time span between leaving the Hayashi Track and the end of the T Tauri stage when protostellar stars eject excess gas in thin powerful polar jets. Half a million to a few million years later, O and B stars eject the rest of the unused gas via UV forcing. See this simulation of UV feedback to gas (from Federrath 2014).
Once the gas leaves the virial radius of its cluster, it is assaulted by turbulent fronts while being contrarily constrained by magnetic fields. Magnetic fields order gas into streams that align perpendicular to field lines to form a solenoidal field. Turbulent compression originates from many sources, e.g.,
• Ionised gas hurled from fast-rotating Be stars and massive binaries forms toroidal rings which stream charged particles into sinuous helicoids.
• Mismatched binaries transfer hot threads of gas across their Roche lobes, some of which escapes into the local medium as electrically and thermally charged particle streams.
• Nonbinary Wolf-Rayets (see right) and luminous blue variables erupt clouds of complex filaments (Gendelev 2014). If the stars are binaries or multiples, bilobed homunculus bubbles form, as in the famed Eta Carinae homunculus (Fig. 24, p. 30).
Since carbon compounds are made largely in the outer atmospheres of AGB stars (not typically found hundreds of parsecs above the disc plane) the question is how it is transported into regions so remote from stellar outflows.
In the disc plane life is so traumatic that it breeds endless repetitions of chaos nurturing chaos. Yet even as galaxy discs undergo multiple generations of stellar birth/death cycles, their gas and dust is simultaneously converting energy absorbed by particles into heat. Dust acts like a thermal sponge. Bit by bit chaotic shock is converted into a thermal gradient. Over time galactic discs thermalise via adiabatic heating. Incrementally warming gas responds by incrementally expanding, carrying any massive object along with it.
via disc heating [see 1, 2, 3, 4 and a more traditional textbook exposition here].

Fig. 21: WR 23 is a Wolf-Rayet star near the Carina Nebula that has been ejecting massive bubbles of gas from its surface for approx. 10,000 years. The bubbles originate in convection zones deep in the star’s envelope and rise somewhat akin to steam bubbles in boiling water. When the bubbles reach the surface they eject large pistules (see this sim) which fragment into multiple shock fronts. The fronts flatten and slow on the leading edge as they encounter lessdense gas from earlier generations of bubbles. The gas immediately behind pushes into the decelerating leading edge, injecting energy density across a broadening front that becomes a thick bubble. See Toalá 2015 for an excellent review of WR nebula.

Since 2012 Christoph Federrath of the Australian National University has studied the effects of stellar outflow and protostellar jets as a key driver of the dynamics of star cluster evolution and gas distribution in the galactic disc. Federrath’s models have significantly advanced our understanding of the long-lived disruptive effects of stellar jets.
Fig. 22: from Federrath 2015 Figure 1: Column density projections at the end of four simulation models:
• Gravity only (top left)
• Gravity vs. Turbulence (top right)
• Gravity vs. Turbulence + Magnetic Fields (bottom left)
• Gravity vs. Turbulence + Magnetic Fields + Jet/Outflow Feedback (bottom right).
Each box models additional physical processes that resist gravitational collapse. The top right corner of each panel denotes the time it takes for small star clusters to reach a realistic 20% star forming efficiency (SFE). The duration to SFE 20% increases significantly for each box. The lower right box demonstrates that only the combined effects of gravity, turbulence, magnetic fields, and feedback can produces realistic SFRs.
 Fig. 23: Model of polar outflow
Fig. 24: The bilobed Homunculus Nebula suggests one transport path removing disc plane gas to the altitude of Galactic cirrus. Up till recently the Homunculus was interpreted as a mottled bipolar ejection nebula which erupted in 1843 from one of the three massive O supergiant stars in the η Carinae triplet system. In 2008, observations with the Mauna Kea Gemini South telescope and the Blanco telescopes in Chile traced η Car’s eruptive activity back to an imposter supernova blast a thousand years ago.
In this image the outermost flocculent gas clouds from that early blast wave are being overtaken by the expanding shell of η Carinae's 1843 eruption.
See an animated version of this still here. In the animation, the first image shows the original hot blue supergiant (technically a luminous blue variable) before the primordial eruption 1,000 years ago. In 1843, η Carinae produced the explosive outburst which generated the bilobed Homunculus Nebula, plus a faster shock wave propagating ahead of the Homunculus. The 1843 shock wave expanded through the interior of the 1000 year old shell in front of it. As is often the case with multiply erupting shells, younger, faster blast waves overtake the older shells. Such interactions produce a thermal shock lens. The 1843 outburst billowed into the well-known bilobed Homunculus Nebula. A faster highenergy, low-density shock wave propagated ahead of the slower gas-rich Homunculus.

Eventually, the faster blast wave overtook the older shell, producing a bright shock front seen in UV and x-ray that heated the older shell. If any Galactic dust clouds inhabited the region inside the shells shown here, they would have been both thermally and mechanically shocked by the onrushing shock waves. If the clouds were strongly enough bound to avoid disruption, they would have received a kick that pushed them further out into the then disc than normal disc heating may have transported them. The η Carinae event is just one of many shocks produced by the Galactic disc to push GC clouds ever higher into the disc.
The expedition took us longer than we expected, but here we are

Fig. 25: Approximate location of Magellan’s Ghost among the constellations of the South Polar region.
NOTE: There are scale differences between the map projections superimposed on one another. The sky chart above is spherical projection; the Planck images are Molleweide/Aitoff; the Chromoscope image sets used in this section are Cartesian projections. Some of the constellations look unnaturally warped due to scale-fitting to show the location of the Magellan’s Ghost feature.

Fig. 25: Approx. location of the Ghost against a Chromoscope projection of the Near IR sky. The green and red patches show warm dust in the 12 µm and 24 µm bands, respectively. Chromoscope is a multiband visualisation utility prepared by the Cardiff Univ. School of Astronomy and Physics Research. Chromoscope sliding-bar interface moves across images from Gamma to 408 Mhz radio. The image sets derive from the freely downloadable data from Fermi Gamma ray, ROSAT X-ray, DSS Optical (also used by Wikisky) WHAM-SHASSA-VTSS H-alpha; WISE Near IR; IRAS FIR; Planck Microwave (353-547-847 GHz; HI4PI neutral hydrogen (HI); and 75 cm radio from the Haslam 408 MHz survey by the Parkes 64 m telescope in Australia and Jodrell Bank 76 m dish in the UK.
Chromoscope


Fig. 26: Far infrared 100 µm emission from the IRAS satellite reveals cold dust between the stars. The brighter clumps are dense regions where stars are forming; the fainter continuum distributed across the sky is Galactic cirrus. Zodiacal light due to dust between the Earth and the Sun has been removed.
Fig. 27: A montage of microwave-band emission from the Planck satellite uses blue hues to designate submillimetre wavelengths emitted by cold dust. The pinkish glow is ≈1 mm light emitted by hot gas.


Figs 28: There is a noticeable shift in the direction of magnetic field lines in the Magellan’s Ghost region. Grains of interstellar dust tend to align their longest axis at right angles to the direction of the Galaxy’s magnetic field lines, partly polarising the light. Polarisation patterns enable astronomers to reconstruct the ambient magnetic field. In these two image sets the orientation of the magnetic field lines are indicated by texture lines across the image. Note: Images not exactly to scale due to original plate projection differences. Source: Planck Intermediate XX, Polarization thermal emission Fig. 3, A&A/astro-ph.

Fig. 29: The most significant unanswered question in these images is the proportion of carbonaceous to silicate particles in the overall dust mix. Carbonbased sooty dust has a an albedo of 5% to 9% from the composition of the molecules adhering to their surfaces, notably HII, which is made on carbonaceous dust grains. Silicate grains do not readily attract the simple molecules made in AGB stellar atmospheres, but they are dipolar and respond to the direction of a magnetic field. Their elongated flat, crystalline faces reflect more light if the polarisation angles are serendipitously placed for observers on Earth. We propose that this is the source of the slight enhancement that makes Magellan’s Ghost faintly visible to observers under very dark skies. Source: Composite overlay of Planck XIX Microwave 353-547-847 GHz bands.
Magellan’s Ghost is an aggregation of many small, wispy, dusty cirrus clumps ±240 light years away in the direction of Chameleon, Apus, and Octans. Each clump is a loosely bound mass of dust particles of two types: (a) carbonaceous aggregates with significant proportions of HII and PAH molecules on their surfaces, and (b) silicate particle conglomerates with HI, HII, and ice mantles frozen onto the grain surfaces. The striated, chaotic appearance seen in the multiband images and the Planck 353 GHz data are evidence of (a) rapidly spinning elongated dipolar silicate grains aligning their long axes perpendicular to magnetic field lines, (b) parallel KelvinHelmholtz waveform structures (Heyer et al., 2016), and (c) legacy pressure discontinuities from gas that rose with Rayleigh-Taylor instabilities and turbulent shock fronts originating near the Galactic disc (Kiss et al 2006). Fig. 30 to the right shows how Galactic disc light can reflect off magnetically aligned dust dipoles if they are aligned normal to the cloud’s magnetic field direction.
Dust clouds in the Galactic disc have been detected from the disc plane to as far 350 pc into the outer thin disc. Normally they are too faint to see visually. But in two regions of the sky, the Polaris Flare and Magellan’s Ghost, a fortuitous alignment of flat silicate dust particle surfaces at perpendicular angles to the ambient spiral disc’s magnetic ß-field create a shallow forescatter zone that reflects the integrated light of the Galactic disc located 18° to 23° above.
It is a lucky accident that a small portion of the forescattered IFN reaches our eyes on Earth — if those eyes happen to be in very dark skies and gazing in the right direction. The tiny enhancement of forescattered light we see provides just enough photons to brighten the cirrus to ±24.5 MPSAS, just above the luminosity limit of human eyes.
Fig. 30: Shadow image of Magellan’s Ghost overlain on the Planck 353 Ghz map of magnetic fields in the South Equatorial Polar region.. The colour scale is blue = feeble field strength, red-yellow = strongest. Source: Planck Legacy Archive.


Sherlock would indeed have been impressed by so circuitous a clue.
= Douglas Bullis = Weltevreden Farm Niew Bethesda, Karoo, South Africa