


When it comes to running a quick lube shop, ups and downs—and not just the vehicles on the lifts in your bays—are inevitable. From familiar guests hanging on to vehicles just a bit longer than in the past to new customers rolling in with newer cars that have more sophisticated needs, operators have to be ready for all comers. Successful operators are navigating challenges from product costs and staffing to facility upkeep and service offerings, all while keeping an eye on the future, many with the hopes of turning a single shop into a multisite network. How does your shop measure up? That’s where the annual NOLN Operator Survey, presented by Valvoline, comes in.
The respondents who participated in the 2025 edition speak from experience. More than half have been in the industry for more than 20 years. They are likely to offer full-service auto repairs beyond quick oil changes, running two to three bays (or, in some cases, many more). They know their customers—96% say more than half of their guests are repeat visitors.
We appreciate those who took the time to participate in this year’s installment to provide insight into their operations. We are excited to share our survey’s findings with you, our readers, and we hope the data provided here helps guide you toward becoming the industry’s next success story.
— Tom Valentino, Editor, National Oil and Lube News
As of December 31, 2024, there are 292.3 million vehicles on the road in the United States and Puerto Rico according to the Experian Automotive Marketing Trends Q4 2024 report. Meanwhile, drivers continue to hang onto their vehicles longer. The average age of vehicles in 2024 was a record 12.6 years, according to S&P Global Mobility. As we will see later in this report, however, drivers aren’t just holding onto their vehicles longer—they’re also going longer intervals between visits to their quick lube of choice. The findings put operators at an interesting crossroads: More older vehicles on the road means more potential customers. But how do you draw them in for service?
Before we dive into the findings from this year’s NOLN Operator Survey itself, let’s set the scene with some additional outside data relevant to the automotive aftermarket.
TOP ANTICIPATED CHALLENGES FOR INDEPENDENT REPAIR SHOPS IN 2025
According to a survey conducted by IMR in January 20.6%
Finding affordable parts 17.7%
Finding parts I need/ parts shortages 11.1%
Keeping overhead costs low/impact of economy 9.7%
Bringing customers back/ providing incentives 7.8% Finding qualified/ responsible technicians
688,840
National estimates for Automotive Service Technicians and Mechanics employment (as of May 2024):
SOURCE: U.S. BUREAU OF LABOR STATISTICS HTTPS://WWW.BLS.GOV/ OES/CURRENT/OES493023.HTM#ST
SOURCE: PTEN 2025 AFTERMARKET PROFILE
SOURCE: PTEN 2025 AFTERMARKET PROFILE
While the distribution of NOLN Operator Survey participants for 2025 was fairly even across the United States, the South once again had the largest portion of respondents, with just under 30%. Illinois and Texas were the states with the most participants, with 16 survey respondents each, and all 50 states were represented in this year’s survey. Three operators from Canada also took the survey.
In terms of the number of shops operators oversee, the survey received a wide range of responses. A majority (57.9%) of respondents are single-shop operators, but at the other end of the spectrum, 18% said they have 21 or more locations under their jurisdiction. Owners (63.9%) represented the largest segment of survey participants, followed by managers (20.5%), and employees who hold other titles within their shops. South: 29.8%
22.6%
25.0%
SALES BREAKDOWN
What percentage of your gross annual sales are comprised solely of quick maintenance services (45 minutes or less)?
26% 50% or less
10% 51% to 60%
4% 61% to 70%
9% 71% to 80%
12% 81% to 90%:
39% 91% to 100%
What percentage of your gross sales is used for:
Payroll
Lease/Mortgage
Cost of goods
Where do customers wait?
In their cars
In the waiting room
Customer choice (both available)
Everyday components of the average shop
Operators who use:
Digital coupon
Mailer/physical coupon
71.8%
Shops offer discount coupons or programs to customers
“What a Save!” Jan/Feb 2025

Whether it’s to connect with customers, offer promotions, or raise the profile of their stores, quick lube shops continue to grow their presence on social media. Facebook remains the platform of choice, as it is used by 83.3%. Despite facing a potential ban in the United States, TikTok has continued to rise in popularity. In 2025, TikTok usage has increased to 15.3% of survey respondents, up from 8% in 2023 and 11% in 2024. Snapchat, meanwhile, shows signs of waning interest. Just 2.8% of respondents reported using Snapchat to promote their business, down from 8% in 2024.
In terms of posting frequency, 32.4% operators say they are using the social media accounts weekly, and about a quarter (25.7%) say they are on social media daily. A little more than 1 in 10 (11.1%) of those surveyed say their businesses have no presence on any social media platform, down from 18% in 2024.
How often does your shop promote itself on social media?
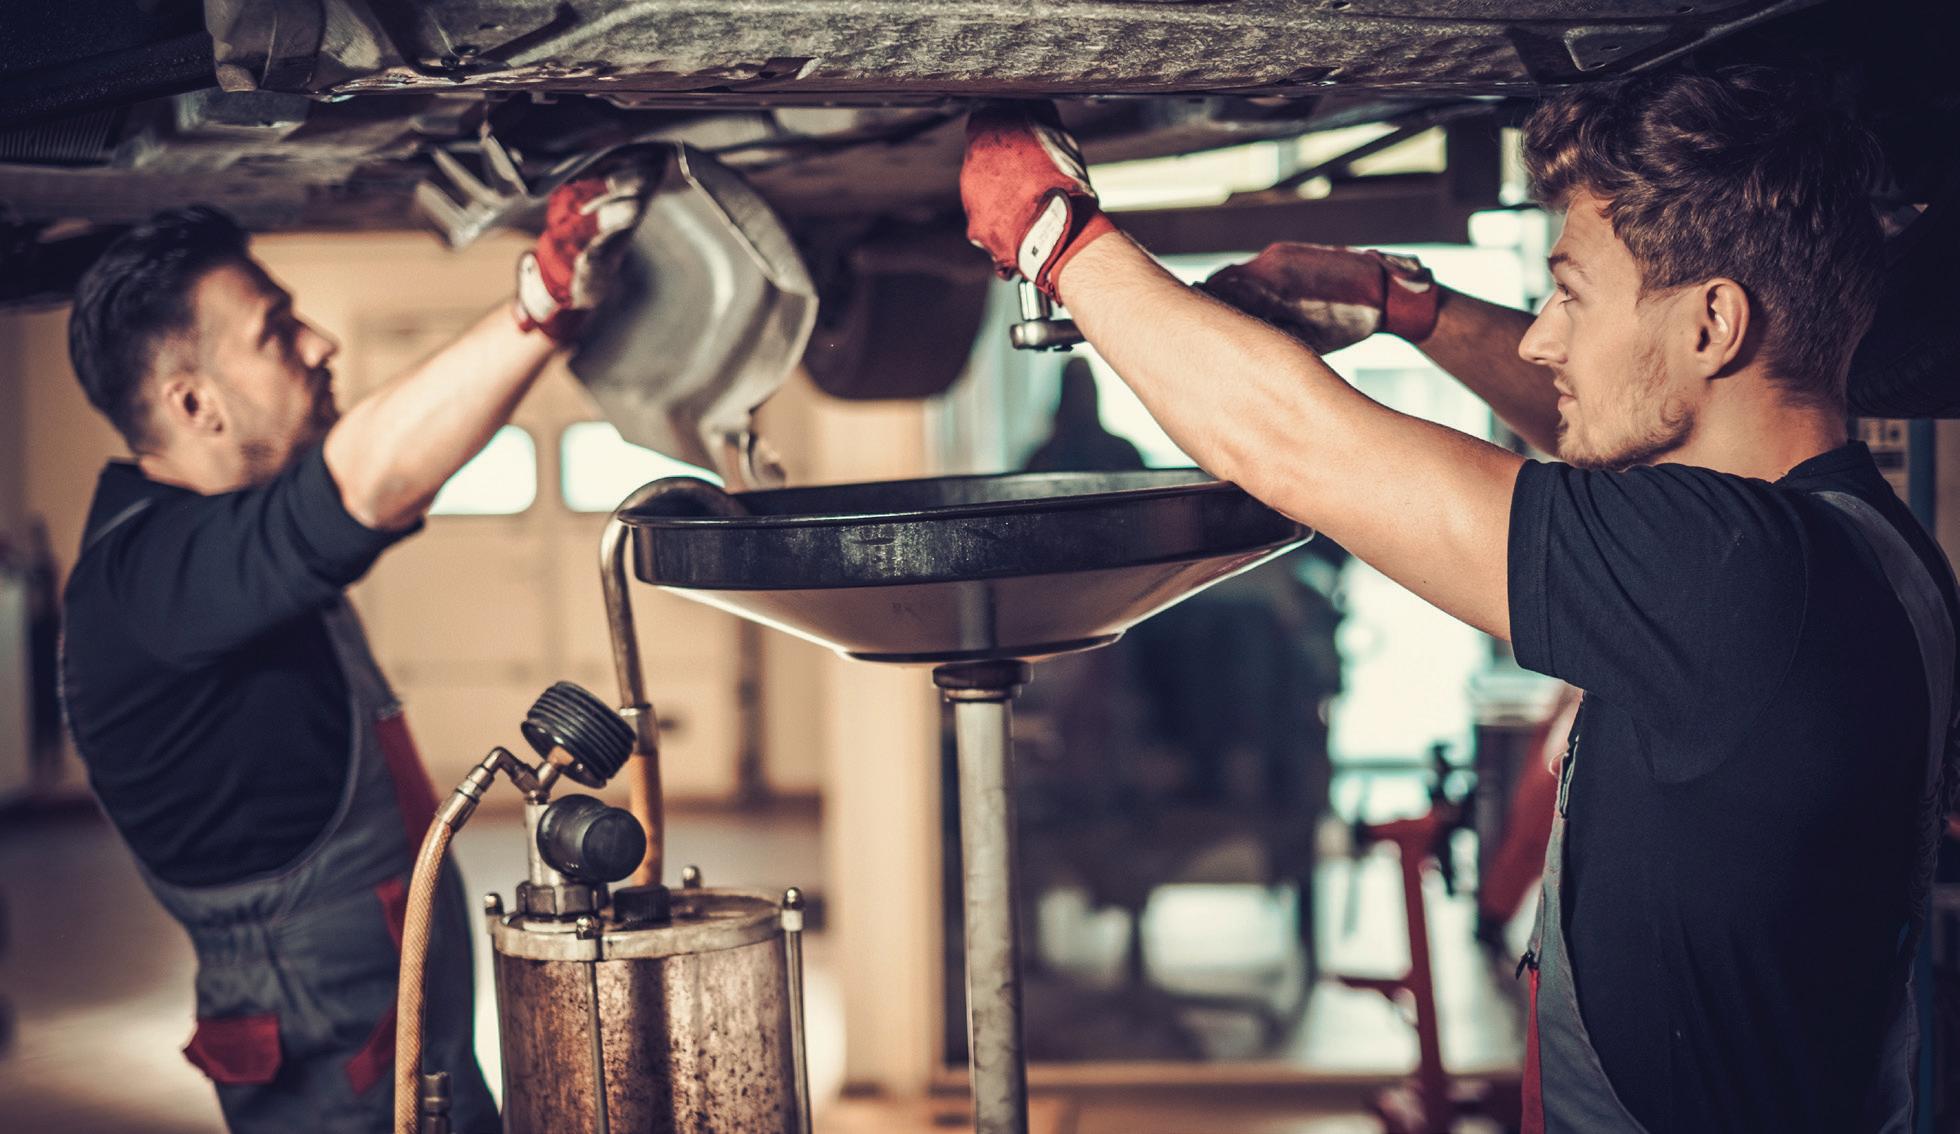
The industry representatives with boots on the ground
Shop visitors and their vehicles
2025 average is approximately
5,339
2025 average is approximately
91,938
75% of respondents reported that fleet customers make up
10 PERCENT of their business or less.
“Committed to Customers” July 2023
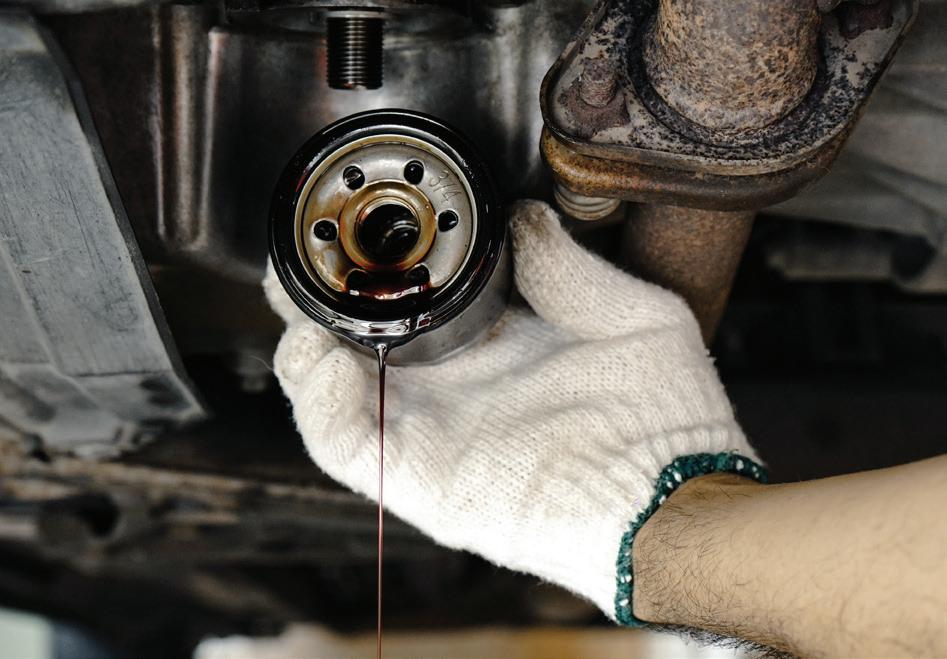
Evaluating the all-important vehicle lubricant
How much do you charge for a diesel oil change on a pickup truck or van?
DOLLARS¬ Under $100 11.3%
$100 to $109 8.5%
How much do you charge for a diesel oil change on a passenger car?
Does your shop use branded or unbranded oil?
How much do you charge for an oil change with high mileage oil?
to $79
Don’t offer 8.5%
Oil changes by SAE grade
OIL CHANGES BY SAE GRADE
NOLN asked survey respondents what percentage of oil changes utilize a particular grade. Here are the most popular answers.
0W-16: 1%-5% of all oil changes
0W-20: More than 50% of all oil changes
5W-20: 11% to 15% of all oil changes
5W-30: 21% to 30% of all oil changes
5W-40: 1%-5% of all oil changes
10W-30: 1%-5% of all oil changes
15W-40: 1%-5% of all oil changes
Oil changes by SAE grade
USED OIL PICKUP, OPERATORS ARE
If paid, 86.1% say it’s by the gallon 68.1% are not charged for used oil filter disposal
What shops offer—outside of oil changes
94.2%
94.2%
91.3%
91.3%
89.9%
89.9%
87.0%
84.1%
82.6%
73.9%
71.0%
71.0%
69.6%
68.1%
66.7%
65.2%
63.8%
60.9%
59.4%
59.4%
58.0%
56.5%
55.1%
55.1%
49.3%
44.9%
43.5%
40.6%
40.6%
39.1%
39.1%
37.7%
33.3%
Replace engine air filters
Replace cabin air filters
Sell conventional wiper blades
Sell beam wiper blades
Change differential fluid
Replace lights
Replace fuel filters
Check batteries
Sell batteries
Sell additives
Rotate tires
Mechanical ATF exchange
Replace serpentine belts
Manual ATF exchange
Offer pour-in fuel injection cleaner additive
Offer power steering flushes
Offer multi-part fuel system cleaning
Sell chemical engine flush/oil system cleaner additive
Mechanical full-block coolant flush
Perform minor mechanical repairs
Replaces brake pads and shoes
Perform brake flushes
Balance wheels
Replace shocks and/or struts
Sell tires
Offer headlight restoration
Offer a diesel fuel supplement/cleaner additive
Offer a coolant treatment additive
Align wheels
Offer a gear oil supplement additive
Sell ATF supplement additives
Offer a power steering treatment additive
Offer an oil stop leak additive 26.1%
Offer a transmission stop leak additive 26.1%
24.6%
11.6%
Offer smog checks/emissions tests/state certifications
Offer a coolant stop leak additive
Repair rock chips in windshields
Filtering ticket averages, shop statuses, car counts, and bay time responses by region
Midwest Northeast South West
Beyond checking in with operators to see the current state of their quick lube shops, NOLN also has an eye on the future. To conclude the 2025 NOLN Operator Survey, we once again asked respondents about the biggest challenges standing in their way, as well as their appetite for making investments in their business in the coming years. While more than 3 out of 4 operators say they aren’t looking to make a significant investment in the next 12 months, the biggest priorities for those who are planning to make a splash are purchasing new locations (23.9%) and employee training (22.4%).
55.9%
Hiring/availability of labor
32.4% Cost of products 22.1%
While hiring and availability of labor and uncertainty over the cost of goods remain the most common concerns among operators, 22.1% of respondents this year pointed to customers extending the intervals between their service visits, a significant year-over-year increase. WHAT’S HIGHEST
Extended service intervals 11.8% Market saturation 10.3% Shop upkeep
10.3%
Electrification of vehicles
5.9% Specialty oil availability
8.8% Other
*In this section, some of the challenges mentioned by respondents included consolidation, advanced electronics, and the elimination/potential elimination of emissions testing programs.
When asked to list the new service, coolant exchange, ADAS calibration, and brakes were among offerings mentioned by multiple respondents.